
Us Lubricant Market
Market Size in USD Billion
 USD
22.86 Billion
USD
28.91 Billion
2024
2032
USD
22.86 Billion
USD
28.91 Billion
2024
2032
| 2025 - 2032 | |
| USD 22.86 Billion | |
| USD 28.91 Billion | |
| % | |
|
U.S. Lubricant Market Size
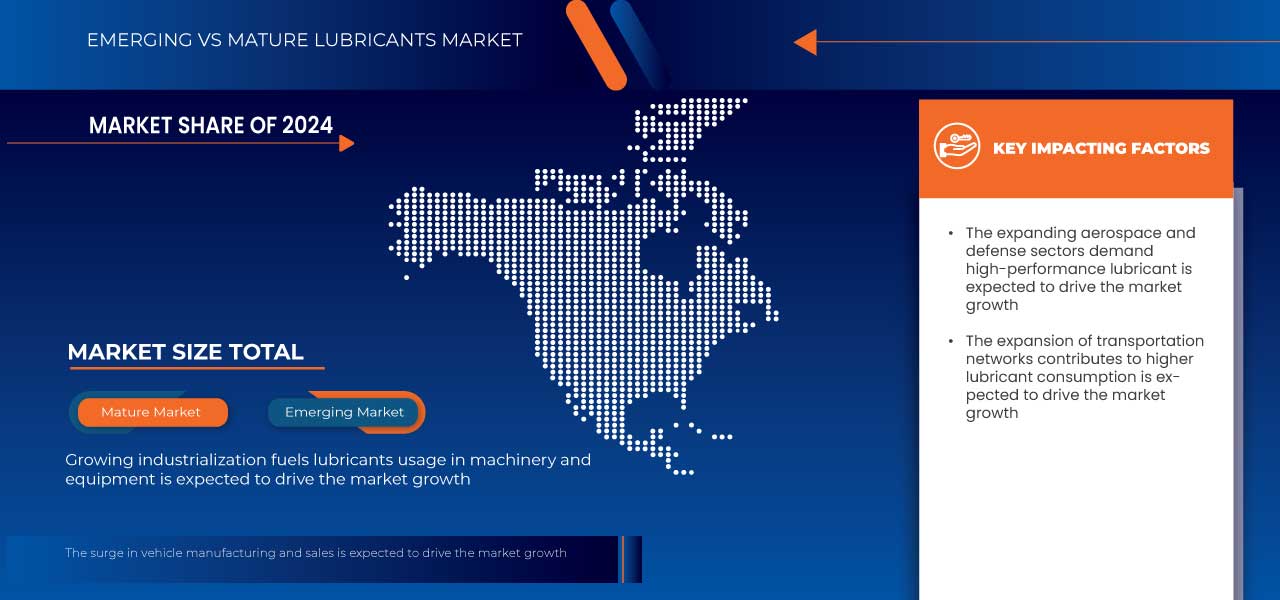
- The U.S. lubricant market was valued at USD 22.86 billion in 2024 and is expected to reach USD 28.91 billion by 2032
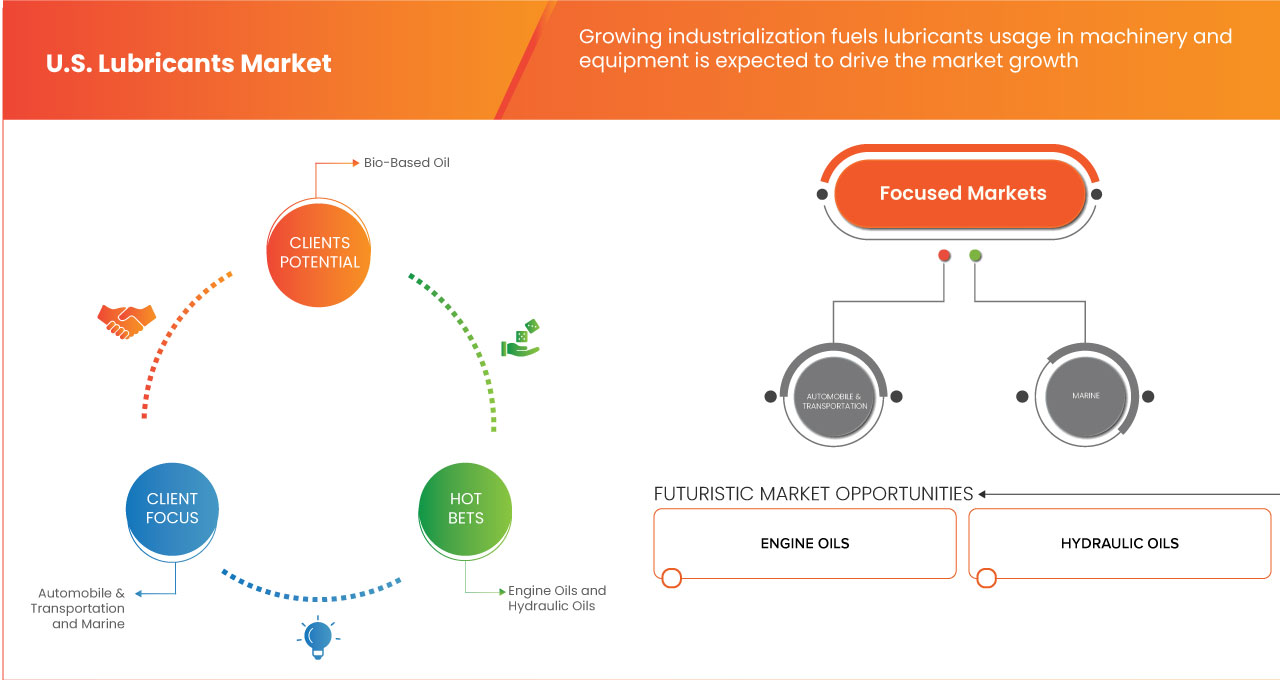
- During the forecast period of 2025 to 2032 the market is likely to grow at a CAGR of 3.01%, primarily driven by the growing industrialization is a pivotal driver for the market
U.S. Lubricant Market Analysis
- The U.S. lubricant market is experiencing steady growth, driven by increasing demand from the automotive and industrial sectors. Lubricants play a critical role in reducing friction, enhancing efficiency, and extending the lifespan of machinery and engines. The market includes various types of products such as engine oils, hydraulic oils, greases, and metalworking fluids, which serve industries like manufacturing, construction, marine, and agriculture. Synthetic and bio-based lubricants are gaining popularity due to their superior performance and environmental benefits. Despite challenges like fluctuating raw material prices and the rise of electric vehicles, the market offers opportunities for innovation, particularly in developing specialized and sustainable lubricants to meet evolving industry needs
Report Scope and U.S. Lubricant Market Segmentation
|
Attributes |
U.S. Lubricant Key Market Insights |
|
Segments Covered |
|
|
Countries Covered |
North America
|
|
Key Market Players |
|
|
Market Opportunities |
|
|
Value Added Data Infosets |
In addition to the insights on market scenarios such as market value, growth rate, segmentation, geographical coverage, and major players, the market reports curated by the Data Bridge Market Research also include import export analysis, production capacity overview, production consumption analysis, price trend analysis, climate change scenario, supply chain analysis, value chain analysis, raw material/consumables overview, vendor selection criteria, PESTLE Analysis, Porter Analysis, and regulatory framework. |
U.S. Lubricant Market Trends
“Rising Demand for Synthetic and High-Performance Lubricants”
The demand for synthetic and high-performance lubricants is growing rapidly across various industries due to their superior properties compared to conventional mineral-based oils. Synthetic lubricants, formulated using advanced chemical processes, offer better thermal stability, oxidation resistance, and longer drain intervals, making them ideal for applications where high performance is essential. These lubricants provide consistent protection under extreme temperatures, reduce friction, and prevent the buildup of harmful deposits, thereby extending the lifespan of engines and machinery. In the automotive sector, synthetic lubricants are increasingly used in modern internal combustion engines (ICEs) to improve fuel efficiency, reduce emissions, and enhance engine durability. High-performance engine oils such as Shell Helix Ultra and Castrol EDGE utilize synthetic technology to offer superior protection and cleaner engine operation.
U.S. Lubricant Market Dynamics
Driver
“The Expansion of Transportation Networks Contributes to Higher Lubricant Consumption”
The expansion of transportation networks is a compelling driver for the market, exerting a substantial influence on lubricant consumption. This driver encompasses a wide spectrum of factors that highlight the intricate relationship between transportation infrastructure development and the demand for lubricants. Road Network Growth - One of the most prominent aspects of transportation expansion is the development and maintenance of road networks. The construction and upkeep of highways, roads, and streets require a vast array of vehicles and machinery, all of which rely heavily on lubricants for efficient operation. From bulldozers to asphalt pavers, lubricants play a pivotal role in the construction and maintenance of road infrastructure. Fleet Expansion - The proliferation of transportation services, including freight and passenger vehicles, necessitates a growing fleet of automobiles and trucks. These vehicles depend on lubricants to reduce friction, minimize wear and tear, and optimize fuel efficiency. The larger the transportation fleet, the higher the demand for lubricants in regular maintenance and operations.
For instance,
In May 2023, as per Forbes High-speed rail is finally gaining momentum in the U.S., with federal funding allocated to Amtrak's Northeast Corridor and potential projects in California and Las Vegas-to-L.A. decision-making on these projects is expected in the coming months, signaling a shift towards modernizing passenger rail infrastructure.
Opportunity
“Escalating demand for sustainable and bio-based lubricants”
The escalating demand for sustainable and bio-based lubricants presents a significant opportunity for the market. Industries and consumers are actively seeking lubricant solutions that are not only effective but also environmentally friendly as environmental concerns continue to gain momentum. This shift in demand has opened up several avenues for growth and innovation within the lubricants industry. One of the key opportunities lies in the development and production of bio-based lubricants. These lubricants are derived from renewable resources such as plant oils, animal fats, and even microbial sources. Unlike traditional mineral oil-based lubricants, bio-based lubricants have the advantage of being biodegradable and less harmful to the environment. They also offer improved biodegradability and reduced toxicity, making them a preferred choice in applications where environmental impact is a concern.
For instance,
- In the article by STLE org, Biobased lubricants, such as soy-based hydraulic fluid and vegetable oil-derived additives, show promise in various applications, from elevators to farm equipment. They offer advantages such as biodegradability, lower toxicity, and enhanced lubricity, though challenges such as poor oxidation stability and high pour points persist. Innovations aim to overcome these limitations, making biobased lubricants competitive with synthetic counterparts. Recycling remains a challenge, with mixed opinions on its feasibility
Restraint/Challenge
“Resistance to Switching from Conventional Lubricants to More Expensive Alternatives”
Resistance to switching from conventional lubricants to more expensive alternatives poses a significant challenge for the market. While newer, advanced lubricants offer numerous benefits, including improved performance and environmental advantages, the reluctance of customers to adopt these products hinders market growth. Here are key points highlighting this challenge: Cost Concerns One of the primary reasons for resistance is the perceived higher cost of advanced lubricants compared to conventional ones. Customers often prioritize short-term cost savings over long-term benefits, leading them to stick with familiar, cheaper options. Lack of Awareness - Many customers are unaware of the advantages offered by advanced lubricants. They may not fully understand how these products can enhance equipment efficiency, reduce maintenance costs, and extend machinery lifespan. Education and awareness campaigns are essential to address this knowledge gap.
U.S. Lubricant Market Scope
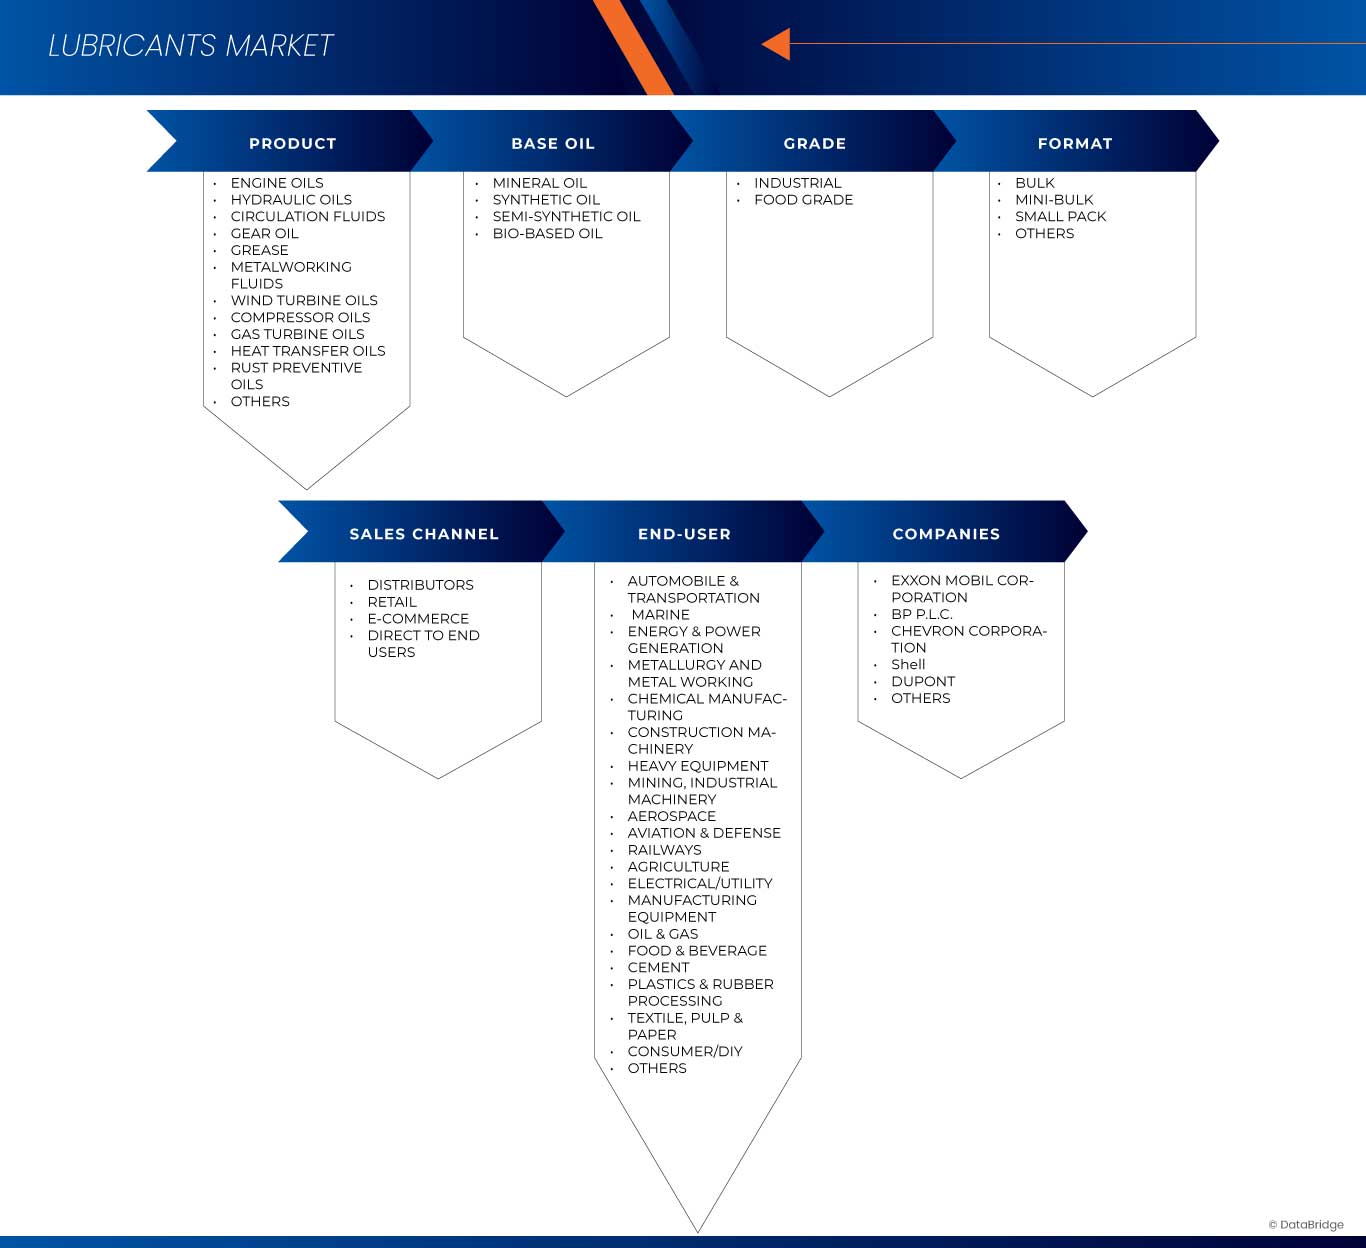
The market is segmented on the basis of product, base oil, grade, format, sales channel, and end-use.
|
Segmentation |
Sub-Segmentation |
|
By Product Type |
BY PRODUCT
|
|
By Base Oil |
BY BASE OIL
|
|
By Grade Oil |
BY Grade
|
|
By Format
|
BY Format
|
|
By Sales Channel |
BY SALES CHANNEL
|
|
By End Use |
|
U.S. Lubricant Market Regional Analysis
U.S. Lubricant Market Share
The market competitive landscape provides details by competitor. Details included are company overview, company financials, revenue generated, market potential, investment in research and development, new market initiatives, global presence, production sites and facilities, production capacities, company strengths and weaknesses, product launch, product width and breadth, application dominance. The above data points provided are only related to the companies' focus related to market.
The Major Market Leaders Operating in the Market Are:
- Shell (United Kingdom)
- Exxon Mobil Corporation (U.S.)
- FUCHS (Germany)
- U.S. Venture, Inc. (Germany)
- BASF SE (U.S.)
- BP p.l.c. (Germany)
- Chevron Corporation (United Kingdom)
- DuPont de Nemours, Inc. (U.S.)
Latest Developments in U.S. Lubricant Market
- In May 2024, Exxon Mobil Corporation announced the completion of its acquisition of Pioneer Natural Resources, significantly expanding its Permian footprint. This merger enhances ExxonMobil's production capacity to 1.3 million barrels of oil equivalent per day, with plans to reach approximately 2 million by 2027. The partnership aims to improve efficiency and reduce environmental impact while advancing a net-zero goal to 2035
- In November 2023, ExxonMobil Corporation announced the completion of its acquisition of Denbury Inc. for USD 4.9 billion in an all-stock transaction. This move strengthened ExxonMobil's Low Carbon Solutions business, expanding its CO2 pipeline network by over 1,300 miles. The acquisition included oil and gas operations with proved reserves of more than 200 million barrels, aimed at significantly reducing CO2 emissions
- In October 2023, ExxonMobil announced its merger with Pioneer Natural Resources in a USD 59.5 billion all-stock transaction. The agreement allowed Pioneer shareholders to receive shares of ExxonMobil. The merger doubled ExxonMobil’s Permian footprint, combining over 850,000 net acres from Pioneer with its own, estimated to yield 16 billion barrels of oil equivalent. ExxonMobil planned to accelerate Pioneer’s net zero goal from 2050 to 2035
- In June 2023, ExxonMobil signed a carbon capture agreement with Nucor Corporation, enabling the capture, transport, and storage of up to 800,000 metric tons of CO2 annually from Nucor's Convent, Louisiana site. This marked a milestone, bringing total CO2 agreements to 5 million metric tons per year. The project, set to start in 2026, supports Louisiana's net-zero emissions goal by 2050
- In September 2024, Chevron Corporation marks 70 years of partnership in Angola, highlighting significant contributions to the nation’s development and energy sector. The collaboration has fostered economic growth, job creation, and investment in local communities. For Chevron, this enduring relationship strengthens its position in Africa and reinforces its commitment to sustainable practices while enhancing its operational footprint in the region
SKU-

- Interactive Data Analysis Dashboard
- Company Analysis Dashboard for high growth potential opportunities
- Research Analyst Access for customization & queries
- Competitor Analysis with Interactive dashboard
- Latest News, Updates & Trend analysis
- Harness the Power of Benchmark Analysis for Comprehensive Competitor Tracking
Table of Content
1 INTRODUCTION
1.1 OBJECTIVES OF THE STUDY
1.2 MARKET DEFINITION
1.3 OVERVIEW OF THE U.S. LUBRICANTS MARKET
1.4 LIMITATIONS
1.5 MARKETS COVERED
2 MARKET SEGMENTATION
2.1 MARKETS COVERED
2.2 GEOGRAPHICAL SCOPE
2.3 YEARS CONSIDERED FOR THE STUDY
2.4 CURRENCY AND PRICING
2.5 DBMR TRIPOD DATA VALIDATION MODEL
2.6 MULTIVARIATE MODELLING
2.7 PRIMARY INTERVIEWS WITH KEY OPINION LEADERS
2.8 DBMR MARKET POSITION GRID
2.9 MARKET END-USE COVERAGE GRID
2.1 SECONDARY SOURCES
2.11 ASSUMPTIONS
3 EXECUTIVE SUMMARY
4 PREMIUM INSIGHTS
4.1 PESTEL ANALYSIS
4.1.1 POLITICAL FACTORS
4.1.2 ECONOMIC FACTORS
4.1.3 SOCIAL FACTORS
4.1.4 TECHNOLOGICAL FACTORS
4.1.5 ENVIRONMENTAL FACTORS
4.1.6 LEGAL FACTORS
4.1.7 CONCLUSION
4.2 PORTER’S FIVE FORCES ANALYSIS
4.2.1 THREAT OF NEW ENTRANTS
4.2.2 BARGAINING POWER OF SUPPLIERS
4.2.3 BARGAINING POWER OF BUYERS
4.2.4 THREAT OF SUBSTITUTE PRODUCTS
4.2.5 INDUSTRY RIVALRY
4.2.6 CONCLUSION
4.3 IMPORT EXPORT SCENARIO
4.4 CLIMATE CHANGE SCENARIO
4.4.1 ENVIRONMENTAL CONCERNS
4.4.1.1 CARBON EMISSIONS FROM PRODUCTION
4.4.1.2 NON-RENEWABLE RESOURCE DEPLETION
4.4.1.3 WATER AND AIR POLLUTION
4.4.2 INDUSTRY RESPONSE
4.4.2.1 DEVELOPMENT OF BIO-BASED AND SYNTHETIC LUBRICANTS
4.4.2.2 RECYCLING AND RE-REFINING INITIATIVES
4.4.2.3 ENERGY EFFICIENCY IMPROVEMENTS
4.4.3 GOVERNMENT’S ROLE
4.4.3.1 REGULATIONS AND ENVIRONMENTAL STANDARDS
4.4.3.2 INCENTIVES FOR SUSTAINABLE PRODUCTS
4.4.3.3 PROMOTING PUBLIC-PRIVATE PARTNERSHIPS
4.4.4 ANALYST RECOMMENDATIONS
4.4.4.1 INVEST IN SUSTAINABLE PRODUCT DEVELOPMENT
4.4.4.2 ENHANCE RECYCLING AND RE-REFINING CAPABILITIES
4.4.4.3 COLLABORATE WITH REGULATORS AND INDUSTRY PEERS
4.4.4.4 LEVERAGE GOVERNMENT INCENTIVES
4.4.5 CONCLUSION
4.5 RAW MATERIAL COVERAGE
4.5.1 BASE OILS: THE BACKBONE OF LUBRICANTS
4.5.1.1 SUPPLY CHAIN DYNAMICS OF BASE OILS
4.5.2 ADDITIVES: ENHANCING LUBRICANT PERFORMANCE
4.5.2.1 SUPPLY CHAIN CHALLENGES FOR ADDITIVES
4.5.3 SPECIALTY CHEMICALS: TAILORING LUBRICANT PROPERTIES
4.5.3.1 SUPPLY AND INNOVATION IN SPECIALTY CHEMICALS
4.5.4 REGULATORY AND ENVIRONMENTAL CONSIDERATIONS
4.5.5 CONCLUSION
4.6 SUPPLY CHAIN ANALYSIS
4.6.1 OVERVIEW OF THE U.S. LUBRICANTS MARKET SUPPLY CHAIN
4.6.1.1 SUPPLY CHAIN CHALLENGES:
4.6.2 LOGISTICS COST SCENARIO
4.6.2.1 TRANSPORTATION COSTS
4.6.2.2 WAREHOUSING AND STORAGE COSTS
4.6.2.3 HANDLING AND PACKAGING COSTS
4.6.3 IMPORTANCE OF LOGISTICS SERVICE PROVIDERS
4.6.3.1 TRANSPORTATION MANAGEMENT
4.6.3.2 WAREHOUSING AND DISTRIBUTION SERVICES
4.6.3.3 REGULATORY AND COMPLIANCE EXPERTISE
4.6.4 CONCLUSION
4.7 TECHNOLOGY ADVANCEMENTS BY MANUFACTURERS
4.7.1 ADVANCED FORMULATIONS
4.7.2 ADDITIVE TECHNOLOGIES
4.7.3 IMPROVED PRODUCTION PROCESSES
4.7.4 DIGITAL INTEGRATION AND INDUSTRY 4.0
4.7.5 CONCLUSION
4.8 VENDOR SELECTION CRITERIA
4.8.1 QUALITY AND CONSISTENCY OF PRODUCTS
4.8.2 PRICING AND COST COMPETITIVENESS
4.8.3 SUPPLY CHAIN RELIABILITY AND LOGISTICS
4.8.4 REGULATORY COMPLIANCE AND ENVIRONMENTAL STANDARDS
4.8.5 TECHNICAL SUPPORT AND INNOVATION
4.8.6 CONCLUSION
5 REGULATION COVERAGE
5.1 OVERVIEW
5.2 CONCLUSION
6 MARKET OVERVIEW
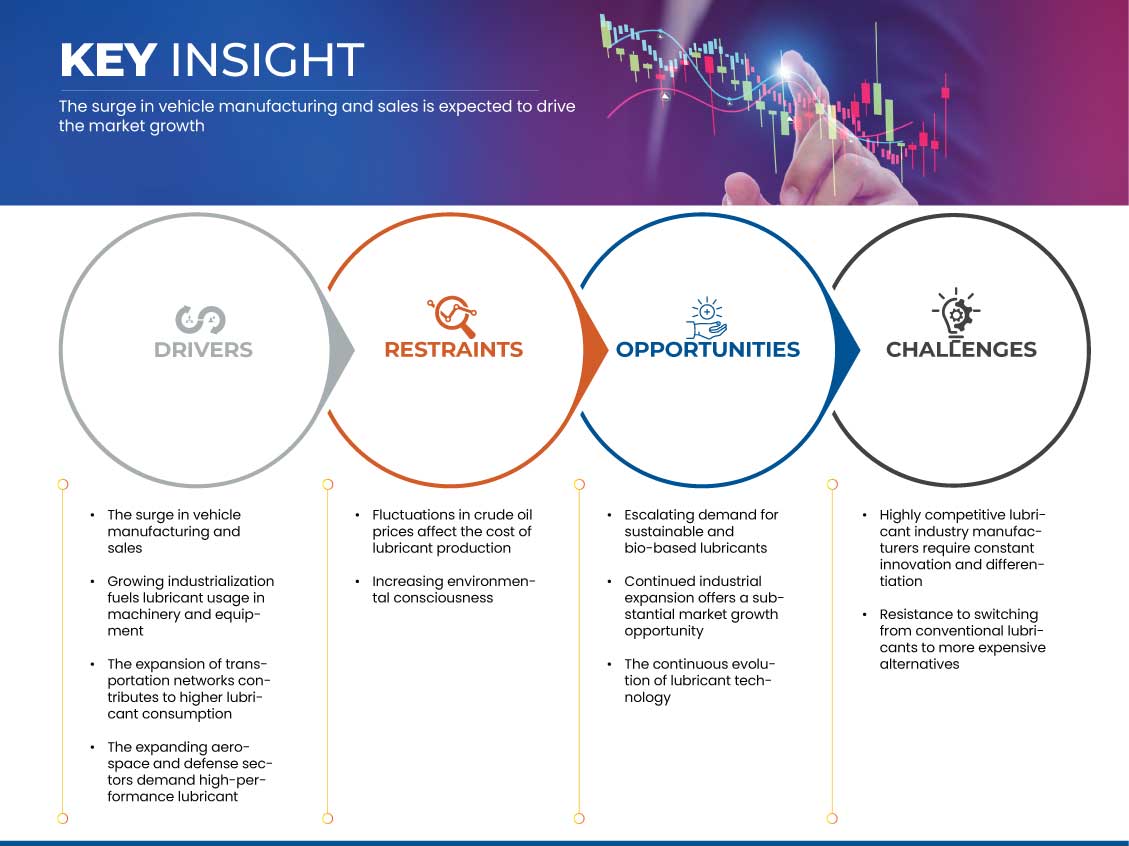
6.1 DRIVERS
6.1.1 THE SURGE IN VEHICLE MANUFACTURING AND SALES
6.1.2 GROWING INDUSTRIALIZATION FUELS LUBRICANT USAGE IN MACHINERY AND EQUIPMENT
6.1.3 THE EXPANSION OF TRANSPORTATION NETWORKS CONTRIBUTES TO HIGHER LUBRICANT CONSUMPTION
6.1.4 THE EXPANDING AEROSPACE AND DEFENSE SECTORS DEMAND HIGH-PERFORMANCE LUBRICANT
6.2 RESTRAINTS
6.2.1 FLUCTUATIONS IN CRUDE OIL PRICES AFFECT THE COST OF LUBRICANT PRODUCTION
6.2.2 INCREASING ENVIRONMENTAL CONSCIOUSNESS
6.3 OPPORTUNITIES
6.3.1 ESCALATING DEMAND FOR SUSTAINABLE AND BIO-BASED LUBRICANTS
6.3.2 CONTINUED INDUSTRIAL EXPANSION OFFERS A SUBSTANTIAL MARKET GROWTH OPPORTUNITY
6.3.3 THE CONTINUOUS EVOLUTION OF LUBRICANT TECHNOLOGY
6.4 CHALLENGES
6.4.1 HIGHLY COMPETITIVE LUBRICANT INDUSTRY MANUFACTURERS REQUIRE CONSTANT INNOVATION AND DIFFERENTIATION
6.4.2 RESISTANCE TO SWITCHING FROM CONVENTIONAL LUBRICANTS TO MORE EXPENSIVE ALTERNATIVES
7 U.S. LUBRICANTS MARKET, BY PRODUCT
7.1 OVERVIEW
7.2 ENGINE OILS
7.2.1 ENGINE OILS, BY BASE OIL
7.2.1.1 MINERAL OILS, BY TYPE
7.2.1.2 SYNTHETIC OILS, BY TYPE
7.2.2 ENGINE OILS, BY GRADE
7.2.3 ENGINE OILS, BY CATEGORY
7.3 HYDRAULIC OILS
7.3.1 HYDRAULIC OILS, BY BASE OIL
7.3.1.1 MINERAL OIL, BY TYPE
7.3.1.2 SYNTHETIC OILS, BY TYPE
7.3.2 HYDRAULIC OILS, BY GRADE
7.4 CIRCULATION FLUIDS
7.4.1 CIRCULATION FLUIDS, BY BASE OIL
7.4.1.1 MINERAL OILS, BY TYPE
7.4.2 SYNTHETIC OILS, BY TYPE
7.4.3 CIRCULATION FLUIDS, BY GRADE
7.5 GEAR OIL
7.5.1 GEAR OILS, BY BASE OIL
7.5.1.1 MINERAL OILS, BY TYPE
7.5.1.2 SYNTHETIC OILS, BY TYPE
7.5.2 GEAR OILS, BY GRADE
7.6 GREASE
7.6.1 GREASE, BY TYPE
7.6.2 GREASE, BY BASE OIL
7.6.3 MINERAL OILS, BY TYPE
7.6.4 SYNTHETIC OILS, BY TYPE
7.6.5 GREASE, BY GRADE
7.7 METALWORKING FLUIDS
7.7.1 METALWORKING FLUIDS, BY BASE OIL
7.7.2 MINERAL OILS, BY TYPE
7.7.3 SYNTHETIC OILS, BY TYPE
7.7.4 METALWORKING FLUIDS, BY GRADE
7.8 WIND TURBINE OILS
7.8.1 WIND TURBINE OILS, BY BASE OIL
7.8.2 MINERAL OILS, BY TYPE
7.8.3 SYNTHETIC OILS, BY TYPE
7.8.4 WIND TURBINE OILS, BY GRADE
7.9 COMPRESSOR OILS
7.9.1 COMPRESSOR OILS, BY BASE OIL
7.9.2 MINERAL OILS, BY TYPE
7.9.3 SYNTHETIC OILS, BY TYPE
7.9.4 COMPRESSOR OILS, BY GRADE
7.1 GAS TURBINE OILS
7.10.1 GAS TURBINE OILS, BY BASE OIL
7.10.2 MINERAL OILS, BY TYPE
7.10.3 SYNTHETIC OILS, BY TYPE
7.10.4 GAS TURBINE OILS, BY GRADE
7.11 HEAT TRANSFER OILS
7.11.1 HEAT TRANSFER OILS, BY BASE OIL
7.11.2 MINERAL OILS, BY TYPE
7.11.3 SYNTHETIC OILS, BY TYPE
7.11.4 HEAT TRANSFER OILS, BY GRADE
7.12 RUST PREVENTIVE OILS
7.12.1 RUST PREVENTIVE OILS, BY BASE OIL
7.12.2 MINERAL OILS, BY TYPE
7.12.3 SYNTHETIC OILS, BY TYPE
7.12.4 RUST PREVENTIVE OILS, BY GRADE
7.13 PENETRANTS
7.13.1 PENETRANTS, BY BASE OIL
7.13.2 MINERAL OILS, BY TYPE
7.13.3 SYNTHETIC OILS, BY TYPE
7.13.4 PENETRANTS, BY GRADE
7.14 OTHERS
7.14.1 OTHERS, BY BASE OIL
7.14.2 MINERAL OILS, BY TYPE
7.14.3 SYNTHETIC OILS, BY TYPE
7.14.4 OTHERS, BY GRADE
8 U.S. LUBRICANTS MARKET, BY BASE OIL
8.1 OVERVIEW
8.2 MINERAL OIL
8.2.1 MINERAL OILS, BY TYPE
8.3 SYNTHETIC OILS
8.3.1 SYNTHETIC OILS, BY TYPE
8.4 SEMI-SYNTHETIC OIL
8.5 BIO-BASED OIL
9 U.S. LUBRICANTS MARKET, BY GRADE
9.1 OVERVIEW
9.2 INDUSTRIAL
9.3 FOOD GRADE
10 U.S. LUBRICANTS MARKET, BY FORMAT
10.1 OVERVIEW
10.2 BULK
10.3 MINI-BULK
10.4 SMALL PACK
10.5 OTHERS
11 U.S. LUBRICANTS MARKET, BY SALES CHANNEL
11.1 OVERVIEW
11.2 DISTRIBUTORS
11.3 RETAIL
11.4 E-COMMERCE
11.5 DIRECT TO END USERS
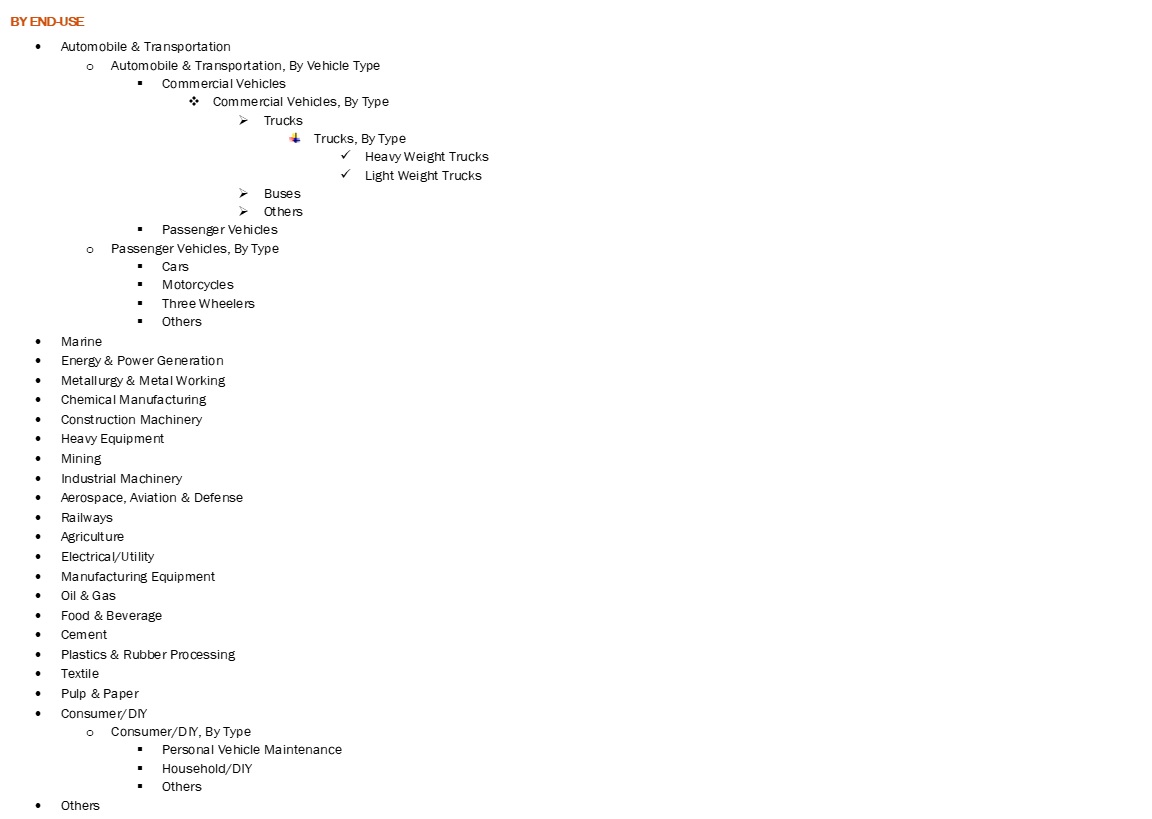
12 U.S. LUBRICANTS MARKET, BY END-USE
12.1 OVERVIEW
12.2 AUTOMOBILE & TRANSPORTATION
12.2.1 AUTOMOBILE & TRANSPORTATION, BY VEHICLE TYPE
12.2.1.1 COMMERCIAL VEHICLE, BY TYPE
12.2.2 TRUCK, BY TYPE
12.2.2.1 PASSENGER VEHICLE, BY TYPE
12.3 MARINE
12.4 ENERGY & POWER GENERATION
12.5 METALLURGY & METAL WORKING
12.6 CHEMICAL MANUFACTURING
12.7 CONSTRUCTION MACHINERY
12.8 HEAVY EQUIPMENT
12.9 MINING
12.1 INDUSTRIAL MACHINERY
12.11 AEROSPACE, AVIATION & DEFENSE
12.12 RAILWAYS
12.13 AGRICULTURE
12.14 ELECTRICAL/UTILITY
12.15 MANUFACTURING EQUIPMENT
12.16 OIL & GAS
12.17 FOOD & BEVERAGE
12.18 CEMENT
12.19 PLASTICS & RUBBER PROCESSING
12.2 TEXTILE
12.21 PULP & PAPER
12.22 CONSUMER/DIY
12.22.1 CONSUMER/DIY, BY TYPE
12.23 OTHERS
13 U.S. LUBRICANTS MARKET: COMPANY LANDSCAPE
13.1 COMPANY SHARE ANALYSIS: U.S.
14 SWOT ANALYSIS
15 COMPANY PROFILES
15.1 EXXON MOBIL CORPORATION
15.1.1 COMPANY SNAPSHOT
15.1.2 REVENUE ANALYSIS
15.1.3 PRODUCT PORTFOLIO
15.1.4 RECENT DEVELOPMENTS
15.2 BP P.L.C.
15.2.1 COMPANY SNAPSHOT
15.2.2 REVENUE ANALYSIS
15.2.3 PRODUCT PORTFOLIO
15.2.4 RECENT DEVELOPMENT
15.3 CHEVRON CORPORATION
15.3.1 COMPANY SNAPSHOT
15.3.2 REVENUE ANALYSIS
15.3.3 PRODUCT PORTFOLIO
15.3.4 RECENT DEVELOPMENT
15.4 SHELL
15.4.1 COMPANY SNAPSHOT
15.4.2 REVENUE ANALYSIS
15.4.3 PRODUCT PORTFOLIO
15.4.4 RECENT DEVELOPMENTS
15.5 DUPONT
15.5.1 COMPANY SNAPSHOT
15.5.2 REVENUE ANALYSIS
15.5.3 PRODUCT PORTFOLIO
15.5.4 RECENT DEVELOPMENT
15.6 AMSOIL INC.
15.6.1 COMPANY SNAPSHOT
15.6.2 PRODUCT PORTFOLIO
15.6.3 RECENT DEVELOPMENT
15.7 BASF
15.7.1 COMPANY SNAPSHOT
15.7.2 REVENUE ANALYSIS
15.7.3 PRODUCT PORTFOLIO
15.7.4 RECENT DEVELOPMENTS
15.8 CASTROL LIMITED
15.8.1 COMPANY SNAPSHOT
15.8.2 PRODUCT PORTFOLIO
15.8.3 RECENT DEVELOPMENT
15.9 D-A LUBRICANT COMPANY
15.9.1 COMPANY SNAPSHOT
15.9.2 PRODUCT PORTFOLIO
15.9.3 RECENT DEVELOPMENT
15.1 DURA LUBE
15.10.1 COMPANY SNAPSHOT
15.10.2 PRODUCT PORTFOLIO
15.10.3 RECENT DEVELOPMENT
15.11 ENEOS CORPORATION
15.11.1 COMPANY SNAPSHOT
15.11.2 REVENUE ANALYSIS
15.11.3 PRODUCT PORTFOLIO
15.11.4 RECENT DEVELOPMENT
15.12 FUCHS
15.12.1 COMPANY SNAPSHOT
15.12.2 REVENUE ANALYSIS
15.12.3 PRODUCT PORTFOLIO
15.12.4 RECENT DEVELOPMENT
15.13 IDEMITSU KOSAN CO., LTD.
15.13.1 COMPANY SNAPSHOT
15.13.2 1.1.6 PRODUCT PORTFOLIO
15.13.3 RECENT DEVELOPMENT
15.14 INTERFLON USA, INC.
15.14.1 COMPANY SNAPSHOT
15.14.2 PRODUCT PORTFOLIO
15.14.3 RECENT DEVELOPMENT
15.15 JAX INCORPORATED
15.15.1 COMPANY SNAPSHOT
15.15.2 PRODUCT PORTFOLIO
15.15.3 RECENT DEVELOPMENT/NEWS TYPE
15.16 LUBCHEM INC.
15.16.1 COMPANY SNAPSHOT
15.16.2 PRODUCT PORTFOLIO
15.16.3 PRODUCT PIPELINE PORTFOLIO
15.16.4 RECENT DEVELOPMENT/NEWS
15.17 LUKOIL
15.17.1 COMPANY SNAPSHOT
15.17.2 BRAND PORTFOLIO
15.17.3 RECENT DEVELOPMENTS
15.18 MOTORKOTE.COM
15.18.1 COMPANY SNAPSHOT
15.18.2 PRODUCT PORTFOLIO
15.18.3 RECENT DEVELOPMENT/NEWS
15.19 MOTUL
15.19.1 COMPANY SNAPSHOT
15.19.2 PRODUCT PORTFOLIO
15.19.3 RECENT DEVELOPMENT
15.2 NORTH AMERICAN LUBRICANTS
15.20.1 COMPANY SNAPSHOT
15.20.2 PRODUCT PORTFOLIO
15.20.3 RECENT DEVELOPMENT
15.21 PETROMERICA
15.21.1 COMPANY SNAPSHOT
15.21.2 PRODUCT PORTFOLIO
15.21.3 RECENT DEVELOPMENT
15.22 PETROLIAM NASIONAL BERHAD (PETRONAS)
15.22.1 COMPANY SNAPSHOT
15.22.2 REVENUE ANALYSIS
15.22.3 PRODUCT PORTFOLIO
15.22.4 RECENT DEVELOPMENT/NEWS TYPE
15.23 PHILLIPS 66 COMPANY
15.23.1 COMPANY SNAPSHOT
15.23.2 REVENUE ANALYSIS
15.23.3 PRODUCT PORTFOLIO
15.23.4 RECENT DEVELOPMENT
15.24 QUAKER CHEMICAL CORPORATION D/B/A QUAKER HOUGHTON
15.24.1 COMPANY SNAPSHOT
15.24.2 REVENUE ANALYSIS
15.24.3 PRODUCT PORTFOLIO
15.24.4 RECENT DEVELOPMENT
15.25 TOTALENERGIES
15.25.1 COMPANY SNAPSHOT
15.25.2 REVENUE ANALYSIS
15.25.3 PRODUCT PORTFOLIO
15.25.4 RECENT DEVELOPMENT
15.26 TORCO INTERNATIONAL CORP.
15.26.1 COMPANY SNAPSHOT
15.26.2 PRODUCT PORTFOLIO
15.26.3 RECENT DEVELOPMENT
15.27 U.S. VENTURE, INC.
15.27.1 COMPANY SNAPSHOT
15.27.2 PRODUCT PORTFOLIO
15.27.3 RECENT DEVELOPMENT
15.28 ULTRA1PLUS LLC, DBA ULTRA1PLUS
15.28.1 COMPANY SNAPSHOT
15.28.2 PRODUCT PORTFOLIO
15.28.3 RECENT DEVELOPMENT
15.29 VALVOLINE
15.29.1 COMPANY SNAPSHOT
15.29.2 PRODUCT PORTFOLIO
15.29.3 RECENT DEVELOPMENT
16 QUESTIONNAIRE
17 RELATED REPORTS
List of Table
TABLE 1 REGULATION COVERAGE
TABLE 2 U.S. LUBRICANTS MARKET, BY PRODUCT, 2018-2032 (USD THOUSAND)
TABLE 3 U.S. LUBRICANTS MARKET, BY PRODUCT, 2018-2032 (TONS)
TABLE 4 U.S. ENGINE OILS IN LUBRICANTS MARKET, BY BASE OIL, 2018-2032 (USD THOUSAND)
TABLE 5 U.S. MINERAL OILS IN LUBRICANTS MARKET, BY TYPE, 2018-2032 (USD THOUSAND)
TABLE 6 U.S. SYNTHETIC OILS IN LUBRICANTS MARKET, BY TYPE, 2018-2032 (USD THOUSAND)
TABLE 7 U.S. ENGINE OILS IN LUBRICANTS MARKET, BY GRADE, 2018-2032 (USD THOUSAND)
TABLE 8 U.S. ENGINE OILS IN LUBRICANTS MARKET, BY CATEGORY 2018-2032 (USD THOUSAND)
TABLE 9 U.S. HYDRAULIC OILS IN LUBRICANTS MARKET, BY BASE OIL, 2018-2032 (USD THOUSAND)
TABLE 10 U.S. MINERAL OIL IN LUBRICANTS MARKET, BY TYPE, 2018-2032 (USD THOUSAND)
TABLE 11 U.S. SYNTHETIC OIL IN LUBRICANTS MARKET, BY TYPE, 2018-2032 (USD THOUSAND)
TABLE 12 U.S. HYDRAULIC OILS IN LUBRICANTS MARKET, BY GRADE, 2018-2032 (USD THOUSAND)
TABLE 13 U.S. CIRCULATION FLUIDS IN LUBRICANTS MARKET, BY BASE OIL, 2018-2032 (USD THOUSAND)
TABLE 14 U.S. MINERAL OIL IN LUBRICANTS MARKET, BY TYPE, 2018-2032 (USD THOUSAND)
TABLE 15 U.S. SYNTHETIC OIL IN LUBRICANTS MARKET, BY TYPE, 2018-2032 (USD THOUSAND)
TABLE 16 U.S. CIRCULATION FLUIDS IN LUBRICANTS MARKET, BY GRADE, 2018-2032 (USD THOUSAND)
TABLE 17 U.S. ENGINE OILS IN LUBRICANTS MARKET, BY BASE OIL, 2018-2032 (USD THOUSAND)
TABLE 18 U.S. MINERAL OIL IN LUBRICANTS MARKET, BY TYPE, 2018-2032 (USD THOUSAND)
TABLE 19 U.S. SYNTHETIC OIL IN LUBRICANTS MARKET, BY TYPE, 2018-2032 (USD THOUSAND)
TABLE 20 U.S. GEAR OILS IN LUBRICANTS MARKET, BY GRADE 2018-2032 (USD THOUSAND)
TABLE 21 U.S. GREASE IN LUBRICANTS MARKET, BY TYPE, 2018-2032 (USD THOUSAND)
TABLE 22 U.S. GREASE IN LUBRICANTS MARKET, BY BASE OIL, 2018-2032 (USD THOUSAND)
TABLE 23 U.S. MINERAL OILS IN LUBRICANTS MARKET, BY TYPE, 2018-2032 (USD THOUSAND)
TABLE 24 U.S. SYNTHETIC OIL IN LUBRICANTS MARKET, BY TYPE, 2018-2032 (USD THOUSAND)
TABLE 25 U.S. GREASE IN LUBRICANTS MARKET, BY GRADE, 2018-2032 (USD THOUSAND)
TABLE 26 U.S. METALWORKING FLUIDS IN LUBRICANTS MARKET, BY BASE OIL, 2018-2032 (USD THOUSAND)
TABLE 27 U.S. MINERAL OILS IN LUBRICANTS MARKET, BY BASE OIL, 2018-2032 (USD THOUSAND)
TABLE 28 U.S. SYNTHETIC OIL IN LUBRICANTS MARKET, BY TYPE, 2018-2032 (USD THOUSAND)
TABLE 29 U.S. METALWORKING FLUIDS IN LUBRICANTS MARKET, BY GRADE, 2018-2032 (USD THOUSAND)
TABLE 30 U.S. WIND TURBINE OILS IN LUBRICANTS MARKET, BY BASE OIL, 2018-2032 (USD THOUSAND)
TABLE 31 U.S. MINERAL OIL IN LUBRICANTS MARKET, BY TYPE, 2018-2032 (USD THOUSAND)
TABLE 32 U.S. SYNTHETIC OIL IN LUBRICANTS MARKET, BY TYPE, 2018-2032 (USD THOUSAND)
TABLE 33 U.S. WIND TURBINE OILS IN LUBRICANTS MARKET, BY GRADE 2018-2032 (USD THOUSAND)
TABLE 34 U.S. COMPRESSOR OILS IN LUBRICANTS MARKET, BY BASE OIL, 2018-2032 (USD THOUSAND)
TABLE 35 U.S. MINERAL OIL IN LUBRICANTS MARKET, BY TYPE, 2018-2032 (USD THOUSAND)
TABLE 36 U.S. SYNTHETIC OILS IN LUBRICANTS MARKET, BY BASE OIL, 2018-2032 (USD THOUSAND)
TABLE 37 U.S. COMPRESSOR OILS IN LUBRICANTS MARKET, BY GRADE 2018-2032 (USD THOUSAND)
TABLE 38 U.S. GAS TURBINE OILS IN LUBRICANTS MARKET, BY BASE OIL, 2018-2032 (USD THOUSAND)
TABLE 39 U.S. MINERAL OIL IN LUBRICANTS MARKET, BY TYPE, 2018-2032 (USD THOUSAND)
TABLE 40 U.S. SYNTHETIC OIL IN LUBRICANTS MARKET, BY TYPE, 2018-2032 (USD THOUSAND)
TABLE 41 U.S. GAS TURBINE OILS IN LUBRICANTS MARKET, BY GRADE, 2018-2032 (USD THOUSAND)
TABLE 42 U.S. HEAT TRANSFER OILS IN LUBRICANTS MARKET, BY BASE OIL, 2018-2032 (USD THOUSAND)
TABLE 43 U.S. MINERAL OIL IN LUBRICANTS MARKET, BY TYPE, 2018-2032 (USD THOUSAND)
TABLE 44 U.S. SYNTHETIC OIL IN LUBRICANTS MARKET, BY TYPE, 2018-2032 (USD THOUSAND)
TABLE 45 U.S. HEAT TRANSFER OILS IN LUBRICANTS MARKET, BY GRADE 2018-2032 (USD THOUSAND)
TABLE 46 U.S. RUST PREVENTIVE OILS IN LUBRICANTS MARKET, BY BASE OIL, 2018-2032 (USD THOUSAND)
TABLE 47 U.S. MINERAL OIL IN LUBRICANTS MARKET, BY TYPE, 2018-2032 (USD THOUSAND)
TABLE 48 U.S. SYNTHETIC OIL IN LUBRICANTS MARKET, BY TYPE, 2018-2032 (USD THOUSAND)
TABLE 49 U.S. RUST PREVENTIVE OILS IN LUBRICANTS MARKET, BY GRADE 2018-2032 (USD THOUSAND)
TABLE 50 U.S. PENETRANTS IN LUBRICANTS MARKET, BY BASE OIL, 2018-2032 (USD THOUSAND)
TABLE 51 U.S. MINERAL OILS IN LUBRICANTS MARKET, BY TYPE, 2018-2032 (USD THOUSAND)
TABLE 52 U.S. SYNTHETIC OIL IN LUBRICANTS MARKET, BY TYPE, 2018-2032 (USD THOUSAND)
TABLE 53 U.S. PENETRANTS IN LUBRICANTS MARKET, BY GRADE, 2018-2032 (USD THOUSAND)
TABLE 54 U.S. OTHERS IN LUBRICANTS MARKET, BY BASE OIL, 2018-2032 (USD THOUSAND)
TABLE 55 U.S. MINERAL OILS IN LUBRICANTS MARKET, BY TYPE, 2018-2032 (USD THOUSAND)
TABLE 56 U.S. SYNTHETIC OIL IN LUBRICANTS MARKET, BY TYPE, 2018-2032 (USD THOUSAND)
TABLE 57 U.S. OTHERS IN LUBRICANTS MARKET, BY GRADE 2018-2032 (USD THOUSAND)
TABLE 58 U.S. LUBRICANTS MARKET, BY BASE OIL, 2018- 2032 (USD THOUSAND)
TABLE 59 U.S. MINERAL OIL IN LUBRICANTS MARKET, BY TYPE, 2018-2032 (USD THOUSAND)
TABLE 60 U.S. SYNTHETIC OIL IN LUBRICANTS MARKET, BY TYPE, 2018-2032 (USD THOUSAND)
TABLE 61 U.S. LUBRICANTS MARKET, BY GRADE, 2018-2032 (USD THOUSAND)
TABLE 62 U.S. LUBRICANTS MARKET, BY FORMAT, 2018-2032 (USD THOUSAND)
TABLE 63 U.S. LUBRICANTS MARKET, BY SALES CHANNEL, 2018-2032 (USD THOUSAND)
TABLE 64 U.S. LUBRICANTS MARKET, BY END-USE, 2018-2032 (USD THOUSAND)
TABLE 65 U.S. AUTOMOBILE & TRANSPORTATION IN LUBRICANTS MARKET, BY VEHICLE TYPE, 2018-2032 (USD THOUSAND)
TABLE 66 U.S. COMMERCIAL VEHICLES IN LUBRICANTS MARKET, BY TYPE, 2018-2032 (USD THOUSAND)
TABLE 67 U.S. TRUCKS IN LUBRICANTS MARKET, BY TYPE, 2018-2032 (USD THOUSAND)
TABLE 68 U.S. PASSENGER VEHICLE IN LUBRICANTS MARKET, BY TYPE, 2018-2032 (USD THOUSAND)
TABLE 69 U.S. CONSUMER/DIY IN LUBRICANTS MARKET, BY TYPE, 2018-2032 (USD THOUSAND)
List of Figure
FIGURE 1 U.S. LUBRICANTS MARKET: SEGMENTATION
FIGURE 2 U.S. LUBRICANTS MARKET: DATA TRIANGULATION
FIGURE 3 U.S. LUBRICANTS MARKET: DROC ANALYSIS
FIGURE 4 U.S. LUBRICANTS MARKET: COUNTRY-WISE MARKET ANALYSIS
FIGURE 5 U.S. LUBRICANTS MARKET: COMPANY RESEARCH ANALYSIS
FIGURE 6 U.S. LUBRICANTS MARKET: INTERVIEW DEMOGRAPHICS
FIGURE 7 U.S. LUBRICANTS MARKET: DBMR MARKET POSITION GRID
FIGURE 8 U.S. LUBRICANTS MARKET: MARKET END-USE COVERAGE GRID
FIGURE 9 U.S. LUBRICANTS MARKET: SEGMENTATION
FIGURE 10 EXECUTIVE SUMMARY
FIGURE 11 THIRTEEN SEGMENTS COMPRISE THE U.S. LUBRICANTS MARKET, BY PRODUCT
FIGURE 12 STRATEGIC DECISIONS
FIGURE 13 THE SURGE IN VEHICLE MANUFACTURING AND SALES IS EXPECTED TO DRIVE THE GROWTH OF THE U.S. LUBRICANTS MARKET IN THE FORECAST PERIOD FROM 2025 TO 2032
FIGURE 14 THE ENGINE OILS SEGMENT IS EXPECTED TO ACCOUNT FOR THE LARGEST SHARE OF THE U.S. LUBRICANTS MARKET IN 2025 AND 2032
FIGURE 15 PESTEL ANALYSIS
FIGURE 16 PORTER’S FIVE FORCES ANALYSIS
FIGURE 17 IMPORT EXPORT SCENARIO (USD THOUSAND)
FIGURE 18 DRIVERS, RESTRAINTS, OPPORTUNITIES, AND CHALLENGES OF THE U.S. LUBRICANTS MARKET
FIGURE 19 UNITED STATES MOTOR VEHICLE SALES: PASSENGER CARS FROM 2020 TO 2024
FIGURE 20 U.S. LUBRICANTS MARKET: BY PRODUCT, 2024
FIGURE 21 U.S. LUBRICANTS MARKET: BY BASE OIL, 2024
FIGURE 22 U.S. LUBRICANTS MARKET: BY GRADE, 2024
FIGURE 23 U.S. LUBRICANTS MARKET: BY FORMAT, 2024
FIGURE 24 U.S. LUBRICANTS MARKET: BY SALES CHANNEL, 2024
FIGURE 25 U.S. LUBRICANTS MARKET: BY END-USE, 2024
FIGURE 26 U.S.: COMPANY SHARE 2024 (%)
Us Lubricant Market, Supply Chain Analysis and Ecosystem Framework
To support market growth and help clients navigate the impact of geopolitical shifts, DBMR has integrated in-depth supply chain analysis into its Us Lubricant Market research reports. This addition empowers clients to respond effectively to global changes affecting their industries. The supply chain analysis section includes detailed insights such as Us Lubricant Market consumption and production by country, price trend analysis, the impact of tariffs and geopolitical developments, and import and export trends by country and HSN code. It also highlights major suppliers with data on production capacity and company profiles, as well as key importers and exporters. In addition to research, DBMR offers specialized supply chain consulting services backed by over a decade of experience, providing solutions like supplier discovery, supplier risk assessment, price trend analysis, impact evaluation of inflation and trade route changes, and comprehensive market trend analysis.
Data collection and base year analysis are done using data collection modules with large sample sizes. The stage includes obtaining market information or related data through various sources and strategies. It includes examining and planning all the data acquired from the past in advance. It likewise envelops the examination of information inconsistencies seen across different information sources. The market data is analysed and estimated using market statistical and coherent models. Also, market share analysis and key trend analysis are the major success factors in the market report. To know more, please request an analyst call or drop down your inquiry.
The key research methodology used by DBMR research team is data triangulation which involves data mining, analysis of the impact of data variables on the market and primary (industry expert) validation. Data models include Vendor Positioning Grid, Market Time Line Analysis, Market Overview and Guide, Company Positioning Grid, Patent Analysis, Pricing Analysis, Company Market Share Analysis, Standards of Measurement, Global versus Regional and Vendor Share Analysis. To know more about the research methodology, drop in an inquiry to speak to our industry experts.
Data Bridge Market Research is a leader in advanced formative research. We take pride in servicing our existing and new customers with data and analysis that match and suits their goal. The report can be customized to include price trend analysis of target brands understanding the market for additional countries (ask for the list of countries), clinical trial results data, literature review, refurbished market and product base analysis. Market analysis of target competitors can be analyzed from technology-based analysis to market portfolio strategies. We can add as many competitors that you require data about in the format and data style you are looking for. Our team of analysts can also provide you data in crude raw excel files pivot tables (Fact book) or can assist you in creating presentations from the data sets available in the report.


