
Us Lubricants Market
Market Size in USD Billion
 USD
22.86 Billion
USD
28.91 Billion
2024
2032
USD
22.86 Billion
USD
28.91 Billion
2024
2032
| 2025 - 2032 | |
| USD 22.86 Billion | |
| USD 28.91 Billion | |
| % | |
|
Lubricants Market Size
- The U.S. Lubricants Market size was valued at USD 22.86 billion in 2024 and is expected to reach USD 28.91 billion by 2032, at a CAGR of 3.01% during the forecast period
- The growing number of vehicles on U.S. roads—including both Internal Combustion Engine (ICE) cars and commercial trucks—continues to drive lubricant demand for engine oils, transmission fluids, and maintenance services.
- As EV and hybrid vehicle usage rises, specialized lubricants (e.g., for gearboxes and drivetrains) are in higher demand, prompting innovation and segment growth.

Lubricants Market Analysis
- Enhanced thermal stability, reduced friction, longer drain intervals, and performance in extreme conditions have driven a shift toward synthetic oils, particularly in automotive and industrial sectors.
- Industrial automation, IoT, and predictive maintenance increase lubricant use in heavy machinery. Condition-monitoring and smart lubricant systems are gaining traction.
- Lubricants are essential in wind, solar, and hydro plants to reduce friction and downtime—supporting the green energy transition.
- Engine Oils segment dominates the Lubricants Market with a market share of 31.83% in 2024, driven by Enhanced formulations with better thermal stability, oxidation resistance, and longer oil-change intervals are increasingly replacing conventional mineral oils in both automotive and industrial settings.
Report Scope and Lubricants Market Segmentation
|
Attributes |
Lubricants Market Insights |
|
Segments Covered |
|
|
Countries Covered |
|
|
Key Market Players |
|
|
Market Opportunities |
|
|
Value Added Data Infosets |
In addition to the insights on market scenarios such as market value, growth rate, segmentation, geographical coverage, and major players, the market reports curated by the Data Bridge Market Research also include in-depth expert analysis, pricing analysis, brand share analysis, consumer survey, demography analysis, supply chain analysis, value chain analysis, raw material/consumables overview, vendor selection criteria, PESTLE Analysis, Porter Analysis, and regulatory framework. |
Lubricants Market Trends
“Growing Demand for High-Performance and Sustainable Lubricants”
- The U.S. lubricants market is experiencing a shift toward high-performance synthetic and bio-based lubricants, driven by stricter environmental regulations and the need for enhanced equipment efficiency.
- Increasing industrialization, along with rising automotive sales—particularly electric and hybrid vehicles—is fueling the demand for advanced lubricants with longer drain intervals and superior thermal stability.
- Consumers and industries are increasingly prioritizing sustainability, prompting lubricant manufacturers to invest in eco-friendly formulations and biodegradable options that reduce environmental impact.
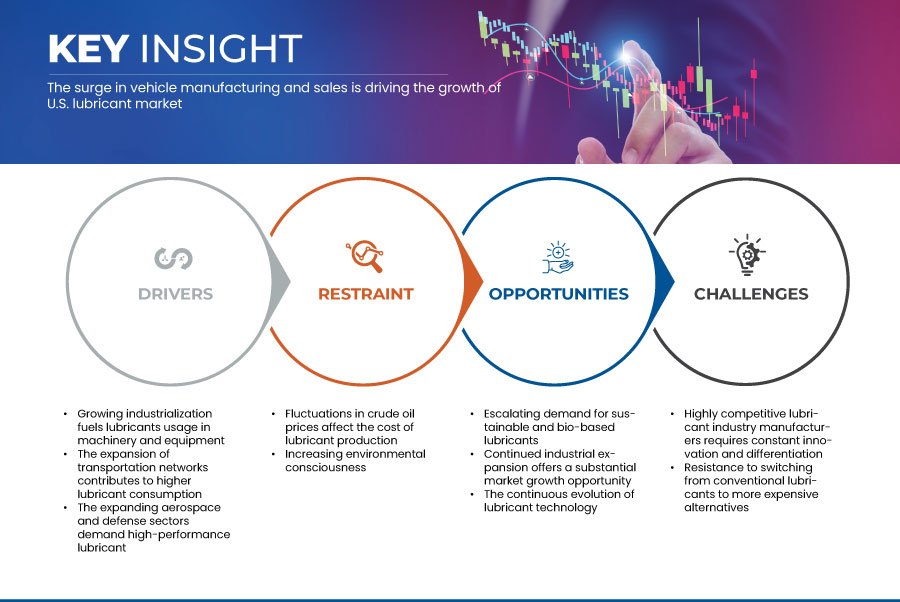
Lubricants Market Dynamics
Driver
“Technological Advancements and Demand for Fuel Efficiency”
- A major growth driver in the U.S. lubricants market is the demand for lubricants that enhance engine performance, reduce friction, and contribute to fuel efficiency in both automotive and industrial applications.
- Advances in base oil technology, additive chemistry, and synthetic formulations are leading to the development of lubricants that perform well under extreme temperatures and pressures.
- Stricter fuel economy standards and emission regulations are prompting OEMs and fleet operators to opt for premium lubricants that extend equipment life and improve engine cleanliness.
- Rising maintenance awareness among end-users is also driving the adoption of specialty lubricants, particularly in sectors like aerospace, energy, and manufacturing.
Restraint/Challenge
“Volatile Raw Material Prices and Environmental Concerns”
- Fluctuations in crude oil prices directly affect the cost of petroleum-based lubricants, causing pricing instability and margin pressure for manufacturers and distributors.
- Environmental concerns regarding disposal and recycling of used lubricants pose regulatory and logistical challenges, particularly for industrial users and waste management firms.
- Despite growing interest in bio-lubricants, their higher cost and lower performance in certain applications compared to conventional options can deter widespread adoption.
- Lack of consumer awareness about the benefits of synthetic and eco-friendly lubricants in some market segments may slow down the transition from traditional mineral-based products.
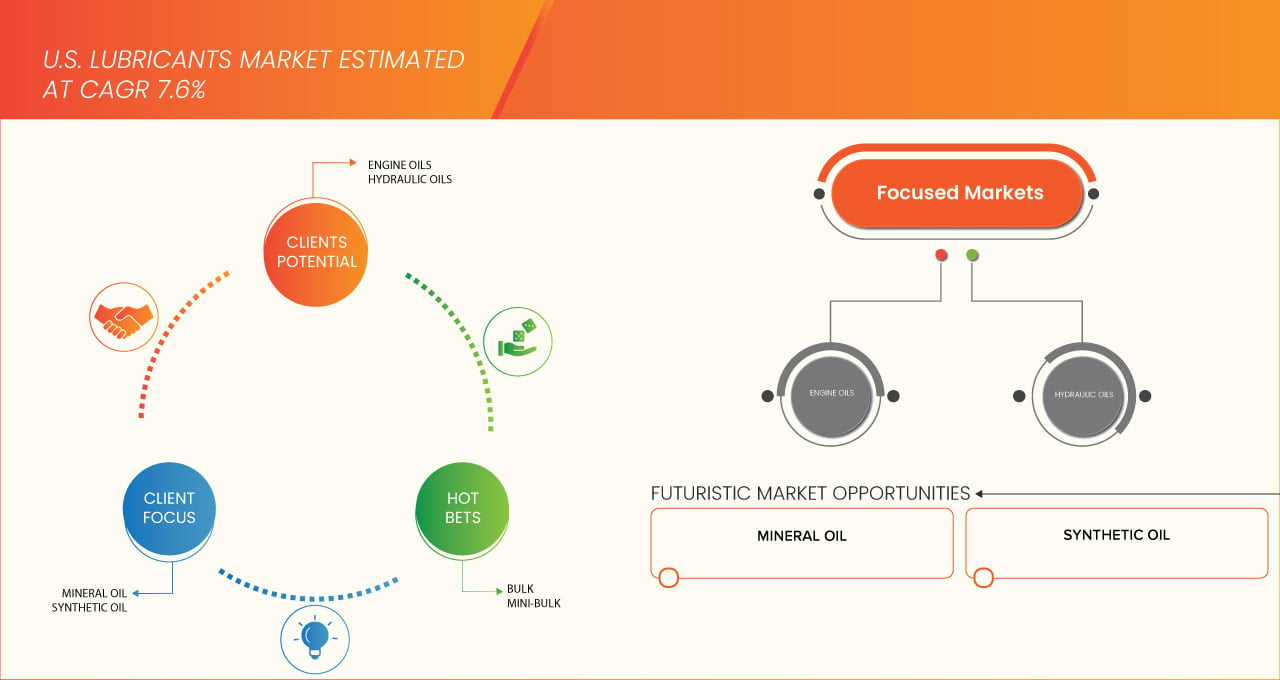
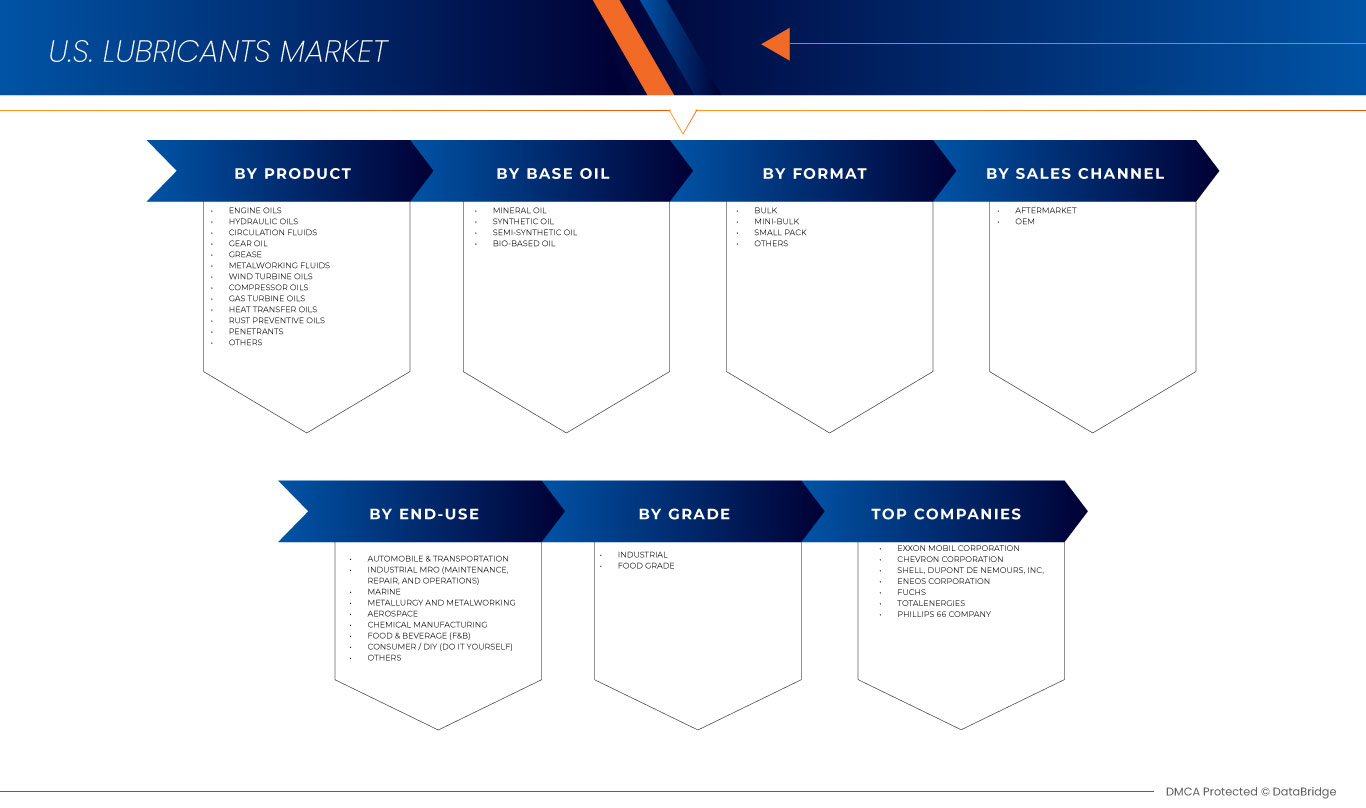
Lubricants Market Scope
The market is segmented on the basis of Product, Base Oil, Grade, Format, Sales Channel, End-Use.
- By Product
On the basis of Product, the Lubricants Market is segmented into Engine Oils, Hydraulic Oils, Circulation Fluids, Gear Oil, Grease, Metalworking Fluids, Wind Turbine Oils, Compressor Oils, Gas Turbine Oils, Heat Transfer Oils, Rust Preventive Oils, And Others. The Engine Oils segment dominates the largest market revenue share of 31.83% in 2024, driven by growing number of vehicles on U.S. roads—including both internal combustion engine (ICE) cars and commercial trucks—continues to drive lubricant demand for engine oils, transmission fluids, and maintenance services.
The Engine Oils segment is anticipated to witness the fastest growth rate of 3.59% from 2025 to 2032, fueled by Enhanced formulations with better thermal stability, oxidation resistance, and longer oil-change intervals are increasingly replacing conventional mineral oils in both automotive and industrial settings.
- By Base Oil
On the basis of Base Oil, the Lubricants Market is segmented into Mineral Oil, Synthetic Oil, Semi-Synthetic Oil, Bio-Based Oil, Others. The Mineral Oil segment held the largest market revenue share in 2024 driven by Regulatory & Environmental Pressure.
The Mineral Oil segment is expected to witness the fastest CAGR from 2025 to 2032, driven by Shift to Synthetic & High-Performance Oils.
- By Grade
On the basis of Grade, the Lubricants Market is segmented into Industrial and Food Grade. The Industrial segment held the largest market revenue share in 2024 driven by Stringent EPA regulations on emissions and biodegradability, plus sustainability initiatives, are pushing the market toward eco-friendly formulations, including bio-based lubricants.
- By Format
On the basis of Processing Format, the Lubricants Market is segmented into Bulk, Mini-Bulk, Small Pack, And Others. The Bulk segment held the largest market revenue share in 2024 driven by the resurgence of manufacturing in the U.S.—spanning heavy machinery, mining, construction, and power generation—creates ongoing demand for industrial lubricants to ensure operational reliability.
- By Sales Channel
On the basis of Sales Channel, the Lubricants Market is segmented into Aftermarket, OEM. The Aftermarket segment held the largest market revenue share in 2024 driven by Wind, hydro, and solar power facilities need specialized lubricants for turbines, generators, and ancillary equipment, supporting market expansion.
- By End-Use
On the basis of End-Use, the Lubricants Market is segmented into Automobile & Transportation, Industrial MRO (Maintenance, Repair, And Operations), Marine, Metallurgy and Metalworking, Aerospace, Chemical Manufacturing, Food & Beverage (F&B), Consumer / DIY (Do It Yourself), Others. The Food Grade segment held the largest market revenue share in 2024 driven by Additives that reduce corrosion, wear, and friction while enhancing heat resistance are enabling more reliable, application-specific lubricants in automotive, aerospace, and industrial use.
Lubricants Market Share
The Lubricants Market is primarily led by well-established companies, including:
- Exxon Mobil Corporation
- Chevron Corporation
- Shell
- DuPont de Nemours, Inc.
- Lukoil
- TotalEnergies
- ENEOS Corporation
- Phillips 66 Company
- Motul
- FUCHS
- valvoline
- BASF SE
- Castrol Limited
- WD-40
- Blue Sky Lubricants
- Red Line Synthetic Oil
- Mystik Lubricants
- Carl Bechem GmbH
- Calumet, Inc.
Latest Developments in U.S. Lubricants Power Market
- In 2024, ExxonMobil launched Mobil EV™, a new line of advanced lubricants specifically designed for electric vehicles (EVs). These include thermal management fluids and greases tailored for the unique needs of EV motors and drivetrains, addressing growing demand in the e-mobility sector.
- In February 2024, Chevron announced the expansion of its Havoline® Pro-RS™ line, a line of renewable full synthetic motor oils made from plant-based base oils. The move supports Chevron’s sustainability strategy and appeals to environmentally conscious consumers and fleet operators.
- In September 2023, partnered with OEMs to co-develop next-generation lubricants optimized for hybrid and turbocharged engines. These formulations aim to meet evolving fuel economy standards while extending oil change intervals and enhancing engine life.
- In July 2023, Royal Dutch Shell completed upgrades to its lubricants blending plant in Louisiana, increasing capacity and integrating automated quality control systems. The upgrade supports regional distribution and caters to rising demand for high-performance lubricants in North America.
- In January 2022, Fuchs Lubricants Co., a major independent lubricant manufacturer, expanded its U.S. operations with a new state-of-the-art R&D center in Kansas. The facility focuses on developing specialized lubricants for industrial, food-grade, and renewable energy applications.
SKU-

- Interactive Data Analysis Dashboard
- Company Analysis Dashboard for high growth potential opportunities
- Research Analyst Access for customization & queries
- Competitor Analysis with Interactive dashboard
- Latest News, Updates & Trend analysis
- Harness the Power of Benchmark Analysis for Comprehensive Competitor Tracking
Table of Content
1 INTRODUCTION
1.1 OBJECTIVES OF THE STUDY
1.2 MARKET DEFINITION
1.3 OVERVIEW OF THE U.S. LUBRICANTS MARKET
1.4 LIMITATIONS
1.5 MARKETS COVERED
2 MARKET SEGMENTATION
2.1 MARKETS COVERED
2.2 GEOGRAPHICAL SCOPE
2.3 YEARS CONSIDERED FOR THE STUDY
2.4 CURRENCY AND PRICING
2.5 DBMR TRIPOD DATA VALIDATION MODEL
2.6 MULTIVARIATE MODELLING
2.7 PRIMARY INTERVIEWS WITH KEY OPINION LEADERS
2.8 DBMR MARKET POSITION GRID
2.9 MARKET END-USE COVERAGE GRID
2.1 SECONDARY SOURCES
2.11 ASSUMPTIONS
3 EXECUTIVE SUMMARY
4 PREMIUM INSIGHTS
4.1 PORTER’S FIVE FORCES ANALYSIS
4.1.1 THREAT OF NEW ENTRANTS
4.1.2 BARGAINING POWER OF SUPPLIERS
4.1.3 BARGAINING POWER OF BUYERS
4.1.4 THREAT OF SUBSTITUTE PRODUCTS
4.1.5 INDUSTRY RIVALRY
4.2 BRAND OUTLOOK
4.3 PRODUCTION CONSUMPTION ANALYSIS
4.4 PRICING ANALYSIS
4.5 PATENT ANALYSIS
4.5.1 PATENT QUALITY AND STRENGTH
4.5.2 PATENT FAMILIES
4.5.3 LICENSING AND COLLABORATIONS
4.5.4 REGIONAL PATENT LANDSCAPE
4.5.5 IP STRATEGY AND MANAGEMENT
4.6 PRODUCTION & CONSUMPTION ANALYSIS
4.7 VENDOR SELECTION CRITERIA
4.7.1 QUALITY AND CONSISTENCY
4.7.2 TECHNICAL EXPERTISE
4.7.3 SUPPLY CHAIN RELIABILITY
4.7.4 COMPLIANCE AND SUSTAINABILITY
4.7.5 COST AND PRICING STRUCTURE
4.7.6 FINANCIAL STABILITY
4.7.7 FLEXIBILITY AND CUSTOMIZATION
4.7.8 RISK MANAGEMENT AND CONTINGENCY PLANS
4.8 CLIMATE CHANGE SCENARIO
4.8.1 ENVIRONMENTAL CONCERNS
4.8.1.1 CARBON EMISSIONS FROM PRODUCTION
4.8.1.2 NON-RENEWABLE RESOURCE DEPLETION
4.8.1.3 WATER AND AIR POLLUTION
4.8.2 INDUSTRY RESPONSE
4.8.2.1 DEVELOPMENT OF BIO-BASED AND SYNTHETIC LUBRICANTS
4.8.2.2 RECYCLING AND RE-REFINING INITIATIVES
4.8.2.3 ENERGY EFFICIENCY IMPROVEMENTS
4.8.3 GOVERNMENT’S ROLE
4.8.3.1 REGULATIONS AND ENVIRONMENTAL STANDARDS
4.8.3.2 INCENTIVES FOR SUSTAINABLE PRODUCTS
4.8.3.3 PROMOTING PUBLIC-PRIVATE PARTNERSHIPS
4.8.4 ANALYST RECOMMENDATIONS
4.8.4.1 INVEST IN SUSTAINABLE PRODUCT DEVELOPMENT
4.8.4.2 ENHANCE RECYCLING AND RE-REFINING CAPABILITIES
4.8.4.3 COLLABORATE WITH REGULATORS AND INDUSTRY PEERS
4.8.4.4 LEVERAGE GOVERNMENT INCENTIVES
4.9 CONSUMER BUYING BEHAVIOUR
4.1 INNOVATION TRACKER AND STRATEGIC ANALYSIS – U.S. LUBRICANTS MARKET
4.10.1 MAJOR DEALS AND STRATEGIC ALLIANCES ANALYSIS
4.10.1.1 JOINT VENTURES
4.10.1.2 MERGERS AND ACQUISITIONS
4.10.1.3 LICENSING AND PARTNERSHIP
4.10.1.4 TECHNOLOGY COLLABORATIONS
4.10.1.5 STRATEGIC DIVESTMENTS
4.10.2 NUMBER OF PRODUCTS IN DEVELOPMENT
4.10.3 STAGE OF DEVELOPMENT
4.10.4 TIMELINES AND MILESTONES
4.10.5 INNOVATION STRATEGIES AND METHODOLOGIES
4.10.6 RISK ASSESSMENT AND MITIGATION
4.10.7 FUTURE OUTLOOK
4.11 INDUSTRY ECOSYSTEM ANALYSIS: U.S. LUBRICANTS MARKET
4.12 OVERVIEW OF TECHNOLOGICAL INNOVATIONS IN THE U.S. LUBRICANT MARKET
4.13 RAW MATERIAL COVERAGE
4.14 SUPPLY CHAIN ANALYSIS
4.14.1 OVERVIEW OF THE U.S. LUBRICANTS MARKET SUPPLY CHAIN
4.14.1.1 SUPPLY CHAIN CHALLENGES:
4.14.2 LOGISTICS COST SCENARIO
4.14.2.1 TRANSPORTATION COSTS
4.14.2.2 WAREHOUSING AND STORAGE COSTS
4.14.2.3 HANDLING AND PACKAGING COSTS
4.14.3 IMPORTANCE OF LOGISTICS SERVICE PROVIDERS
4.14.3.1 TRANSPORTATION MANAGEMENT
4.14.3.2 WAREHOUSING AND DISTRIBUTION SERVICES
4.14.3.3 REGULATORY AND COMPLIANCE EXPERTISE
4.15 VALUE CHAIN ANALYSIS
5 TARIFFS & IMPACT ON THE MARKET
6 REGULATION COVERAGE
6.1 OVERVIEW
7 MARKET OVERVIEW
7.1 DRIVERS
7.1.1 THE SURGE IN VEHICLE MANUFACTURING AND SALES
7.1.2 GROWING INDUSTRIALIZATION FUELS LUBRICANT USAGE IN MACHINERY AND EQUIPMENT
7.1.3 THE EXPANSION OF TRANSPORTATION NETWORKS CONTRIBUTES TO HIGHER LUBRICANT CONSUMPTION
7.1.4 THE EXPANDING AEROSPACE AND DEFENSE SECTORS DEMAND HIGH-PERFORMANCE LUBRICANT
7.2 RESTRAINTS
7.2.1 FLUCTUATIONS IN CRUDE OIL PRICES AFFECT THE COST OF LUBRICANT PRODUCTION
7.2.2 INCREASING ENVIRONMENTAL CONSCIOUSNESS
7.3 OPPORTUNITIES
7.3.1 ESCALATING DEMAND FOR SUSTAINABLE AND BIO-BASED LUBRICANTS
7.3.2 CONTINUED INDUSTRIAL EXPANSION OFFERS A SUBSTANTIAL MARKET GROWTH OPPORTUNITY
7.3.3 THE CONTINUOUS EVOLUTION OF LUBRICANT TECHNOLOGY
7.4 CHALLENGES
7.4.1 HIGHLY COMPETITIVE LUBRICANT INDUSTRY MANUFACTURERS REQUIRES CONSTANT INNOVATION AND DIFFERENTIATION
7.4.2 RESISTANCE TO SWITCHING FROM CONVENTIONAL LUBRICANTS TO MORE EXPENSIVE ALTERNATIVES
8 U.S. LUBRICANTS MARKET, BY PRODUCT
8.1 OVERVIEW
8.2 ENGINE OILS
8.2.1 MINERAL OIL
8.2.2 SYNTHETIC OIL
8.2.2.1 SYNTHETIC BLEND OIL
8.2.2.2 FULL SYNTHETIC OIL
8.2.3 SEMI-SYNTHETIC OIL
8.2.4 BIO-BASED OIL
8.2.5 OTHERS
8.2.5.1 INDUSTRIAL
8.2.5.2 FOOD GRADE
8.2.5.2.1 GASOLINE ENGINE OIL
8.2.5.2.2 DIESEL ENGINE OIL
8.3 HYDRAULIC OILS
8.3.1 MINERAL OIL
8.3.1.1 PARAFFINIC OILS
8.3.1.2 NAPHTHENIC OILS
8.3.1.3 AROMATIC OILS
8.3.2 SYNTHETIC OIL
8.3.2.1 SYNTHETIC BLEND OIL
8.3.2.2 FULL SYNTHETIC OIL
8.3.3 SEMI-SYNTHETIC OIL
8.3.4 BIO-BASED OIL
8.3.5 OTHERS
8.3.5.1 INDUSTRIAL
8.3.5.2 FOOD GRADE
8.4 CIRCULATION FLUIDS
8.4.1 MINERAL OIL
8.4.1.1 PARAFFINIC OILS
8.4.1.2 NAPHTHENIC OILS
8.4.1.3 AROMATIC OILS
8.4.2 SYNTHETIC OIL
8.4.2.1 SYNTHETIC BLEND OIL
8.4.2.2 FULL SYNTHETIC OIL
8.4.3 SEMI-SYNTHETIC OIL
8.4.4 BIO-BASED OIL
8.4.5 OTHERS
8.4.5.1 INDUSTRIAL
8.4.5.2 FOOD GRADE
8.5 GEAR OIL
8.5.1 MINERAL OIL
8.5.1.1 PARAFFINIC OILS
8.5.1.2 NAPHTHENIC OILS
8.5.1.3 AROMATIC OILS
8.5.2 SYNTHETIC OIL
8.5.2.1 SYNTHETIC BLEND OIL
8.5.2.2 FULL SYNTHETIC OIL
8.5.3 SEMI-SYNTHETIC OIL
8.5.4 BIO-BASED OIL
8.5.5 OTHERS
8.5.5.1 INDUSTRIAL
8.5.5.2 FOOD GRADE
8.6 GREASE
8.6.1 LITHIUM-BASED
8.6.2 CALCIUM-BASED
8.6.3 BENTONE-BASED
8.6.4 BARIUM COMPLEX
8.6.5 OTHERS
8.6.5.1 MINERAL OIL
8.6.5.1.1 PARAFFINIC OILS
8.6.5.1.2 NAPHTHENIC OILS
8.6.5.1.3 AROMATIC OILS
8.6.5.2 SYNTHETIC OIL
8.6.5.2.1 SYNTHETIC BLEND OIL
8.6.5.2.2 FULL SYNTHETIC OIL
8.6.5.3 SEMI-SYNTHETIC OIL
8.6.5.4 BIO-BASED OIL
8.6.5.5 OTHERS
8.6.5.5.1 INDUSTRIAL
8.6.5.5.2 FOOD GRADE
8.7 METALWORKING FLUIDS
8.7.1 MINERAL OIL
8.7.1.1 PARAFFINIC OILS
8.7.1.2 NAPHTHENIC OILS
8.7.1.3 AROMATIC OILS
8.7.2 SYNTHETIC OIL
8.7.2.1 SYNTHETIC BLEND OIL
8.7.2.2 FULL SYNTHETIC OIL
8.7.3 SEMI-SYNTHETIC OIL
8.7.4 BIO-BASED OIL
8.7.5 OTHERS
8.7.5.1 INDUSTRIAL
8.7.5.2 FOOD GRADE
8.8 WIND TURBINE OILS
8.8.1 MINERAL OIL
8.8.1.1 PARAFFINIC OILS
8.8.1.2 NAPHTHENIC OILS
8.8.1.3 AROMATIC OILS
8.8.2 SYNTHETIC OIL
8.8.2.1 SYNTHETIC BLEND OIL
8.8.2.2 FULL SYNTHETIC OIL
8.8.3 SEMI-SYNTHETIC OIL
8.8.4 BIO-BASED OIL
8.8.5 OTHERS
8.8.5.1 INDUSTRIAL
8.8.5.2 FOOD GRADE
8.9 COMPRESSOR OILS
8.9.1 MINERAL OIL
8.9.1.1 PARAFFINIC OILS
8.9.1.2 NAPHTHENIC OILS
8.9.1.3 AROMATIC OILS
8.9.2 SYNTHETIC OIL
8.9.2.1 SYNTHETIC BLEND OIL
8.9.2.2 FULL SYNTHETIC OIL
8.9.3 SEMI-SYNTHETIC OIL
8.9.4 BIO-BASED OIL
8.9.5 OTHERS
8.9.5.1 INDUSTRIAL
8.9.5.2 FOOD GRADE
8.1 GAS TURBINE OILS
8.10.1 MINERAL OIL
8.10.1.1 PARAFFINIC OILS
8.10.1.2 NAPHTHENIC OILS
8.10.1.3 AROMATIC OILS
8.10.2 SYNTHETIC OIL
8.10.2.1 SYNTHETIC BLEND OIL
8.10.2.2 FULL SYNTHETIC OIL
8.10.3 SEMI-SYNTHETIC OIL
8.10.4 BIO-BASED OIL
8.10.5 OTHERS
8.10.5.1 INDUSTRIAL
8.10.5.2 FOOD GRADE
8.11 HEAT TRANSFER OILS
8.11.1 MINERAL OIL
8.11.1.1 PARAFFINIC OILS
8.11.1.2 NAPHTHENIC OILS
8.11.1.3 AROMATIC OILS
8.11.2 SYNTHETIC OIL
8.11.2.1 SYNTHETIC BLEND OIL
8.11.2.2 2 FULL SYNTHETIC OIL
8.11.3 SEMI-SYNTHETIC OIL
8.11.4 BIO-BASED OIL
8.11.5 OTHERS
8.11.5.1 INDUSTRIAL
8.11.5.2 FOOD GRADE
8.12 RUST PREVENTIVE OILS
8.12.1 MINERAL OIL
8.12.1.1 PARAFFINIC OILS
8.12.1.2 NAPHTHENIC OILS
8.12.1.3 AROMATIC OILS
8.12.2 SYNTHETIC OIL
8.12.2.1 SYNTHETIC BLEND OIL
8.12.2.2 FULL SYNTHETIC OIL
8.12.3 SEMI-SYNTHETIC OIL
8.12.4 BIO-BASED OIL
8.12.5 OTHERS
8.12.5.1 INDUSTRIAL
8.12.5.2 FOOD GRADE
8.13 PENETRANTS
8.13.1 MINERAL OIL
8.13.1.1 PARAFFINIC OILS
8.13.1.2 NAPHTHENIC OILS
8.13.1.3 AROMATIC OILS
8.13.2 SYNTHETIC OIL
8.13.2.1 SYNTHETIC BLEND OIL
8.13.2.2 FULL SYNTHETIC OIL
8.13.3 SEMI-SYNTHETIC OIL
8.13.4 BIO-BASED OIL
8.13.5 OTHERS
8.13.5.1 INDUSTRIAL
8.13.5.2 FOOD GRADE
8.14 OTHERS
8.14.1 MINERAL OIL
8.14.1.1 PARAFFINIC OILS
8.14.1.2 NAPHTHENIC OILS
8.14.1.3 AROMATIC OILS
8.14.2 SYNTHETIC OIL
8.14.2.1 SYNTHETIC BLEND OIL
8.14.2.2 FULL SYNTHETIC OIL
8.14.3 SEMI-SYNTHETIC OIL
8.14.4 BIO-BASED OIL
8.14.5 OTHERS
8.14.5.1 INDUSTRIAL
8.14.5.2 FOOD GRADE
9 U.S. LUBRICANTS MARKET, BY BASE OIL
9.1 OVERVIEW
9.2 MINERAL OIL
9.2.1 PARAFFINIC OILS
9.2.2 NAPHTHENIC OILS
9.2.3 AROMATIC OILS
9.3 SYNTHETIC OIL
9.3.1 SYNTHETIC BLEND OIL
9.3.2 FULL SYNTHETIC OIL
9.4 SEMI-SYNTHETIC OIL
9.5 BIO-BASED OIL
9.6 OTHERS
10 U.S. LUBRICANTS MARKET, BY GRADE
10.1 OVERVIEW
10.2 INDUSTRIAL
10.3 FOOD GRADE
11 U.S. LUBRICANTS MARKET, BY FORMAT
11.1 OVERVIEW
11.2 BULK
11.3 MINI-BULK
11.4 SMALL PACK
11.5 OTHERS
12 U.S. LUBRICANTS MARKET, BY SALES CHANNEL
12.1 OVERVIEW
12.2 AFTERMARKET
12.2.1 VEHICLE SERVICE CENTERS
12.2.2 AUTOMOBILE SPARE PART SHOPS
12.2.3 LUBRICANTS STORES
12.2.3.1 MULTI-BRANDED
12.2.3.2 SINGLE-BRANDED
12.2.3.3 COMPANY-OWNED
12.2.4 HARDWARE AND DIY STORES
12.2.5 GAS STATIONS
12.2.6 ONLINE
12.2.6.1 THIRD PARTY WEBSITES
12.2.6.2 COMPANY-OWNED
12.2.6.2.1 ENGINE OILS
12.2.6.2.2 HYDRAULIC OILS
12.2.6.2.3 CIRCULATION FLUIDS
12.2.6.2.4 GREASE
12.2.6.2.5 GEAR OIL
12.2.6.2.6 COMPRESSOR OILS
12.2.6.2.7 GAS TURBINE OILS
12.2.6.2.8 WIND TURBINE OILS
12.2.6.2.9 HEAT TRANSFER OILS
12.2.6.2.10 RUST PREVENTIVE OILS
12.2.6.2.11 METALWORKING FLUIDS
12.2.6.2.12 PENETRANTS
12.2.6.2.13 OTHERS
12.3 OEM
12.3.1 ENGINE OILS
12.3.2 HYDRAULIC OILS
12.3.3 CIRCULATION FLUIDS
12.3.4 GREASE
12.3.5 GEAR OIL
12.3.6 COMPRESSOR OILS
12.3.7 GAS TURBINE OILS
12.3.8 WIND TURBINE OILS
12.3.9 HEAT TRANSFER OILS
12.3.10 RUST PREVENTIVE OILS
12.3.11 METALWORKING FLUIDS
12.3.12 PENETRANTS
12.3.13 OTHERS
13 U.S. LUBRICANTS MARKET, BY END USE
13.1 OVERVIEW
13.2 AUTOMOBILE & TRANSPORTATION
13.2.1 COMMERCIAL VEHICLES
13.2.1.1 TRUCKS
13.2.1.1.1 HEAVY WEIGHT TRUCKS
13.2.1.1.2 LIGHT WEIGHT TRUCKS
13.2.1.2 BUSES
13.2.1.3 OTHERS
13.2.2 PASSENGER VEHICLES
13.2.2.1 CARS
13.2.2.2 MOTORCYCLES
13.2.2.3 THREE WHEELERS
13.2.2.4 OTHERS
13.3 INDUSTRIAL MRO (MAINTENANCE, REPAIR, AND OPERATIONS)
13.3.1 MANUFACTURING EQUIPMENT
13.3.2 ENERGY AND POWER GENERATION
13.3.3 CONSTRUCTION MACHINERY AND HEAVY EQUIPMENT
13.3.4 INDUSTRIAL MACHINERY
13.3.5 AEROSPACE AND DEFENSE
13.3.6 OTHERS
13.4 MARINE
13.5 METALLURGY AND METALWORKING
13.6 AEROSPACE
13.7 CHEMICAL MANUFACTURING
13.8 FOOD & BEVERAGE (F&B)
13.9 CONSUMER / DIY (DO IT YOURSELF)
13.9.1 PERSONAL VEHICLE MAINTENANCE
13.9.2 HOUSEHOLD/DIY
13.9.3 OTHERS
13.1 OTHERS
13.10.1 TEXTILE
13.10.2 PLASTIC AND RUBBER PROCESSING
13.10.3 PULP & PAPER
13.10.4 OTHERS
14 U.S. LUBRICANTS MARKET: COMPANY LANDSCAPE
14.1 COMPANY SHARE ANALYSIS: U.S.
14.2 COMPANY SHARE ANALYSIS: U.S.
15 SWOT ANALYSIS
16 COMPANY PROFILES
16.1 EXXON MOBIL CORPORATION
16.1.1 COMPANY SNAPSHOT
16.1.2 REVENUE ANALYSIS
16.1.3 PRODUCT PORTFOLIO
16.1.4 RECENT DEVELOPMENTS
16.2 CHEVRON CORPORATION
16.2.1 COMPANY SNAPSHOT
16.2.2 REVENUE ANALYSIS
16.2.3 PRODUCT PORTFOLIO
16.2.4 RECENT DEVELOPMENT
16.3 SHELL PLC
16.3.1 COMPANY SNAPSHOT
16.3.2 RECENT FINANCIALS
16.3.3 PRODUCT PORTFOLIO
16.3.4 RECENT UPDATES
16.4 DUPONT
16.4.1 COMPANY SNAPSHOT
16.4.2 REVENUE ANALYSIS
16.4.3 PRODUCT PORTFOLIO
16.4.4 RECENT DEVELOPMENT
16.5 LUKOIL
16.5.1 COMPANY SNAPSHOT
16.5.2 BRAND PORTFOLIO
16.5.3 RECENT DEVELOPMENTS /NEWS
16.6 BASF
16.6.1 COMPANY SNAPSHOT
16.6.2 REVENUE ANALYSIS
16.6.3 PRODUCT PORTFOLIO
16.6.4 RECENT DEVELOPMENTS/NEWS
16.7 BLUESKY LUBRICANTS
16.7.1 COMPANY SNAPSHOT
16.7.2 PRODUCT PORTFOLIO
16.7.3 RECENT UPDATES
16.8 CARL BECHEM GMBH
16.8.1 COMPANY SNAPSHOT
16.8.2 PRODUCT PORTFOLIO
16.8.3 RECENT DEVELOPMENT
16.9 CASTROL LIMITED
16.9.1 COMPANY SNAPSHOT
16.9.2 PRODUCT PORTFOLIO
16.9.3 RECENT DEVELOPMENT
16.1 ENEOS CORPORATION
16.10.1 COMPANY SNAPSHOT
16.10.2 REVENUE ANALYSIS
16.10.3 PRODUCT PORTFOLIO
16.10.4 RECENT DEVELOPMENT
16.11 ESSEX BROWNELL
16.11.1 COMPANY SNAPSHOT
16.11.2 PRODUCT PORTFOLIO
16.11.3 RECENT DEVELOPMENT
16.12 FUCHS
16.12.1 COMPANY SNAPSHOT
16.12.2 REVENUE ANALYSIS
16.12.3 PRODUCT PORTFOLIO
16.12.4 RECENT DEVELOPMENT/NEWS
16.13 MOTION INDUSTRIES , INC
16.13.1 COMPANY SNAPSHOT
16.13.2 PRODUCT PORTFOLIO
16.13.3 RECENT DEVELOPMENT
16.14 MOTUL
16.14.1 COMPANY SNAPSHOT
16.14.2 PRODUCT PORTFOLIO
16.14.3 RECENT DEVELOPMENT
16.15 MYSTIK LUBRICANTS
16.15.1 COMPANY SNAPSHOT
16.15.2 PRODUCT PORTFOLIO
16.15.3 RECENT DEVELOPMENT
16.16 PHILLIPS 66 COMPANY
16.16.1 COMPANY SNAPSHOT
16.16.2 REVENUE ANALYSIS
16.16.3 PRODUCT PORTFOLIO
16.16.4 RECENT DEVELOPMENT/NEWS
16.17 RED LINE SYNTHETIC OIL CORPORATION
16.17.1 COMPANY SNAPSHOT
16.17.2 PRODUCT PORTFOLIO
16.17.3 RECENT DEVELOPMENT
16.18 RELADYNE LLC.
16.18.1 COMPANY SNAPSHOT
16.18.2 PRODUCT PORTFOLIO
16.18.3 RECENT DEVELOPMENT
16.19 ROYAL PURPLE
16.19.1 COMPANY SNAPSHOT
16.19.2 PRODUCT PORTFOLIO
16.19.3 RECENT UPDATES
16.2 SUN COAST RESOURCES, LLC
16.20.1 COMPANY SNAPSHOT
16.20.2 PRODUCT PORTFOLIO
16.20.3 RECENT DEVELOPMENT
16.21 TOTALENERGIES
16.21.1 COMPANY SNAPSHOT
16.21.2 REVENUE ANALYSIS
16.21.3 PRODUCT PORTFOLIO
16.21.4 RECENT DEVELOPMENT
16.22 VALVOLINE
16.22.1 COMPANY SNAPSHOT
16.22.2 REVENUE ANALYSIS
16.22.3 PRODUCT PORTFOLIO
16.22.4 RECENT DEVELOPMENT
16.23 WD-40
16.23.1 COMPANY SNAPSHOT
16.23.2 REVENUE ANALYSIS
16.23.3 PRODUCT PORTFOLIO
16.23.4 RECENT DEVELOPMENT
17 QUESTIONNAIRE
18 RELATED REPORTS
List of Table
TABLE 1 CONSUMER GROUPS BREAKDOWN
TABLE 2 PREFERENCE CRITERIA ACROSS CONSUMER GROUPS
TABLE 3 REGULATION COVERAGE
TABLE 4 U.S. LUBRICANTS MARKET, BY PRODUCT, 2018-2032 (USD THOUSAND)
TABLE 5 U.S. LUBRICANTS MARKET, BY PRODUCT, 2018-2032 (KILO TONS)
TABLE 6 U.S. LUBRICANTS MARKET, BY PRODUCT, 2018-2032 (USD/KG)
TABLE 7 U.S. ENGINE OILS IN LUBRICANTS MARKET, BY BASE OIL, 2018-2032 (USD THOUSAND)
TABLE 8 U.S. MINERAL OIL IN LUBRICANTS MARKET, BY TYPE, 2018-2032 (USD THOUSAND)
TABLE 9 U.S. SYNTHETIC OIL IN LUBRICANTS MARKET, BY TYPE, 2018-2032 (USD THOUSAND)
TABLE 10 U.S. ENGINE OILS IN LUBRICANTS MARKET, BY GRADE 2018-2032 (USD THOUSAND)
TABLE 11 U.S. ENGINE OILS IN LUBRICANTS MARKET, BY CATEGORY 2018-2032 (USD THOUSAND)
TABLE 12 U.S. HYDRAULIC OILS IN LUBRICANTS MARKET, BY BASE OIL, 2018-2032 (USD THOUSAND)
TABLE 13 U.S. MINERAL OIL IN LUBRICANTS MARKET, BY TYPE, 2018-2032 (USD THOUSAND)
TABLE 14 U.S. SYNTHETIC OIL IN LUBRICANTS MARKET, BY TYPE, 2018-2032 (USD THOUSAND)
TABLE 15 U.S. HYDRAULIC OILS IN LUBRICANTS MARKET, BY GRADE 2018-2032 (USD THOUSAND)
TABLE 16 U.S. CIRCULATION FLUIDS IN LUBRICANTS MARKET, BY BASE OIL, 2018-2032 (USD THOUSAND)
TABLE 17 U.S. MINERAL OIL IN LUBRICANTS MARKET, BY TYPE, 2018-2032 (USD THOUSAND)
TABLE 18 U.S. SYNTHETIC OIL IN LUBRICANTS MARKET, BY TYPE, 2018-2032 (USD THOUSAND)
TABLE 19 U.S. CIRCULATION FLUIDS IN LUBRICANTS MARKET, BY GRADE 2018-2032 (USD THOUSAND)
TABLE 20 U.S. GEAR OIL IN LUBRICANTS MARKET, BY BASE OIL, 2018-2032 (USD THOUSAND)
TABLE 21 U.S. MINERAL OIL IN LUBRICANTS MARKET, BY TYPE, 2018-2032 (USD THOUSAND)
TABLE 22 U.S. SYNTHETIC OIL IN LUBRICANTS MARKET, BY TYPE, 2018-2032 (USD THOUSAND)
TABLE 23 U.S. GEAR OILS IN LUBRICANTS MARKET, BY GRADE 2018-2032 (USD THOUSAND)
TABLE 24 U.S. GREASE IN LUBRICANTS MARKET, BY TYPE, 2018-2032 (USD THOUSAND)
TABLE 25 U.S. GREASE IN LUBRICANTS MARKET, BY BASE OIL, 2018-2032 (USD THOUSAND)
TABLE 26 U.S. MINERAL OIL IN LUBRICANTS MARKET, BY TYPE, 2018-2032 (USD THOUSAND)
TABLE 27 U.S. SYNTHETIC OIL IN LUBRICANTS MARKET, BY TYPE, 2018-2032 (USD THOUSAND)
TABLE 28 U.S. GREASE IN LUBRICANTS MARKET, BY GRADE 2018-2032 (USD THOUSAND)
TABLE 29 U.S. METALWORKING FLUIDS IN LUBRICANTS MARKET, BY BASE OIL, 2018-2032 (USD THOUSAND)
TABLE 30 U.S. MINERAL OIL IN LUBRICANTS MARKET, BY TYPE, 2018-2032 (USD THOUSAND)
TABLE 31 U.S. SYNTHETIC OIL IN LUBRICANTS MARKET, BY TYPE, 2018-2032 (USD THOUSAND)
TABLE 32 U.S. METALWORKING FLUIDS IN LUBRICANTS MARKET, BY GRADE 2018-2032 (USD THOUSAND)
TABLE 33 U.S. WIND TURBINE OILS IN LUBRICANTS MARKET, BY BASE OIL, 2018-2032 (USD THOUSAND)
TABLE 34 U.S. MINERAL OIL IN LUBRICANTS MARKET, BY TYPE, 2018-2032 (USD THOUSAND)
TABLE 35 U.S. SYNTHETIC OIL IN LUBRICANTS MARKET, BY TYPE, 2018-2032 (USD THOUSAND)
TABLE 36 U.S. WIND TURBINE OILS IN LUBRICANTS MARKET, BY GRADE 2018-2032 (USD THOUSAND)
TABLE 37 U.S. COMPRESSOR OILS IN LUBRICANTS MARKET, BY BASE OIL, 2018-2032 (USD THOUSAND)
TABLE 38 U.S. MINERAL OIL IN LUBRICANTS MARKET, BY TYPE, 2018-2032 (USD THOUSAND)
TABLE 39 U.S. SYNTHETIC OIL IN LUBRICANTS MARKET, BY TYPE, 2018-2032 (USD THOUSAND)
TABLE 40 U.S. COMPRESSOR OILS IN LUBRICANTS MARKET, BY GRADE 2018-2032 (USD THOUSAND)
TABLE 41 U.S. GAS TURBINE OILS IN LUBRICANTS MARKET, BY BASE OIL, 2018-2032 (USD THOUSAND)
TABLE 42 U.S. MINERAL OIL IN LUBRICANTS MARKET, BY TYPE, 2018-2032 (USD THOUSAND)
TABLE 43 U.S. SYNTHETIC OIL IN LUBRICANTS MARKET, BY TYPE, 2018-2032 (USD THOUSAND)
TABLE 44 U.S. GAS TURBINE OILS IN LUBRICANTS MARKET, BY GRADE 2018-2032 (USD THOUSAND)
TABLE 45 U.S. HEAT TRANSFER OILS IN LUBRICANTS MARKET, BY BASE OIL, 2018-2032 (USD THOUSAND)
TABLE 46 U.S. MINERAL OIL IN LUBRICANTS MARKET, BY TYPE, 2018-2032 (USD THOUSAND)
TABLE 47 U.S. SYNTHETIC OIL IN LUBRICANTS MARKET, BY TYPE, 2018-2032 (USD THOUSAND)
TABLE 48 U.S. HEAT TRANSFER OILS IN LUBRICANTS MARKET, BY GRADE 2018-2032 (USD THOUSAND)
TABLE 49 U.S. RUST PREVENTIVE OILS IN LUBRICANTS MARKET, BY BASE OIL, 2018-2032 (USD THOUSAND)
TABLE 50 U.S. MINERAL OIL IN LUBRICANTS MARKET, BY TYPE, 2018-2032 (USD THOUSAND)
TABLE 51 U.S. SYNTHETIC OIL IN LUBRICANTS MARKET, BY TYPE, 2018-2032 (USD THOUSAND)
TABLE 52 U.S. RUST PREVENTIVE OILS IN LUBRICANTS MARKET, BY GRADE 2018-2032 (USD THOUSAND)
TABLE 53 U.S. PENETRANTS IN LUBRICANTS MARKET, BY BASE OIL, 2018-2032 (USD THOUSAND)
TABLE 54 U.S. MINERAL OIL IN LUBRICANTS MARKET, BY TYPE, 2018-2032 (USD THOUSAND)
TABLE 55 U.S. SYNTHETIC OIL IN LUBRICANTS MARKET, BY TYPE, 2018-2032 (USD THOUSAND)
TABLE 56 U.S. PENETRANTS IN LUBRICANTS MARKET, BY GRADE 2018-2032 (USD THOUSAND)
TABLE 57 U.S. OTHERS IN LUBRICANTS MARKET, BY BASE OIL, 2018-2032 (USD THOUSAND)
TABLE 58 U.S. MINERAL OIL IN LUBRICANTS MARKET, BY TYPE, 2018-2032 (USD THOUSAND)
TABLE 59 U.S. SYNTHETIC OIL IN LUBRICANTS MARKET, BY TYPE, 2018-2032 (USD THOUSAND)
TABLE 60 U.S. OTHERS IN LUBRICANTS MARKET, BY GRADE 2018-2032 (USD THOUSAND)
TABLE 61 U.S. LUBRICANTS MARKET, BY BASE OIL, 2018-2032 (USD THOUSAND)
TABLE 62 U.S. MINERAL OIL IN LUBRICANTS MARKET, BY TYPE, 2018-2032 (USD THOUSAND)
TABLE 63 U.S. MINERAL OIL IN LUBRICANTS MARKET, BY TYPE, 2018-2032 (USD THOUSAND)
TABLE 64 U.S. LUBRICANTS MARKET, BY GRADE, 2018-2032 (USD THOUSAND)
TABLE 65 U.S. LUBRICANTS MARKET, BY FORMAT, 2018-2032 (USD THOUSAND)
TABLE 66 U.S. LUBRICANTS MARKET, BY SALES CHANNEL, 2018-2032 (USD THOUSAND)
TABLE 67 U.S. AFTERMARKET IN LUBRICANTS MARKET, BY CATEGORY, 2018-2032 (USD THOUSAND)
TABLE 68 U.S. LUBRICANTS STORES IN LUBRICANTS MARKET, BY TYPE, 2018-2032 (USD THOUSAND)
TABLE 69 U.S. ONLINE IN LUBRICANTS MARKET, BY TYPE, 2018-2032 (USD THOUSAND)
TABLE 70 U.S. AFTERMARKET IN LUBRICANTS MARKET, BY PRODUCT, 2018-2032 (USD THOUSAND)
TABLE 71 U.S. OEM IN LUBRICANTS MARKET, BY PRODUCT, 2018-2032 (USD THOUSAND)
TABLE 72 U.S. LUBRICANTS MARKET, BY END-USE, 2018-2032 (USD THOUSAND)
TABLE 73 U.S. AUTOMOBILE & TRANSPORTATION IN LUBRICANTS MARKET, BY VEHICLE TYPE, 2018-2032 (USD THOUSAND)
TABLE 74 U.S. COMMERCIAL VEHICLES IN LUBRICANTS MARKET, BY TYPE, 2018-2032 (USD THOUSAND)
TABLE 75 U.S. TRUCKS IN LUBRICANTS MARKET, BY TYPE, 2018-2032 (USD THOUSAND)
TABLE 76 U.S. PASSENGER VEHICLES IN LUBRICANTS MARKET, BY TYPE, 2018-2032 (USD THOUSAND)
TABLE 77 U.S. INDUSTRIAL MRO (MAINTENANCE, REPAIR, AND OPERATIONS) IN LUBRICANTS MARKET, BY TYPE, 2018-2032 (USD THOUSAND)
TABLE 78 U.S. CONSUMER / DIY (DO IT YOURSELF) IN LUBRICANTS MARKET, BY TYPE, 2018-2032 (USD THOUSAND)
TABLE 79 U.S. OTHERS IN LUBRICANTS MARKET, BY TYPE, 2018-2032 (USD THOUSAND)
List of Figure
FIGURE 1 U.S. LUBRICANTS MARKET: SEGMENTATION
FIGURE 2 U.S. LUBRICANTS MARKET: DATA TRIANGULATION
FIGURE 3 U.S. LUBRICANTS MARKET: DROC ANALYSIS
FIGURE 4 U.S. LUBRICANTS MARKET: COUNTRY-WISE MARKET ANALYSIS
FIGURE 5 U.S. LUBRICANTS MARKET: COMPANY RESEARCH ANALYSIS
FIGURE 6 U.S. LUBRICANTS MARKET: INTERVIEW DEMOGRAPHICS
FIGURE 7 U.S. LUBRICANTS MARKET: DBMR MARKET POSITION GRID
FIGURE 8 U.S. LUBRICANTS MARKET: MARKET END-USE COVERAGE GRID
FIGURE 9 EXECUTIVE SUMMARY U.S. LUBRICANTS MARKET
FIGURE 10 STRATEGIC DECISIONS
FIGURE 11 THE ENGINE OILS SEGMENT IS EXPECTED TO ACCOUNT FOR THE LARGEST SHARE OF THE U.S. LUBRICANTS MARKET
FIGURE 12 U.S. LUBRICANTS MARKET: SEGMENTATION
FIGURE 13 THE SURGE IN VEHICLE MANUFACTURING AND SALES IS EXPECTED TO DRIVE THE GROWTH OF THE U.S. LUBRICANTS MARKET IN THE FORECAST PERIOD FROM 2025 TO 2032
FIGURE 14 THE ENGINE OILS SEGMENT IS EXPECTED TO ACCOUNT FOR THE LARGEST SHARE OF THE U.S. LUBRICANTS MARKET IN 2025 AND 2032
FIGURE 15 PORTER’S FIVE FORCES ANALYSIS
FIGURE 16 BRAND OUTLOOK
FIGURE 17 PRODUCTION CONSUMPTION ANALYSIS
FIGURE 18 U.S. LUBRICANTS MARKET, 2023-2032, AVERAGE SELLING PRICE (USD/KG)
FIGURE 19 NUMBER OF PATENTS BY THE APPLICANTS
FIGURE 20 PUBLICATIONS DATE
FIGURE 21 VENDOR SELECTION CRITERIA
FIGURE 22 DRIVERS, RESTRAINTS, OPPORTUNITIES, AND CHALLENGES OF THE U.S. LUBRICANTS MARKET
FIGURE 23 UNITED STATES MOTOR VEHICLE SALES: PASSENGER CARS FROM 2020 TO 2024
FIGURE 24 U.S. LUBRICANTS MARKET: BY PRODUCT, 2024
FIGURE 25 U.S. LUBRICANTS MARKET: BY BASE OIL, 2024
FIGURE 26 U.S. LUBRICANTS MARKET: BY GRADE, 2024
FIGURE 27 U.S. LUBRICANTS MARKET: BY FORMAT, 2024
FIGURE 28 U.S. LUBRICANTS MARKET: BY SALES CHANNEL, 2024
FIGURE 29 U.S. LUBRICANTS MARKET: BY END USE, 2024
FIGURE 30 U.S. : COMPANY SHARE 2024 (%) (MANUFACTURER)
FIGURE 31 U.S. : COMPANY SHARE 2024 (%) (DISTRIBUTOR)
Us Lubricants Market, Supply Chain Analysis and Ecosystem Framework
To support market growth and help clients navigate the impact of geopolitical shifts, DBMR has integrated in-depth supply chain analysis into its Us Lubricants Market research reports. This addition empowers clients to respond effectively to global changes affecting their industries. The supply chain analysis section includes detailed insights such as Us Lubricants Market consumption and production by country, price trend analysis, the impact of tariffs and geopolitical developments, and import and export trends by country and HSN code. It also highlights major suppliers with data on production capacity and company profiles, as well as key importers and exporters. In addition to research, DBMR offers specialized supply chain consulting services backed by over a decade of experience, providing solutions like supplier discovery, supplier risk assessment, price trend analysis, impact evaluation of inflation and trade route changes, and comprehensive market trend analysis.
Data collection and base year analysis are done using data collection modules with large sample sizes. The stage includes obtaining market information or related data through various sources and strategies. It includes examining and planning all the data acquired from the past in advance. It likewise envelops the examination of information inconsistencies seen across different information sources. The market data is analysed and estimated using market statistical and coherent models. Also, market share analysis and key trend analysis are the major success factors in the market report. To know more, please request an analyst call or drop down your inquiry.
The key research methodology used by DBMR research team is data triangulation which involves data mining, analysis of the impact of data variables on the market and primary (industry expert) validation. Data models include Vendor Positioning Grid, Market Time Line Analysis, Market Overview and Guide, Company Positioning Grid, Patent Analysis, Pricing Analysis, Company Market Share Analysis, Standards of Measurement, Global versus Regional and Vendor Share Analysis. To know more about the research methodology, drop in an inquiry to speak to our industry experts.
Data Bridge Market Research is a leader in advanced formative research. We take pride in servicing our existing and new customers with data and analysis that match and suits their goal. The report can be customized to include price trend analysis of target brands understanding the market for additional countries (ask for the list of countries), clinical trial results data, literature review, refurbished market and product base analysis. Market analysis of target competitors can be analyzed from technology-based analysis to market portfolio strategies. We can add as many competitors that you require data about in the format and data style you are looking for. Our team of analysts can also provide you data in crude raw excel files pivot tables (Fact book) or can assist you in creating presentations from the data sets available in the report.


