
Us Mug Market
Market Size in USD Billion
 USD
8.53 Billion
USD
12.38 Billion
2025
2033
USD
8.53 Billion
USD
12.38 Billion
2025
2033
| 2026 - 2033 | |
| USD 8.53 Billion | |
| USD 12.38 Billion | |
| % | |
|
What is the U.S. Mug Market Size and Overview?
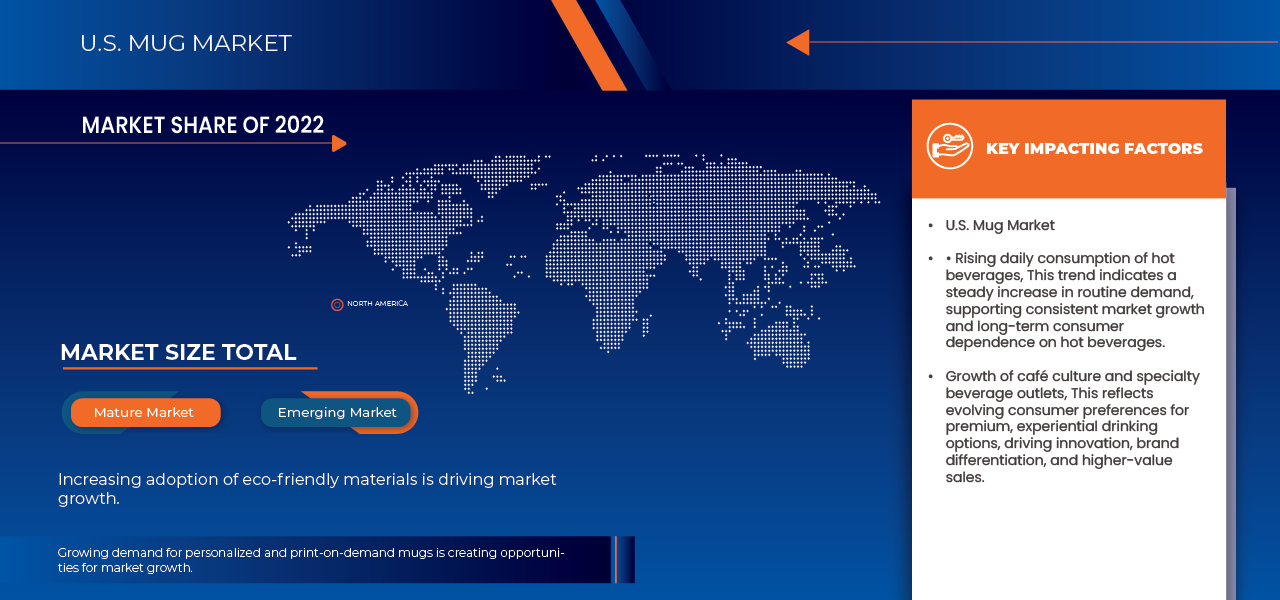
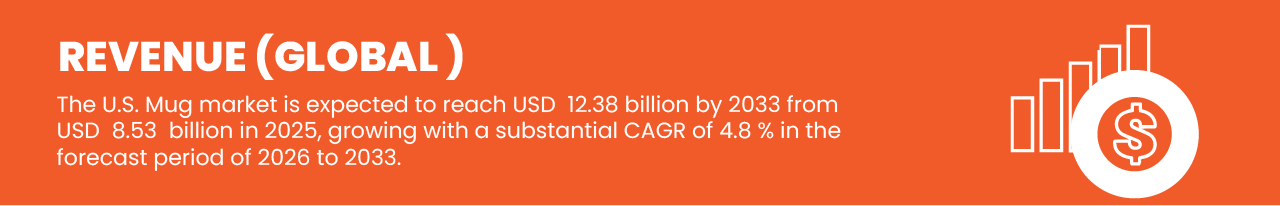
- As per Data Bridge Market Research Analysis the U.S. Mug Market size was valued at USD 8.53 Billion in 2025 and is expected to reach USD 12.38 Billion by 2033, at a CAGR of 4.8% during the forecast period
- The mug market is rapidly expanding due to rising consumer demand for functional, durable, and aesthetically appealing drinkware, along with increasing adoption across household and commercial settings, which is driving market penetration globally.
- Furthermore, the market is expected to grow due to the growing preference for customized and sustainable mugs, coupled with advancements in material technology and smart/insulated mug designs.
Market Size & Forecast
- U.S.Market Value (2025):USD 8.53 Billion
- Expected Market Value (2033): USD 12.38 Billion
- Forecast CAGR (2025 –2033): 4.8%
U.S. Mug Market Analysis
- Rising urbanization, changing consumer lifestyles, and increasing demand for premium, functional, and customizable drinkware are key driving factors expected to propel the growth of the U.S. mug market.
- Key factors such as technological innovations, including vacuum-insulated designs, smart temperature-control features, sustainable materials, and advanced manufacturing techniques, are broadening product applications and driving the growth of the U.S. mug market.
- Technological advancements in materials and design, including lightweight composites, ergonomic construction, and enhanced durability features, are improving product functionality and user comfort in the U.S. mug market, supporting premiumization and product innovation.
- The growing adoption of digital sales channels, including e-commerce platforms and direct-to-consumer models, is expanding market accessibility and enabling brands to reach both commercial buyers and individual consumers more efficiently.
- Sustainability and eco-design trends are increasingly influencing product development, with manufacturers adopting recycled materials, environmentally responsible sourcing, and energy-efficient production processes to align with evolving consumer preferences and corporate ESG objectives.
- In 2026, the Classic Mug segment is expected to dominate the U.S. mug market with a market share of 26.37%, growing at a CAGR of 5.1% during the forecast period of 2026 to 2033, driven by the Classic Mug’s widespread consumer preference, durability, heat retention properties, affordability, and suitability for both household and commercial use.
Report Scope and U.S. Mug Market Segmentation
|
Attributes |
U.S. Mug Market |
|
Segments Covered |
|
|
Countries Covered |
|
|
Key Market Players |
|
|
Market Opportunities |
|
|
Value Added Data Infosets |
|
What is the Key Trend in the U.S. Mug Market?
“Rising daily consumption of hot beverages”
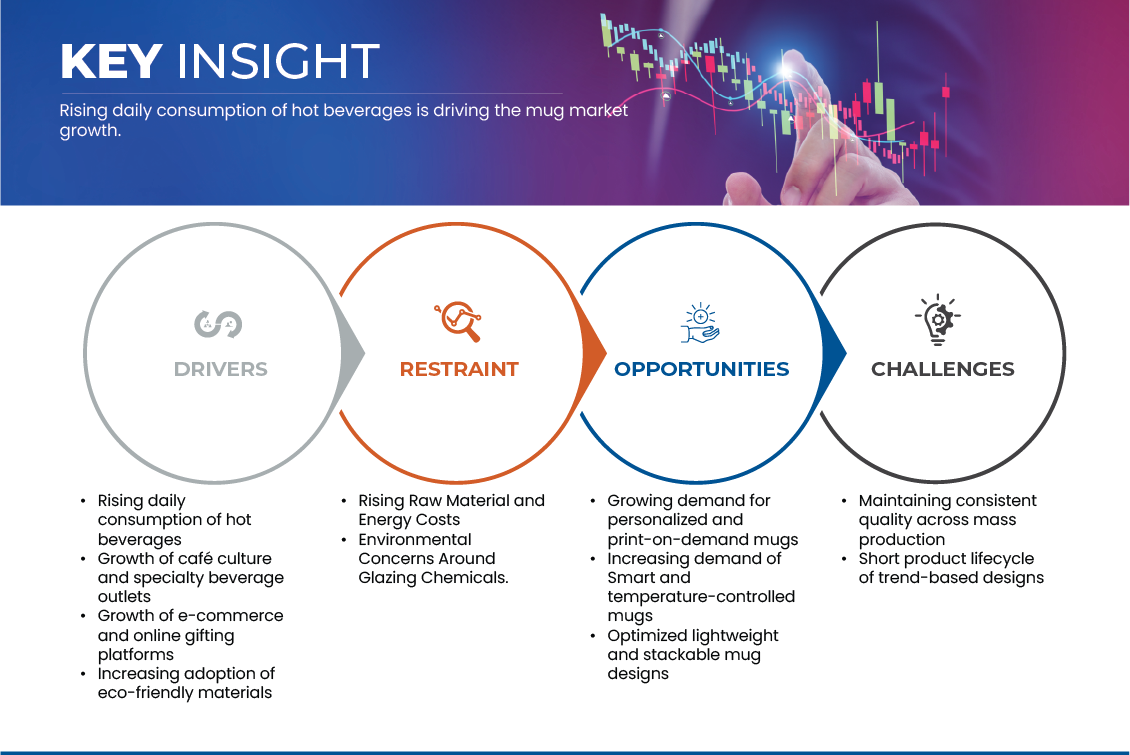
- The rising daily consumption of hot beverages is driving demand for high-quality mugs that offer durability, heat retention, and ergonomic designs, enhancing the overall drinking experience.
- Consumers are increasingly seeking mugs that support convenience, portability, and personalization, reflecting lifestyle preferences and daily routines.
- Expanding use across households, offices, and commercial settings is boosting adoption, supported by innovations in materials, insulation technologies, and smart/interactive mug features.
- The growing focus on sustainability, premium designs, and customization reinforces the demand for mugs, as they cater to consumer preferences, improve user satisfaction, and align with modern lifestyle trends.
U.S. Mug Market Dynamics
Driver
“Growth of Cafe Culture and Specialty Beverage Outlets”
- The growth of cafe culture and specialty beverage outlets is driving demand for innovative and premium mugs, as these establishments seek to enhance the customer experience and differentiate their offerings.
- High-quality mugs not only improve the presentation and enjoyment of beverages but also support brand identity and consumer engagement. With increasing consumer preference for specialty coffees, teas, and artisanal drinks, the demand for functional, durable, and aesthetically appealing mugs has surged. The trend is accelerating rapidly, and mugs with advanced materials, insulation, and customization options hold significant potential for future adoption in cafes and specialty beverage outlets.
For instance,
- In January 2026, Dutch Bros’ acquisition of Clutch Coffee Bar highlights strategic consolidation in the U.S. drive-thru specialty coffee segment, allowing the brand to expand its regional footprint and capture a larger share of café consumers. This expansion of café outlets directly drives demand for mugs, as increased store presence and customer visits create more opportunities for in-store beverage consumption and branded merchandise sales, reinforcing café culture.
- In January 2026, Major branded chains in the U.S., including 7 Brew, Scooter’s Coffee, and Dutch Bros, are rapidly expanding their footprints and appearing on national industry favorite lists, reflecting strong consumer preference for specialty coffee experiences. This growth in café outlets directly drives the mug market, as increased in-store and takeaway beverage consumption boosts demand for durable, branded, and aesthetically appealing mugs across both commercial and retail channels.
- In September 2025, Starbucks’ refreshed growth strategy to uplift and expand more than 1,000 U.S. coffeehouse locations highlights the strengthening café culture in the country. By enhancing in-store experiences, seating formats, and beverage offerings, Starbucks is encouraging higher footfall and longer customer dwell time. This directly supports mug demand, as increased dine-in consumption and branded serveware usage drive consistent demand for durable and visually appealing mugs in the U.S. market.
- In September 2025, Black Rock Coffee Bar’s U.S. IPO which raised approximately $294 million, reflects strong investor confidence in the continued expansion of café culture and specialty beverage outlets in the U.S. The capital raised is expected to support outlet expansion, brand visibility, and customer experience enhancements. This growth directly drives demand for mugs, as expanding café networks increase in-store beverage consumption and branded drinkware usage.
Restraint/Challenge
“Environmental Concerns Around Glazing Chemicals”
- The use of certain glazing chemicals in mug production has raised environmental and health concerns, which have begun to impact manufacturing practices and regulatory scrutiny. While glazed mugs offer aesthetic appeal and durability, the potential toxicity and ecological impact of some chemical compounds—particularly heavy metals and lead-based glazes—pose challenges for sustainable production.
- These environmental concerns are influencing consumer preferences, prompting stricter regulations, and encouraging manufacturers to adopt safer, eco-friendly glazing alternatives. Multiple studies and industry reports highlight the growing importance of sustainability in shaping production standards and market adoption.
For instance,
- In January 2025, the FDA updated its regulations on lead in food and foodwares, emphasizing monitoring of ceramicware where lead can leach into beverages and food. This highlights a significant restraint for the U.S. mug market, as manufacturers must ensure their products meet strict safety limits to avoid regulatory penalties. The requirement increases production costs and limits material choices, thereby constraining market growth and innovation in ceramic mugs.
- In November 2024, a consumer alert highlighted that several unlabeled ceramic mugs contained unsafe levels of lead and cadmium, raising serious health concerns. This news directly relates to the restraint of environmental concerns around glazing chemicals in the U.S. mug market. It demonstrates how the presence of toxic substances in ceramic glazes can limit product adoption, trigger regulatory scrutiny, and compel manufacturers to adopt safer, costlier alternatives, thereby restricting market growth and operational flexibility.
- In 2025, the FDA emphasized strict food-contact compliance requirements for ceramic mugs sold or imported in the U.S., highlighting mandatory heavy metal migration testing for lead and cadmium. This underscores the environmental and health concerns associated with glazing chemicals, as non-compliant products can pose safety risks. Consequently, manufacturers face higher compliance costs, limited material choices, and stricter production controls, making environmental regulations a key restraint in the U.S. mug market.
U.S. Mug Market Scope
The U.S. Mug Market is segmented into eight segments based on type, core materials, capacity, structural construction/thermal architecture, customization capability, feature & technology, end user, and distribution channel.
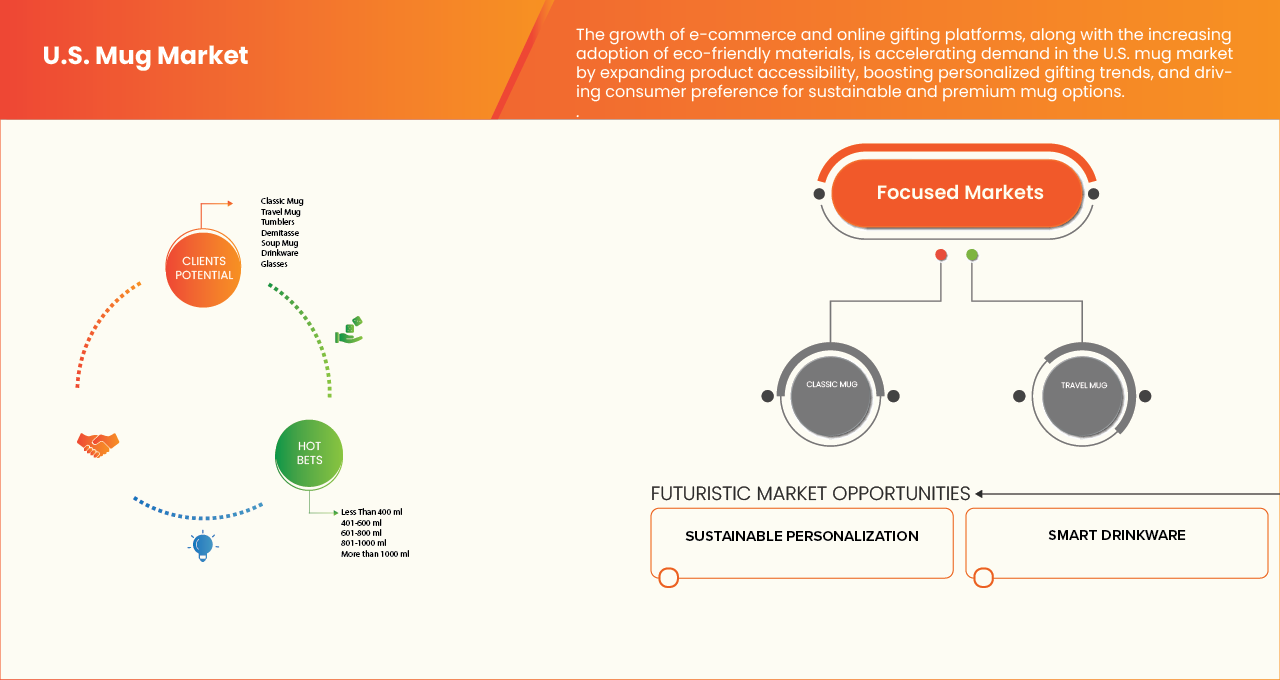
- By Type
On the basis of type, the market is segmented into Classic Mug, Travel Mug, Tumblers, Demitasse, Soup Mug, Drinkware, Glasses, and Others. In 2026, the Classic Mug segment is expected to dominate the market with a share of 26.37%, driven by high consumer preference, durability, heat retention properties, and affordability. The segment benefits from widespread use in households, offices, and cafes, as well as growing adoption of advanced mug designs and customization options.
In 2026, the Classic Mug segment is expected to dominate the U.S. mug market with a 26.37% share, driven by its widespread adoption in households, cafes, restaurants, and offices. Its popularity is supported by its durability, ergonomic design, and ease of use, making it a staple for daily hot beverage consumption. In addition to holding the largest market share, the Classic Mug segment is also among the fastest-growing, fueled by increasing demand for customizable, printed, and eco-friendly mugs that cater to both personal use and corporate gifting.
- By Core Material Composition
On the basis of core materials, the market is segmented into Ceramic-Based, Glass-Based, Metal-Based, Polymer-Based, and Bio-Composite/Sustainable Materials. In 2026, the Ceramic-Based segment is expected to dominate the market with a share of 46.31%, driven by its durability, heat retention properties, affordability, and widespread consumer preference. The segment benefits from extensive use in households, offices, and cafes, as well as growing adoption of advanced ceramic mug designs and sustainable manufacturing practices.
In 2026, the Ceramic-Based segment is expected to dominate the U.S. mug market with a 46.31% share, driven by its widespread adoption in households, cafes, restaurants, and offices. Its popularity is supported by its excellent heat retention, durability, and classic appeal, making it a preferred choice for daily hot beverage consumption. In addition to holding the largest market share, the Ceramic-Based segment is also among the fastest-growing, fueled by increasing demand for premium, artisanal, and eco-friendly ceramic mugs that cater to both personal use and corporate gifting.
- By Capacity
On the basis of capacity, the U.S. Mug Market is segmented into Less Than 400 ml, 401–600 ml, 601–800 ml, 801–1000 ml, and More Than 1000 ml. In 2026, the Less Than 400 ml segment is expected to dominate the market with a share of 34.02%, driven by high consumer preference for compact, convenient mugs suitable for daily use, portability, and ease of handling. The segment benefits from widespread adoption in households, offices, and cafes, as well as growing demand for durable and customizable mugs that enhance the beverage experience.
In 2026, the Less Than 400 ml capacity segment is expected to dominate the U.S. mug market with a 34.02% share, driven by its widespread use in households, cafes, restaurants, and offices. Its popularity is supported by its convenient size, ease of handling, and suitability for single servings of hot beverages, making it ideal for daily consumption. In addition to holding the largest market share, the Less Than 400 ml segment is also among the fastest-growing, fueled by increasing demand for compact, portable, and customizable mugs that cater to both personal use and gifting purposes.
- By Structural Construction / Thermal Architecture
On the basis of structural construction and thermal architecture, the U.S. Mug Market is segmented into Single-Wall Construction, Double-Wall (Non-Vacuum), Vacuum-Insulated, and Specialty Structural Builds. In 2026, the Single-Wall Construction segment is expected to dominate the market with a share of 44.10%, driven by its affordability, lightweight design, and widespread consumer preference for everyday use. The segment benefits from extensive adoption in households, offices, and cafes, as well as the growing demand for durable and easy-to-use mugs suitable for a variety of beverages.
In 2026, the Single-Wall Construction segment is expected to dominate the U.S. mug market with a 44.10% share, driven by its widespread use in households, cafes, restaurants, and offices. Its popularity is supported by its lightweight design, ease of cleaning, and cost-effectiveness, making it a practical choice for everyday hot beverage consumption. In addition to holding the largest market share, the Single-Wall Construction segment is also among the fastest-growing, fueled by increasing demand for durable, customizable, and ergonomically designed mugs that cater to both personal use and corporate gifting.
- By Customization Capability
On the basis of customization capability, the U.S. Mug Market is segmented into Surface-Level Customization, Structural Customization, and Artisanal Customization. In 2026, the Surface-Level Customization segment is expected to dominate the market with a share of 58.38%, driven by its affordability, ease of personalization, and popularity among consumers for gifts, promotions, and everyday use. The segment benefits from widespread adoption in households, offices, and cafes, as well as growing demand for mugs with printed designs, logos, and other customizable features that enhance user engagement and brand visibility.
In 2026, the Surface-Level Customization segment is expected to dominate the U.S. mug market with a 58.38% share, driven by its popularity for printed graphics, text, color overlays, and heat-reactive coatings. Its widespread adoption across households, cafes, restaurants, and offices is supported by the growing demand for personalized mugs for gifting, promotions, and personal use. In addition to holding the largest market share, the Surface-Level Customization segment is also among the fastest-growing, fueled by increasing consumer interest in unique, branded, and eco-friendly designs that enhance both aesthetics and functionality.
- By Feature & Technology
On the basis of feature and technology, the U.S. Mug Market is segmented into Usability & Ergonomics, Safety & Compliance, and Smart & Interactive Features. In 2026, the Usability & Ergonomics segment is expected to dominate the market with a share of 46.87%, driven by its focus on user comfort, ease of handling, and practical design for daily beverage consumption. The segment benefits from widespread adoption in households, offices, and cafes, as well as increasing demand for mugs that combine convenience with functional design, enhancing the overall drinking experience.
In 2026, the Usability & Ergonomics segment is expected to dominate the U.S. mug market with a 46.87% share, driven by its focus on easy-to-hold designs, comfortable grips, and user-friendly features. Its widespread adoption across households, cafes, restaurants, and offices is supported by the growing demand for mugs that enhance daily beverage consumption through practical and ergonomic design. In addition to holding the largest market share, the Usability & Ergonomics segment is also among the fastest-growing, fueled by increasing consumer preference for functional, durable, and well-designed mugs that combine convenience with aesthetic appeal.
- By end user
On the basis of end user, the U.S. Mug Market is segmented into Commercial and Household/Residential. In 2026, the Commercial segment is expected to dominate the market with a share of 75.71%, driven by widespread usage in offices, cafes, restaurants, and other commercial establishments. The segment benefits from high demand for durable, customizable, and ergonomic mugs that enhance the customer experience, support bulk purchases, and cater to professional environments, reinforcing its strong market position.
In 2026, the Commercial segment is expected to dominate the U.S. mug market with a 75.71% share, driven by its extensive use in cafes, restaurants, hotels, offices, and other commercial establishments. The segment’s dominance is supported by the demand for durable, high-capacity, and ergonomically designed mugs that meet the needs of high-traffic environments. In addition to holding the largest market share, the Commercial segment is also among the fastest-growing, fueled by the expansion of the foodservice industry, specialty beverage outlets, and corporate gifting programs.
- By distribution channel
On the basis of distribution channel, the U.S. Mug Market is segmented into Offline and Online channels. In 2026, the Offline segment is expected to dominate the market with a share of 69.44%, driven by strong consumer preference for in-store purchases, the ability to physically examine product quality, and the availability of a wide range of mug designs and customizations. The segment benefits from established retail networks, high footfall in department stores, specialty shops, and cafes, as well as continued demand for bulk and gift purchases, reinforcing its leading position in the market.
In 2026, the Offline segment is expected to dominate the U.S. mug market with a 69.44% share, driven by strong sales through wholesalers, specialty stores, supermarkets, and convenience stores. Its dominance is supported by the preference of commercial and household buyers for in-person product evaluation, bulk purchasing, and immediate availability. In addition to holding the largest market share, the Offline segment continues to grow steadily, supported by established retail networks and the expansion of point-of-sale experiences that enhance customer engagement and brand visibility.
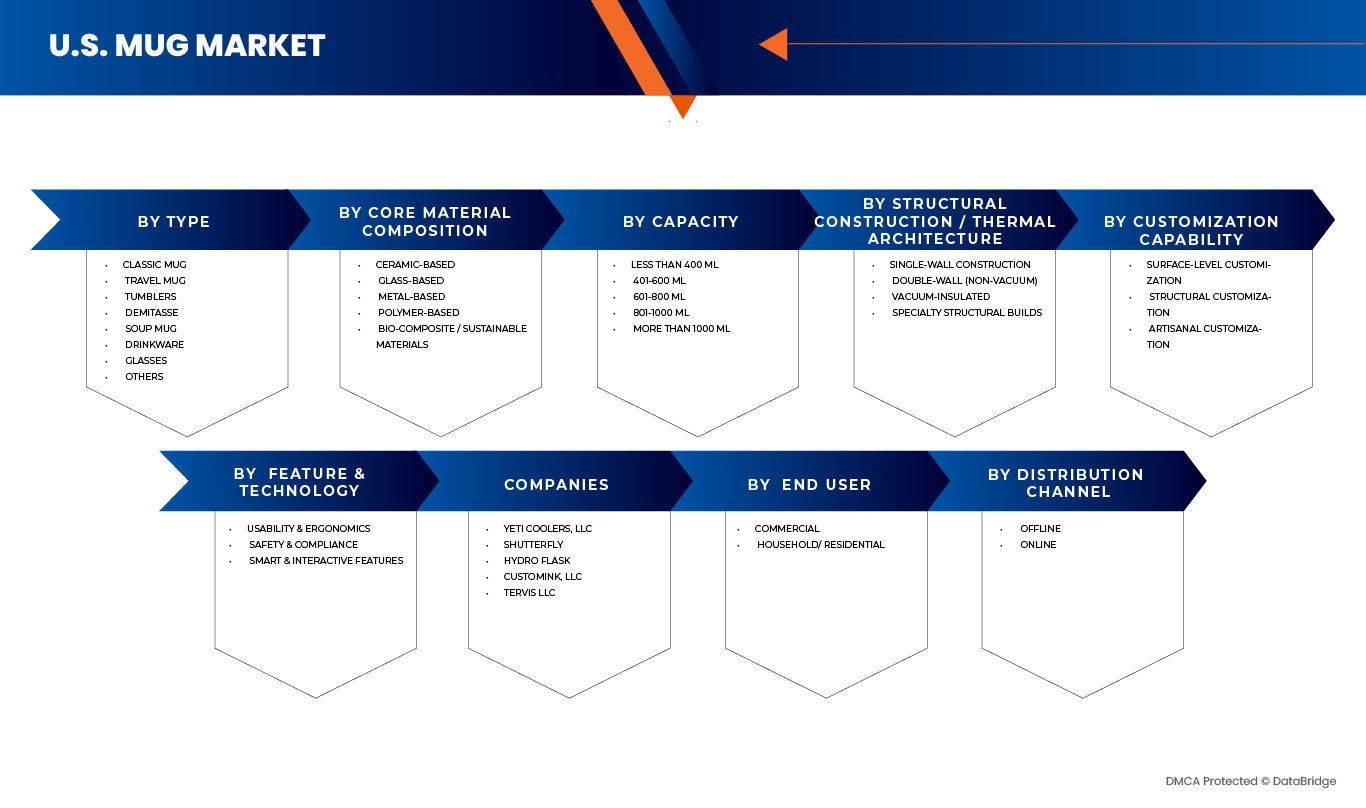
Which are the Top Companies in U.S. Mug Market?
The U.S. Mug Market is primarily led by well-established companies, including:
- YETI Coolers, LLC (U.S.)
- Shutterfly, Inc. (U.S.)
- Hydro Flask (U.S.)
- CustomInk, LLC (U.S.)
- Tervis LLC (U.S.)
- All American Roughneck (U.S.)
- Bauer Pottery (U.S.)
- Bennington Potters (U.S.)
- Clay Factor LLC (U.S.)
- Deneen Pottery (U.S.)
- East Fork (U.S.)
- Ember Technologies, Inc. (U.S.)
- Emerson Creek Pottery, Inc. (U.S.)
- Grey Fox Pottery (U.S.)
- MugFactory USA (U.S.)
- Notary Ceramics LLC (U.S.)
- PMI WW Brands, LLC (U.S.)
- Rowe Pottery (U.S.)
- Wincraft, Inc. (U.S.)
- Zak Designs, Inc. (U.S.)
Latest Developments in U.S. Mug Market
- In October 2025, Shutterfly Inc. named Emily Whittaker as Chief Executive Officer, succeeding the previous CEO and taking the helm of the company to lead its strategic direction, operational execution, and growth initiatives across its personalized products, digital services, and expanded brand portfolio. The appointment was positioned to support Shutterfly’s evolution in digital engagement, customer experience, and long-term value creation for stakeholders.
- In January 2024, YETI acquired Butter Pat Industries, LLC, a premium cast-iron cookware brand, integrating Butter Pat’s products into its outdoor lifestyle portfolio to extend YETI’s capabilities in the cookware category and support broader product innovation.
- In September 2024, Tervis LLC and Koozie Group announced a new exclusive partnership in the promotional products industry, where Koozie Group will become the sole partner responsible for selling and distributing Tervis promotional drinkware to distributors.
- In May 2024, Custom Ink, the U.S.‑based custom products and apparel company, announced a leadership expansion by appointing three senior executives to its C‑suite reporting directly to CEO David Doctorow.
SKU-

- Interactive Data Analysis Dashboard
- Company Analysis Dashboard for high growth potential opportunities
- Research Analyst Access for customization & queries
- Competitor Analysis with Interactive dashboard
- Latest News, Updates & Trend analysis
- Harness the Power of Benchmark Analysis for Comprehensive Competitor Tracking
Table of Content
1 INTRODUCTION
1.1 OBJECTIVES OF THE STUDY
1.2 MARKET DEFINITION
1.3 OVERVIEW OF U.S. MUG MARKET
1.4 LIMITATIONS
1.5 MARKETS COVERED
2 MARKET SEGMENTATION
2.1 MARKETS COVERED
2.2 GEOGRAPHICAL SCOPE
2.3 YEARS CONSIDERED FOR THE STUDY
2.4 CURRENCY AND PRICING
2.5 DBMR TRIPOD DATA VALIDATION MODEL
2.6 MULTIVARIATE MODELLING
2.7 PRIMARY INTERVIEWS WITH KEY OPINION LEADERS
2.8 DBMR MARKET POSITION GRID
2.9 MARKET END USER GRID
2.1 SECONDARY SOURCES
2.11 ASSUMPTIONS
3 EXECUTIVE SUMMARY
4 PREMIUM INSIGHTS
4.1 PORTER’S FIVE FORCES ANALYSIS
4.1.1 THREAT OF NEW ENTRANTS
4.1.2 BARGAINING POWER OF SUPPLIERS
4.1.3 BARGAINING POWER OF BUYERS
4.1.4 THREAT OF SUBSTITUTE PRODUCTS
4.1.5 INDUSTRY RIVALRY
4.2 VALUE CHAIN ANALYSIS
4.2.1 PROCESSING & MANUFACTURING
4.2.2 DISTRIBUTION & RETAIL OPERATIONS
4.2.3 END USERS
4.3 BRAND OUTLOOK
4.3.1 ANALYTICAL NARRATIVE — BRAND LANDSCAPE IN THE U.S. MUG MARKET
4.3.2 PRODUCT VS BRAND OVERVIEW — U.S. MUG MARKET
4.3.3 PRODUCT OVERVIEW — U.S. MUG MARKET
4.3.4 BRAND OVERVIEW — INFLUENCE ON U.S. MUG CONSUMER BEHAVIOUR
4.4 CONSUMER BUYING BEHAVIOUR
4.4.1 PRODUCT EFFECTIVENESS & YIELD IMPROVEMENT
4.4.2 COST SENSITIVITY & RETURN ON INVESTMENT (ROI)
4.4.3 EASE OF USE & ADOPTION
4.4.4 TECHNOLOGY RELIABILITY & ACCURACY
4.4.5 ACCESS TO FINANCING & SUBSIDIES
4.4.6 AFTER-SALES SUPPORT & SERVICE
4.4.7 BRAND REPUTATION & TRUST
4.4.8 SUSTAINABILITY & ENVIRONMENTAL IMPACT
4.4.9 CUSTOMIZATION & SCALABILITY
4.4.10 DIGITAL CONNECTIVITY & DATA INSIGHTS
4.4.11 AVAILABILITY & DISTRIBUTION REACH
4.4.12 CONCLUSION
4.5 INNOVATION TRACKER AND STRATEGIC ANALYSIS — U.S. MUG MARKET
4.5.1 MAJOR DEALS AND STRATEGIC ALLIANCES ANALYSIS
4.5.1.1 JOINT VENTURES
4.5.1.2 MERGERS AND ACQUISITIONS
4.5.1.3 LICENSING AND PARTNERSHIP
4.5.1.4 TECHNOLOGY COLLABORATIONS
4.5.1.5 STRATEGIC DIVESTMENTS
4.5.1.6 NUMBER OF PRODUCTS IN DEVELOPMENT
4.5.1.7 STAGE OF DEVELOPMENT
4.5.2 TIMELINES AND MILESTONES
4.5.3 INNOVATION STRATEGIES AND METHODOLOGIES
4.5.4 RISK ASSESSMENT AND MITIGATION
4.5.5 FUTURE OUTLOOK
4.6 PRICING ANALYSIS
4.7 PROFIT MARGINS SCENARIO
4.7.1 MANUFACTURER MARGINS AND RAW MATERIAL INFLUENCE
4.7.2 IMPACT OF PRODUCT MIX ON PROFITABILITY
4.7.3 EFFECTS OF TARIFFS AND TRADE POLICY
4.7.4 DISTRIBUTION AND CHANNEL PARTNER MARGINS
4.7.5 ECONOMIES OF SCALE AND OPERATIONAL EFFICIENCY
4.7.6 CUSTOMER PRICING SENSITIVITY AND COMPETITIVE PRESSURE
4.7.7 LONG-TERM CONTRACTS AND MARGIN STABILITY
4.7.8 INNOVATION AND VALUE-ADDED FEATURES
4.8 RAW MATERIAL COVERAGE
4.8.1 OVERVIEW OF RAW MATERIAL CATEGORIES USED IN U.S. MUGS
4.8.2 CERAMIC RAW MATERIALS: CORE COVERAGE REQUIREMENTS
4.8.3 FOOD-CONTACT SAFETY AND CHEMICAL RISK MANAGEMENT
4.8.4 STAINLESS STEEL RAW MATERIALS FOR METAL MUGS
4.8.5 GLASS RAW MATERIALS AND FORMULATION CONTROL
4.8.6 POLYMER AND COMPOSITE RAW MATERIALS
4.8.7 AUXILIARY MATERIALS: LIDS, SEALS, AND DECORATION SYSTEMS
4.8.8 SUSTAINABILITY AND ENVIRONMENTAL CLAIMS GOVERNANCE
4.8.9 BEST-PRACTICE FRAMEWORK FOR RAW MATERIAL COVERAGE
4.9 SUPPLY CHAIN ANALYSIS
4.9.1 OVERVIEW
4.9.2 LOGISTIC COST SCENARIO
4.9.3 IMPORTANCE OF LOGISTICS SERVICE PROVIDERS
4.1 TECHNOLOGICAL ADVANCEMENTS
4.10.1 SMART TEMPERATURE CONTROL AND EMBEDDED SENSING TECHNOLOGIES
4.10.2 MATERIAL SCIENCE AND THERMAL EFFICIENCY INNOVATIONS
4.10.3 DIGITAL INTEGRATION AND MOBILE ECOSYSTEM CONNECTIVITY
4.10.4 ERGONOMIC AND FUNCTIONAL DESIGN ENHANCEMENTS
4.10.5 SUSTAINABILITY THROUGH TECHNOLOGICAL MATERIALS AND PROCESSES
4.10.6 CONCLUSION
4.11 VENDOR SELECTION CRITERIA FOR THE U.S. MUG MARKET
4.11.1 REGULATORY COMPLIANCE AND PRODUCT SAFETY ASSURANCE
4.11.2 QUALITY MANAGEMENT AND MANUFACTURING DISCIPLINE
4.11.3 MATERIAL SELECTION AND PERFORMANCE RELIABILITY
4.11.4 SUPPLY CHAIN TRANSPARENCY AND IMPORT READINESS
4.11.5 SUSTAINABILITY AND RESPONSIBLE SOURCING
4.11.6 COMMERCIAL FIT AND PARTNERSHIP CAPABILITY
4.11.7 CONCLUSION
5 TARIFFS & IMPACT ON THE U.S. MUG MARKET
5.1 CURRENT TARIFF RATE(S) IN TOP-5 COUNTRY MARKETS
5.2 OUTLOOK: LOCAL PRODUCTION VS. IMPORT RELIANCE
5.3 VENDOR SELECTION CRITERIA DYNAMICS
5.4 IMPACT ON SUPPLY CHAIN
5.4.1 RAW MATERIAL PROCUREMENT
5.4.2 MANUFACTURING AND PRODUCTION
5.4.3 LOGISTICS AND DISTRIBUTION
5.4.4 PRICE PITCHING AND POSITION OF MARKET
6 REGULATION COVERAGE
6.1 PRODUCT CODES
6.2 CERTIFIED STANDARDS
6.3 SAFETY STANDARDS
6.3.1 MATERIAL HANDLING & STORAGE
6.3.2 TRANSPORT & PRECAUTIONS
6.3.3 HAZARD IDENTIFICATION
6.4 CONCLUSION
7 MARKET OVERVIEW
7.1 DRIVERS
7.1.1 RISING DAILY CONSUMPTION OF HOT BEVERAGES
7.1.2 GROWTH OF CAFE CULTURE AND SPECIALTY BEVERAGE OUTLETS
7.1.3 GROWTH OF E-COMMERCE AND ONLINE GIFTING PLATFORMS
7.1.4 INCREASING ADOPTION OF ECO-FRIENDLY MATERIAL
7.2 RESTRAINTS
7.2.1 RISING RAW MATERIAL AND ENERGY COSTS
7.2.2 ENVIRONMENTAL CONCERNS AROUND GLAZING CHEMICALS
7.3 OPPORTUNITIES
7.3.1 GROWING DEMAND FOR PERSONALIZED AND PRINT-ON-DEMAND MUGS
7.3.2 INCREASING DEMAND OF SMART AND TEMPERATURE-CONTROLLED MUGS
7.3.3 OPTIMIZED LIGHTWEIGHT AND STACKABLE MUG DESIGNS
7.4 CHALLENGES
7.4.1 MAINTAINING CONSISTENT QUALITY ACROSS MASS PRODUCTION
7.4.2 SHORT PRODUCT LIFECYCLE OF TREND-BASED DESIGNS
8 U.S. MUG MARKET, BY TYPE, 2018-2033 (USD MILLION)
8.1 OVERVIEW
8.2 CLASSIC MUG
8.3 TRAVEL MUG
8.4 TUMBLERS
8.5 DEMITASSE
8.6 SOUP MUG
8.7 DRINKWARE
8.8 GLASSES
8.9 OTHERS
9 U.S. MUG MARKET, BY CORE MATERIAL COMPOSITION, 2018-2033 (USD MILLION)
9.1 OVERVIEW
9.2 CERAMIC-BASED
9.3 GLASS-BASED
9.4 METAL-BASED
9.5 POLYMER-BASED
9.6 BIO-COMPOSITE / SUSTAINABLE MATERIALS
9.7 U.S. CERAMIC-BASED IN MUG MARKET, BY TYPE, 2018-2033 (USD MILLION)
9.7.1 PORCELAIN
9.7.2 STONEWARE
9.7.3 EARTHENWARE
9.7.4 BONE CHINA
9.7.5 VITREOUS CERAMIC
9.7.6 HAND-THROWN CERAMIC
9.8 U.S. GLASS-BASED IN MUG MARKET, BY TYPE, 2018-2033 (USD MILLION)
9.8.1 SODA-LIME GLASS
9.8.2 BOROSILICATE GLASS
9.8.3 DOUBLE-WALL GLASS
9.8.4 TEMPERED GLASS
9.8.5 PRESSED GLASS
9.8.6 RECYCLED GLASS
9.9 U.S. METAL-BASED IN MUG MARKET, BY TYPE, 2018-2033 (USD MILLION)
9.9.1 STAINLESS STEEL
9.9.2 ALUMINUM
9.9.3 ENAMEL-COATED STEEL
9.9.4 COPPER-LINED STEEL
9.9.5 TINPLATE STEEL
9.9.6 TITANIUM ALLOY
9.1 U.S. POLYMER-BASED IN MUG MARKET, BY TYPE, 2018-2033 (USD MILLION)
9.10.1 POLYPROPYLENE (PP)
9.10.2 TRITAN COPOLYESTER
9.10.3 POLYCARBONATE
9.10.4 SILICONE COMPOSITE
9.10.5 RECYCLED POLYMER BLENDS
9.10.6 BIO-BASED PLASTIC
9.11 U.S. BIO-COMPOSITE / SUSTAINABLE MATERIALS IN MUG MARKET, BY TYPE, 2018-2033 (USD MILLION)
9.11.1 BAMBOO FIBER COMPOSITE
9.11.2 WHEAT STRAW COMPOSITE
9.11.3 RICE HUSK COMPOSITE
9.11.4 CORK COMPOSITE
9.11.5 PLANT-RESIN COMPOSITE
9.11.6 MINERAL-FILLED BIOPOLYMER
10 U.S. MUG MARKET, BY CAPACITY, 2018-2033 (USD MILLION)
10.1 OVERVIEW
10.2 LESS THAN 400 ML
10.3 401-600 ML
10.4 601-800 ML
10.5 801-1000 ML
10.6 MORE THAN 1000 ML
11 U.S. MUG MARKET, BY STRUCTURAL CONSTRUCTION / THERMAL ARCHITECTURE, 2018-2033 (USD MILLION)
11.1 OVERVIEW
11.2 SINGLE-WALL CONSTRUCTION
11.3 DOUBLE-WALL (NON-VACUUM)
11.4 VACUUM-INSULATED
11.5 SPECIALTY STRUCTURAL BUILDS
11.6 U.S. SINGLE-WALL CONSTRUCTION IN MUG MARKET, BY TYPE, 2018-2033 (USD MILLION)
11.6.1 THIN WALL
11.6.2 THICK WALL
11.6.3 LIGHTWEIGHT SHELL
11.6.4 STRAIGHT-WALL PROFILE
11.6.5 HEAVY-DUTY SHELL
11.7 U.S. DOUBLE-WALL (NON-VACUUM) IN MUG MARKET, BY TYPE, 2018-2033 (USD MILLION)
11.7.1 AIR-GAP INSULATION
11.7.2 GLASS-IN-GLASS
11.7.3 PLASTIC-IN-PLASTIC
11.7.4 DECORATIVE DOUBLE WALL
11.7.5 CONDENSATION-RESISTANT
11.8 U.S. VACUUM-INSULATED IN MUG MARKET, BY TYPE, 2018-2033 (USD MILLION)
11.8.1 STAINLESS VACUUM
11.8.2 COPPER-LINED VACUUM
11.8.3 HYBRID VACUUM CORE
11.8.4 EXTENDED HEAT RETENTION
11.8.5 COLD-RETENTION OPTIMIZED
11.9 U.S. SPECIALTY STRUCTURAL BUILDS IN MUG MARKET, BY TYPE, 2018-2033 (USD MILLION)
11.9.1 COLLAPSIBLE BODY
11.9.2 SELF-STIRRING BASE
11.9.3 WEIGHTED BOTTOM
11.9.4 STACK-LOCK DESIGN
11.9.5 MODULAR MUG SYSTEM
12 U.S. MUG MARKET, BY CUSTOMIZATION CAPABILITY, 2018-2033 (USD MILLION)
12.1 OVERVIEW
12.2 SURFACE-LEVEL CUSTOMIZATION
12.3 STRUCTURAL CUSTOMIZATION
12.4 ARTISANAL CUSTOMIZATION
12.5 U.S. SURFACE-LEVEL CUSTOMIZATION IN MUG MARKET, BY TYPE, 2018-2033 (USD MILLION)
12.5.1 PRINTED TEXT
12.5.2 PRINTED GRAPHICS
12.5.3 COLOR OVERLAYS
12.5.4 HEAT-REACTIVE COATING
12.5.5 DECAL APPLICATION
12.6 U.S. STRUCTURAL CUSTOMIZATION IN MUG MARKET, BY TYPE, 2018-2033 (USD MILLION)
12.6.1 ENGRAVED SURFACE
12.6.2 EMBOSSED LOGO
12.6.3 CUSTOM HANDLE
12.6.4 MOLDED NAMEPLATE
12.6.5 SHAPE ALTERATION
12.7 U.S. ARTISANAL CUSTOMIZATION IN MUG MARKET, BY TYPE, 2018-2033 (USD MILLION)
12.7.1 HAND-PAINTED
12.7.2 GLAZE VARIATION
12.7.3 LIMITED-RUN ARTIST SERIES
12.7.4 SIGNED EDITIONS
12.7.5 ONE-OF-ONE PIECES
13 U.S. MUG MARKET, BY FEATURE & TECHNOLOGY, 2018-2033 (USD MILLION)
13.1 OVERVIEW
13.2 USABILITY & ERGONOMICS
13.3 SAFETY & COMPLIANCE
13.4 SMART & INTERACTIVE FEATURES
13.5 U.S. USABILITY & ERGONOMICS IN MUG MARKET, BY TYPE, 2018-2033 (USD MILLION)
13.5.1 TEMPERATURE DISPLAY
13.5.2 APP CONNECTIVITY
13.5.3 SELF-STIRRING MECHANISM
13.5.4 LED INDICATORS
13.5.5 TIMED ALERTS
13.6 U.S. SAFETY & COMPLIANCE IN MUG MARKET, BY TYPE, 2018-2033 (USD MILLION)
13.6.1 EASY-GRIP HANDLE
13.6.2 WIDE-MOUTH OPENING
13.6.3 ONE-HAND OPERATION
13.6.4 STACK OPTIMIZATION
13.6.5 LIGHTWEIGHT BUILD
13.7 U.S. SMART & INTERACTIVE FEATURES IN MUG MARKET, BY TYPE, 2018-2033 (USD MILLION)
13.7.1 BPA-FREE
13.7.2 SHATTER-RESISTANT
13.7.3 SPILL-PROOF LID
13.7.4 CHILD-SAFE DESIGN
13.7.5 FOOD-GRADE CERTIFIED
14 U.S. MUG MARKET, BY END USER, 2018-2033 (USD MILLION)
14.1 OVERVIEW
14.2 COMMERCIAL
14.3 HOUSEHOLD/ RESIDENTIAL
14.4 U.S. COMMERCIAL IN MUG MARKET, BY TYPE, 2018-2033 (USD MILLION)
14.4.1 RESTAURANTS
14.4.2 CAFES
14.4.3 BARS/ CLUBS
14.4.4 HOTELS
14.4.5 OFFICES
14.4.6 SPORTS
14.4.7 OTHERS
15 U.S. MUG MARKET, BY DISTRIBUTION CHANNEL, 2018-2033 (USD MILLION)
15.1 OVERVIEW
15.2 OFFLINE
15.3 ONLINE
15.4 U.S. OFFLINE IN MUG MARKET, BY TYPE, 2018-2033 (USD MILLION)
15.4.1 WHOLESALERS/ DISTRIBUTORS
15.4.2 SPECIALTY STORES
15.4.3 SUPERMARKETS/ HYPERMARKETS
15.4.4 CONVENIENCE STORES
15.4.5 OTHERS
15.5 U.S. ONLINE IN MUG MARKET, BY TYPE, 2018-2033 (USD MILLION)
15.5.1 COMPANY OWNED WEBSITES
15.5.2 THIRD PARTY WEBSITES
16 U.S. MUG MARKET: COMPANY LANDSCAPE
16.1 MANUFACTURER COMPANY SHARE ANALYSIS: U.S.
17 SWOT ANALYSIS
18 COMPANY PROFILE
18.1 YETI COOLERS, LLC
18.1.1 COMPANY SNAPSHOT
18.1.2 REVENUE ANALYSIS
18.1.3 PRODUCT PORTFOLIO
18.1.4 RECENT DEVELOPMENT
18.2 SHUTTERFLY
18.2.1 COMPANY SNAPSHOT
18.2.2 PRODUCT PORTFOLIO
18.2.3 RECENT DEVELOPMENT
18.3 HYDRO FLASK.
18.3.1 COMPANY SNAPSHOT
18.3.2 PRODUCT PORTFOLIO
18.3.3 RECENT DEVELOPMENT
18.4 CUSTOMINK, LLC
18.4.1 COMPANY SNAPSHOT
18.4.2 PRODUCT PORTFOLIO
18.4.3 RECENT DEVELOPMENT
18.5 TERVIS LLC
18.5.1 COMPANY SNAPSHOT
18.5.2 PRODUCT PORTFOLIO
18.5.3 RECENT DEVELOPMENT
18.6 ALL AMERICAN ROUGHNECK
18.6.1 COMPANY SNAPSHOT
18.6.2 PRODUCT PORTFOLIO
18.6.3 RECENT DEVELOPMENT
18.7 BAUER POTTERY
18.7.1 COMPANY SNAPSHOT
18.7.2 PRODUCT PORTFOLIO
18.7.3 RECENT DEVELOPMENT
18.8 BENNINGTON POTTERS
18.8.1 COMPANY SNAPSHOT
18.8.2 PRODUCT PORTFOLIO
18.8.3 RECENT DEVELOPMENT
18.9 CLAY FACTOR LLC
18.9.1 COMPANY SNAPSHOT
18.9.2 PRODUCT PORTFOLIO
18.9.3 RECENT DEVELOPMENT
18.1 DENEEN POTTERY
18.10.1 COMPANY SNAPSHOT
18.10.2 PRODUCT PORTFOLIO
18.10.3 RECENT DEVELOPMENT
18.11 EAST FORK
18.11.1 COMPANY SNAPSHOT
18.11.2 PRODUCT PORTFOLIO
18.11.3 RECENT DEVELOPMENT
18.12 EMBER TECHNOLOGIES, INC
18.12.1 COMPANY SNAPSHOT
18.12.2 PRODUCT PORTFOLIO
18.12.3 RECENT DEVELOPMENT
18.13 EMERSON CREEK POTTERY, INC.
18.13.1 COMPANY SNAPSHOT
18.13.2 PRODUCT PORTFOLIO
18.13.3 RECENT DEVELOPMENT
18.14 GREY FOX POTTERY
18.14.1 COMPANY SNAPSHOT
18.14.2 PRODUCT PORTFOLIO
18.14.3 RECENT DEVELOPMENT
18.15 MUGFACTORY USA.
18.15.1 COMPANY SNAPSHOT
18.15.2 PRODUCT PORTFOLIO
18.15.3 RECENT DEVELOPMENT
18.16 NOTARY CERAMICS LLC
18.16.1 COMPANY SNAPSHOT
18.16.2 PRODUCT PORTFOLIO
18.16.3 RECENT DEVELOPMENT
18.17 PMI WW BRANDS, LLC
18.17.1 COMPANY SNAPSHOT
18.17.2 PRODUCT PORTFOLIO
18.17.3 RECENT DEVELOPMENT
18.18 ROWE POTTERY.
18.18.1 COMPANY SNAPSHOT
18.18.2 PRODUCT PORTFOLIO
18.18.3 RECENT DEVELOPMENT
18.19 WINCRAFT, INC
18.19.1 COMPANY SNAPSHOT
18.19.2 PRODUCT PORTFOLIO
18.19.3 RECENT DEVELOPMENT
18.2 ZAK.COM
18.20.1 COMPANY SNAPSHOT
18.20.2 PRODUCT PORTFOLIO
18.20.3 RECENT DEVELOPMENT
19 QUESTIONNAIRE
20 RELATED REPORTS
List of Table
TABLE 1 BRAND COMPARATIVE ANALYSIS OF LEADING U.S. MUG BRANDS
TABLE 2 U.S. MUG MARKET, BY TYPE, 2018-2033 (USD MILLION)
TABLE 3 U.S. MUG MARKET, BY CORE MATERIAL COMPOSITION, 2018-2033 (USD MILLION)
TABLE 4 U.S. CERAMIC-BASED IN MUG MARKET, BY TYPE, 2018-2033 (USD MILLION)
TABLE 5 U.S. GLASS-BASED IN MUG MARKET, BY TYPE, 2018-2033 (USD MILLION)
TABLE 6 U.S. METAL-BASED IN MUG MARKET, BY TYPE, 2018-2033 (USD MILLION)
TABLE 7 U.S. POLYMER-BASED IN MUG MARKET, BY TYPE, 2018-2033 (USD MILLION)
TABLE 8 U.S. BIO-COMPOSITE / SUSTAINABLE MATERIALS IN MUG MARKET, BY TYPE, 2018-2033 (USD MILLION)
TABLE 9 U.S. MUG MARKET, BY CAPACITY, 2018-2033 (USD MILLION)
TABLE 10 U.S. MUG MARKET, BY STRUCTURAL CONSTRUCTION / THERMAL ARCHITECTURE, 2018-2033 (USD MILLION)
TABLE 11 U.S. SINGLE-WALL CONSTRUCTION IN MUG MARKET, BY TYPE, 2018-2033 (USD MILLION)
TABLE 12 U.S. DOUBLE-WALL (NON-VACUUM) IN MUG MARKET, BY TYPE, 2018-2033 (USD MILLION)
TABLE 13 U.S. VACUUM-INSULATED IN MUG MARKET, BY TYPE, 2018-2033 (USD MILLION)
TABLE 14 U.S. SPECIALTY STRUCTURAL BUILDS IN MUG MARKET, BY TYPE, 2018-2033 (USD MILLION)
TABLE 15 U.S. MUG MARKET, BY CUSTOMIZATION CAPABILITY, 2018-2033 (USD MILLION)
TABLE 16 U.S. SURFACE-LEVEL CUSTOMIZATION IN MUG MARKET, BY TYPE, 2018-2033 (USD MILLION)
TABLE 17 U.S. STRUCTURAL CUSTOMIZATION IN MUG MARKET, BY TYPE, 2018-2033 (USD MILLION)
TABLE 18 U.S. ARTISANAL CUSTOMIZATION IN MUG MARKET, BY TYPE, 2018-2033 (USD MILLION)
TABLE 19 U.S. MUG MARKET, BY FEATURE & TECHNOLOGY, 2018-2033 (USD MILLION)
TABLE 20 U.S. USABILITY & ERGONOMICS IN MUG MARKET, BY TYPE, 2018-2033 (USD MILLION)
TABLE 21 U.S. SAFETY & COMPLIANCE IN MUG MARKET, BY TYPE, 2018-2033 (USD MILLION)
TABLE 22 U.S. SMART & INTERACTIVE FEATURES IN MUG MARKET, BY TYPE, 2018-2033 (USD MILLION)
TABLE 23 U.S. MUG MARKET, BY END USER, 2018-2033 (USD MILLION)
TABLE 24 U.S. COMMERCIAL IN MUG MARKET, BY TYPE, 2018-2033 (USD MILLION)
TABLE 25 U.S. MUG MARKET, BY DISTRIBUTION CHANNEL, 2018-2033 (USD MILLION)
TABLE 26 U.S. OFFLINE IN MUG MARKET, BY TYPE, 2018-2033 (USD MILLION)
TABLE 27 U.S. ONLINE IN MUG MARKET, BY TYPE, 2018-2033 (USD MILLION)
List of Figure
FIGURE 1 U.S. MUG MARKET: SEGMENTATION
FIGURE 2 U.S. MUG MARKET: DATA TRIANGULATION
FIGURE 3 U.S. MUG MARKET: DROC ANALYSIS
FIGURE 4 U.S. MUG MARKET: GLOBAL VS REGIONAL ANALYSIS
FIGURE 5 U.S. MUG MARKET: COMPANY RESEARCH ANALYSIS
FIGURE 6 U.S. MUG MARKET: INTERVIEW DEMOGRAPHICS
FIGURE 7 U.S. MUG MARKET: DBMR MARKET POSITION GRID
FIGURE 8 U.S. MUG MARKET: MARKET END USER COVERAGE GRID
FIGURE 9 EXECUTIVE SUMMARY
FIGURE 10 STRATEGIC DECISIONS
FIGURE 11 EIGHT SEGMENTS COMPRISE THE U.S. MUG MARKET, BY TYPE (2026)
FIGURE 12 U.S. MUG MARKET: SEGMENTATION
FIGURE 13 RISING DAILY CONSUMPTION OF HOT BEVERAGES EXPECTED TO DRIVE THE U.S. MUG MARKET IN THE FORECAST PERIOD OF 2026 TO 2033
FIGURE 14 TYPE SEGMENT IS EXPECTED TO ACCOUNT FOR THE LARGEST SHARE OF THE U.S. MUG MARKET IN 2026 & 2033
FIGURE 15 PORTER’S FIVE FORCES ANALYSIS
FIGURE 16 VALUE CHAIN OF U.S. MUG MARKET-
FIGURE 17 PRICING ANALYSIS IN U.S.MUG MARKET, BY PROUDUCT TYPE (USD/UNIT)
FIGURE 18 DRIVERS, RESTRINTS, OPPORTUNITIES AND CHALLENGES OF ASIA-PACIFIC ERP MARKET
FIGURE 19 U.S. MUG MARKET: BY TYPE, 2025
FIGURE 20 U.S. MUG MARKET: BY CORE MATERIAL COMPOSTION, 2025
FIGURE 21 U.S. MUG MARKET: BY CAPACITY, 2025
FIGURE 22 U.S. MUG MARKET: BY STRUCTURAL CONSTRUCTION/THERMAL ARCHITECTUTRE, 2025
FIGURE 23 U.S. MUG MARKET: BY CUSTOMIZATION CAPABILITY, 2025
FIGURE 24 U.S. MUG MARKET: BY FEATURE & TECHNOLOGY, 2025
FIGURE 25 U.S. MUG MARKET: BY END USER, 2025
FIGURE 26 U.S. MUG MARKET: BY DISTRIBUTION CHANNEL, 2025
FIGURE 27 U.S. MUG MARKET: COMPANY SHARE 2025 (%)
Data collection and base year analysis are done using data collection modules with large sample sizes. The stage includes obtaining market information or related data through various sources and strategies. It includes examining and planning all the data acquired from the past in advance. It likewise envelops the examination of information inconsistencies seen across different information sources. The market data is analysed and estimated using market statistical and coherent models. Also, market share analysis and key trend analysis are the major success factors in the market report. To know more, please request an analyst call or drop down your inquiry.
The key research methodology used by DBMR research team is data triangulation which involves data mining, analysis of the impact of data variables on the market and primary (industry expert) validation. Data models include Vendor Positioning Grid, Market Time Line Analysis, Market Overview and Guide, Company Positioning Grid, Patent Analysis, Pricing Analysis, Company Market Share Analysis, Standards of Measurement, Global versus Regional and Vendor Share Analysis. To know more about the research methodology, drop in an inquiry to speak to our industry experts.
Data Bridge Market Research is a leader in advanced formative research. We take pride in servicing our existing and new customers with data and analysis that match and suits their goal. The report can be customized to include price trend analysis of target brands understanding the market for additional countries (ask for the list of countries), clinical trial results data, literature review, refurbished market and product base analysis. Market analysis of target competitors can be analyzed from technology-based analysis to market portfolio strategies. We can add as many competitors that you require data about in the format and data style you are looking for. Our team of analysts can also provide you data in crude raw excel files pivot tables (Fact book) or can assist you in creating presentations from the data sets available in the report.


