
U.S. Osteonecrosis Market Analysis and Insights
The increasing number of traumatic injuries among the United States population is expected to boost the growth of the U.S. osteonecrosis market. The rising government initiatives and funding for drug discovery and related research programs also contribute to market growth. The major market players focus on various service launches and approvals during this crucial period. In addition, the increase in improved advancement of imaging techniques for the diagnostic purpose of osteonecrosis is also driving the growth of the market in the forecasted period.
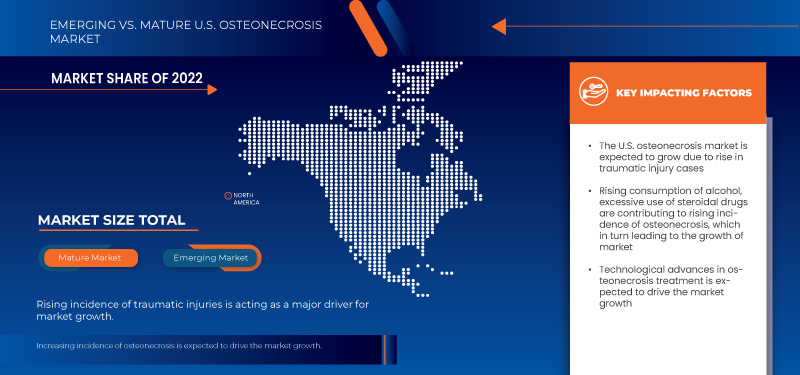
The U.S. osteonecrosis market is expected to grow in the forecast year due to the rise in the number of market players and the availability of advanced technological diagnostic and surgical devices. The increasing development in the field of advanced techniques is further expected to boost market growth. However, difficulties such as the stringent regulations for producing and commercializing treatment drugs and medical devices for diagnosis and surgery are expected to restrain market growth in the forecast period.
Various companies are taking initiatives that gradually lead to market growth:
For instance,
- In January 2021, Stryker announced the acquisition of OrthoSensor, a market player which applies digital technology and big data to total joint replacements. The acquisition would help the company to purchase the digital technologies of OrthoSensor for the use in diagnosis and treatment technologies for osteonecrosis.
- In March 2020, Sciegen Pharmaceuticals received ANDA Approval for Naproxen Tablets USP 250mg, 375mg and 500mg. The approval will further help in the growth of the product portfolio of the company.
Data Bridge Market Research analyzes that the U.S. osteonecrosis market is expected to reach the value of USD 843,039.67 thousand by 2030, at a CAGR of 5.9% during the forecast period.
|
Report Metric |
Details |
|
Forecast Period |
2023 to 2030 |
|
Base Year |
2022 |
|
Historic Years |
2021 (Customizable to 2015-2020) |
|
Quantitative Units |
Revenue in Thousand, Volumes in Units, Pricing in USD |
|
Segments Covered |
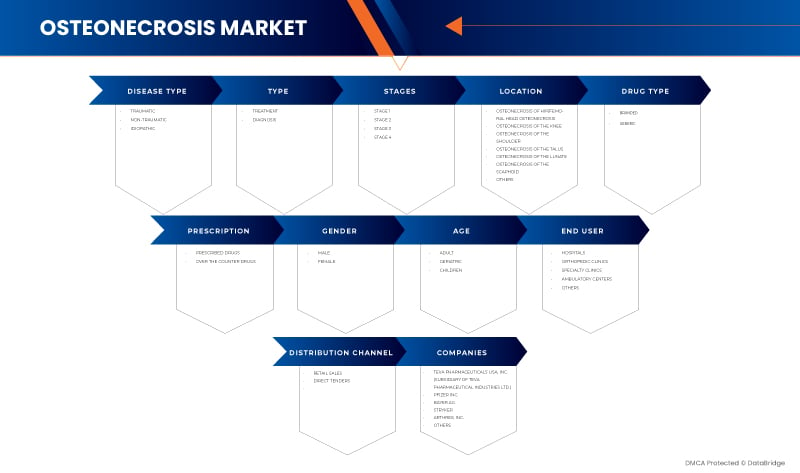
Disease Type (Traumatic, Non-Traumatic, and Idiopathic), Type (Diagnosis, and Treatment), Stages (Stage 1, Stage 2, Stage 3, and Stage 4), Location (Osteonecrosis of Hip/Femoral Head Osteonecrosis, Osteonecrosis of the Knee, Osteonecrosis of the Shoulder, Osteonecrosis of the Talus, Osteonecrosis of the Lunate, Osteonecrosis of the Scaphoid, and Others), Drug Type (Branded and Generic), Prescription (Over the Counter Drugs and Prescribed Drugs), Gender (Male and Female), Age (Children, Adult, and Geriatric), End User (Hospitals, Specialty Clinics, Orthopedic Clinics, Ambulatory Centers, and Others), Distribution Channel (Direct Tender and Retail Sales) |
|
Country Covered |
U.S. |
|
Market Players Covered |
Sciegen Pharmaceuticals, Almatica Pharma, Dr. Reddy's Laboratories Ltd., Bayer AG, Pfizer Inc., Haleon Group of Companies, Zimmer Biomet, Stryker, Teva Pharmaceuticals USA, Inc. (Subsidiary of Teva Pharmaceutical Industries Ltd.), and Arthrex, Inc., among others. |
U.S. Osteonecrosis Market Definition
Osteonecrosis, also referred to as avascular necrosis or aseptic necrosis, is a condition characterized by the death or deterioration of bone tissue due to an inadequate blood supply. It can occur in various bones in the body, but it most commonly affects the hip joint. The compromised blood flow deprives the bone cells of essential oxygen and nutrients, leading to their death and subsequent damage to the affected bone. As a result, the bone structure weakens, becomes less able to withstand normal stress, and may eventually collapse or become deformed. Osteonecrosis can cause pain, limited range of motion, and functional impairment. Common causes of osteonecrosis include trauma, corticosteroid use, excessive alcohol consumption, certain medical conditions, and underlying factors that affect blood circulation. Early diagnosis and appropriate management are essential in preventing further bone damage and preserving joint function. Treatment options for osteonecrosis may include conservative measures to manage symptoms and slow disease progression and surgical interventions to relieve pain and restore joint function.
U.S. Osteonecrosis Market Dynamics
This section deals with understanding the market drivers, advantages, opportunities, restraints, and challenges. All of this is discussed in detail below:
Driver
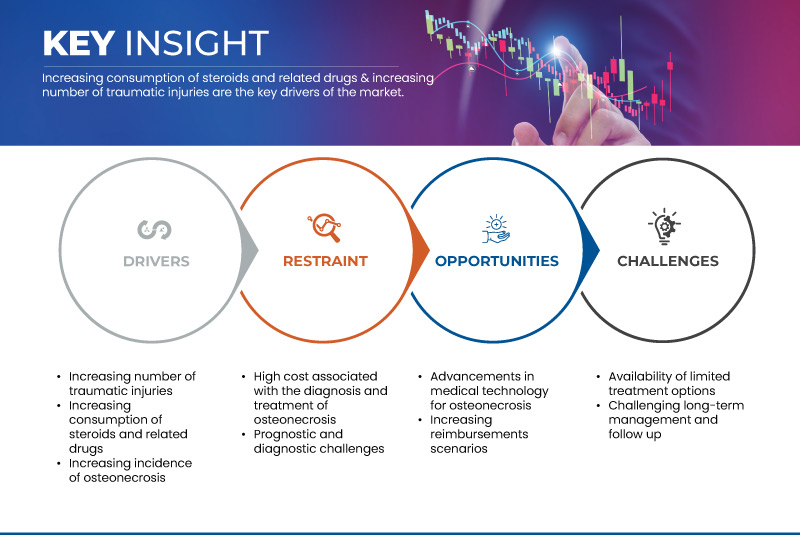
- Increasing number of traumatic injuries
The increasing number of traumatic injuries in the U.S. is a significant driver for the U.S. osteonecrosis market. Traumatic injuries, caused by various factors such as accidents, sports-related incidents, falls, and workplace injuries, have become more prevalent in recent years. These injuries can profoundly impact bone health, often resulting in fractures, dislocations, and joint instability. When the blood supply to the affected bone is compromised during the injury, it sets the stage for the potential development of osteonecrosis. The damaged blood vessels disrupt the essential supply of oxygen and nutrients to the bone tissue, leading to the death of bone cells. Post-traumatic osteonecrosis is a well-recognized consequence of severe traumatic injuries. Not promptly diagnosed and managed can lead to complications such as joint collapse, chronic pain, and reduced joint function.
A traumatic injury can damage the blood vessels that deliver oxygen and nutrients to the bone tissue. This disruption leads to a decreased or blocked blood flow, resulting in cellular death and the development of osteonecrosis. Additionally, the trauma can increase pressure on the bone or joint, compromising blood flow and causing ischemia. The resulting lack of blood supply and cellular damage can trigger an inflammatory response, further exacerbating the condition. The increasing number of road and sport-related accidents are increasing, leading to an increase in osteonecrosis.
Restraint
- High cost associated with the diagnosis and treatment of osteonecrosis
The advancements in diagnostic techniques and treatment options have improved patient outcomes. Still, the financial burden of managing osteonecrosis remains a significant challenge for patients, healthcare providers, and the healthcare system. The key factors determining the cost of diagnosis and treatment of osteonecrosis include the medical institution or clinic finalized for the procedure, treatment area, complexity, and chosen specialist among others.
Accurate diagnosis of osteonecrosis often requires specialized imaging techniques, such as magnetic resonance imaging (MRI), computed tomography (CT) scans, or bone scans. These diagnostic procedures are expensive, requiring specialized equipment, trained personnel, and interpretation by skilled radiologists. The high cost of these imaging procedures limits access to timely and accurate diagnosis, leading to delayed treatment and potential complications. The cost of the treatment proportionally gets escalated, so the high cost of treatment may hamper the market's demand.
Opportunity
-
Advancements in medical technology for osteonecrosis
Advancements in medical technology present significant opportunities in the U.S. osteonecrosis market. These innovations enhance the accuracy of diagnosis, offer regenerative treatment options, enable minimally invasive procedures, facilitate personalized care, and improve patient outcomes. Continued investment in research and development, collaboration between industry and healthcare professionals, and regulatory support for innovative technologies are vital to harness the full potential of medical advancements and drive progress in osteonecrosis. Therefore is expected to act as an opportunity in the market.
Challenge
- Availability of limited treatment options
The absence of therapeutic alternatives in the U.S. osteonecrosis market hampers optimal patient care and outcomes. Osteonecrosis, commonly called avascular necrosis, is a disorder where bone tissue perishes due to inadequate blood flow. Although there are various therapeutic options, the choices are frequently constrained based on osteonecrosis's stage, location, and underlying etiology.
Recent Developments
- In January 2023, Zimmer Biomet announced that it had reached a definitive agreement to acquire Embody, Inc., a privately-held medical device company focused on soft tissue healing, for $155 thousand at closing. The acquisition includes Embody's complete portfolio of collagen-based biointegrative solutions to support healing in the most challenging orthopedic soft tissue injuries – including the TAPESTRY biointegrative implant for tendon healing and TAPESTRY RC, one of the first arthroscopic implant systems for rotator cuff repair. This acquisition will help the company in its product portfolio and business expansion.
- In July 2022, the Haleon Group of Companies announced the completion of the demerger of the Consumer Healthcare business from the GSK Group to form the Haleon Group. This demerges helped the company to take control over the whole business of consumer health and expand it.
U.S. Osteonecrosis Market Scope
The U.S. osteonecrosis market is segmented into ten notable segments based on disease type, type, stages, location, drug type, prescription, gender, age, end user, and distribution channel. The growth among segments helps you analyze niche pockets of growth and strategies to approach the market and determine your core application areas and the difference in your target markets.
Disease Type
- Traumatic
- Non-Traumatic
- Idiopathic
On the basis of disease type, the market is segmented into traumatic, non-traumatic, and idiopathic.
Type
- Diagnosis
- Treatment
On the basis of type, the market is segmented into diagnosis and treatment.
Stages
- Stage 1
- Stage 2
- Stage 3
- Stage 4
On the basis of stages, the market is segmented into stage 1, stage 2, stage3, and stage 4.
Location
- Osteonecrosis of the Hip/ Femoral Head Osteonecrosis
- Osteonecrosis of the Knee
- Osteonecrosis of the Shoulder
- Osteonecrosis of the Talus
- Osteonecrosis of the Lunate
- Osteonecrosis of the Scaphoid
- Others
On the basis of location, the market is segmented into osteonecrosis of hip/femoral head osteonecrosis, osteonecrosis of the knee, osteonecrosis of the shoulder, osteonecrosis of the talus, osteonecrosis of the lunate, osteonecrosis of the scaphoid, and others.
Drug Type
- Branded
- Generic
On the basis of drug type, the market is segmented into branded and generic.
Prescription
- Over the Counter Drugs
- Prescribed Drugs
On the basis of prescription, the market is segmented into over the counter drugs and prescribed drugs.
Gender
- Male
- Female
On the basis of gender, the market is segmented into male and female.
Age
- Children
- Adult
- Geriatric
On the basis of age, the market is segmented into children, adult, and geriatric.
End User
- Hospitals
- Speciality Clinics
- Orthopedic Clinics
- Ambulatory Centers
- Others
On the basis of end user, the market is segmented into hospitals, specialty clinics, orthopedic clinics, ambulatory centers, and others.
Distribution Channel
- Direct Tender
- Retail Sales
On the basis of distribution channel, the market is segmented into direct tender and retail sales.
U.S. Osteonecrosis Market Analysis/Insights
The U.S. osteonecrosis market is categorized into ten notable segments based on disease type, type, stages, location, drug type, prescription, gender, age, end user, and distribution channel.
The countries covered in this market report U.S.
The country section of the report also provides individual market impacting factors and changes in regulation in the market domestically that impact the current and future trends of the market. Data points such as new sales, replacement sales, country demographics, regulatory acts, and import-export tariffs are some of the major pointers used to forecast the market scenario for individual countries. Also, the presence and availability of U.S. brands and their challenges faced due to large or scarce competition from local and domestic brands, and impact of sales channels are considered while providing forecast analysis of the country data.
Competitive Landscape and U.S. Osteonecrosis Market Share Analysis
The U.S. osteonecrosis market competitive landscape provides details by competitor. Details included are company overview, company financials, revenue generated, market potential, investment in R&D, new market initiatives, production sites and facilities, company strengths and weaknesses, product launch, product approvals, product width and breath, application dominance, and product type lifeline curve. The above data points provided are only related to the company’s focus on the U.S. osteonecrosis market.
Some of the major market players operating in the U.S. osteonecrosis market are Sciegen Pharmaceuticals, Almatica Pharma, Dr. Reddy's Laboratories Ltd., Bayer AG, Pfizer Inc., Haleon Group of Companies, Zimmer Biomet, Stryker, Teva Pharmaceuticals USA, Inc. (Subsidiary of Teva Pharmaceutical Industries Ltd.), and Arthrex, Inc. among others.
SKU-

- Interactive Data Analysis Dashboard
- Company Analysis Dashboard for high growth potential opportunities
- Research Analyst Access for customization & queries
- Competitor Analysis with Interactive dashboard
- Latest News, Updates & Trend analysis
- Harness the Power of Benchmark Analysis for Comprehensive Competitor Tracking
Table of Content
1 INTRODUCTION
1.1 OBJECTIVES OF THE STUDY
1.2 MARKET DEFINITION
1.3 OVERVIEW OF THE U.S. OSTEONECROSIS MARKET
1.4 LIMITATIONS
1.5 MARKETS COVERED
2 MARKET SEGMENTATION
2.1 MARKETS COVERED
2.2 GEOGRAPHICAL SCOPE
2.3 YEARS CONSIDERED FOR THE STUDY
2.4 CURRENCY AND PRICING
2.5 DBMR TRIPOD DATA VALIDATION MODEL
2.6 MULTIVARIATE MODELLING
2.7 DISEASE TYPE LIFELINE CURVE
2.8 PRIMARY INTERVIEWS WITH KEY OPINION LEADERS
2.9 DBMR MARKET POSITION GRID
2.1 MARKET END USER COVERAGE GRID
2.11 VENDOR SHARE ANALYSIS
2.12 SECONDARY SOURCES
2.13 ASSUMPTIONS
3 EXECUTIVE SUMMARY
4 PREMIUM INSIGHTS
4.1 PORTER’S FIVE FORCES
4.2 PESTEL ANALYSIS
4.3 INDUSTRY INSIGHTS
4.3.1 DEMOGRAPHIC TRENDS: IMAPCTS ON ALL INCIDENCE RATES
4.3.2 PATIENT FLOW DIAGRAM
4.3.3 KEY PRICING STRATEGIES
4.4 HEALTHCARE ECONOMY
4.4.1 HEALTHCARE EXPENDITURE
4.4.2 CAPITAL EXPENDITURE
4.4.3 CAPEX TRENDS
4.4.4 CAPEX ALLOCATION
4.4.5 FUNDING SOURCES
4.4.6 INDUSTRY BENCHMARKS
4.4.7 GDP RATIO IN OVERALL GDP
4.4.8 HEALTHCARE SYSTEM STRUCTURE
4.4.9 GOVERNMENT POLICIES
4.4.10 ECONOMIC DEVELOPMENT
4.5 PIPELINE ANALYSIS
4.6 REIMBURSEMENT FRAMEWORK
4.7 TECHNOLOGY ROADMAP
4.8 VALUE CHAIN ANALYSIS
5 EPIDEMIOLOGY
6 REGULATIONS
6.1 REGULATORY APPROVAL PROCESS AND PATHWAYS:
6.2 LICENSING AND REGISTRATION:
6.3 POST-MARKETING SURVEILLANCE:
6.4 GOOD MANUFACTURING PRACTICES (GMPS) GUIDELINES:
7 MARKET OVERVIEW
7.1 DRIVERS
7.1.1 INCREASING NUMBER OF TRAUMATIC INJURIES
7.1.2 INCREASING CONSUMPTION OF STEROIDS AND RELATED DRUGS
7.1.3 INCREASING INCIDENCE OF OSTEONECROSIS
7.2 RESTRAINTS
7.2.1 HIGH COST ASSOCIATED WITH THE DIAGNOSIS AND TREATMENT OF OSTEONECROSIS
7.2.2 PROGNOSTIC AND DIAGNOSTIC CHALLENGES
7.3 OPPORTUNITIES
7.3.1 ADVANCEMENTS IN MEDICAL TECHNOLOGY FOR OSTEONECROSIS
7.3.2 INCREASING REIMBURSEMENTS SCENARIOS
7.4 CHALLENGES
7.4.1 AVAILABILITY OF LIMITED TREATMENT OPTIONS
7.4.2 CHALLENGING LONG-TERM MANAGEMENT AND FOLLOW UP
8 U.S. OSTEONECROSIS MARKET, BY DISEASE TYPE
8.1 OVERVIEW
8.2 TRAUMATIC
8.3 NON-TRAUMATIC
8.4 IDIOPATHIC
9 U.S. OSTEONECROSIS MARKET, BY TYPE
9.1 OVERVIEW
9.2 TREATMENT
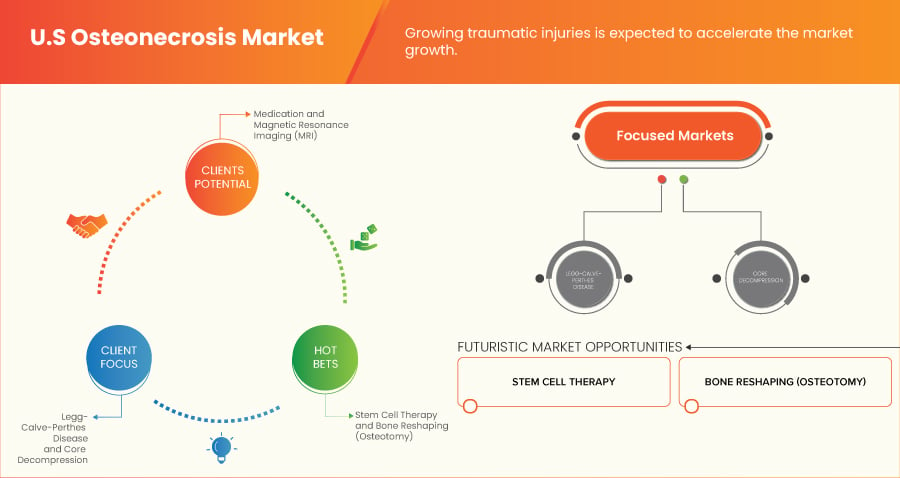
9.2.1 SURGERY
9.2.1.1 CORE DECOMPRESSION
9.2.1.2 BONE RESHAPING (OSTEOTOMY)
9.2.1.3 BONE TRANSPLANT
9.2.1.4 JOINT REPLACEMENT THERAPY
9.2.1.5 STEM CELL THERAPY
9.2.2 MEDICATION
9.2.2.1 NSAIDS
9.2.2.1.1 IBUPROFEN
9.2.2.1.2 ASPIRIN
9.2.2.1.3 NAPROXEN
9.2.2.1.4 DICLOFENAC
9.2.2.1.5 OTHERS
9.2.2.2 BLOOD THINNERS
9.2.2.2.1 WARFARIN
9.2.2.2.2 HEPARIN
9.2.2.2.3 ENOXAPARIN
9.2.2.2.4 ARGATROBAN
9.2.2.2.5 DICOUMARAL
9.2.2.2.6 FONDAPARINUX
9.2.2.2.7 XIMELAGATRAN
9.2.2.3 OSTEOPOROSIS DRUGS
9.2.2.3.1 ALENDRONATE
9.2.2.3.2 RISEDRONATE
9.2.2.3.3 IBANDRONATE
9.2.2.3.4 ZOLEDRONIC ACID
9.2.2.3.5 DENOSUMAB
9.2.2.3.6 OTHERS
9.2.2.4 CHOLESTEROL-LOWERING DRUGS
9.2.2.4.1 ATORVASTATIN
9.2.2.4.2 PRAVASTATIN
9.2.2.4.3 FLUVASTATIN
9.2.2.4.4 ROSUVASTATIN
9.2.2.4.5 SIMVASTATIN
9.2.2.4.6 PITAVASTATIN
9.2.2.4.7 LOVASTATIN
9.2.2.5 OTHERS
9.2.3 PHYSICAL THERAPY
9.2.3.1 CRUTCHES
9.2.3.1.1 AXILLA CRUTCHES
9.2.3.1.1.1 METAL ALLOY
9.2.3.1.1.2 WOOD
9.2.3.1.1.3 CARBON OR GLASS FIBER REINFORCED COMPOSITE
9.2.3.1.1.4 OTHERS
9.2.3.1.2 ELBOW CRUTCHES
9.2.3.1.2.1 OPEN-CUFF ELBOW CRUTCHES
9.2.3.1.2.1.1 METAL ALLOY
9.2.3.1.2.1.2 WOOD
9.2.3.1.2.1.3 CARBON OR GLASS FIBER REINFORCED COMPOSITE
9.2.3.1.2.1.4 OTHERS
9.2.3.1.2.2 CLOSED-CUFF ELBOW CRUTCHES
9.2.3.1.2.2.1 METAL ALLOY
9.2.3.1.2.2.2 WOOD
9.2.3.1.2.2.3 CARBON OR GLASS FIBER REINFORCED COMPOSITE
9.2.3.1.2.2.4 OTHERS
9.2.3.1.3 GUTTER CRUTCHES
9.2.3.1.3.1 METAL ALLOY
9.2.3.1.3.2 WOOD
9.2.3.1.3.3 CARBON OR GLASS FIBER REINFORCED COMPOSITE
9.2.3.1.3.4 OTHERS
9.2.3.2 CASTING AND BRACING
9.2.3.2.1 NEWINGTON BRACE
9.2.3.2.2 TORONTO ORTHOSIS
9.2.3.2.3 SCOTTISH RITE ORTHOSIS
9.2.3.2.4 BROOMSTICK PLASTERS
9.2.3.2.5 BIRMINGHAM ORTHOSIS
9.2.3.3 OTHERS
9.2.3.3.1 CONVENTIONAL CALIPERS
9.2.3.3.2 SNYDER SLINGS
9.2.3.3.3 SLINGS WITH CRUTCHES
9.2.3.3.4 TRACTION
9.2.3.3.5 OTHERS
9.3 DIAGNOSIS
9.3.1 IMAGING TEST
9.3.1.1 MAGNETIC RESONANCE IMAGING (MRI)
9.3.1.1.1 CLOSED BORE
9.3.1.1.1.1 LOW FIELD STRENGTH
9.3.1.1.1.2 MID FIELD STRENGTH
9.3.1.1.1.3 HIGH FIELD STRENGTH
9.3.1.1.2 OPEN BORE
9.3.1.1.2.1 LOW FIELD STRENGTH
9.3.1.1.2.2 MID FIELD STRENGTH
9.3.1.1.2.3 HIGH FIELD STRENGTH
9.3.1.2 COMPUTED TOMOGRAPHY SCANNING
9.3.1.2.1 HIGH END SLICE
9.3.1.2.2 MID END SLICE
9.3.1.2.3 LOW END SLICE
9.3.1.2.4 CONE BEAN
9.3.1.3 X-RAY IMAGING
9.3.1.3.1 RADIOGRAPHY
9.3.1.3.1.1 DIGITAL IMAGING
9.3.1.3.1.2 FILM-BASED IMAGING
9.3.1.3.2 FLUOROSCOPY
9.3.1.3.2.1 DIGITAL IMAGING
9.3.1.3.2.2 FILM-BASED IMAGING
9.3.1.3.3 OTHERS
9.3.1.4 OTHERS
9.3.1.4.1 BONE SCAN
9.3.1.4.2 ULTRASOUND
9.3.1.4.2.1 2D ULTRASOUND
9.3.1.4.2.1.1 B/W ULTRASOUND
9.3.1.4.2.1.2 COLOURED
9.3.1.4.2.2 DOPPLER ULTRASOUND
9.3.1.4.2.2.1 B/W ULTRASOUND
9.3.1.4.2.2.2 COLOURED
9.3.1.4.2.3 3D & 4D ULTRASOUND
9.3.1.4.2.3.1 B/W ULTRASOUND
9.3.1.4.2.3.2 COLOURED
9.3.1.4.3 OTHERS
9.3.2 BIOPSY
9.3.2.1 NEEDLE BIOPSY
9.3.2.2 OPEN BIOPSY
9.3.2.3 OTHERS
9.3.3 OTHERS
10 U.S. OSTEONECROSIS MARKET, BY STAGES
10.1 OVERVIEW
10.2 STAGE 2
10.3 STAGE 3
10.4 STAGE 4
10.5 STAGE 1
11 U.S. OSTEONECROSIS MARKET, BY LOCATION
11.1 OVERVIEW
11.2 OSTEONECROSIS OF HIP/FEMORAL HEAD OSTEONECROSIS
11.2.1 TRAUMATIC
11.2.2 NON-TRAUMATIC
11.2.3 IDIOPATHIC OSTEONECROSIS
11.2.3.1 LEGG-CALVE-PERTHES DISEASE
11.2.3.1.1 TREATMENT
11.2.3.1.1.1 NON-SURGICAL
11.2.3.1.1.1.1 ANTI-INFLAMMATORY MEDICATION
11.2.3.1.1.1.1.1 IBUPROFEN
11.2.3.1.1.1.1.2 ASPIRIN
11.2.3.1.1.1.1.3 NAPROXEN SODIUM
11.2.3.1.1.1.1.4 NABUMETONE
11.2.3.1.1.1.1.5 OTHERS
11.2.3.1.1.1.2 BISPHOSPHONATES MEDICATIONS
11.2.3.1.1.1.2.1 ALENDRONATE
11.2.3.1.1.1.2.2 RISEDRONATE
11.2.3.1.1.1.2.3 IBANDRONATE
11.2.3.1.1.1.2.4 ZOLEDRONIC ACID
11.2.3.1.1.1.2.5 PAMIDRONATE
11.2.3.1.1.1.2.6 OTHERS
11.2.3.1.1.1.3 CRUTCHES
11.2.3.1.1.1.3.1 AXILLA CRUTCHES
11.2.3.1.1.1.3.2 ELBOW CRUTCHES
11.2.3.1.1.1.3.3 GUTTER CRUTCHES
11.2.3.1.1.1.4 CASTINGS & BRACINGS
11.2.3.1.1.1.4.1 NEWINGTON BRACE
11.2.3.1.1.1.4.2 TORONTO ORTHOSIS
11.2.3.1.1.1.4.3 SCOTTISH RITE ORTHOSIS
11.2.3.1.1.1.4.4 BROOMSTICK PLASTERS
11.2.3.1.1.1.4.5 BIRMINGHAM ORTHOSIS
11.2.3.1.1.2 SURGICAL
11.2.3.1.1.2.1 FEMORAL OSTEOTOMY
11.2.3.1.1.2.1.1 FEMORAL DEROTATION OSTEOTOMY
11.2.3.1.1.2.1.2 VARUS DEROTATION OSTEOTOMY
11.2.3.1.1.2.2 INNOMINATE OSTEOTOMY
11.2.3.1.1.2.2.1 SALTER (SINGLE INNOMINATE OSTEOTOMY)
11.2.3.1.1.2.2.2 SUTHERLAND (DOUBLE INNOMINATE OSTEOTOMY)
11.2.3.1.1.2.2.3 STEEL, TONNIS OR CARLOS (TRIPLE INNOMINATE OSTEOTOMY)
11.2.3.1.1.2.2.4 GANZ (PERIACETABULAR)
11.2.3.1.1.2.3 SHELF ARTHROPLASTY
11.2.3.1.1.2.4 OTHERS
11.2.3.1.2 DIAGNOSIS
11.2.3.1.2.1 MAGNETIC RESONANCE IMAGING (MRI)
11.2.3.1.2.1.1 CLOSED BORE
11.2.3.1.2.1.1.1 LOW FIELD STRENGTH
11.2.3.1.2.1.1.2 MID FIELD STRENGTH
11.2.3.1.2.1.1.3 HIGH FIELD STRENGTH
11.2.3.1.2.1.2 OPEN BORE
11.2.3.1.2.1.2.1 LOW FIELD STRENGTH
11.2.3.1.2.1.2.2 MID FIELD STRENGTH
11.2.3.1.2.1.2.3 HIGH FIELD STRENGTH
11.2.3.1.2.2 COMPUTED TOMOGRAPHY SCANNING
11.2.3.1.2.2.1 HIGH END SLICE
11.2.3.1.2.2.2 MID END SLICE
11.2.3.1.2.2.3 LOW END SLICE
11.2.3.1.2.2.4 CONE BEAN
11.2.3.1.2.3 X-RAY IMAGING
11.2.3.1.2.3.1 RADIOGRAPHY
11.2.3.1.2.3.1.1 DIGITAL IMAGING
11.2.3.1.2.3.1.2 FILM-BASED IMAGING
11.2.3.1.2.3.2 FLUOROSCOPY
11.2.3.1.2.3.2.1 DIGITAL IMAGING
11.2.3.1.2.3.2.2 FILM-BASED IMAGING
11.2.3.1.2.3.3 OTHERS
11.2.3.1.2.4 OTHERS
11.2.3.2 OTHERS
11.3 OSTEONECROSIS OF THE KNEE
11.3.1 TRAUMATIC
11.3.2 NON-TRAUMATIC
11.3.3 IDIOPATHIC OSTEONECROSIS
11.4 OSTEONECROSIS OF THE SHOULDER
11.4.1 TRAUMATIC
11.4.2 NON-TRAUMATIC
11.4.3 IDIOPATHIC OSTEONECROSIS
11.5 OSTEONECROSIS OF THE TALUS
11.5.1 TRAUMATIC
11.5.2 NON-TRAUMATIC
11.5.3 IDIOPATHIC OSTEONECROSIS
11.6 OSTEONECROSIS OF THE LUNATE
11.6.1 TRAUMATIC
11.6.2 NON-TRAUMATIC
11.6.3 IDIOPATHIC OSTEONECROSIS
11.7 OSTEONECROSIS OF THE SCAPHOID
11.7.1 TRAUMATIC
11.7.2 NON-TRAUMATIC
11.7.3 IDIOPATHIC OSTEONECROSIS
11.8 OTHERS
12 U.S. OSTEONECROSIS MARKET, BY DRUG TYPE
12.1 OVERVIEW
12.2 BRANDED
12.2.1 ORAL
12.2.1.1 TABLETS
12.2.1.2 CAPSULES
12.2.2 PARENTERAL
12.2.3 OTHERS
12.3 GENERIC
12.3.1 ORAL
12.3.1.1 TABLETS
12.3.1.2 CAPSULES
12.3.2 PARENTERAL
12.3.3 OTHERS
13 U.S. OSTEONECROSIS MARKET, BY PRESCRIPTION
13.1 OVERVIEW
13.2 PRESCRIBED DRUGS
13.3 OVER THE COUNTER DRUGS
14 U.S. OSTEONECROSIS MARKET, BY GENDER
14.1 OVERVIEW
14.2 MALE
14.3 FEMALE
15 U.S. OSTEONECROSIS MARKET, BY AGE
15.1 OVERVIEW
15.2 ADULT
15.3 GERIATRIC
15.4 CHILDREN
16 U.S. OSTEONECROSIS MARKET, BY END USER
16.1 OVERVIEW
16.2 HOSPITALS
16.2.1 PUBLIC
16.2.2 PRIVATE
16.3 ORTHOPEDIC CLINICS
16.4 SPECIALTY CLINICS
16.5 AMBULATORY CENTERS
16.6 OTHERS
17 U.S. OSTEONECROSIS MARKET, BY DISTRIBUTION CHANNEL
17.1 OVERVIEW
17.2 RETAIL SALES
17.2.1 HOSPITAL PHARMACY
17.2.2 RETAIL PHARMACY
17.2.3 ONLINE PHARMACY
17.3 DIRECT TENDER
18 U.S. OSTEONECROSIS MARKET, COMPANY LANDSCAPE
18.1 COMPANY SHARE ANALYSIS: U.S.
19 SWOT ANALYSIS
20 U.S. OSTEONECROSIS MARKET, CPS
20.1 TEVA PHARMACEUTICALS USA, INC. (SUBSIDIARY OF TEVA PHARMACEUTICAL INDUSTRIES LTD.)
20.1.1 COMPANY SNAPSHOT
20.1.2 REVENUE ANALYSIS
20.1.3 PRODUCT PORTFOLIO
20.1.4 RECENT DEVELOPMENT
20.2 PFIZER INC. (2022)
20.2.1 COMPANY SNAPSHOT
20.2.2 REVENUE ANALYSIS
20.2.3 PRODUCT PORTFOLIO
20.2.4 RECENT DEVELOPMENT
20.3 BAYER AG (2022)
20.3.1 COMPANY SNAPSHOT
20.3.2 REVENUE ANALYSIS
20.3.3 PRODUCT PORTFOLIO
20.3.4 RECENT DEVELOPMENT
20.4 STRYKER
20.4.1 COMPANY SNAPSHOT
20.4.2 REVENUE ANALYSIS
20.4.3 PRODUCT PORTFOLIO
20.4.4 RECENT DEVELOPMENT
20.5 ARTHREX, INC.
20.5.1 COMPANY SNAPSHOT
20.5.2 PRODUCT PORTFOLIO
20.5.3 RECENT DEVELOPMENT
20.6 ALMATICA PHARMA
20.6.1 COMPANY SNAPSHOT
20.6.2 PRODUCT PORTFOLIO
20.6.3 RECENT DEVELOPMENT
20.7 DR. REDDY'S LABORATORIES LTD. (2022)
20.7.1 COMPANY SNAPSHOT
20.7.2 REVENUE ANALYSIS
20.7.3 PRODUCT PORTFOLIO
20.7.4 RECENT DEVELOPMENT
20.8 HALEON GROUP OF COMPANIES
20.8.1 COMPANY SNAPSHOT
20.8.2 REVENUE ANALYSIS
20.8.3 PRODUCT PORTFOLIO
20.8.4 RECENT DEVELOPMENT
20.9 SCIEGEN PHARMACEUTICALS.
20.9.1 COMPANY SNAPSHOT
20.9.2 PRODUCT PORTFOLIO
20.9.3 RECENT DEVELOPMENT
20.1 ZIMMER BIOMET
20.10.1 COMPANY SNAPSHOT
20.10.2 REVENUE ANALYSIS
20.10.3 PRODUCT PORTFOLIO
20.10.4 RECENT DEVELOPMENT
21 QUESTIONNAIRE
22 RELATED REPORTS
List of Table
TABLE 1 COST OF OSTEONECROSIS TREATMENT SURGERIES
TABLE 2 U.S. OSTEONECROSIS MARKET, PIPELINE ANALYSIS
TABLE 3 U.S. OSTEONECROSIS MARKET, BY DISEASE TYPE, 2021-2030 (USD THOUSAND)
TABLE 4 U.S. OSTEONECROSIS MARKET, BY TYPE, 2021-2030 (USD THOUSAND)
TABLE 5 U.S. TREATMENT IN OSTEONECROSIS MARKET, BY TYPE, 2021-2030 (USD THOUSAND)
TABLE 6 U.S. SURGERY IN OSTEONECROSIS MARKET, BY TREATMENT, 2021-2030 (USD THOUSAND)
TABLE 7 U.S. MEDICATION IN OSTEONECROSIS MARKET, BY TREATMENT, 2021-2030 (USD THOUSAND)
TABLE 8 U.S. NSAIDS IN OSTEONECROSIS MARKET, BY TREATMENT, 2021-2030 (USD THOUSAND)
TABLE 9 U.S. BLOOD THINNERS IN OSTEONECROSIS MARKET, BY TREATMENT, 2021-2030 (USD THOUSAND)
TABLE 10 U.S. OSTEOPOROSIS DRUGS IN OSTEONECROSIS MARKET, BY TREATMENT, 2021-2030 (USD THOUSAND)
TABLE 11 U.S. CHOLESTEROL-LOWERING DRUGS IN OSTEONECROSIS MARKET, BY TREATMENT, 2021-2030 (USD THOUSAND)
TABLE 12 U.S. PHYSICAL THERAPY IN OSTEONECROSIS MARKET, BY TREATMENT, 2021-2030 (USD THOUSAND)
TABLE 13 U.S. CRUTCHES IN OSTEONECROSIS MARKET, BY TREATMENT, 2021-2030 (USD THOUSAND)
TABLE 14 U.S. AXILLA CRUTCHES IN OSTEONECROSIS MARKET, BY TREATMENT, 2021-2030 (USD THOUSAND)
TABLE 15 U.S. ELBOW CRUTCHES IN OSTEONECROSIS MARKET, BY TREATMENT, 2021-2030 (USD THOUSAND)
TABLE 16 U.S. OPEN-CUFF ELBOW CRUTCHES IN OSTEONECROSIS MARKET, BY TREATMENT, 2021-2030 (USD THOUSAND)
TABLE 17 U.S. CLOSED-CUFF ELBOW CRUTCHES IN OSTEONECROSIS MARKET, BY TREATMENT, 2021-2030 (USD THOUSAND)
TABLE 18 U.S. GUTTER CRUTCHES IN OSTEONECROSIS MARKET, BY TREATMENT, 2021-2030 (USD THOUSAND)
TABLE 19 U.S. CASTING AND BRACING IN OSTEONECROSIS MARKET, BY TREATMENT, 2021-2030 (USD THOUSAND)
TABLE 20 U.S. OTHERS IN OSTEONECROSIS MARKET, BY TREATMENT, 2021-2030 (USD THOUSAND)
TABLE 21 U.S. DIAGNOSIS IN OSTEONECROSIS MARKET, BY TYPE, 2021-2030 (USD THOUSAND)
TABLE 22 U.S. IMAGING TEST IN OSTEONECROSIS MARKET, BY TYPE, 2021-2030 (USD THOUSAND)
TABLE 23 U.S. MAGNETIC RESONANCE IMAGING (MRI) IN OSTEONECROSIS MARKET, BY TYPE, 2021-2030 (USD THOUSAND)
TABLE 24 U.S. CLOSED BORE IN OSTEONECROSIS MARKET, BY TYPE, 2021-2030 (USD THOUSAND)
TABLE 25 U.S. OPEN BORE IN OSTEONECROSIS MARKET, BY TYPE, 2021-2030 (USD THOUSAND)
TABLE 26 U.S. COMPUTED TOMOGRAPHY SCANNING IN OSTEONECROSIS MARKET, BY TYPE, 2021-2030 (USD THOUSAND)
TABLE 27 U.S. X-RAY IMAGING IN OSTEONECROSIS MARKET, BY TYPE, 2021-2030 (USD THOUSAND)
TABLE 28 U.S. RADIOGRAPHY IN OSTEONECROSIS MARKET, BY TYPE, 2021-2030 (USD THOUSAND)
TABLE 29 U.S. FLUOROSCOPY IN OSTEONECROSIS MARKET, BY TYPE, 2021-2030 (USD THOUSAND)
TABLE 30 U.S. OTHERS IN OSTEONECROSIS MARKET, BY TYPE, 2021-2030 (USD THOUSAND)
TABLE 31 U.S. ULTRASOUND IN OSTEONECROSIS MARKET, BY TYPE, 2021-2030 (USD THOUSAND)
TABLE 32 U.S. 2D ULTRASOUND IN OSTEONECROSIS MARKET, BY TYPE, 2021-2030 (USD THOUSAND)
TABLE 33 U.S. DOPPLER ULTRASOUND IN OSTEONECROSIS MARKET, BY TYPE, 2021-2030 (USD THOUSAND)
TABLE 34 U.S. 3D & 4D ULTRASOUND IN OSTEONECROSIS MARKET, BY TYPE, 2021-2030 (USD THOUSAND)
TABLE 35 U.S. BIOPSY IN OSTEONECROSIS MARKET, BY TYPE, 2021-2030 (USD THOUSAND)
TABLE 36 U.S. OSTEONECROSIS MARKET, BY STAGES, 2021-2030 (USD THOUSAND)
TABLE 37 U.S. OSTEONECROSIS MARKET, BY LOCATION, 2021-2030 (USD THOUSAND)
TABLE 38 U.S. OSTEONECROSIS OF HIP/FEMORAL HEAD OSTEONECROSIS IN OSTEONECROSIS MARKET, BY DISEASE TYPE, 2021-2030 (USD THOUSAND)
TABLE 39 U.S. IDIOPATHIC OSTEONECROSIS IN OSTEONECROSIS MARKET, BY DISEASE TYPE, 2021-2030 (USD THOUSAND)
TABLE 40 U.S. LEGG-CALVE-PERTHES DISEASE IN OSTEONECROSIS MARKET, BY TYPE, 2021-2030 (USD THOUSAND)
TABLE 41 U.S. TREATMENT IN OSTEONECROSIS MARKET, BY TYPE, 2021-2030 (USD THOUSAND)
TABLE 42 U.S. NON-SURGICAL IN OSTEONECROSIS MARKET, BY TYPE, 2021-2030 (USD THOUSAND)
TABLE 43 U.S. ANTI-INFLAMMATORY MEDICATIONS IN OSTEONECROSIS MARKET, BY TYPE, 2021-2030 (USD THOUSAND)
TABLE 44 U.S. BISPHOSPHONATES MEDICATIONS IN OSTEONECROSIS MARKET, BY TYPE, 2021-2030 (USD THOUSAND)
TABLE 45 U.S. CRUTCHES IN OSTEONECROSIS MARKET, BY TYPE, 2021-2030 (USD THOUSAND)
TABLE 46 U.S. CASTING AND BRACING IN OSTEONECROSIS MARKET, BY TREATMENT, 2021-2030 (USD THOUSAND)
TABLE 47 U.S. SURGICAL IN OSTEONECROSIS MARKET, BY TYPE, 2021-2030 (USD THOUSAND)
TABLE 48 U.S. FEMORAL OSTEOTOMY IN OSTEONECROSIS MARKET, BY TYPE, 2021-2030 (USD THOUSAND)
TABLE 49 U.S. INNOMINATE OSTEOTOMY IN OSTEONECROSIS MARKET, BY TYPE, 2021-2030 (USD THOUSAND)
TABLE 50 U.S. DIAGNOSIS IN OSTEONECROSIS MARKET, BY TYPE, 2021-2030 (USD THOUSAND)
TABLE 51 U.S. MAGNETIC RESONANCE IMAGING (MRI) IN OSTEONECROSIS MARKET, BY TYPE, 2021-2030 (USD THOUSAND)
TABLE 52 U.S. CLOSED BORE IN OSTEONECROSIS MARKET, BY TYPE, 2021-2030 (USD THOUSAND)
TABLE 53 U.S. OPEN BORE IN OSTEONECROSIS MARKET, BY TYPE, 2021-2030 (USD THOUSAND)
TABLE 54 U.S. COMPUTED TOMOGRAPHY SCANNING IN OSTEONECROSIS MARKET, BY TYPE, 2021-2030 (USD THOUSAND)
TABLE 55 U.S. X-RAY IMAGING IN OSTEONECROSIS MARKET, BY TYPE, 2021-2030 (USD THOUSAND)
TABLE 56 U.S. RADIOGRAPHY IN OSTEONECROSIS MARKET, BY TYPE, 2021-2030 (USD THOUSAND)
TABLE 57 U.S. FLUOROSCOPY IN OSTEONECROSIS MARKET, BY TYPE, 2021-2030 (USD THOUSAND)
TABLE 58 U.S. OSTEONECROSIS OF THE KNEE IN OSTEONECROSIS MARKET, BY DISEASE TYPE, 2021-2030 (USD THOUSAND)
TABLE 59 U.S. OSTEONECROSIS OF THE SHOULDER IN OSTEONECROSIS MARKET, BY DISEASE TYPE, 2021-2030 (USD THOUSAND)
TABLE 60 U.S. OSTEONECROSIS OF THE TALUS IN OSTEONECROSIS MARKET, BY DISEASE TYPE, 2021-2030 (USD THOUSAND)
TABLE 61 U.S. OSTEONECROSIS OF THE LUNATE IN OSTEONECROSIS MARKET, BY DISEASE TYPE, 2021-2030 (USD THOUSAND)
TABLE 62 U.S. OSTEONECROSIS OF THE SCAPHOID IN OSTEONECROSIS MARKET, BY DISEASE TYPE, 2021-2030 (USD THOUSAND)
TABLE 63 U.S. OSTEONECROSIS MARKET, BY DRUG TYPE, 2021-2030 (USD THOUSAND)
TABLE 64 U.S. BRANDED IN OSTEONECROSIS MARKET, BY DRUG TYPE, 2021-2030 (USD THOUSAND)
TABLE 65 U.S. ORAL IN OSTEONECROSIS MARKET, BY DRUG TYPE, 2021-2030 (USD THOUSAND)
TABLE 66 U.S. GENERIC IN OSTEONECROSIS MARKET, BY DRUG TYPE, 2021-2030 (USD THOUSAND)
TABLE 67 U.S. ORAL IN OSTEONECROSIS MARKET, BY DRUG TYPE, 2021-2030 (USD THOUSAND)
TABLE 68 U.S. OSTEONECROSIS MARKET, BY PRESCRIPTION, 2021-2030 (USD THOUSAND)
TABLE 69 U.S. OSTEONECROSIS MARKET, BY GENDER, 2021-2030 (USD THOUSAND)
TABLE 70 U.S. OSTEONECROSIS MARKET, BY AGE, 2021-2030 (USD THOUSAND)
TABLE 71 U.S. OSTEONECROSIS MARKET, BY END USER, 2021-2030 (USD THOUSAND)
TABLE 72 U.S. HOSPITALS IN OSTEONECROSIS MARKET, BY TYPE, 2021-2030 (USD THOUSAND)
TABLE 73 U.S. OSTEONECROSIS MARKET, BY DISTRIBUTION CHANNEL, 2021-2030 (USD THOUSAND)
TABLE 74 U.S. RETAIL SALES IN OSTEONECROSIS MARKET, BY DISTRIBUTION CHANNEL, 2021-2030 (USD THOUSAND)
List of Figure
FIGURE 1 U.S. OSTEONECROSIS MARKET: SEGMENTATION
FIGURE 2 U.S. OSTEONECROSIS MARKET: DATA TRIANGULATION
FIGURE 3 U.S. OSTEONECROSIS MARKET: DROC ANALYSIS
FIGURE 4 U.S. OSTEONECROSIS MARKET: GLOBAL VS REGIONAL MARKET ANALYSIS
FIGURE 5 U.S. OSTEONECROSIS MARKET: COMPANY RESEARCH ANALYSIS
FIGURE 6 U.S. OSTEONECROSIS MARKET: INTERVIEW DEMOGRAPHICS
FIGURE 7 U.S. OSTEONECROSIS MARKET: DBMR MARKET POSITION GRID
FIGURE 8 U.S. OSTEONECROSIS MARKET: MARKET END USER COVERAGE GRID
FIGURE 9 U.S. OSTEONECROSIS MARKET: VENDOR SHARE ANALYSIS
FIGURE 10 U.S. OSTEONECROSIS MARKET: SEGMENTATION
FIGURE 11 INCREASING NUMBER OF TRAUMATIC INJURIES IS EXPECTED TO DRIVE THE GROWTH OF THE U.S. OSTEONECROSIS MARKET IN THE FORECAST PERIOD
FIGURE 12 THE TRAUMATIC SEGMENT IS EXPECTED TO ACCOUNT FOR THE LARGEST SHARE OF THE U.S. OSTEONECROSIS MARKET IN 2023 AND 2030
FIGURE 13 DRIVERS, RESTRAINS, OPPORTUNITIES, AND CHALLENGES OF THE ASIA-PACIFIC KNEE CARTILAGE REPAIR MARKET
FIGURE 14 U.S. OSTEONECROSIS MARKET: BY DISEASE TYPE, 2022
FIGURE 15 U.S. OSTEONECROSIS MARKET: BY DISEASE TYPE, 2023-2030 (USD THOUSAND)
FIGURE 16 U.S. OSTEONECROSIS MARKET: BY DISEASE TYPE, CAGR (2023-2030)
FIGURE 17 U.S. OSTEONECROSIS MARKET: BY DISEASE TYPE, LIFELINE CURVE
FIGURE 18 U.S. OSTEONECROSIS MARKET: BY TYPE, 2022
FIGURE 19 U.S. OSTEONECROSIS MARKET: BY TYPE, 2023-2030 (USD THOUSAND)
FIGURE 20 U.S. OSTEONECROSIS MARKET: BY TYPE, CAGR (2023-2030)
FIGURE 21 U.S. OSTEONECROSIS MARKET: BY TYPE, LIFELINE CURVE
FIGURE 22 U.S. OSTEONECROSIS MARKET: BY STAGES, 2022
FIGURE 23 U.S. OSTEONECROSIS MARKET: BY STAGES, 2023-2030 (USD THOUSAND)
FIGURE 24 U.S. OSTEONECROSIS MARKET: BY STAGES, CAGR (2023-2030)
FIGURE 25 U.S. OSTEONECROSIS MARKET: BY STAGES, LIFELINE CURVE
FIGURE 26 U.S. OSTEONECROSIS MARKET: BY LOCATION, 2022
FIGURE 27 U.S. OSTEONECROSIS MARKET: BY LOCATION, 2023-2030 (USD THOUSAND)
FIGURE 28 U.S. OSTEONECROSIS MARKET: BY LOCATION, CAGR (2023-2030)
FIGURE 29 U.S. OSTEONECROSIS MARKET: BY LOCATION, LIFELINE CURVE
FIGURE 30 U.S. OSTEONECROSIS MARKET: BY DRUG TYPE, 2022
FIGURE 31 U.S. OSTEONECROSIS MARKET: BY DRUG TYPE, 2023-2030 (USD THOUSAND)
FIGURE 32 U.S. OSTEONECROSIS MARKET: BY DRUG TYPE, CAGR (2023-2030)
FIGURE 33 U.S. OSTEONECROSIS MARKET: BY DRUG TYPE, LIFELINE CURVE
FIGURE 34 U.S. OSTEONECROSIS MARKET: BY PRESCRIPTION, 2022
FIGURE 35 U.S. OSTEONECROSIS MARKET: BY PRESCRIPTION, 2023-2030 (USD THOUSAND)
FIGURE 36 U.S. OSTEONECROSIS MARKET: BY PRESCRIPTION, CAGR (2023-2030)
FIGURE 37 U.S. OSTEONECROSIS MARKET: BY PRESCRIPTION, LIFELINE CURVE
FIGURE 38 U.S. OSTEONECROSIS MARKET: BY GENDER, 2022
FIGURE 39 U.S. OSTEONECROSIS MARKET: BY GENDER, 2023-2030 (USD THOUSAND)
FIGURE 40 U.S. OSTEONECROSIS MARKET: BY GENDER, CAGR (2023-2030)
FIGURE 41 U.S. OSTEONECROSIS MARKET: BY GENDER, LIFELINE CURVE
FIGURE 42 U.S. OSTEONECROSIS MARKET: BY AGE, 2022
FIGURE 43 U.S. OSTEONECROSIS MARKET: BY AGE, 2023-2030 (USD THOUSAND)
FIGURE 44 U.S. OSTEONECROSIS MARKET: BY AGE, CAGR (2023-2030)
FIGURE 45 U.S. OSTEONECROSIS MARKET: BY AGE, LIFELINE CURVE
FIGURE 46 U.S. OSTEONECROSIS MARKET: BY END USER, 2022
FIGURE 47 U.S. OSTEONECROSIS MARKET: BY END USER, 2023-2030 (USD THOUSAND)
FIGURE 48 U.S. OSTEONECROSIS MARKET: BY END USER, CAGR (2023-2030)
FIGURE 49 U.S. OSTEONECROSIS MARKET: BY END USER, LIFELINE CURVE
FIGURE 50 U.S. OSTEONECROSIS MARKET: BY DISTRIBUTION CHANNEL, 2022
FIGURE 51 U.S. OSTEONECROSIS MARKET: BY DISTRIBUTION CHANNEL, 2023-2030 (USD THOUSAND)
FIGURE 52 U.S. OSTEONECROSIS MARKET: BY DISTRIBUTION CHANNEL, CAGR (2023-2030)
FIGURE 53 U.S. OSTEONECROSIS MARKET: BY DISTRIBUTION CHANNEL, LIFELINE CURVE
FIGURE 54 U.S. OSTEONECROSIS MARKET: COMPANY SHARE 2022 (%)
Data collection and base year analysis are done using data collection modules with large sample sizes. The stage includes obtaining market information or related data through various sources and strategies. It includes examining and planning all the data acquired from the past in advance. It likewise envelops the examination of information inconsistencies seen across different information sources. The market data is analysed and estimated using market statistical and coherent models. Also, market share analysis and key trend analysis are the major success factors in the market report. To know more, please request an analyst call or drop down your inquiry.
The key research methodology used by DBMR research team is data triangulation which involves data mining, analysis of the impact of data variables on the market and primary (industry expert) validation. Data models include Vendor Positioning Grid, Market Time Line Analysis, Market Overview and Guide, Company Positioning Grid, Patent Analysis, Pricing Analysis, Company Market Share Analysis, Standards of Measurement, Global versus Regional and Vendor Share Analysis. To know more about the research methodology, drop in an inquiry to speak to our industry experts.
Data Bridge Market Research is a leader in advanced formative research. We take pride in servicing our existing and new customers with data and analysis that match and suits their goal. The report can be customized to include price trend analysis of target brands understanding the market for additional countries (ask for the list of countries), clinical trial results data, literature review, refurbished market and product base analysis. Market analysis of target competitors can be analyzed from technology-based analysis to market portfolio strategies. We can add as many competitors that you require data about in the format and data style you are looking for. Our team of analysts can also provide you data in crude raw excel files pivot tables (Fact book) or can assist you in creating presentations from the data sets available in the report.


