Asia-Pacific Glassware Market, By Material (Soda Lime Glass, Lead Glass, Heat Resistant and Others), Style (Stemless Glass, Stemware, Everyday Usage, and Others), Distribution Channel (B2B, Specialized Stores, Supermarkets/Hypermarkets, E-Commerce, and Others), Price Range (Medium, Premium, and Economy), End-Use (Hotels & Restaurants, Bars & Café, Household, Corporate Canteens, and Others) Industry Trends and Forecast to 2029.
Market Analysis and Size
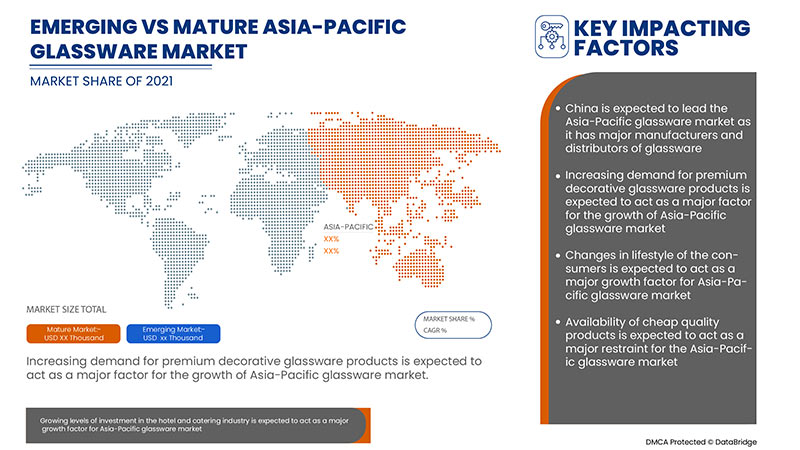
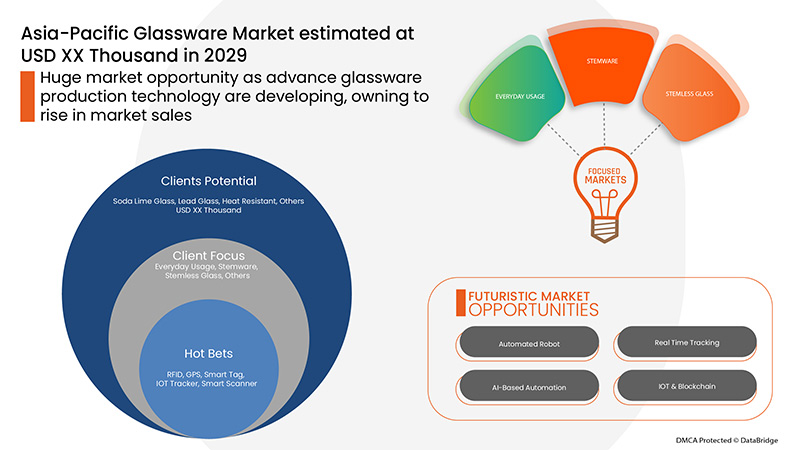
Growing levels of investment in the hotel and catering industry are expected to act as a driver for the growth of the glassware market in the forecast period. Changes in the lifestyle of the consumers are expected to act as a driver for the growth of the glassware market in the forecast period of 2022-2029. Advancements in glassware production technologies are expected to bring growth opportunities for the glassware market in future.
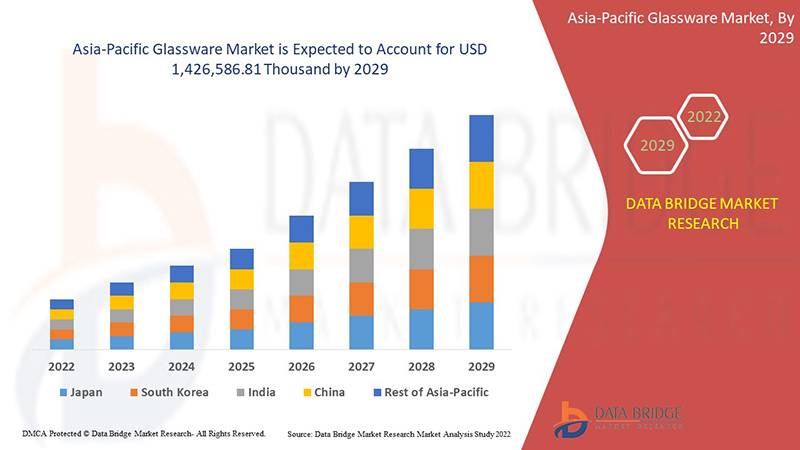
Data Bridge Market Research analyses that the glassware market is expected to reach the value of USD 1,426,586.81 thousand by 2029, at a CAGR of 5.6% during the forecast period. "soda-lime" accounts for the most prominent material segment as this type of glass provides scratch resistant surfaces. The glassware market report also covers pricing analysis, patent analysis, and technological advancements in depth.
|
Report Metric |
Details |
|
Forecast Period |
2022 to 2029 |
|
Base Year |
2021 |
|
Historic Years |
2020 |
|
Quantitative Units |
Revenue in USD Thousand, Volume in Units, Pricing in USD |
|
Segments Covered |
By Material (Soda Lime Glass, Lead Glass, Heat Resistant, and Others), Style (Stemless Glass, Stemware, Everyday Usage, and Others), Distribution Channel (B2B, Specialized Stores, Supermarkets/Hypermarkets, E-Commerce, and Others), Price Range (Medium, Premium, and Economy), End-Use (Hotels & Restaurants, Bars & Café, Household, Corporate Canteens, and Others) |
|
Countries Covered |
China, Japan, India, South Korea, Singapore, Malaysia, Australia & New Zealand, Thailand, Indonesia, Philippines, Hong Kong. Taiwan, Myanmar, Laos, Cambodia, Rest of Asia-Pacific (APAC) in the Asia-Pacific (APAC) |
|
Market Players Covered |
Hrastnik1860, Oneida, NoritakeChina, Ocean Glass Public Company Limited, Lenox Corporation, Treo.in, Libbey Inc, Fiskars Group, WMF (A Subsidiary of Groupe SEB), Lifetime Brands, Inc, Villeroy & Boch, Bormioli Rocco S.p.A., Wonderchef Home Appliances Pvt. Ltd., The Zrike Company, Inc, Shandong Hikingpac Co., Ltd., Addresshome, Stölzle Lausitz GmbH, Eagle Glass Deco (P.) Ltd., Degrenne, Cello World, MYBOROSIL, Jiangsu Rongtai Glass Products Co., Ltd., Cumbria Crystal, Garbo Glassware among others |
Market Definition
Glass is a brittle, rigid material that is generally clear or translucent. It might be made of a mixture of sand, soda, lime, or other minerals. The most typical glass formation method involves heating raw ingredients until they become molten liquid, then rapidly cooling the mixture to make toughened glass. Glass varieties may be classified based on their mechanical and thermal qualities to identify which applications are most suited.
Soda lime glass: Soda-lime glass is the most common form of glass used for windowpanes and glass containers such as bottles and jars for drinks, food, and certain commodities items.
Lead Glass: Lead glass is a glass with a high percentage of lead oxide with exceptional clarity and brightness.
Heat Resistant: Heat-resistant glass is intended to withstand heat stress and is commonly used in kitchens and industrial applications.
Glassware Market Dynamics
This section deals with understanding the market drivers, advantages, opportunities, restraints, and challenges. All of this is discussed in detail below:
- Growing levels of investment in the hotel and catering industry
Tourism has enhanced the business of the hotel and restaurant sector all over the world and provided great scope for the hotel industry. The industry has flourished mainly through tourism and due to diverse landscapes, beliefs, and societies in different countries which provided a great attraction to tourists from different regions. The hotel and catering sectors of many nations have gradually expanded over the last two decades, and development is predicted in the next years, coupled with an increase in demand for various types of glassware goods.
- Changes in lifestyle of the consumers
Consumer lives are constantly evolving. Consumer habits and values are influenced by existing and new trends, as well as the continuously changing demographic mix, worldwide cultural upheavals, and fast developments in technology. Businesses may capitalize on new possibilities by acquiring a deep understanding of customer preferences following shifting behaviours and beliefs. In recent times, consumers from all generations are focusing more on branded products in many areas of their daily lives.
- Rising popularity of fine dining across the globe
A fine dining restaurant is either a specialty or a multi-cuisine establishment that places a premium on quality ingredients, presentation, and impeccable service. The category is increasing at a respectable pace of 15%, which has encouraged the arrival of premium Michelin-starred restaurants and other local competitors. Therefore, the growing demand for fine delicate dining is mainly accomplished by the successful operations of different types of brands of glassware products in hotels and restaurants.
- Availability of cheap quality products
Glass is one of the most complex and adaptable materials, and it is utilized in nearly every industry. The extensive use of glass contributes to the creation of a very hi-tech and modern appearance in both residential and commercial structures. Glass comes in a variety of shapes and sizes to suit a variety of applications and is used in a variety of architectural applications such as doors, windows, and partitions. Glass has come a long way from its humble beginnings as a windowpane to become a sophisticated structural component in the current day.
- Rising demand for steel and paper base drinkware
Paper and plastic are increasingly being used to make disposable plates and glasses, owing to their great environmental performance and rising demand for e-commerce and delivery services. Consumers, brands, and retailers all have high expectations for recyclable paper-based goods. The recycling rate of paper-based materials is around 85 percent, and the paper value chain is improving day by day. To reach even higher recycling objectives while extending the usefulness of paper-based packaging, it is critical, to begin with, the design phase, taking into account both the intended purpose and the end-of-life.
Post-COVID-19 Impact on Glassware Market
COVID-19 created a major impact on the glassware market as almost every country has opted for the shutdown of every production facility except the ones dealing in producing the essential goods. The government has taken some strict actions such as the shutdown of production and sale of non-essential goods, blocked international trade, and many more to prevent the spread of COVID-19. The only business which is dealing with this pandemic situation is the essential services that are allowed to open and run the processes.
The growth of the glassware market is rising due to the government policies to boost international trade post-COVID-19. Also, the opening of lockdown is boosting the hospitality industry which is rising the demand for Glassware in the market. However, factors such as congestion associated with trade routes and trade restrictions between some nations are restraining the market growth. The shutdown of production facilities during the pandemic situation has had a significant impact on the market.
Manufacturers are making various strategic decisions to bounce back post-COVID-19. The players are conducting multiple research and development activities to improve the technology involved in the Glassware. With this, the companies will bring advanced and accurate solutions to the market. In addition, the government initiatives to boost international trade have led to the market's growth.
Recent Developments
- In October 2020, Libbey Inc. announced the confirmation of a plan of reorganization and expected to complete its court-supervised restructuring and emerge with a stronger balance sheet in the upcoming weeks. The company made this announcement to succeed in the current business operating environment.
- In October 2021, Lenox Corporation acquired Oneida Consumer LLC with its brand of table top products including flatware, dinnerware, and cutlery. The collaboration was undertaken to market a leading portfolio of brands and innovative goods with unrivalled customer awareness across a wide range of retail channels.
Asia-Pacific Glassware Market Scope
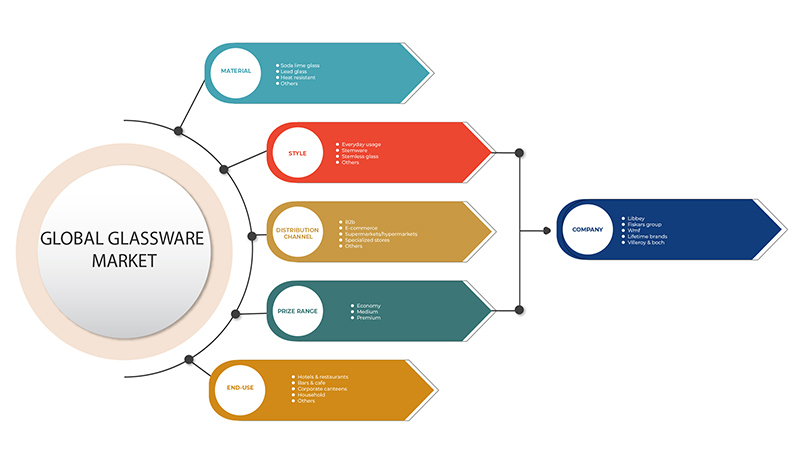
The glassware market is segmented based on material, style, distribution channel, price range, and end-use. The growth amongst these segments will help you analyze meager growth segments in the industries and provide the users with a valuable market overview and market insights to help them make strategic decisions for identifying core market applications.
By Material
- Soda Lime Glass
- Lead Glass
- Heat Resistant
- Others
Based on material, the glassware market is segmented into soda lime glass, lead glass, heat resistant, and others.
By Style
- Stemless Glass
- Stemware
- Everyday Usage
- Others
Based on style, the glassware market has been segmented into stemless glass, stemware, everyday usage, and others.
By Distribution Channel
- B2B
- Specialized Stores
- Supermarkets/Hypermarkets
- E-Commerce
- Others
Based on distribution channel, the glassware market has been segmented into b2b, specialized stores, supermarkets/hypermarkets, e-commerce, and others.
By Price Range
- Medium
- Premium
- Economy
Based on price range, the glassware market has been segmented into medium, premium, and economy.
By End-Use
- Hotels & Restaurants
- Bars & Cafe
- Household
- Corporate Canteens
- Others
Based on end-use, the glassware market has been segmented into hotels & restaurants, bars & café, household, corporate canteens, and others.
Glassware Market Regional Analysis/Insights
The glassware market is analysed and market size insights and trends are provided by country, material, style, distribution channel, price range, and end-use as referenced above.
The countries covered in the glassware market report are China, Japan, India, South Korea, Singapore, Malaysia, Australia, Thailand, Indonesia, Philippines, Hong Kong. Taiwan, Myanmar, Laos, Cambodia. Rest of Asia-Pacific (APAC) in the Asia-Pacific (APAC).
China dominates the Asia-Pacific glassware market. China is likely to be the fastest-growing Asia-Pacific Glassware market. The rising infrastructure, commercial, and industrial developments in emerging countries such as China, Japan, India, and South Korea are credited with the market's dominance. With the increasing development in the countries number of restaurants and bars is increasing, which will boost the demand for glassware products in the Asia-Pacific region.
The country section of the report also provides individual market impacting factors and changes in market regulation that impact the current and future trends of the market. Data points like downstream and upstream value chain analysis, technical trends and porter's five forces analysis, case studies are some of the pointers used to forecast the market scenario for individual countries. Also, the presence and availability of Asia-Pacific brands and their challenges faced due to large or scarce competition from local and domestic brands, impact of domestic tariffs and trade routes are considered while providing forecast analysis of the country data.
Competitive Landscape and Glassware Market Share Analysis
The glassware market competitive landscape provides details by competitor. Details included are company overview, company financials, revenue generated, market potential, investment in research and development, new market initiatives, Asia-Pacific presence, production sites and facilities, production capacities, company strengths and weaknesses, product launch, product width and breadth, application dominance. The above data points provided are only related to the companies' focus related to glassware market.
Some of the major players operating in the glassware market are Hrastnik1860, Oneida, Noritake China, Ocean Glass Public Company Limited, Lenox Corporatio, Treo.in, Libbey Inc, Fiskars Group, WMF (A Subsidiary of Groupe SEB), Lifetime Brands, Inc, Villeroy & Boch, Bormioli Rocco S.p.A., Wonderchef Home Appliances Pvt. Ltd., The Zrike Company, Inc, Shandong Hikingpac Co., Ltd., Addresshome, Stölzle Lausitz GmbH, Eagle Glass Deco (P.) Ltd., Degrenne. Cello World, MYBOROSIL, Jiangsu Rongtai Glass Products Co., Ltd., Cumbria Crystal, Garbo Glassware.
SKU-

目录
1 INTRODUCTION
1.1 OBJECTIVES OF THE STUDY
1.2 MARKET DEFINITION
1.3 OVERVIEW OF ASIA PACIFIC GLASSWARE MARKET
1.4 LIMITATIONS
1.5 MARKETS COVERED
2 MARKET SEGMENTATION
2.1 MARKETS COVERED
2.2 GEOGRAPHICAL SCOPE
2.3 YEARS CONSIDERED FOR THE STUDY
2.4 CURRENCY AND PRICING
2.5 DBMR TRIPOD DATA VALIDATION MODEL
2.6 MATERIAL TIME LINE CURVE
2.7 MULTIVARIATE MODELING
2.8 PRIMARY INTERVIEWS WITH KEY OPINION LEADERS
2.9 DBMR MARKET POSITION GRID
2.1 MARKET APPLICATION COVERAGE GRID
2.11 DBMR MARKET CHALLENGE MATRIX
2.12 VENDOR SHARE ANALYSIS
2.13 SECONDARY SOURCES
2.14 ASSUMPTIONS
3 EXECUTIVE SUMMARY
4 PREMIUM INSIGHTS
4.1 PORTER'S MODEL
4.2 CONSUMER BEHAVIOUR PATTERN
4.3 FACTORS INFLUENCING BUYING DECISION
4.3.1 PSYCHOLOGICAL FACTORS
4.3.2 SOCIAL FACTORS
4.3.3 CULTURAL FACTORS
4.3.4 PERSONAL FACTORS
4.3.5 ECONOMIC FACTORS
4.4 KEY TRENDS
4.4.1 BOROSILICATE GLASSWARE IS A GAME-CHANGER
4.4.2 OMNI-CHANNEL STRATEGY USAGE IS ENCOURAGING THE GROWTH OF THE GLASSWARE MARKET
4.4.3 BEVERAGE INDUSTRY TO REGISTER SIGNIFICANT GROWTH
4.4.4 INCREASE IN TABLEWARE PRODUCTS
4.5 PRICING ANALYSIS
4.6 PRODUCT ADOPTION SCENARIO
5 MARKET OVERVIEW
5.1 DRIVERS
5.1.1 GROWING LEVELS OF INVESTMENT IN THE HOTEL AND CATERING INDUSTRY
5.1.2 CHANGES IN LIFESTYLE OF THE CONSUMERS
5.1.3 RISING POPULARITY OF FINE DINING ACROSS THE GLOBE
5.1.4 INCREASING DEMAND FOR PREMIUM DECORATIVE GLASSWARE PRODUCTS
5.2 RESTRAINTS
5.2.1 AVAILABILITY OF CHEAP QUALITY PRODUCTS
5.2.2 RISING DEMAND FOR STEEL AND PAPER BASE DRINKWARE
5.2.3 DIFFICULTY IN MAINTAINING THE GLASSWARE PRODUCTS
5.3 OPPORTUNITIES
5.3.1 ADVANCEMENTS IN GLASSWARE PRODUCTION TECHNOLOGIES
5.3.2 RISING DEMAND FOR GLASSWARE PRODUCTS FOR CLINICAL USE IN HOSPITALS AND FORENSIC LABORATORIES
5.4 CHALLENGES
5.4.1 COMPLEXITY IN MANUFACTURING GLASSWARE PRODUCTS
5.4.2 RISING DIFFICULTY IN RECYCLING GLASSWARE PRODUCTS
6 ASIA PACIFIC GLASSWARE MARKET, BY MATERIAL
6.1 OVERVIEW
6.2 SODA LIME GLASS
6.3 LEAD GLASS
6.4 HEAT RESISTANT
6.5 OTHERS
7 ASIA PACIFIC GLASSWARE MARKET, BY STYLE
7.1 OVERVIEW
7.2 STEMWARE
7.2.1 RED WINE GLASS
7.2.1.1 BORDEAUX
7.2.1.2 CABERNET
7.2.1.3 ZINFANDEL
7.2.1.4 BURGUNDY
7.2.1.5 PINOT NOIR
7.2.1.6 ROSE
7.2.2 WHITE WINE GLASS
7.2.2.1 SPARKLING
7.2.2.2 CHARDONNAY
7.2.2.3 VIOGNIER
7.2.2.4 SWEET WINE
7.2.2.5 VINTAGE
7.3 STEMLESS GLASS
7.3.1 LIQUOR GLASS
7.3.2 BEER GLASS
7.4 EVERYDAY USAGE
7.5 OTHERS
8 ASIA PACIFIC GLASSWARE MARKET, BY DISTRIBUTION CHANNEL
8.1 OVERVIEW
8.2 B2B
8.3 SPECIALIZED STORES
8.4 SUPERMARKETS/HYPERMARKETS
8.5 E-COMMERCE
8.6 OTHERS
9 ASIA PACIFIC GLASSWARE MARKET, BY PRICE RANGE
9.1 OVERVIEW
9.2 MEDIUM
9.3 PREMIUM
9.4 ECONOMY
10 ASIA PACIFIC GLASSWARE MARKET, BY END-USE
10.1 OVERVIEW
10.2 HOTELS & RESTAURANTS
10.3 BARS & CAFE
10.4 HOUSEHOLD
10.5 CORPORATE CANTEENS
10.6 OTHERS
11 ASIA PACIFIC GLASSWARE MARKET, BY GEOGRAPHY
11.1 ASIA-PACIFIC
11.1.1 CHINA
11.1.2 INDIA
11.1.3 JAPAN
11.1.4 SOUTH KOREA
11.1.5 SINGAPORE
11.1.6 MALAYSIA
11.1.7 THAILAND
11.1.8 AUSTRALIA AND NEW ZEALAND
11.1.9 INDONESIA
11.1.10 PHILIPPINES
11.1.11 HONG KONG
11.1.12 TAIWAN
11.1.13 MYANMAR
11.1.14 LAOS
11.1.15 CAMBODIA
11.1.16 REST OF ASIA-PACIFIC
12 ASIA PACIFIC GLASSWARE MARKET: COMPANY LANDSCAPE
12.1 COMPANY SHARE ANALYSIS: ASIA PACIFIC
13 SWOT ANALYSIS
14 COMPANY PROFILES
14.1 LIBBEY, INC.
14.1.1 COMPANY SNAPSHOT
14.1.2 COMPANY SHARE ANALYSIS
14.1.3 PRODUCT PORTFOLIO
14.1.4 RECENT UPDATE
14.2 FISKARS GROUP
14.2.1 COMPANY SNAPSHOT
14.2.2 REVENUE ANALYSIS
14.2.3 COMPANY SHARE ANALYSIS
14.2.4 PRODUCT PORTFOLIO
14.2.5 RECENT UPDATE
14.3 WMF (A SUBSIDIARY OF GROUPE SEB)
14.3.1 COMPANY SNAPSHOT
14.3.2 REVENUE ANALYSIS
14.3.3 PRODUCT PORTFOLIO
14.3.4 RECENT UPDATE
14.4 LIFETIME BRANDS, INC.
14.4.1 COMPANY SNAPSHOT
14.4.2 REVENUE ANALYSIS
14.4.3 COMPANY SHARE ANALYSIS
14.4.4 PRODUCT PORTFOLIO
14.4.5 RECENT UPDATE
14.5 VILLEROY & BOCH
14.5.1 COMPANY SNAPSHOT
14.5.2 REVENUE ANALYSIS
14.5.3 COMPANY SHARE ANALYSIS
14.5.4 PRODUCT PORTFOLIO
14.5.5 RECENT UPDATES
14.6 ADDRESSHOME
14.6.1 COMPANY SNAPSHOT
14.6.2 PRODUCT PORTFOLIO
14.6.3 RECENT UPDATE
14.7 BORMIOLI ROCCO S.P.A.
14.7.1 COMPANY SNAPSHOT
14.7.2 PRODUCT PORTFOLIO
14.7.3 RECENT UPDATE
14.8 CELLO WORLD
14.8.1 COMPANY SNAPSHOT
14.8.2 PRODUCT PORTFOLIO
14.8.3 RECENT UPDATE
14.9 CUMBRIA CRYSTAL
14.9.1 COMPANY SNAPSHOT
14.9.2 PRODUCT PORTFOLIO
14.9.3 RECENT UPDATE
14.1 DEGRENNE
14.10.1 COMPANY SNAPSHOT
14.10.2 PRODUCT PORTFOLIO
14.10.3 RECENT UPDATE
14.11 EAGLE GLASS DECO (P.) LTD.
14.11.1 COMPANY SNAPSHOT
14.11.2 PRODUCT PORTFOLIO
14.11.3 RECENT UPDATE
14.12 GARBO GLASSWARE
14.12.1 COMPANY SNAPSHOT
14.12.2 PRODUCT PORTFOLIO
14.12.3 RECENT UPDATES
14.13 HRASTNIK1860
14.13.1 COMPANY SNAPSHOT
14.13.2 PRODUCT PORTFOLIO
14.13.3 RECENT UPDATES
14.14 JIANGSU RONGTAI GLASS PRODUCTS CO., LTD.
14.14.1 COMPANY SNAPSHOT
14.14.2 PRODUCT PORTFOLIO
14.14.3 RECENT UPDATES
14.15 LENOX CORPORATION
14.15.1 COMPANY SNAPSHOT
14.15.2 PRODUCT PORTFOLIO
14.15.3 RECENT UPDATE
14.16 MYBOROSIL
14.16.1 COMPANY SNAPSHOT
14.16.2 REVENUE ANALYSIS
14.16.3 PRODUCT PORTFOLIO
14.16.4 RECENT UPDATE
14.17 NORITAKECHINA
14.17.1 COMPANY SNAPSHOT
14.17.2 REVENUE ANALYSIS
14.17.3 PRODUCT PORTFOLIO
14.17.4 RECENT UPDATE
14.18 OCEAN GLASS PUBLIC COMPANY LIMITED
14.18.1 COMPANY SNAPSHOT
14.18.2 REVENUE ANALYSIS
14.18.3 PRODUCT PORTFOLIO
14.18.4 RECENT UPDATE
14.19 ONEIDA
14.19.1 COMPANY SNAPSHOT
14.19.2 PRODUCT PORTFOLIO
14.19.3 RECENT UPDATE
14.2 SHANDONG HIKINGPAC CO., LTD.
14.20.1 COMPANY SNAPSHOT
14.20.2 PRODUCT PORTFOLIO
14.20.3 RECENT UPDATE
14.21 STÖLZLE LAUSITZ GMBH
14.21.1 COMPANY SNAPSHOT
14.21.2 PRODUCT PORTFOLIO
14.21.3 RECENT UPDATES
14.22 TREO.IN
14.22.1 COMPANY SNAPSHOT
14.22.2 PRODUCT PORTFOLIO
14.22.3 RECENT UPDATE
14.23 THE ZRIKE COMPANY, INC.
14.23.1 COMPANY SNAPSHOT
14.23.2 PRODUCT PORTFOLIO
14.23.3 RECENT UPDATE
14.24 WONDERCHEF HOME APPLIANCES PVT. LTD
14.24.1 COMPANY SNAPSHOT
14.24.2 PRODUCT PORTFOLIO
14.24.3 RECENT UPDATES
15 QUESTIONNAIRE
16 RELATED REPORTS
表格列表
TABLE 1 TYPE OF REUSABLE CUPS CONSUMERS WOULD PREFER FOR DRINKWARE IN U.S, 2015
TABLE 2 ASIA PACIFIC GLASSWARE MARKET, BY MATERIAL, 2016-2029 (USD THOUSAND)
TABLE 3 ASIA PACIFIC GLASSWARE MARKET, BY MATERIAL, 2016-2029 (THOUSAND UNITS)
TABLE 4 ASIA PACIFIC SODA LIME GLASS IN GLASSWARE MARKET, BY REGION, 2016-2029 (USD THOUSAND)
TABLE 5 ASIA PACIFIC SODA LIME GLASS IN GLASSWARE MARKET, BY REGION, 2016-2029 (THOUSAND UNITS)
TABLE 6 ASIA PACIFIC LEAD GLASS IN GLASSWARE MARKET, BY REGION, 2016-2029 (USD THOUSAND)
TABLE 7 ASIA PACIFIC LEAD GLASS IN GLASSWARE MARKET, BY REGION, 2016-2029 (THOUSAND UNITS)
TABLE 8 ASIA PACIFIC HEAT RESISTANT IN GLASSWARE MARKET, BY REGION, 2016-2029 (USD THOUSAND)
TABLE 9 ASIA PACIFIC HEAT RESISTANT IN GLASSWARE MARKET, BY REGION, 2016-2029 (THOUSAND UNITS)
TABLE 10 ASIA PACIFIC OTHERS IN GLASSWARE MARKET, BY REGION, 2016-2029 (USD THOUSAND)
TABLE 11 ASIA PACIFIC OTHERS IN GLASSWARE MARKET, BY REGION, 2016-2029 (THOUSAND UNITS)
TABLE 12 ASIA PACIFIC GLASSWARE MARKET, BY STYLE, 2016-2029 (USD THOUSAND)
TABLE 13 ASIA PACIFIC STEMWARE IN GLASSWARE MARKET, BY REGION, 2016-2029 (USD THOUSAND)
TABLE 14 ASIA PACIFIC STEMWARE IN GLASSWARE MARKET, BY TYPE, 2016-2029 (USD THOUSAND)
TABLE 15 ASIA PACIFIC RED WINE GLASS IN GLASSWARE MARKET, BY TYPE, 2016-2029 (USD THOUSAND)
TABLE 16 ASIA PACIFIC WHITE WINE GLASS IN GLASSWARE MARKET, BY TYPE, 2016-2029 (USD THOUSAND)
TABLE 17 ASIA PACIFIC STEMLESS GLASS IN GLASSWARE MARKET, BY REGION, 2016-2029 (USD THOUSAND)
TABLE 18 ASIA PACIFIC STEMLESS GLASS IN GLASSWARE MARKET, BY TYPE, 2016-2029 (USD THOUSAND)
TABLE 19 ASIA PACIFIC EVERYDAY USAGE IN GLASSWARE MARKET, BY REGION, 2016-2029 (USD THOUSAND)
TABLE 20 ASIA PACIFIC OTHERS IN GLASSWARE MARKET, BY REGION, 2016-2029 (USD THOUSAND)
TABLE 21 ASIA PACIFIC GLASSWARE MARKET, BY DISTRIBUTION CHANNEL, 2016-2029 (USD THOUSAND)
TABLE 22 ASIA PACIFIC B2B IN GLASSWARE MARKET, BY REGION, 2016-2029 (USD THOUSAND)
TABLE 23 ASIA PACIFIC SPECIALIZED STORES IN GLASSWARE MARKET, BY REGION, 2016-2029 (USD THOUSAND)
TABLE 24 ASIA PACIFIC SUPERMARKETS/HYPERMARKETS IN GLASSWARE MARKET, BY REGION, 2016-2029 (USD THOUSAND)
TABLE 25 ASIA PACIFIC E-COMMERCE IN GLASSWARE MARKET, BY REGION, 2016-2029 (USD THOUSAND)
TABLE 26 ASIA PACIFIC OTHERS IN GLASSWARE MARKET, BY REGION, 2016-2029 (USD THOUSAND)
TABLE 27 ASIA PACIFIC GLASSWARE MARKET, BY PRICE RANGE, 2016-2029 (USD THOUSAND)
TABLE 28 ASIA PACIFIC MEDIUM IN GLASSWARE MARKET, BY REGION, 2016-2029 (USD THOUSAND)
TABLE 29 ASIA PACIFIC PREMIUM IN GLASSWARE MARKET, BY REGION, 2016-2029 (USD THOUSAND)
TABLE 30 ASIA PACIFIC ECONOMY IN GLASSWARE MARKET, BY REGION, 2016-2029 (USD THOUSAND)
TABLE 31 ASIA PACIFIC GLASSWARE MARKET, BY END-USE, 2016-2029 (USD THOUSAND)
TABLE 32 ASIA PACIFIC HOTELS & RESTAURANTS IN GLASSWARE MARKET, BY REGION, 2016-2029 (USD THOUSAND)
TABLE 33 ASIA PACIFIC BARS & CAFÉ IN GLASSWARE MARKET, BY REGION, 2016-2029 (USD THOUSAND)
TABLE 34 ASIA PACIFIC HOUSEHOLD IN GLASSWARE MARKET, BY REGION, 2016-2029 (USD THOUSAND)
TABLE 35 ASIA PACIFIC CORPORATE CANTEENS IN GLASSWARE MARKET, BY REGION, 2016-2029 (USD THOUSAND)
TABLE 36 ASIA PACIFIC OTHERS IN GLASSWARE MARKET, BY REGION, 2016-2029 (USD THOUSAND)
TABLE 37 ASIA-PACIFIC GLASSWARE MARKET, BY COUNTRY, 2020-2029 (USD THOUSAND)
TABLE 38 ASIA-PACIFIC GLASSWARE MARKET, BY COUNTRY, 2020-2029 (THOUSAND UNITS)
TABLE 39 ASIA-PACIFIC GLASSWARE MARKET, BY MATERIAL, 2020-2029 (USD THOUSAND)
TABLE 40 ASIA-PACIFIC GLASSWARE MARKET, BY MATERIAL, 2020-2029 (THOUSAND UNITS)
TABLE 41 ASIA-PACIFIC GLASSWARE MARKET, BY STYLE, 2020-2029 (USD THOUSAND)
TABLE 42 ASIA-PACIFIC STEMWARE IN GLASSWARE MARKET, BY TYPE, 2020-2029 (USD THOUSAND)
TABLE 43 ASIA-PACIFIC RED WINE GLASS IN GLASSWARE MARKET, BY TYPE, 2020-2029 (USD THOUSAND)
TABLE 44 ASIA-PACIFIC WHITE WINE GLASS IN GLASSWARE MARKET, BY TYPE, 2020-2029 (USD THOUSAND)
TABLE 45 ASIA-PACIFIC STEMLESS GLASS IN GLASSWARE MARKET, BY TYPE, 2020-2029 (USD THOUSAND)
TABLE 46 ASIA-PACIFIC GLASSWARE MARKET, BY DISTRIBUTION CHANNEL, 2020-2029 (USD THOUSAND)
TABLE 47 ASIA-PACIFIC GLASSWARE MARKET, BY PRICE RANGE, 2020-2029 (USD THOUSAND)
TABLE 48 ASIA-PACIFIC GLASSWARE MARKET, BY END-USE, 2020-2029 (USD THOUSAND)
TABLE 49 CHINA GLASSWARE MARKET, BY MATERIAL, 2020-2029 (USD THOUSAND)
TABLE 50 CHINA GLASSWARE MARKET, BY MATERIAL, 2020-2029 (THOUSAND UNITS)
TABLE 51 CHINA GLASSWARE MARKET, BY STYLE, 2020-2029 (USD THOUSAND)
TABLE 52 CHINA STEMWARE IN GLASSWARE MARKET, BY TYPE, 2020-2029 (USD THOUSAND)
TABLE 53 CHINA RED WINE GLASS IN GLASSWARE MARKET, BY TYPE, 2020-2029 (USD THOUSAND)
TABLE 54 CHINA WHITE WINE GLASS IN GLASSWARE MARKET, BY TYPE, 2020-2029 (USD THOUSAND)
TABLE 55 CHINA STEMLESS GLASS IN GLASSWARE MARKET, BY TYPE, 2020-2029 (USD THOUSAND)
TABLE 56 CHINA GLASSWARE MARKET, BY DISTRIBUTION CHANNEL, 2020-2029 (USD THOUSAND)
TABLE 57 CHINA GLASSWARE MARKET, BY PRICE RANGE, 2020-2029 (USD THOUSAND)
TABLE 58 CHINA GLASSWARE MARKET, BY END-USE, 2020-2029 (USD THOUSAND)
TABLE 59 INDIA GLASSWARE MARKET, BY MATERIAL, 2020-2029 (USD THOUSAND)
TABLE 60 INDIA GLASSWARE MARKET, BY MATERIAL, 2020-2029 (THOUSAND UNITS)
TABLE 61 INDIA GLASSWARE MARKET, BY STYLE, 2020-2029 (USD THOUSAND)
TABLE 62 INDIA STEMWARE IN GLASSWARE MARKET, BY TYPE, 2020-2029 (USD THOUSAND)
TABLE 63 INDIA RED WINE GLASS IN GLASSWARE MARKET, BY TYPE, 2020-2029 (USD THOUSAND)
TABLE 64 INDIA WHITE WINE GLASS IN GLASSWARE MARKET, BY TYPE, 2020-2029 (USD THOUSAND)
TABLE 65 INDIA STEMLESS GLASS IN GLASSWARE MARKET, BY TYPE, 2020-2029 (USD THOUSAND)
TABLE 66 INDIA GLASSWARE MARKET, BY DISTRIBUTION CHANNEL, 2020-2029 (USD THOUSAND)
TABLE 67 INDIA GLASSWARE MARKET, BY PRICE RANGE, 2020-2029 (USD THOUSAND)
TABLE 68 INDIA GLASSWARE MARKET, BY END-USE, 2020-2029 (USD THOUSAND)
TABLE 69 JAPAN GLASSWARE MARKET, BY MATERIAL, 2020-2029 (USD THOUSAND)
TABLE 70 JAPAN GLASSWARE MARKET, BY MATERIAL, 2020-2029 (THOUSAND UNITS)
TABLE 71 JAPAN GLASSWARE MARKET, BY STYLE, 2020-2029 (USD THOUSAND)
TABLE 72 JAPAN STEMWARE IN GLASSWARE MARKET, BY TYPE, 2020-2029 (USD THOUSAND)
TABLE 73 JAPAN RED WINE GLASS IN GLASSWARE MARKET, BY TYPE, 2020-2029 (USD THOUSAND)
TABLE 74 JAPAN WHITE WINE GLASS IN GLASSWARE MARKET, BY TYPE, 2020-2029 (USD THOUSAND)
TABLE 75 JAPAN STEMLESS GLASS IN GLASSWARE MARKET, BY TYPE, 2020-2029 (USD THOUSAND)
TABLE 76 JAPAN GLASSWARE MARKET, BY DISTRIBUTION CHANNEL, 2020-2029 (USD THOUSAND)
TABLE 77 JAPAN GLASSWARE MARKET, BY PRICE RANGE, 2020-2029 (USD THOUSAND)
TABLE 78 JAPAN GLASSWARE MARKET, BY END-USE, 2020-2029 (USD THOUSAND)
TABLE 79 SOUTH KOREA GLASSWARE MARKET, BY MATERIAL, 2020-2029 (USD THOUSAND)
TABLE 80 SOUTH KOREA GLASSWARE MARKET, BY MATERIAL, 2020-2029 (THOUSAND UNITS)
TABLE 81 SOUTH KOREA GLASSWARE MARKET, BY STYLE, 2020-2029 (USD THOUSAND)
TABLE 82 SOUTH KOREA STEMWARE IN GLASSWARE MARKET, BY TYPE, 2020-2029 (USD THOUSAND)
TABLE 83 SOUTH KOREA RED WINE GLASS IN GLASSWARE MARKET, BY TYPE, 2020-2029 (USD THOUSAND)
TABLE 84 SOUTH KOREA WHITE WINE GLASS IN GLASSWARE MARKET, BY TYPE, 2020-2029 (USD THOUSAND)
TABLE 85 SOUTH KOREA STEMLESS GLASS IN GLASSWARE MARKET, BY TYPE, 2020-2029 (USD THOUSAND)
TABLE 86 SOUTH KOREA GLASSWARE MARKET, BY DISTRIBUTION CHANNEL, 2020-2029 (USD THOUSAND)
TABLE 87 SOUTH KOREA GLASSWARE MARKET, BY PRICE RANGE, 2020-2029 (USD THOUSAND)
TABLE 88 SOUTH KOREA GLASSWARE MARKET, BY END-USE, 2020-2029 (USD THOUSAND)
TABLE 89 SINGAPORE GLASSWARE MARKET, BY MATERIAL, 2020-2029 (USD THOUSAND)
TABLE 90 SINGAPORE GLASSWARE MARKET, BY MATERIAL, 2020-2029 (THOUSAND UNITS)
TABLE 91 SINGAPORE GLASSWARE MARKET, BY STYLE, 2020-2029 (USD THOUSAND)
TABLE 92 SINGAPORE STEMWARE IN GLASSWARE MARKET, BY TYPE, 2020-2029 (USD THOUSAND)
TABLE 93 SINGAPORE RED WINE GLASS IN GLASSWARE MARKET, BY TYPE, 2020-2029 (USD THOUSAND)
TABLE 94 SINGAPORE WHITE WINE GLASS IN GLASSWARE MARKET, BY TYPE, 2020-2029 (USD THOUSAND)
TABLE 95 SINGAPORE STEMLESS GLASS IN GLASSWARE MARKET, BY TYPE, 2020-2029 (USD THOUSAND)
TABLE 96 SINGAPORE GLASSWARE MARKET, BY DISTRIBUTION CHANNEL, 2020-2029 (USD THOUSAND)
TABLE 97 SINGAPORE GLASSWARE MARKET, BY PRICE RANGE, 2020-2029 (USD THOUSAND)
TABLE 98 SINGAPORE GLASSWARE MARKET, BY END-USE, 2020-2029 (USD THOUSAND)
TABLE 99 MALAYSIA GLASSWARE MARKET, BY MATERIAL, 2020-2029 (USD THOUSAND)
TABLE 100 MALAYSIA GLASSWARE MARKET, BY MATERIAL, 2020-2029 (THOUSAND UNITS)
TABLE 101 MALAYSIA GLASSWARE MARKET, BY STYLE, 2020-2029 (USD THOUSAND)
TABLE 102 MALAYSIA STEMWARE IN GLASSWARE MARKET, BY TYPE, 2020-2029 (USD THOUSAND)
TABLE 103 MALAYSIA RED WINE GLASS IN GLASSWARE MARKET, BY TYPE, 2020-2029 (USD THOUSAND)
TABLE 104 MALAYSIA WHITE WINE GLASS IN GLASSWARE MARKET, BY TYPE, 2020-2029 (USD THOUSAND)
TABLE 105 MALAYSIA STEMLESS GLASS IN GLASSWARE MARKET, BY TYPE, 2020-2029 (USD THOUSAND)
TABLE 106 MALAYSIA GLASSWARE MARKET, BY DISTRIBUTION CHANNEL, 2020-2029 (USD THOUSAND)
TABLE 107 MALAYSIA GLASSWARE MARKET, BY PRICE RANGE, 2020-2029 (USD THOUSAND)
TABLE 108 MALAYSIA GLASSWARE MARKET, BY END-USE, 2020-2029 (USD THOUSAND)
TABLE 109 THAILAND GLASSWARE MARKET, BY MATERIAL, 2020-2029 (USD THOUSAND)
TABLE 110 THAILAND GLASSWARE MARKET, BY MATERIAL, 2020-2029 (THOUSAND UNITS)
TABLE 111 THAILAND GLASSWARE MARKET, BY STYLE, 2020-2029 (USD THOUSAND)
TABLE 112 THAILAND STEMWARE IN GLASSWARE MARKET, BY TYPE, 2020-2029 (USD THOUSAND)
TABLE 113 THAILAND RED WINE GLASS IN GLASSWARE MARKET, BY TYPE, 2020-2029 (USD THOUSAND)
TABLE 114 THAILAND WHITE WINE GLASS IN GLASSWARE MARKET, BY TYPE, 2020-2029 (USD THOUSAND)
TABLE 115 THAILAND STEMLESS GLASS IN GLASSWARE MARKET, BY TYPE, 2020-2029 (USD THOUSAND)
TABLE 116 THAILAND GLASSWARE MARKET, BY DISTRIBUTION CHANNEL, 2020-2029 (USD THOUSAND)
TABLE 117 THAILAND GLASSWARE MARKET, BY PRICE RANGE, 2020-2029 (USD THOUSAND)
TABLE 118 THAILAND GLASSWARE MARKET, BY END-USE, 2020-2029 (USD THOUSAND)
TABLE 119 AUSTRALIA AND NEW ZEALAND GLASSWARE MARKET, BY MATERIAL, 2020-2029 (USD THOUSAND)
TABLE 120 AUSTRALIA AND NEW ZEALAND GLASSWARE MARKET, BY MATERIAL, 2020-2029 (THOUSAND UNITS)
TABLE 121 AUSTRALIA AND NEW ZEALAND GLASSWARE MARKET, BY STYLE, 2020-2029 (USD THOUSAND)
TABLE 122 AUSTRALIA AND NEW ZEALAND STEMWARE IN GLASSWARE MARKET, BY TYPE, 2020-2029 (USD THOUSAND)
TABLE 123 AUSTRALIA AND NEW ZEALAND RED WINE GLASS IN GLASSWARE MARKET, BY TYPE, 2020-2029 (USD THOUSAND)
TABLE 124 AUSTRALIA AND NEW ZEALAND WHITE WINE GLASS IN GLASSWARE MARKET, BY TYPE, 2020-2029 (USD THOUSAND)
TABLE 125 AUSTRALIA AND NEW ZEALAND STEMLESS GLASS IN GLASSWARE MARKET, BY TYPE, 2020-2029 (USD THOUSAND)
TABLE 126 AUSTRALIA AND NEW ZEALAND GLASSWARE MARKET, BY DISTRIBUTION CHANNEL, 2020-2029 (USD THOUSAND)
TABLE 127 AUSTRALIA AND NEW ZEALAND GLASSWARE MARKET, BY PRICE RANGE, 2020-2029 (USD THOUSAND)
TABLE 128 AUSTRALIA AND NEW ZEALAND GLASSWARE MARKET, BY END-USE, 2020-2029 (USD THOUSAND)
TABLE 129 INDONESIA GLASSWARE MARKET, BY MATERIAL, 2020-2029 (USD THOUSAND)
TABLE 130 INDONESIA GLASSWARE MARKET, BY MATERIAL, 2020-2029 (THOUSAND UNITS)
TABLE 131 INDONESIA GLASSWARE MARKET, BY STYLE, 2020-2029 (USD THOUSAND)
TABLE 132 INDONESIA STEMWARE IN GLASSWARE MARKET, BY TYPE, 2020-2029 (USD THOUSAND)
TABLE 133 INDONESIA RED WINE GLASS IN GLASSWARE MARKET, BY TYPE, 2020-2029 (USD THOUSAND)
TABLE 134 INDONESIA WHITE WINE GLASS IN GLASSWARE MARKET, BY TYPE, 2020-2029 (USD THOUSAND)
TABLE 135 INDONESIA STEMLESS GLASS IN GLASSWARE MARKET, BY TYPE, 2020-2029 (USD THOUSAND)
TABLE 136 INDONESIA GLASSWARE MARKET, BY DISTRIBUTION CHANNEL, 2020-2029 (USD THOUSAND)
TABLE 137 INDONESIA GLASSWARE MARKET, BY PRICE RANGE, 2020-2029 (USD THOUSAND)
TABLE 138 INDONESIA GLASSWARE MARKET, BY END-USE, 2020-2029 (USD THOUSAND)
TABLE 139 PHILIPPINES GLASSWARE MARKET, BY MATERIAL, 2020-2029 (USD THOUSAND)
TABLE 140 PHILIPPINES GLASSWARE MARKET, BY MATERIAL, 2020-2029 (THOUSAND UNITS)
TABLE 141 PHILIPPINES GLASSWARE MARKET, BY STYLE, 2020-2029 (USD THOUSAND)
TABLE 142 PHILIPPINES STEMWARE IN GLASSWARE MARKET, BY TYPE, 2020-2029 (USD THOUSAND)
TABLE 143 PHILIPPINES RED WINE GLASS IN GLASSWARE MARKET, BY TYPE, 2020-2029 (USD THOUSAND)
TABLE 144 PHILIPPINES WHITE WINE GLASS IN GLASSWARE MARKET, BY TYPE, 2020-2029 (USD THOUSAND)
TABLE 145 PHILIPPINES STEMLESS GLASS IN GLASSWARE MARKET, BY TYPE, 2020-2029 (USD THOUSAND)
TABLE 146 PHILIPPINES GLASSWARE MARKET, BY DISTRIBUTION CHANNEL, 2020-2029 (USD THOUSAND)
TABLE 147 PHILIPPINES GLASSWARE MARKET, BY PRICE RANGE, 2020-2029 (USD THOUSAND)
TABLE 148 PHILIPPINES GLASSWARE MARKET, BY END-USE, 2020-2029 (USD THOUSAND)
TABLE 149 HONG KONG GLASSWARE MARKET, BY MATERIAL, 2020-2029 (USD THOUSAND)
TABLE 150 HONG KONG GLASSWARE MARKET, BY MATERIAL, 2020-2029 (THOUSAND UNITS)
TABLE 151 HONG KONG GLASSWARE MARKET, BY STYLE, 2020-2029 (USD THOUSAND)
TABLE 152 HONG KONG STEMWARE IN GLASSWARE MARKET, BY TYPE, 2020-2029 (USD THOUSAND)
TABLE 153 HONG KONG RED WINE GLASS IN GLASSWARE MARKET, BY TYPE, 2020-2029 (USD THOUSAND)
TABLE 154 HONG KONG WHITE WINE GLASS IN GLASSWARE MARKET, BY TYPE, 2020-2029 (USD THOUSAND)
TABLE 155 HONG KONG STEMLESS GLASS IN GLASSWARE MARKET, BY TYPE, 2020-2029 (USD THOUSAND)
TABLE 156 HONG KONG GLASSWARE MARKET, BY DISTRIBUTION CHANNEL, 2020-2029 (USD THOUSAND)
TABLE 157 HONG KONG GLASSWARE MARKET, BY PRICE RANGE, 2020-2029 (USD THOUSAND)
TABLE 158 HONG KONG GLASSWARE MARKET, BY END-USE, 2020-2029 (USD THOUSAND)
TABLE 159 TAIWAN GLASSWARE MARKET, BY MATERIAL, 2020-2029 (USD THOUSAND)
TABLE 160 TAIWAN GLASSWARE MARKET, BY MATERIAL, 2020-2029 (THOUSAND UNITS)
TABLE 161 TAIWAN GLASSWARE MARKET, BY STYLE, 2020-2029 (USD THOUSAND)
TABLE 162 TAIWAN STEMWARE IN GLASSWARE MARKET, BY TYPE, 2020-2029 (USD THOUSAND)
TABLE 163 TAIWAN RED WINE GLASS IN GLASSWARE MARKET, BY TYPE, 2020-2029 (USD THOUSAND)
TABLE 164 TAIWAN WHITE WINE GLASS IN GLASSWARE MARKET, BY TYPE, 2020-2029 (USD THOUSAND)
TABLE 165 TAIWAN STEMLESS GLASS IN GLASSWARE MARKET, BY TYPE, 2020-2029 (USD THOUSAND)
TABLE 166 TAIWAN GLASSWARE MARKET, BY DISTRIBUTION CHANNEL, 2020-2029 (USD THOUSAND)
TABLE 167 TAIWAN GLASSWARE MARKET, BY PRICE RANGE, 2020-2029 (USD THOUSAND)
TABLE 168 TAIWAN GLASSWARE MARKET, BY END-USE, 2020-2029 (USD THOUSAND)
TABLE 169 MYANMAR GLASSWARE MARKET, BY MATERIAL, 2020-2029 (USD THOUSAND)
TABLE 170 MYANMAR GLASSWARE MARKET, BY MATERIAL, 2020-2029 (THOUSAND UNITS)
TABLE 171 MYANMAR GLASSWARE MARKET, BY STYLE, 2020-2029 (USD THOUSAND)
TABLE 172 MYANMAR STEMWARE IN GLASSWARE MARKET, BY TYPE, 2020-2029 (USD THOUSAND)
TABLE 173 MYANMAR RED WINE GLASS IN GLASSWARE MARKET, BY TYPE, 2020-2029 (USD THOUSAND)
TABLE 174 MYANMAR WHITE WINE GLASS IN GLASSWARE MARKET, BY TYPE, 2020-2029 (USD THOUSAND)
TABLE 175 MYANMAR STEMLESS GLASS IN GLASSWARE MARKET, BY TYPE, 2020-2029 (USD THOUSAND)
TABLE 176 MYANMAR GLASSWARE MARKET, BY DISTRIBUTION CHANNEL, 2020-2029 (USD THOUSAND)
TABLE 177 MYANMAR GLASSWARE MARKET, BY PRICE RANGE, 2020-2029 (USD THOUSAND)
TABLE 178 MYANMAR GLASSWARE MARKET, BY END-USE, 2020-2029 (USD THOUSAND)
TABLE 179 LAOS GLASSWARE MARKET, BY MATERIAL, 2020-2029 (USD THOUSAND)
TABLE 180 LAOS GLASSWARE MARKET, BY MATERIAL, 2020-2029 (THOUSAND UNITS)
TABLE 181 LAOS GLASSWARE MARKET, BY STYLE, 2020-2029 (USD THOUSAND)
TABLE 182 LAOS STEMWARE IN GLASSWARE MARKET, BY TYPE, 2020-2029 (USD THOUSAND)
TABLE 183 LAOS RED WINE GLASS IN GLASSWARE MARKET, BY TYPE, 2020-2029 (USD THOUSAND)
TABLE 184 LAOS WHITE WINE GLASS IN GLASSWARE MARKET, BY TYPE, 2020-2029 (USD THOUSAND)
TABLE 185 LAOS STEMLESS GLASS IN GLASSWARE MARKET, BY TYPE, 2020-2029 (USD THOUSAND)
TABLE 186 LAOS GLASSWARE MARKET, BY DISTRIBUTION CHANNEL, 2020-2029 (USD THOUSAND)
TABLE 187 LAOS GLASSWARE MARKET, BY PRICE RANGE, 2020-2029 (USD THOUSAND)
TABLE 188 LAOS GLASSWARE MARKET, BY END-USE, 2020-2029 (USD THOUSAND)
TABLE 189 CAMBODIA GLASSWARE MARKET, BY MATERIAL, 2020-2029 (USD THOUSAND)
TABLE 190 CAMBODIA GLASSWARE MARKET, BY MATERIAL, 2020-2029 (THOUSAND UNITS)
TABLE 191 CAMBODIA GLASSWARE MARKET, BY STYLE, 2020-2029 (USD THOUSAND)
TABLE 192 CAMBODIA STEMWARE IN GLASSWARE MARKET, BY TYPE, 2020-2029 (USD THOUSAND)
TABLE 193 CAMBODIA RED WINE GLASS IN GLASSWARE MARKET, BY TYPE, 2020-2029 (USD THOUSAND)
TABLE 194 CAMBODIA WHITE WINE GLASS IN GLASSWARE MARKET, BY TYPE, 2020-2029 (USD THOUSAND)
TABLE 195 CAMBODIA STEMLESS GLASS IN GLASSWARE MARKET, BY TYPE, 2020-2029 (USD THOUSAND)
TABLE 196 CAMBODIA GLASSWARE MARKET, BY DISTRIBUTION CHANNEL, 2020-2029 (USD THOUSAND)
TABLE 197 CAMBODIA GLASSWARE MARKET, BY PRICE RANGE, 2020-2029 (USD THOUSAND)
TABLE 198 CAMBODIA GLASSWARE MARKET, BY END-USE, 2020-2029 (USD THOUSAND)
TABLE 199 REST OF ASIA-PACIFIC GLASSWARE MARKET, BY MATERIAL, 2020-2029 (USD THOUSAND)
TABLE 200 REST OF ASIA-PACIFIC GLASSWARE MARKET, BY MATERIAL, 2020-2029 (THOUSAND UNITS)
图片列表
FIGURE 1 ASIA PACIFIC GLASSWARE MARKET: SEGMENTATION
FIGURE 2 ASIA PACIFIC GLASSWARE MARKET: DATA TRIANGULATION
FIGURE 3 ASIA PACIFIC GLASSWARE MARKET: DROC ANALYSIS
FIGURE 4 ASIA PACIFIC GLASSWARE MARKET: ASIA PACIFIC VS REGIONAL MARKET ANALYSIS
FIGURE 5 ASIA PACIFIC GLASSWARE MARKET: COMPANY RESEARCH ANALYSIS
FIGURE 6 ASIA PACIFIC GLASSWARE MARKET: MATERIAL TIME LINE CURVE
FIGURE 7 ASIA PACIFIC GLASSWARE MARKET: MULTIVARIATE MODELLING
FIGURE 8 ASIA PACIFIC GLASSWARE MARKET: INTERVIEW DEMOGRAPHICS
FIGURE 9 ASIA PACIFIC GLASSWARE MARKET: DBMR MARKET POSITION GRID
FIGURE 10 ASIA PACIFIC GLASSWARE MARKET: MARKET APPLICATION COVERAGE GRID
FIGURE 11 ASIA PACIFIC GLASSWARE MARKET: THE MARKET CHALLENGE MATRIX
FIGURE 12 ASIA PACIFIC GLASSWARE MARKET: VENDOR SHARE ANALYSIS
FIGURE 13 ASIA PACIFIC GLASSWARE MARKET: SEGMENTATION
FIGURE 14 ASIA-PACIFIC IS EXPECTED TO DOMINATE THE ASIA PACIFIC GLASSWARE MARKET AND IS EXPECTED TO GROW WITH THE HIGHEST CAGR IN THE FORECAST PERIOD OF 2022 TO 2029
FIGURE 15 RISING POPULARITY OF FINE DINING ACROSS THE GLOBE IS DRIVING THE ASIA PACIFIC GLASSWARE MARKET IN THE FORECAST PERIOD OF 2022 TO 2029
FIGURE 16 SODA LIME GLASS SEGMENT IS EXPECTED TO ACCOUNT FOR THE LARGEST SHARE OF THE ASIA PACIFIC GLASSWARE MARKET IN 2022 & 2029
FIGURE 17 FACTOR INFLUENCING PURCHASE OF PRODUCT
FIGURE 18 PRICE RANGE COMPARISON OF KEY PLAYERS BY STEMLESS GLASSES
FIGURE 19 PRICE RANGE COMPARISON OF KEY PLAYERS BY STEMWARE GLASSES
FIGURE 20 PRICE RANGE COMPARISON OF KEY PLAYERS BY EVERYDAY USAGE GLASSES
FIGURE 21 DRIVERS, RESTRAINTS, OPPORTUNITIES, AND CHALLENGES OF ASIA PACIFIC GLASSWARE MARKET
FIGURE 22 ASIA PACIFIC LUXURY HOTEL COUNT, IN LUXURY CLASS, 2002-2018 (APPROXIMATE)
FIGURE 23 ASIA PACIFIC GLASSWARE MARKET, BY MATERIAL, 2021
FIGURE 24 ASIA PACIFIC GLASSWARE MARKET, BY STYLE, 2021
FIGURE 25 ASIA PACIFIC GLASSWARE MARKET, BY DISTRIBUTION CHANNEL, 2021
FIGURE 26 ASIA PACIFIC GLASSWARE MARKET, BY PRICE RANGE, 2021
FIGURE 27 ASIA PACIFIC GLASSWARE MARKET, BY END-USE, 2021
FIGURE 28 ASIA-PACIFIC GLASSWARE MARKET: SNAPSHOT (2021)
FIGURE 29 ASIA-PACIFIC GLASSWARE MARKET: BY COUNTRY (2021)
FIGURE 30 ASIA-PACIFIC GLASSWARE MARKET: BY COUNTRY (2022 & 2029)
FIGURE 31 ASIA-PACIFIC GLASSWARE MARKET: BY COUNTRY (2021 & 2029)
FIGURE 32 ASIA-PACIFIC GLASSWARE MARKET: BY MATERIAL (2022-2029)
FIGURE 33 ASIA PACIFIC GLASSWARE MARKET: COMPANY SHARE 2021 (%)
研究方法
数据收集和基准年分析是使用具有大样本量的数据收集模块完成的。该阶段包括通过各种来源和策略获取市场信息或相关数据。它包括提前检查和规划从过去获得的所有数据。它同样包括检查不同信息源中出现的信息不一致。使用市场统计和连贯模型分析和估计市场数据。此外,市场份额分析和关键趋势分析是市场报告中的主要成功因素。要了解更多信息,请请求分析师致电或下拉您的询问。
DBMR 研究团队使用的关键研究方法是数据三角测量,其中包括数据挖掘、数据变量对市场影响的分析和主要(行业专家)验证。数据模型包括供应商定位网格、市场时间线分析、市场概览和指南、公司定位网格、专利分析、定价分析、公司市场份额分析、测量标准、全球与区域和供应商份额分析。要了解有关研究方法的更多信息,请向我们的行业专家咨询。
可定制
Data Bridge Market Research 是高级形成性研究领域的领导者。我们为向现有和新客户提供符合其目标的数据和分析而感到自豪。报告可定制,包括目标品牌的价格趋势分析、了解其他国家的市场(索取国家列表)、临床试验结果数据、文献综述、翻新市场和产品基础分析。目标竞争对手的市场分析可以从基于技术的分析到市场组合策略进行分析。我们可以按照您所需的格式和数据样式添加您需要的任意数量的竞争对手数据。我们的分析师团队还可以为您提供原始 Excel 文件数据透视表(事实手册)中的数据,或者可以帮助您根据报告中的数据集创建演示文稿。

