Global Glassware Market
市场规模(十亿美元)
CAGR :
% 
 USD
2.88 Billion
USD
4.36 Billion
2024
2032
USD
2.88 Billion
USD
4.36 Billion
2024
2032
| 2025 –2032 | |
| USD 2.88 Billion | |
| USD 4.36 Billion | |
| % | |
|
全球玻璃器皿市場細分,按材質(鈉鈣玻璃、鉛玻璃、耐熱玻璃等)、風格(無柄玻璃、高腳杯、日常使用等)、分銷渠道(B2B、專賣店、超市/大賣場、電子商務等)、價格範圍(中端、高端和經濟型)、最終用途(酒店和餐廳、酒吧和咖啡館、家庭、餐廳趨勢等)
玻璃器皿市場規模
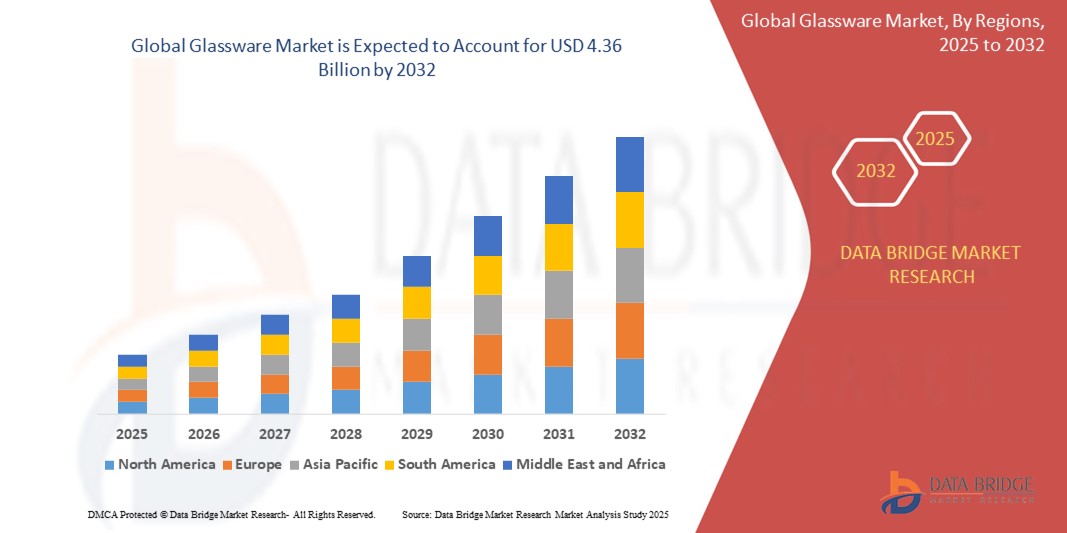
- 2024 年全球玻璃器皿市場規模為28.8 億美元 ,預計 到 2032 年將達到 43.6 億美元,預測期內 複合年增長率為 5.30%。
- 市場成長主要得益於對高端餐飲和廚房產品的需求不斷增長、消費者對環保和可重複使用的塑膠替代品的偏好日益增長,以及全球餐飲和酒店業的不斷擴張
- 此外,線上零售通路和家居裝飾影響者的興起,顯著提高了城市和半城市地區設計師和客製化玻璃器皿的知名度和可及性
玻璃器皿市場分析
- 受家庭餐飲趨勢和美學吸引力的推動,時尚耐用的玻璃器皿在住宅環境中的普及率不斷上升,這是市場成長的關鍵因素
- 餐飲和旅館業繼續成為主要的收入來源,餐廳、酒吧和旅館都投資高品質玻璃器皿來提升顧客體驗
- 北美在全球玻璃器皿市場佔據主導地位,2024 年其收入份額最大,為 36.8%,這得益於消費者對高端餐飲美學的偏好日益增長、對可重複使用家居用品的需求不斷增長,以及人們越來越遠離塑料
- 受城鎮化進程加快、可支配收入增加以及中國、印度和東南亞等新興經濟體對現代家居用品和高檔餐飲產品需求激增的推動,亞太地區預計將成為全球玻璃器皿市場增長率最高的地區
- 2024年,鈉鈣玻璃佔據了最大的市場收入份額,這得益於其價格實惠、易於加工且外觀清晰,廣泛應用於日常玻璃器皿中。鈉鈣玻璃是住宅和商業用途中最常用的玻璃杯、盤子和通用玻璃製品的材料。
報告範圍和玻璃器皿市場細分
|
屬性 |
玻璃器皿關鍵市場洞察 |
|
涵蓋的領域 |
|
|
覆蓋國家 |
北美洲
歐洲
亞太
中東和非洲
南美洲
|
|
主要市場參與者 |
|
|
市場機會 |
|
|
加值資料資訊集 |
除了對市場價值、成長率、細分、地理覆蓋範圍和主要參與者等市場情景的洞察之外,Data Bridge Market Research 策劃的市場報告還包括進出口分析、生產能力概覽、生產消費分析、價格趨勢分析、氣候變遷情景、供應鏈分析、價值鏈分析、原材料/消耗品概覽、供應商選擇標準、PESTLE 分析、波特分析和監管框架。 |
玻璃器皿市場趨勢
“手工玻璃器皿日益普及”
- 消費者越來越青睞那些體現個人品味、獨特性和文化傳承的手工玻璃器皿,而不再青睞大量生產的商品
- 這些產品通常展示當地工藝、傳統玻璃吹製技術以及獨特的地理風格,吸引國內外買家
- 手工玻璃器皿在高端餐飲體驗中越來越受歡迎,美學和故事敘事被視為整個顧客旅程的一部分
- 線上平台、家居裝飾影響者和生活方式部落客在提升手工玻璃製品的知名度和需求方面發揮關鍵作用
- 訂製和限量版玻璃製品經常用於特殊場合、奢華禮品和室內裝飾
- 例如,Glassybaby(美國)銷售具有社會意義的手工吹製蠟燭,LSA International(英國)則以手工製作的酒吧用具而聞名,這些品牌透過線上和精品管道看到了消費者的持續興趣
玻璃器皿市場動態
司機
“對環保且可重複使用的塑膠替代品的需求不斷增長”
- 日益增強的環保意識促使消費者和機構選擇玻璃而非塑料,因為玻璃具有可回收性、耐用性和惰性
- 瓶子、儲物罐和午餐盒等玻璃器皿產品正成為環保家庭的必需品,尤其是在千禧世代和 Z 世代人群中
- 各地區採取的監管措施(包括禁止使用一次性塑膠)正在推動製造商和零售商擴大其永續玻璃器皿產品供應
- 餐飲服務業的企業正在轉向可重複使用的玻璃飲具和餐具,以符合綠色標準並提升品牌形象
- 強化玻璃和硼矽酸鹽玻璃的不斷創新提高了產品的安全性和使用壽命,使玻璃器皿更適合日常使用
- 遵循歐盟的一次性塑膠指令,德國和法國的大型連鎖超市將乳製品和調味品的塑膠包裝替換為玻璃容器,從而推動了整個歐洲的玻璃器皿需求
克制/挑戰
“運輸和使用過程中易碎且有破損風險”
- 玻璃器皿本質上很脆弱,在運輸、搬運和清潔過程中容易破裂或破碎,尤其是在人流量大的環境中
- 經銷商和零售商需要投資重型減震包裝材料,這會增加物流成本並降低利潤率
- 玻璃破碎可能造成傷害或承擔責任的風險,使得某些商業機構不願採用玻璃,而選擇更耐衝擊的材料
- 家中有兒童或老人的消費者通常會因為安全問題而避免使用玻璃器皿,這限制了其在家庭細分市場的吸引力
- 玻璃產品缺乏標準化的保險或更換政策,阻礙了批量訂單,特別是在對成本敏感的市場
- 例如,東南亞的獨立餐廳和咖啡館報告稱,進口玻璃器皿經常破損,因此,儘管美觀有所妥協,他們還是在日常運營中選擇了三聚氰胺或聚碳酸酯替代品
玻璃器皿市場範圍
市場根據材料、風格、分銷管道、價格範圍和最終用途進行細分。
• 按材質
On the basis of material, the glassware market is segmented into soda lime glass, lead glass, heat resistant, and others. The soda lime glass segment accounted for the largest market revenue share in 2024, owing to its widespread use in everyday glassware due to its affordability, workability, and clear appearance. It is the most commonly used material for tumblers, plates, and general-purpose glass items across residential and commercial applications.
The heat resistant segment is expected to witness a fastest growth rate from 2025 to 2032, driven by growing consumer demand for microwave-safe and durable glassware. Its ability to withstand high thermal stress makes it suitable for baking, cooking, and food storage, particularly in urban households and commercial kitchens that prioritize multifunctional cookware.
• By Style
On the basis of style, the glassware market is segmented into stemless glass, stemware, everyday usage, and others. The everyday usage segment dominated the market in 2024, as these products serve a wide range of functions in homes, offices, and hospitality spaces. Consumers prefer these practical items for their versatility, ease of cleaning, and stackable design.
The stemware segment is expected to witness a fastest growth rate from 2025 to 2032, supported by rising consumption of wine and cocktails, and an increasing emphasis on dining aesthetics. Upscale restaurants, bars, and households are investing in premium stemware to enhance table presentation and user experience.
• By Distribution Channel
On the basis of distribution channel, the glassware market is segmented into B2B, specialized stores, supermarkets/hypermarkets, e-commerce, and others. The B2B segment accounted for the largest market share in 2024, primarily driven by bulk procurement from hotels, restaurants, and corporate caterers.
The e-commerce segment is expected to witness a fastest growth rate from 2025 to 2032, attributed to the convenience of online purchasing, access to a wider variety of designs, and growth in digital retailing platforms. Influencer marketing and online gifting trends are also accelerating online glassware sales.
• By Price Range
On the basis of price range, the glassware market is segmented into medium, premium, and economy. The medium segment held the largest share in 2024, as it offers a balanced combination of quality and affordability, appealing to the mass middle-income consumer base.
The premium segment is expected to witness a fastest growth rate from 2025 to 2032, owing to rising demand for branded, designer glassware collections for gifting, formal dining, and special occasions. The luxury hospitality sector’s inclination toward elegant tabletop products is also fueling this trend.
• By End-Use
On the basis of end-use, the market is segmented into hotels & restaurants, bars & café, household, corporate canteens, and others. The household segment led the market with the largest revenue share in 2024, driven by growing home dining, online food delivery, and gifting preferences.
The bars & café segment is expected to witness a fastest growth rate from 2025 to 2032, supported by the global expansion of casual dining chains and increasing social outings. These establishments prioritize glassware not just for functionality but also for creating a consistent brand and ambiance.
Glassware Market Regional Analysis
- North America dominated the global glassware market with the largest revenue share of 36.8% in 2024, driven by rising consumer preference for premium dining aesthetics, growing demand for reusable household items, and the increasing shift away from plastic
- Consumers in the region prioritize both functionality and design, favoring tempered, lead-free, and heat-resistant glassware for household and commercial use
- The market also benefits from strong demand across restaurants, hotels, and cafes, coupled with high disposable incomes and the influence of lifestyle trends that emphasize sustainable, elegant tableware
U.S. Glassware Market Insight
The U.S. glassware market accounted for the largest revenue share of 79.4% in 2024 within North America, supported by the rise in at-home dining, culinary experimentation, and premium kitchenware purchases. Demand for personalized and artisanal glassware continues to grow, especially through e-commerce platforms and specialty retailers. The increasing adoption of eco-conscious habits, such as using glass containers and reusable drinkware, also contributes to market expansion. The hospitality industry’s focus on enhancing presentation standards further drives the need for quality glassware.
Europe Glassware Market Insight
The Europe glassware market is expected to witness a fastest growth rate from 2025 to 2032, bolstered by a well-established culture of wine and spirits consumption, which fuels demand for high-quality stemware. Sustainability regulations and consumer awareness are encouraging the use of recyclable materials, with many European households and restaurants opting for durable, elegant glass options. Growth is particularly notable in countries with deep-rooted culinary traditions and evolving lifestyle trends favoring reusable and aesthetically appealing products.
U.K. Glassware Market Insight
預計英國玻璃器皿市場將在2025年至2032年間迎來最快增長,這得益於電商銷售額的增長、餐飲習慣的轉變以及家居裝飾和廚具潮流的日益流行。消費者在居家體驗方面的投入越來越多,例如個性化的用餐環境和廚房升級,這導致對價格實惠且時尚的玻璃器皿的需求增加。獨立品牌和手工玻璃製造商也越來越受到關注,尤其是在禮品和高端家居領域。
德國玻璃器皿市場洞察
預計德國玻璃器皿市場將在2025年至2032年間實現最快成長,這得益於其強大的製造業基礎、高品質的工藝以及消費者對永續實用設計的關注。德國企業在精密玻璃生產方面享有盛譽,在家用和商用玻璃器皿的創新領域持續引領產業發展。餐飲業對可重複使用和耐高溫玻璃製品的偏好,也推動各產業需求發揮重要作用。
亞太玻璃器皿市場洞察
受城鎮化進程加快、可支配收入增加以及酒店和餐飲服務業蓬勃發展的推動,亞太地區玻璃器皿市場預計將在2025年至2032年間迎來最快增長。隨著消費者偏好的演變,中國、印度和日本等市場對日常和高端玻璃器皿的需求強勁。政府推出的鼓勵永續包裝和餐飲解決方案的法規也推動著企業和家庭轉向玻璃替代品。
日本玻璃器皿市場洞察
預計日本玻璃器皿市場將在2025年至2032年間迎來最快成長,這得益於人們對極簡主義美學、高品質家居用品和傳統工藝日益增長的興趣。單身和雙收入家庭數量的成長,促使人們對緊湊、優雅、多功能廚具的投資增加。此外,對食物呈現方式的文化重視,也推動了對美觀精緻餐具(包括手工製作且經久耐用的玻璃器皿)的穩定需求。
中國玻璃器皿市場洞察
2024年,中國玻璃器皿市場佔據亞太地區最大收入份額,這得益於中國強大的製造業生態系統、不斷壯大的中產階級以及消費者對可持續生活方式產品日益增長的偏好。國內品牌正積極掌握市場對裝飾性和功能性玻璃器皿日益增長的需求,無論是個人使用或饋贈佳品。國內旅遊業和旅館業的蓬勃發展也帶動了飯店、餐廳和咖啡館對商用級玻璃器皿的強勁需求。
玻璃器皿市佔率
玻璃器皿產業主要由知名公司主導,包括:
- 康寧公司(美國)
- OI Glass(美國)
- Ardagh Group SA(盧森堡)
- 維德拉拉(西班牙)
- 維拉利亞(法國)
- 日本山村玻璃株式會社(日本)
- AGC株式會社(日本)
- Gerresheimer AG(德國)
- Vetropack Holding Ltd(瑞士)
- Stoelzle玻璃集團(奧地利)
- KOA GLASS CO., LTD.(韓國)
- 印度斯坦國家玻璃工業有限公司(印度)
- 日本板硝子株式會社(英國)
- 肖特股份公司(德國)
- PGP玻璃(印度)
- 聖戈班(法國)
- Bormioli Luigi SpA(義大利)
- 印度斯坦國家玻璃工業有限公司(印度)
- Vitro(墨西哥)
- Gerresheimer AG(德國)
全球玻璃器皿市集的最新發展
- 2022年4月,Chiefway宣佈在馬來西亞建立首家智慧玻璃製造工廠,這標誌著一項策略性發展,旨在滿足日益增長的可持續智慧家庭解決方案需求。新工廠預計將增加本地環保玻璃產品的供應,減少對進口的依賴,並支持區域智慧家居市場的成長。這項發展提升了馬來西亞在智慧材料領域的地位,同時也順應了全球永續發展趨勢。
- 2022年6月,Saverglass公佈了其計劃,計劃在2023年前擴大其玻璃瓶產能,以滿足美洲大陸日益增長的需求。此舉旨在提高供應鏈效率,縮短北美和拉丁美洲客戶的交貨時間,並鞏固該公司在高端玻璃包裝市場的關鍵地位。此次擴張預計將大力支持該地區日益增長的飲料和奢侈品行業。
SKU-

目录
- introduction
- OBJECTIVES OF THE STUDY
- MARKET DEFINITION
- OVERVIEW of GLOBAL GLASSWARE MARKET
- LIMITATIONS
- MARKETS COVERED
- MARKET SEGMENTATION
- MARKETS COVERED
- geographicAL scope
- years considered for the study
- currency and pricing
- DBMR TRIPOD DATA VALIDATION MODEL
- product LIFE LINE CURVE
- MULTIVARIATE MODELING
- primary interviews with key opinion leaders
- DBMR MARKET POSITION GRID
- MARKET application COVERAGE GRID
- DBMR MARKET CHALLENGE MATRIX
- vendor share analysis
- IMPORT-EXPORT DATA
- secondary sourcEs
- assumptions
- EXECUTIVE SUMMARY
- premium insights
- global
- asia-pacific
- middle east and africa
- North America
- South America
- Europe
- market overview
- drivers
- Growing levels of investment in the hotel and catering industry
- Changes in lifestyle of the consumers
- Rising popularity of fine dining across the globe
- Increasing demand for premium decorative glassware products
- restraints
- Availability of cheap quality products
- Rising demand for steel and paper base drinkware
- Difficulty in maintaining the glassware products
- opportunities
- Advancements in glassware production technologies
- Rising demand for glassware products for clinical use in hospitals and forensic laboratories
- challenges
- Complexity in manufacturing glassware products
- Rising difficulty in recycling glassware products
- IMPACT OF COVID-19 on the Global GLASSWARE MARKET
- ANALYSIS on IMPACT OF COVID-19 ON THE GLOBAL GLASSWARE MARKET
- AFTERMATH OF COVID-19 AND GOVERNMENT INITIATIVE TO BOOST THE GLOBAL GLASSWARE MARKET
- STRATEGIC DECISIONS FOR MANUFACTURERS AFTER COVID-19 TO GAIN COMPETITIVE MARKET SHARE
- IMPACT ON PRICE
- 對需求的影響
- 對供應鏈的影響
- 結論
- 全球玻璃器皿市集(按材質)
- 概述
- 鈉鈣玻璃
- 鉛玻璃
- 耐熱
- 其他的
- 全球玻璃器皿市集(按風格)
- 概述
- 高腳杯
- 紅酒杯
- 波爾多
- 赤霞珠
- 仙粉黛
- 勃根地
- 黑皮諾
- 玫瑰
- 白葡萄酒杯
- 氣泡酒
- 夏多內
- 維歐尼
- 醴
- 優質的
- 無柄玻璃杯
- 酒杯
- 啤酒杯
- 日常使用
- 其他的
- 全球玻璃器皿市集(按通路)
- 概述
- B2B
- 專賣店
- 超市/大賣場
- 電子商務
- 其他的
- 全球玻璃器皿市場,依價格範圍
- 概述
- 中等的
- 優質的
- 經濟
- 全球玻璃器皿市集(依最終用途劃分)
- 概述
- 飯店和餐廳
- 酒吧和咖啡館
- 家庭
- 企業食堂
- 其他的
- 全球玻璃器皿市場(按地域劃分)
- 概述
- 亞太
- 中國
- 印度
- 日本
- 韓國
- 新加坡
- 馬來西亞
- 泰國
- 澳洲和紐西蘭
- 印尼
- 菲律賓
- 香港
- 台灣
- 亞太其他地區
- 歐洲
- 德國
- 法國
- 義大利
- 英國
- 火雞
- 瑞士
- 西班牙
- 俄羅斯
- 荷蘭
- 比利時
- 歐洲其他地區
- 北美洲
- 我們
- 加拿大
- 墨西哥
- 南美洲
- 巴西
- 阿根廷
- 南美洲其他地區
- 中東和非洲
- 阿聯酋
- 沙烏地阿拉伯
- 南非
- 埃及
- 以色列
- 中東和非洲其他地區
- 全球玻璃器皿市集、公司版圖
- 公司份額分析:全球
- 公司份額分析:北美
- 公司份額分析:歐洲
- 公司份額分析:亞太地區
- 合併與收購
- 新產品開發
- 獎項
- 合作夥伴關係
- SWOT分析
- 公司簡介
- 利比公司
- 公司概況
- 收入分析
- 公司股票分析
- 產品組合
- 最近更新
- 終身品牌公司
- 公司概況
- 收入分析
- 公司股票分析
- 產品組合
- 最近更新
- 德國唯寶公司
- 公司概況
- 收入分析
- 公司股票分析
- 產品組合
- 最近更新
- WMF GmbH
- 公司概況
- 收入分析
- 公司股票分析
- 產品組合
- 最近更新
- 菲斯卡斯澳洲有限公司
- 公司概況
- 收入分析
- 公司股票分析
- 產品組合
- 最近更新
- 博爾米奧利羅科有限公司
- 公司概況
- 產品組合
- 最近更新
- 坎布里亞水晶
- 公司概況
- 產品組合
- 最近更新
- 德格倫納
- 公司概況
- 產品組合
- 最近更新
- Hrastnik1860
- 公司概況
- 產品組合
- 最近更新
- 萊諾克斯公司
- 公司概況
- 產品組合
- 最近更新
- 則武中國
- 公司概況
- 收入分析
- 產品組合
- 最近更新
- 施托爾茨勞西茨有限公司
- 公司概況
- 產品組合
- 最近更新
- 奧奈達集團
- 公司概況
- 產品組合
- 最近更新
- Zrike 公司
- 公司快照熱門
- 產品組合
- 最近更新
- 問卷調查
- 相關報道
表格列表
表 1 飲水杯(不包括玻璃陶瓷杯或鉛晶質杯和高腳杯)進口資料 HS 編碼 - 701337(千美元)
表 2 飲用玻璃杯(不含微晶玻璃杯或鉛晶玻璃杯及高腳杯)出口資料 HS 編碼 - 701337(千美元)
表 3 2015 年美國消費者偏好的可重複使用杯子類型
表 4 2019-2028 年全球玻璃器皿市場(按材料劃分)(千美元)
表 5 全球玻璃器皿市場(依材料劃分),2019-2028 年(千件)
表 6 2019-2028 年全球玻璃器皿市場鈉鈣玻璃按地區劃分(千美元)
表 7 2019-2028 年全球玻璃器皿市場鈉鈣玻璃依地區劃分(千台)
表 8 2019-2028 年全球玻璃器皿市場鉛玻璃按地區劃分(千美元)
表 9 2019-2028 年全球玻璃器皿市場鉛玻璃按地區劃分(千台)
表 10 全球耐熱玻璃器皿市場(按地區劃分),2019-2028 年(千美元)
表 11 全球耐熱玻璃器皿市場(按地區劃分),2019-2028 年(千台)
表 12 2019-2028 年全球玻璃器皿市場其他地區分佈(千美元)
表 13 2019-2028 年全球玻璃器皿市場其他產品(按地區劃分) (千台)
表 14 2019-2028 年全球玻璃器皿市場(按類型劃分)(千美元)
表 15 全球玻璃器皿高腳杯市場(按地區劃分),2019-2028 年(千美元)
表 16 全球玻璃器皿高腳杯市場(按類型),2019-2028 年(千美元)
表 17 2019-2028 年全球紅酒杯玻璃器皿市場(按類型劃分)(千美元)
TABLE 18 Global white wine glass IN GLASSWARE market, BY type, 2019-2028 (USD thousand)
TABLE 19 Global stemless glass IN GLASSWARE market, BY region, 2019-2028 (USD thousand)
TABLE 20 Global Stemless Glass IN GLASSWARE market, BY type, 2019-2028 (USD thousand)
TABLE 21 Global Everyday usage IN GLASSWARE market, BY region, 2019-2028 (USD thousand)
TABLE 22 Global Others IN GLASSWARE market, BY region, 2019-2028 (USD thousand)
TABLE 23 Global GLASSWARE market, BY distribution channel, 2019-2028 (USD Thousand)
TABLE 24 Global B2b in GLASSWARE market, BY region, 2019-2028 (USD thousand)
TABLE 25 Global specialized stores in GLASSWARE market, BY region, 2019-2028 (USD thousand)
TABLE 26 Global supermarkets/hypermarkets in GLASSWARE market, BY region, 2019-2028 (USD thousand)
TABLE 27 Global e-commerce in GLASSWARE market, BY region, 2019-2028 (USD thousand)
TABLE 28 Global others in GLASSWARE market, BY region, 2019-2028 (USD thousand)
TABLE 29 Global GLASSWARE market, BY price range, 2019-2028 (USD Thousand)
TABLE 30 Global medium in GLASSWARE market, BY region, 2019-2028 (USD thousand)
TABLE 31 Global Premium in GLASSWARE market, BY region, 2019-2028 (USD thousand)
TABLE 32 Global Economy in GLASSWARE market, BY region, 2019-2028 (USD thousand)
TABLE 33 Global GLASSWARE market, BY end-use, 2019-2028 (USD Thousand)
TABLE 34 Global Hotels & Restaurants IN GLASSWARE market, BY region, 2019-2028 (USD thousand)
TABLE 35 Global Bars & café IN GLASSWARE market, BY region, 2019-2028 (USD thousand)
TABLE 36 Global Household IN GLASSWARE market, BY region, 2019-2028 (USD thousand)
TABLE 37 Global Corporate Canteens IN GLASSWARE market, BY region, 2019-2028 (USD thousand)
TABLE 38 Global others IN GLASSWARE market, BY region, 2019-2028 (USD thousand)
TABLE 39 GLOBAL glassware market, By region, 2019-2028 (USD thousand)
TABLE 40 GLOBAL glassware market, By region, 2019-2028 (thousand Units)
TABLE 41 Asia-Pacific glassware Market, BY COUNtry, 2019-2028 (USD Thousand)
TABLE 42 Asia-Pacific glassware Market, BY COUNtry, 2019-2028 (Thousand Units)
TABLE 43 Asia-Pacific Glassware Market, By Material, 2019-2028 (USD Thousand)
TABLE 44 Asia-Pacific Glassware Market, By Material, 2019-2028 (Thousand Units)
TABLE 45 Asia-Pacific Glassware Market, By Style, 2019-2028 (USD Thousand)
TABLE 46 Asia-Pacific Stemware in Glassware Market, By Type, 2019-2028 (USD Thousand)
TABLE 47 Asia-Pacific Red Wine Glass in Glassware Market, By Type, 2019-2028 (USD Thousand)
TABLE 48 Asia-Pacific White Wine Glass in Glassware Market, By Type, 2019-2028 (USD Thousand)
TABLE 49 Asia-Pacific Stemless Glass in Glassware Market, By Type, 2019-2028 (USD Thousand)
TABLE 50 Asia-Pacific Glassware Market, By Distribution Channel, 2019-2028 (USD Thousand)
TABLE 51 Asia-Pacific Glassware Market, By Price Range, 2019-2028 (USD Thousand)
TABLE 52 Asia-Pacific Glassware Market, By End-Use, 2019-2028 (USD Thousand)
TABLE 53 CHINA Glassware Market, By Material, 2019-2028 (USD Thousand)
TABLE 54 CHINA Glassware Market, By Material, 2019-2028 (Thousand Units)
TABLE 55 CHINA Glassware Market, By Style, 2019-2028 (USD Thousand)
TABLE 56 CHINA Stemware in Glassware Market, By Type, 2019-2028 (USD Thousand)
TABLE 57 CHINA Red Wine Glass in Glassware Market, By Type, 2019-2028 (USD Thousand)
TABLE 58 CHINA White Wine Glass in Glassware Market, By Type, 2019-2028 (USD Thousand)
TABLE 59 CHINA Stemless Glass in Glassware Market, By Type, 2019-2028 (USD Thousand)
TABLE 60 CHINA Glassware Market, By Distribution Channel, 2019-2028 (USD Thousand)
TABLE 61 CHINA Glassware Market, By Price Range, 2019-2028 (USD Thousand)
TABLE 62 CHINA Glassware Market, By End-Use, 2019-2028 (USD Thousand)
TABLE 63 INDIA Glassware Market, By Material, 2019-2028 (USD Thousand)
TABLE 64 INDIA Glassware Market, By Material, 2019-2028 (Thousand Units)
TABLE 65 INDIA Glassware Market, By Style, 2019-2028 (USD Thousand)
TABLE 66 INDIA Stemware in Glassware Market, By Type, 2019-2028 (USD Thousand)
TABLE 67 INDIA Red Wine Glass in Glassware Market, By Type, 2019-2028 (USD Thousand)
TABLE 68 INDIA White Wine Glass in Glassware Market, By Type, 2019-2028 (USD Thousand)
TABLE 69 INDIA Stemless Glass in Glassware Market, By Type, 2019-2028 (USD Thousand)
TABLE 70 INDIA Glassware Market, By Distribution Channel, 2019-2028 (USD Thousand)
TABLE 71 INDIA Glassware Market, By Price Range, 2019-2028 (USD Thousand)
TABLE 72 INDIA Glassware Market, By End-Use, 2019-2028 (USD Thousand)
TABLE 73 JAPAN Glassware Market, By Material, 2019-2028 (USD Thousand)
TABLE 74 JAPAN Glassware Market, By Material, 2019-2028 (Thousand Units)
TABLE 75 JAPAN Glassware Market, By Style, 2019-2028 (USD Thousand)
TABLE 76 JAPAN Stemware in Glassware Market, By Type, 2019-2028 (USD Thousand)
TABLE 77 JAPAN Red Wine Glass in Glassware Market, By Type, 2019-2028 (USD Thousand)
TABLE 78 JAPAN White Wine Glass in Glassware Market, By Type, 2019-2028 (USD Thousand)
TABLE 79 JAPAN Stemless Glass in Glassware Market, By Type, 2019-2028 (USD Thousand)
TABLE 80 JAPAN Glassware Market, By Distribution Channel, 2019-2028 (USD Thousand)
TABLE 81 JAPAN Glassware Market, By Price Range, 2019-2028 (USD Thousand)
TABLE 82 JAPAN Glassware Market, By End-Use, 2019-2028 (USD Thousand)
TABLE 83 SOUTH KOREA Glassware Market, By Material, 2019-2028 (USD Thousand)
TABLE 84 SOUTH KOREA Glassware Market, By Material, 2019-2028 (Thousand Units)
TABLE 85 SOUTH KOREA Glassware Market, By Style, 2019-2028 (USD Thousand)
TABLE 86 SOUTH KOREA Stemware in Glassware Market, By Type, 2019-2028 (USD Thousand)
TABLE 87 SOUTH KOREA Red Wine Glass in Glassware Market, By Type, 2019-2028 (USD Thousand)
TABLE 88 SOUTH KOREA White Wine Glass in Glassware Market, By Type, 2019-2028 (USD Thousand)
TABLE 89 SOUTH KOREA Stemless Glass in Glassware Market, By Type, 2019-2028 (USD Thousand)
TABLE 90 SOUTH KOREA Glassware Market, By Distribution Channel, 2019-2028 (USD Thousand)
TABLE 91 SOUTH KOREA Glassware Market, By Price Range, 2019-2028 (USD Thousand)
TABLE 92 SOUTH KOREA Glassware Market, By End-Use, 2019-2028 (USD Thousand)
TABLE 93 SINGAPORE Glassware Market, By Material, 2019-2028 (USD Thousand)
TABLE 94 SINGAPORE Glassware Market, By Material, 2019-2028 (Thousand Units)
TABLE 95 SINGAPORE Glassware Market, By Style, 2019-2028 (USD Thousand)
TABLE 96 SINGAPORE Stemware in Glassware Market, By Type, 2019-2028 (USD Thousand)
TABLE 97 SINGAPORE Red Wine Glass in Glassware Market, By Type, 2019-2028 (USD Thousand)
TABLE 98 SINGAPORE White Wine Glass in Glassware Market, By Type, 2019-2028 (USD Thousand)
TABLE 99 SINGAPORE Stemless Glass in Glassware Market, By Type, 2019-2028 (USD Thousand)
TABLE 100 SINGAPORE Glassware Market, By Distribution Channel, 2019-2028 (USD Thousand)
TABLE 101 SINGAPORE Glassware Market, By Price Range, 2019-2028 (USD Thousand)
TABLE 102 SINGAPORE Glassware Market, By End-Use, 2019-2028 (USD Thousand)
TABLE 103 MALAYSIA Glassware Market, By Material, 2019-2028 (USD Thousand)
TABLE 104 MALAYSIA Glassware Market, By Material, 2019-2028 (Thousand Units)
TABLE 105 MALAYSIA Glassware Market, By Style, 2019-2028 (USD Thousand)
TABLE 106 MALAYSIA Stemware in Glassware Market, By Type, 2019-2028 (USD Thousand)
TABLE 107 MALAYSIA Red Wine Glass in Glassware Market, By Type, 2019-2028 (USD Thousand)
TABLE 108 MALAYSIA White Wine Glass in Glassware Market, By Type, 2019-2028 (USD Thousand)
TABLE 109 MALAYSIA Stemless Glass in Glassware Market, By Type, 2019-2028 (USD Thousand)
TABLE 110 MALAYSIA Glassware Market, By Distribution Channel, 2019-2028 (USD Thousand)
TABLE 111 MALAYSIA Glassware Market, By Price Range, 2019-2028 (USD Thousand)
TABLE 112 MALAYSIA Glassware Market, By End-Use, 2019-2028 (USD Thousand)
TABLE 113 THAILAND Glassware Market, By Material, 2019-2028 (USD Thousand)
TABLE 114 THAILAND Glassware Market, By Material, 2019-2028 (Thousand Units)
TABLE 115 THAILAND Glassware Market, By Style, 2019-2028 (USD Thousand)
TABLE 116 THAILAND Stemware in Glassware Market, By Type, 2019-2028 (USD Thousand)
TABLE 117 THAILAND Red Wine Glass in Glassware Market, By Type, 2019-2028 (USD Thousand)
TABLE 118 THAILAND White Wine Glass in Glassware Market, By Type, 2019-2028 (USD Thousand)
TABLE 119 THAILAND Stemless Glass in Glassware Market, By Type, 2019-2028 (USD Thousand)
TABLE 120 THAILAND Glassware Market, By Distribution Channel, 2019-2028 (USD Thousand)
TABLE 121 THAILAND Glassware Market, By Price Range, 2019-2028 (USD Thousand)
TABLE 122 THAILAND Glassware Market, By End-Use, 2019-2028 (USD Thousand)
TABLE 123 AUSTRALIA AND NEW ZEALAND Glassware Market, By Material, 2019-2028 (USD Thousand)
TABLE 124 AUSTRALIA AND NEW ZEALAND Glassware Market, By Material, 2019-2028 (Thousand Units)
TABLE 125 AUSTRALIA AND NEW ZEALAND Glassware Market, By Style, 2019-2028 (USD Thousand)
TABLE 126 AUSTRALIA AND NEW ZEALAND Stemware in Glassware Market, By Type, 2019-2028 (USD Thousand)
TABLE 127 AUSTRALIA AND NEW ZEALAND Red Wine Glass in Glassware Market, By Type, 2019-2028 (USD Thousand)
TABLE 128 AUSTRALIA AND NEW ZEALAND White Wine Glass in Glassware Market, By Type, 2019-2028 (USD Thousand)
TABLE 129 AUSTRALIA AND NEW ZEALAND Stemless Glass in Glassware Market, By Type, 2019-2028 (USD Thousand)
TABLE 130 AUSTRALIA AND NEW ZEALAND Glassware Market, By Distribution Channel, 2019-2028 (USD Thousand)
TABLE 131 AUSTRALIA AND NEW ZEALAND Glassware Market, By Price Range, 2019-2028 (USD Thousand)
TABLE 132 AUSTRALIA AND NEW ZEALAND Glassware Market, By End-Use, 2019-2028 (USD Thousand)
TABLE 133 INDONESIA Glassware Market, By Material, 2019-2028 (USD Thousand)
TABLE 134 INDONESIA Glassware Market, By Material, 2019-2028 (Thousand Units)
TABLE 135 INDONESIA Glassware Market, By Style, 2019-2028 (USD Thousand)
TABLE 136 INDONESIA Stemware in Glassware Market, By Type, 2019-2028 (USD Thousand)
TABLE 137 INDONESIA Red Wine Glass in Glassware Market, By Type, 2019-2028 (USD Thousand)
TABLE 138 INDONESIA White Wine Glass in Glassware Market, By Type, 2019-2028 (USD Thousand)
TABLE 139 INDONESIA Stemless Glass in Glassware Market, By Type, 2019-2028 (USD Thousand)
TABLE 140 INDONESIA Glassware Market, By Distribution Channel, 2019-2028 (USD Thousand)
TABLE 141 INDONESIA Glassware Market, By Price Range, 2019-2028 (USD Thousand)
TABLE 142 INDONESIA Glassware Market, By End-Use, 2019-2028 (USD Thousand)
TABLE 143 PHILIPPINES Glassware Market, By Material, 2019-2028 (USD Thousand)
TABLE 144 PHILIPPINES Glassware Market, By Material, 2019-2028 (Thousand Units)
TABLE 145 PHILIPPINES Glassware Market, By Style, 2019-2028 (USD Thousand)
TABLE 146 PHILIPPINES Stemware in Glassware Market, By Type, 2019-2028 (USD Thousand)
TABLE 147 PHILIPPINES Red Wine Glass in Glassware Market, By Type, 2019-2028 (USD Thousand)
TABLE 148 PHILIPPINES White Wine Glass in Glassware Market, By Type, 2019-2028 (USD Thousand)
TABLE 149 PHILIPPINES Stemless Glass in Glassware Market, By Type, 2019-2028 (USD Thousand)
TABLE 150 PHILIPPINES Glassware Market, By Distribution Channel, 2019-2028 (USD Thousand)
TABLE 151 PHILIPPINES Glassware Market, By Price Range, 2019-2028 (USD Thousand)
TABLE 152 PHILIPPINES Glassware Market, By End-Use, 2019-2028 (USD Thousand)
TABLE 153 HONG KONG Glassware Market, By Material, 2019-2028 (USD Thousand)
TABLE 154 HONG KONG Glassware Market, By Material, 2019-2028 (Thousand Units)
TABLE 155 HONG KONG Glassware Market, By Style, 2019-2028 (USD Thousand)
TABLE 156 HONG KONG Stemware in Glassware Market, By Type, 2019-2028 (USD Thousand)
TABLE 157 HONG KONG Red Wine Glass in Glassware Market, By Type, 2019-2028 (USD Thousand)
TABLE 158 HONG KONG White Wine Glass in Glassware Market, By Type 2019-2028 (USD Thousand)
TABLE 159 HONG KONG Stemless Glass in Glassware Market, By Type, 2019-2028 (USD Thousand)
TABLE 160 HONG KONG Glassware Market, By Distribution Channel, 2019-2028 (USD Thousand)
TABLE 161 HONG KONG Glassware Market, By Price Range, 2019-2028 (USD Thousand)
TABLE 162 HONG KONG Glassware Market, By End-Use, 2019-2028 (USD Thousand)
表163 台灣玻璃器皿市場,依材料,2019-2028(千元)
表164 台灣玻璃器皿市場,依材料,2019-2028(千台)
表165 台灣玻璃器皿市場,按類型,2019-2028(千美元)
表166 2019-2028年台灣玻璃器皿市場高腳杯類型(千美元)
表167 台灣紅酒杯玻璃器皿市場,按類型,2019-2028年(千美元)
表168 2019-2028年台灣玻璃器皿市場白酒杯類型(千美元)
表169 2019-2028年台灣玻璃器皿市場無柄玻璃杯類型(千美元)
表170台灣玻璃器皿市場,依通路,2019-2028年(千美元)
表171 台灣玻璃器皿市場,以價格範圍,2019-2028(千美元)
表172 台灣玻璃器皿市場,依最終用途,2019-2028(千元)
表173 2019-2028年亞太地區其他地區玻璃器皿市場(依材料劃分)(千美元)
表174 2019-2028年亞太其他地區玻璃器皿市場(依材料劃分) (千台)
表 175 歐洲玻璃器皿市場(按國家/地區劃分),2019-2028 年(千美元)
表 176 歐洲玻璃器皿市場(按國家/地區劃分),2019-2028 年(千台)
表 177 歐洲玻璃器皿市場,依材料,2019-2028 年(千美元)
表178 歐洲玻璃器皿市場,依材料,2019-2028(千台)
表 179 歐洲玻璃器皿市場,依款式,2019-2028(千美元)
表 180 歐洲玻璃器皿市場高腳杯,按類型,2019-2028 年(千美元)
表181 歐洲紅酒杯玻璃器皿市場,依類型,2019-2028年(千美元)
表182 歐洲玻璃器皿市場白葡萄酒杯,按類型,2019-2028年(千美元)
表183 歐洲玻璃器皿市場無柄玻璃杯,按類型,2019-2028年(千美元)
表184 歐洲玻璃器皿市場,依通路,2019-2028年(千美元)
表185 歐洲玻璃器皿市場,以價格範圍,2019-2028年(千美元)
表 186 歐洲玻璃器皿市場,依最終用途,2019-2028 年(千元)
表 187 德國玻璃器皿市場,依材料,2019-2028 年(千美元)
表188 德國玻璃器皿市場,依材料,2019-2028(千台)
表 189 德國玻璃器皿市場,依款式,2019-2028 年(千美元)
表 190 德國玻璃器皿市場高腳杯,按類型,2019-2028 年(千美元)
表191 德國玻璃器皿市場紅酒杯,按類型,2019-2028年(千美元)
表192 德國玻璃器皿市場白葡萄酒杯,按類型,2019-2028年(千美元)
表193 德國玻璃器皿市場無柄玻璃杯,依類型,2019-2028年(千美元)
表194 德國玻璃器皿市場,依通路,2019-2028年(千美元)
表195 德國玻璃器皿市場,以價格範圍,2019-2028年(千美元)
表196 德國玻璃器皿市場,依最終用途,2019-2028年(千美元)
表 197 法國玻璃器皿市場,依材料,2019-2028 年(千元)
表198 法國玻璃器皿市場,依材料,2019-2028(千台)
表199 法國玻璃器皿市場,依款式,2019-2028(千美元)
表200 法國玻璃器皿市場高腳杯,按類型,2019-2028年(千美元)
表201 法國紅酒杯在玻璃器皿市場中的應用,依類型,2019-2028年(千美元)
表202 法國玻璃器皿市場白葡萄酒杯,按類型,2019-2028年(千美元)
表203 法國玻璃器皿市場無柄玻璃杯,按類型,2019-2028年(千美元)
表204 法國玻璃器皿市場,依通路,2019-2028年(千美元)
表205 法國玻璃器皿市場,以價格範圍,2019-2028年(千美元)
表206 法國玻璃器皿市場,依最終用途,2019-2028年(千美元)
表207 義大利玻璃器皿市場,依材料分類,2019-2028年(千美元)
表208 義大利玻璃器皿市場(依材料劃分),2019-2028(千台)
表209 義大利玻璃器皿市場,依款式,2019-2028(千美元)
表210 義大利玻璃器皿市場高腳杯,按類型,2019-2028年(千美元)
表211 義大利紅酒杯在玻璃器皿市場的分類,2019-2028年(千美元)
表212 義大利玻璃器皿市場白葡萄酒杯,按類型,2019-2028年(千美元)
表213 義大利玻璃器皿市場無柄玻璃杯,依類型,2019-2028年(千美元)
表214 義大利玻璃器皿市場,依通路,2019-2028年(千美元)
表215 義大利玻璃器皿市場,以價格範圍,2019-2028年(千美元)
表216 義大利玻璃器皿市場,依最終用途,2019-2028年(千美元)
表217 英國玻璃器皿市場,依材料分類,2019-2028年(千美元)
表218 英國玻璃器皿市場,依材料,2019-2028(千台)
表 219 英國玻璃器皿市場,依款式,2019-2028 年(千美元)
表220英國玻璃器皿市場高腳杯,按類型,2019-2028年(千美元)
表221 英國紅酒杯在玻璃器皿市場中的應用,按類型,2019-2028年(千美元)
表222 英國玻璃器皿市場白葡萄酒杯,按類型,2019-2028年(千美元)
表223 英國玻璃器皿市場無柄玻璃杯,按類型,2019-2028年(千美元)
表224 英國玻璃器皿市場,依通路,2019-2028年(千美元)
表225 英國玻璃器皿市場,以價格範圍,2019-2028年(千美元)
表226 英國玻璃器皿市場,依最終用途,2019-2028年(千美元)
表227 土耳其玻璃器皿市場(依材料劃分),2019-2028年(千美元)
表228 土耳其玻璃器皿市場(依材料劃分),2019-2028(千台)
表229 土耳其玻璃器皿市場,依款式,2019-2028(千美元)
表230 2019-2028年土耳其玻璃器皿市場高腳杯類型(千美元)
表231 2019-2028土耳其紅酒杯玻璃器皿市場類型(千美元)
表232 2019-2028年土耳其玻璃器皿市場白酒杯類型(千美元)
表233 2019-2028年土耳其玻璃器皿市場無柄玻璃杯類型(千美元)
表234 土耳其玻璃器皿市場,依通路,2019-2028年(千美元)
表235 土耳其玻璃器皿市場,以價格範圍,2019-2028年(千美元)
表236 土耳其玻璃器皿市場,依最終用途,2019-2028年(千美元)
表237 瑞士玻璃器皿市場,依材料分類,2019-2028年(千美元)
表238 瑞士玻璃器皿市場,依材料,2019-2028(千台)
TABLE 239 Switzerland Glassware Market, By Style, 2019-2028 (USD Thousand)
TABLE 240 Switzerland Stemware in Glassware Market, By Type, 2019-2028 (USD Thousand)
TABLE 241 Switzerland Red Wine Glass in Glassware Market, By Type, 2019-2028 (USD Thousand)
TABLE 242 Switzerland White Wine Glass in Glassware Market, By Type, 2019-2028 (USD Thousand)
TABLE 243 Switzerland Stemless Glass in Glassware Market, By Type, 2019-2028 (USD Thousand)
TABLE 244 Switzerland Glassware Market, By Distribution Channel, 2019-2028 (USD Thousand)
TABLE 245 Switzerland Glassware Market, By Price Range, 2019-2028 (USD Thousand)
TABLE 246 Switzerland Glassware Market, By End-Use, 2019-2028 (USD Thousand)
TABLE 247 Spain Glassware Market, By Material, 2019-2028 (USD Thousand)
TABLE 248 Spain Glassware Market, By Material, 2019-2028 (Thousand Units)
TABLE 249 Spain Glassware Market, By Style, 2019-2028 (USD Thousand)
TABLE 250 Spain Stemware in Glassware Market, By Type, 2019-2028 (USD Thousand)
TABLE 251 Spain Red Wine Glass in Glassware Market, By Type, 2019-2028 (USD Thousand)
TABLE 252 Spain White Wine Glass in Glassware Market, By Type, 2019-2028 (USD Thousand)
TABLE 253 Spain Stemless Glass in Glassware Market, By Type, 2019-2028 (USD Thousand)
TABLE 254 Spain Glassware Market, By Distribution Channel, 2019-2028 (USD Thousand)
TABLE 255 Spain Glassware Market, By Price Range, 2019-2028 (USD Thousand)
TABLE 256 Spain Glassware Market, By End-Use, 2019-2028 (USD Thousand)
TABLE 257 Russia Glassware Market, By Material, 2019-2028 (USD Thousand)
TABLE 258 Russia Glassware Market, By Material, 2019-2028 (Thousand Units)
TABLE 259 Russia Glassware Market, By Style, 2019-2028 (USD Thousand)
TABLE 260 Russia Stemware in Glassware Market, By Type, 2019-2028 (USD Thousand)
TABLE 261 Russia Red Wine Glass in Glassware Market, By Type, 2019-2028 (USD Thousand)
TABLE 262 Russia White Wine Glass in Glassware Market, By Type, 2019-2028 (USD Thousand)
TABLE 263 Russia Stemless Glass in Glassware Market, By Type, 2019-2028 (USD Thousand)
TABLE 264 Russia Glassware Market, By Distribution Channel, 2019-2028 (USD Thousand)
TABLE 265 Russia Glassware Market, By Price Range, 2019-2028 (USD Thousand)
TABLE 266 Russia Glassware Market, By End-Use, 2019-2028 (USD Thousand)
TABLE 267 Netherlands Glassware Market, By Material, 2019-2028 (USD Thousand)
TABLE 268 Netherlands Glassware Market, By Material, 2019-2028 (Thousand Units)
TABLE 269 Netherlands Glassware Market, By Style, 2019-2028 (USD Thousand)
TABLE 270 Netherlands Stemware in Glassware Market, By Type, 2019-2028 (USD Thousand)
TABLE 271 Netherlands Red Wine Glass in Glassware Market, By Type, 2019-2028 (USD Thousand)
TABLE 272 Netherlands White Wine Glass in Glassware Market, By Type, 2019-2028 (USD Thousand)
TABLE 273 Netherlands Stemless Glass in Glassware Market, By Type, 2019-2028 (USD Thousand)
TABLE 274 Netherlands Glassware Market, By Distribution Channel, 2019-2028 (USD Thousand)
TABLE 275 Netherlands Glassware Market, By Price Range, 2019-2028 (USD Thousand)
TABLE 276 Netherlands Glassware Market, By End-Use, 2019-2028 (USD Thousand)
TABLE 277 Belgium Glassware Market, By Material, 2019-2028 (USD Thousand)
TABLE 278 Belgium Glassware Market, By Material, 2019-2028 (Thousand Units)
TABLE 279 Belgium Glassware Market, By Style, 2019-2028 (USD Thousand)
TABLE 280 Belgium Stemware in Glassware Market, By Type, 2019-2028 (USD Thousand)
TABLE 281 Belgium Red Wine Glass in Glassware Market, By Type, 2019-2028 (USD Thousand)
TABLE 282 Belgium White Wine Glass in Glassware Market, By Type, 2019-2028 (USD Thousand)
TABLE 283 Belgium Stemless Glass in Glassware Market, By Type, 2019-2028 (USD Thousand)
TABLE 284 Belgium Glassware Market, By Distribution Channel, 2019-2028 (USD Thousand)
TABLE 285 Belgium Glassware Market, By Price Range, 2019-2028 (USD Thousand)
TABLE 286 Belgium Glassware Market, By End-Use, 2019-2028 (USD Thousand)
TABLE 287 rest of europe Glassware Market, By Material, 2019-2028 (USD Thousand)
TABLE 288 rest of europe Glassware Market, By Material, 2019-2028 (Thousand Units)
TABLE 289 North America Glassware Market, BY COUNTRY, 2019-2028 (USD Thousand)
TABLE 290 North America Glassware Market, BY COUNTRY,2019-2028 (Thousand units)
TABLE 291 North America Glassware Market, By Material, 2019-2028 (USD Thousand)
TABLE 292 North America Glassware Market, By Material, 2019-2028 (Thousand Units)
TABLE 293 North America Glassware Market, By Style, 2019-2028 (USD Thousand)
TABLE 294 North America Stemware in Glassware Market, By Type, 2019-2028 (USD Thousand)
TABLE 295 North America Red Wine Glass in Glassware Market, By Type, 2019-2028 (USD Thousand)
TABLE 296 North America White Wine Glass in Glassware Market, By Type, 2019-2028 (USD Thousand)
TABLE 297 North America Stemless Glass in Glassware Market, By Type, 2019-2028 (USD Thousand)
TABLE 298 North America Glassware Market, By Distribution Channel, 2019-2028 (USD Thousand)
TABLE 299 North America Glassware Market, By Price Range, 2019-2028 (USD Thousand)
TABLE 300 North America Glassware Market, By End-Use, 2019-2028 (USD Thousand)
TABLE 301 U.S. Glassware Market, By Material, 2019-2028 (USD Thousand)
TABLE 302 U.S. Glassware Market, By Material, 2019-2028 (Thousand Units)
TABLE 303 U.S. Glassware Market, By Style, 2019-2028 (USD Thousand)
TABLE 304 U.S. Stemware in Glassware Market, By Type, 2019-2028 (USD Thousand)
TABLE 305 U.S. Red Wine Glass in Glassware Market, By Type, 2019-2028 (USD Thousand)
TABLE 306 U.S. White Wine Glass in Glassware Market, By Type, 2019-2028 (USD Thousand)
TABLE 307 U.S. Stemless Glass in Glassware Market, By Type, 2019-2028 (USD Thousand)
TABLE 308 U.S. Glassware Market, By Distribution Channel, 2019-2028 (USD Thousand)
TABLE 309 U.S. Glassware Market, By Price Range, 2019-2028 (USD Thousand)
TABLE 310 U.S. Glassware Market, By End-Use, 2019-2028 (USD Thousand)
TABLE 311 CANADA Glassware Market, By Material, 2019-2028 (USD Thousand)
TABLE 312 CANADA Glassware Market, By Material, 2019-2028 (Thousand Units)
TABLE 313 CANADA Glassware Market, By Style, 2019-2028 (USD Thousand)
TABLE 314 CANADA Stemware in Glassware Market, By Type, 2019-2028 (USD Thousand)
TABLE 315 CANADA Red Wine Glass in Glassware Market, By Type, 2019-2028 (USD Thousand)
TABLE 316 CANADA White Wine Glass in Glassware Market, By Type, 2019-2028 (USD Thousand)
TABLE 317 CANADA Stemless Glass in Glassware Market, By Type, 2019-2028 (USD Thousand)
TABLE 318 CANADA Glassware Market, By Distribution Channel, 2019-2028 (USD Thousand)
TABLE 319 CANADA Glassware Market, By Price Range, 2019-2028 (USD Thousand)
TABLE 320 CANADA Glassware Market, By End-Use, 2019-2028 (USD Thousand)
TABLE 321 MEXICO Glassware Market, By Material, 2019-2028 (USD Thousand)
TABLE 322 MEXICO Glassware Market, By Material, 2019-2028 (Thousand Units)
TABLE 323 MEXICO Glassware Market, By Style, 2019-2028 (USD Thousand)
TABLE 324 MEXICO Stemware in Glassware Market, By Type, 2019-2028 (USD Thousand)
TABLE 325 MEXICO Red Wine Glass in Glassware Market, By Type, 2019-2028 (USD Thousand)
TABLE 326 MEXICO White Wine Glass in Glassware Market, By Type, 2019-2028 (USD Thousand)
TABLE 327 MEXICO Stemless Glass in Glassware Market, By Type, 2019-2028 (USD Thousand)
TABLE 328 MEXICO Glassware Market, By Distribution Channel, 2019-2028 (USD Thousand)
TABLE 329 MEXICO Glassware Market, By Price Range, 2019-2028 (USD Thousand)
TABLE 330 MEXICO Glassware Market, By End-Use, 2019-2028 (USD Thousand)
TABLE 331 South america glassware Market, BY COUNtry,2019-2028 (USD Thousand)
TABLE 332 South america glassware Market, BY COUNtry,2019-2028 (Thousand Units)
TABLE 333 South america Glassware Market, By Material, 2019-2028 (USD Thousand)
TABLE 334 South america Glassware Market, By Material, 2019-2028 (Thousand Units)
TABLE 335 South america Glassware Market, By Style, 2019-2028 (USD Thousand)
TABLE 336 South america Stemware in Glassware Market, By Type, 2019-2028 (USD Thousand)
TABLE 337 South america Red Wine Glass in Glassware Market, By Type, 2019-2028 (USD Thousand)
TABLE 338 South america White Wine Glass in Glassware Market, By Type, 2019-2028 (USD Thousand)
TABLE 339 South america Stemless Glass in Glassware Market, By Type, 2019-2028 (USD Thousand)
TABLE 340 South america Glassware Market, By Distribution Channel, 2019-2028 (USD Thousand)
TABLE 341 South america Glassware Market, By Price Range, 2019-2028 (USD Thousand)
TABLE 342 South america Glassware Market, By End-Use, 2019-2028 (USD Thousand)
TABLE 343 Brazil Glassware Market, By Material, 2019-2028 (USD Thousand)
TABLE 344 Brazil Glassware Market, By Material, 2019-2028 (Thousand Units)
TABLE 345 Brazil Glassware Market, By Style, 2019-2028 (USD Thousand)
TABLE 346 Brazil Stemware in Glassware Market, By Type, 2019-2028 (USD Thousand)
TABLE 347 Brazil Red Wine Glass in Glassware Market, By Type, 2019-2028 (USD Thousand)
TABLE 348 Brazil White Wine Glass in Glassware Market, By Type, 2019-2028 (USD Thousand)
TABLE 349 Brazil Stemless Glass in Glassware Market, By Type, 2019-2028 (USD Thousand)
TABLE 350 Brazil Glassware Market, By Distribution Channel, 2019-2028 (USD Thousand)
TABLE 351 Brazil Glassware Market, By Price Range, 2019-2028 (USD Thousand)
TABLE 352 Brazil Glassware Market, By End-Use, 2019-2028 (USD Thousand)
TABLE 353 Argentina Glassware Market, By Material, 2019-2028 (USD Thousand)
TABLE 354 Argentina Glassware Market, By Material, 2019-2028 (Thousand Units)
TABLE 355 Argentina Glassware Market, By Style, 2019-2028 (USD Thousand)
TABLE 356 Argentina Stemware in Glassware Market, By Type, 2019-2028 (USD Thousand)
TABLE 357 Argentina Red Wine Glass in Glassware Market, By Type, 2019-2028 (USD Thousand)
TABLE 358 Argentina White Wine Glass in Glassware Market, By Type, 2019-2028 (USD Thousand)
TABLE 359 Argentina Stemless Glass in Glassware Market, By Type, 2019-2028 (USD Thousand)
TABLE 360 Argentina Glassware Market, By Distribution Channel, 2019-2028 (USD Thousand)
TABLE 361 Argentina Glassware Market, By Price Range, 2019-2028 (USD Thousand)
TABLE 362 Argentina Glassware Market, By End-Use, 2019-2028 (USD Thousand)
TABLE 363 rest of south america Glassware Market, By Material, 2019-2028 (USD Thousand)
TABLE 364 rest of south america Glassware Market, By Material, 2019-2028 (Thousand Units)
TABLE 365 Middle East and Africa glassware Market, BY COUNtry,2019-2028 (USD Thousand)
TABLE 366 Middle East and Africa glassware Market, BY COUNtry, 2019-2028 (Thousand Units)
TABLE 367 Middle East and Africa Glassware Market, By Material, 2019-2028 (USD Thousand)
TABLE 368 Middle East and Africa Glassware Market, By Material, 2019-2028 (Thousand Units)
TABLE 369 Middle East and Africa Glassware Market, By Style, 2019-2028 (USD Thousand)
TABLE 370 Middle East and Africa Stemware in Glassware Market, By Type, 2019-2028 (USD Thousand)
TABLE 371 Middle East and Africa Red Wine Glass in Glassware Market, By Type, 2019-2028 (USD Thousand)
TABLE 372 Middle East and Africa White Wine Glass in Glassware Market, By Type, 2019-2028 (USD Thousand)
TABLE 373 Middle East and Africa Stemless Glass in Glassware Market, By Type, 2019-2028 (USD Thousand)
TABLE 374 Middle East and Africa Glassware Market, By Distribution Channel, 2019-2028 (USD Thousand)
TABLE 375 Middle East and Africa Glassware Market, By Price Range, 2019-2028 (USD Thousand)
TABLE 376 Middle East and Africa Glassware Market, By End-Use, 2019-2028 (USD Thousand)
TABLE 377 U.A.E Glassware Market, By Material, 2019-2028 (USD Thousand)
TABLE 378 U.A.E Glassware Market, By Material, 2019-2028 (Thousand Units)
TABLE 379 U.A.E Glassware Market, By Style, 2019-2028 (USD Thousand)
TABLE 380 U.A.E Stemware in Glassware Market, By Type, 2019-2028 (USD Thousand)
TABLE 381 U.A.E Red Wine Glass in Glassware Market, By Type, 2019-2028 (USD Thousand)
TABLE 382 U.A.E White Wine Glass in Glassware Market, By Type, 2019-2028 (USD Thousand)
TABLE 383 U.A.E Stemless Glass in Glassware Market, By Type, 2019-2028 (USD Thousand)
TABLE 384 U.A.E Glassware Market, By Distribution Channel, 2019-2028 (USD Thousand)
TABLE 385 U.A.E Glassware Market, By Price Range, 2019-2028 (USD Thousand)
TABLE 386 U.A.E Glassware Market, By End-Use, 2019-2028 (USD Thousand)
TABLE 387 Saudi Arabia Glassware Market, By Material, 2019-2028 (USD Thousand)
TABLE 388 Saudi Arabia Glassware Market, By Material, 2019-2028 (Thousand Units)
TABLE 389 Saudi Arabia Glassware Market, By Style, 2019-2028 (USD Thousand)
TABLE 390 Saudi Arabia Stemware in Glassware Market, By Type, 2019-2028 (USD Thousand)
TABLE 391 Saudi Arabia Red Wine Glass in Glassware Market, By Type, 2019-2028 (USD Thousand)
TABLE 392 Saudi Arabia White Wine Glass in Glassware Market, By Type, 2019-2028 (USD Thousand)
TABLE 393 Saudi Arabia Stemless Glass in Glassware Market, By Type, 2019-2028 (USD Thousand)
TABLE 394 Saudi Arabia Glassware Market, By Distribution Channel, 2019-2028 (USD Thousand)
TABLE 395 Saudi Arabia Glassware Market, By Price Range, 2019-2028 (USD Thousand)
TABLE 396 Saudi Arabia Glassware Market, By End-Use, 2019-2028 (USD Thousand)
TABLE 397 South africa Glassware Market, By Material, 2019-2028 (USD Thousand)
TABLE 398 South africa Glassware Market, By Material, 2019-2028 (Thousand Units)
TABLE 399 South africa Glassware Market, By Style, 2019-2028 (USD Thousand)
TABLE 400 South africa Stemware in Glassware Market, By Type, 2019-2028 (USD Thousand)
TABLE 401 South africa Red Wine Glass in Glassware Market, By Type, 2019-2028 (USD Thousand)
TABLE 402 South africa White Wine Glass in Glassware Market, By Type, 2019-2028 (USD Thousand)
TABLE 403 South africa Stemless Glass in Glassware Market, By Type, 2019-2028 (USD Thousand)
TABLE 404 South africa Glassware Market, By Distribution Channel, 2019-2028 (USD Thousand)
TABLE 405 South africa Glassware Market, By Price Range, 2019-2028 (USD Thousand)
TABLE 406 South africa Glassware Market, By End-Use, 2019-2028 (USD Thousand)
TABLE 407 Egypt Glassware Market, By Material, 2019-2028 (USD Thousand)
TABLE 408 Egypt Glassware Market, By Material, 2019-2028 (Thousand Units)
TABLE 409 Egypt Glassware Market, By Style, 2019-2028 (USD Thousand)
TABLE 410 Egypt Stemware in Glassware Market, By Type, 2019-2028 (USD Thousand)
TABLE 411 Egypt Red Wine Glass in Glassware Market, By Type, 2019-2028 (USD Thousand)
TABLE 412 Egypt White Wine Glass in Glassware Market, By Type, 2019-2028 (USD Thousand)
TABLE 413 Egypt Stemless Glass in Glassware Market, By Type, 2019-2028 (USD Thousand)
TABLE 414 Egypt Glassware Market, By Distribution Channel, 2019-2028 (USD Thousand)
TABLE 415 Egypt Glassware Market, By Price Range, 2019-2028 (USD Thousand)
TABLE 416 Egypt Glassware Market, By End-Use, 2019-2028 (USD Thousand)
TABLE 417 Israel Glassware Market, By Material, 2019-2028 (USD Thousand)
TABLE 418 Israel Glassware Market, By Material, 2019-2028 (Thousand Units)
TABLE 419 Israel Glassware Market, By Style, 2019-2028 (USD Thousand)
TABLE 420 Israel Stemware in Glassware Market, By Type, 2019-2028 (USD Thousand)
TABLE 421 Israel Red Wine Glass in Glassware Market, By Type, 2019-2028 (USD Thousand)
TABLE 422 Israel White Wine Glass in Glassware Market, By Type, 2019-2028 (USD Thousand)
TABLE 423 Israel Stemless Glass in Glassware Market, By Type, 2019-2028 (USD Thousand)
TABLE 424 Israel Glassware Market, By Distribution Channel, 2019-2028 (USD Thousand)
TABLE 425 Israel Glassware Market, By Price Range, 2019-2028 (USD Thousand)
TABLE 426 Israel Glassware Market, By End-Use, 2019-2028 (USD Thousand)
TABLE 427 rest of Middle East and Africa Glassware Market, By Material, 2019-2028 (USD Thousand)
TABLE 428 rest of Middle East and Africa Glassware Market, By Material, 2019-2028 (Thousand Units)
图片列表
FIGURE 1 GLOBAL GLASSWARE MARKET: segmentation
FIGURE 2 GLOBAL GLASSWARE MARKET: data triangulation
FIGURE 3 GLOBAL GLASSWARE MARKET: DROC ANALYSIS
FIGURE 4 GLOBAL GLASSWARE MARKET: global VS regional MARKET analysis
FIGURE 5 GLOBAL GLASSWARE MARKET: company research analysis
FIGURE 6 GLOBAL GLASSWARE MARKET: THE product LIFE LINE CURVE
FIGURE 7 GLOBAL GLASSWARE MARKET: MULTIVARIATE MODELLING
FIGURE 8 GLOBAL GLASSWARE MARKET: INTERVIEW DEMOGRAPHICS
FIGURE 9 GLOBAL GLASSWARE MARKET: DBMR MARKET POSITION GRID
FIGURE 10 GLOBAL GLASSWARE MARKET: MARKET application COVERAGE GRID
FIGURE 11 GLOBAL GLASSWARE MARKET: THE MARKET CHALLENGE MATRIX
FIGURE 12 GLOBAL GLASSWARE MARKET: vendor share analysis
FIGURE 13 GLOBAL GLASSWARE MARKET: SEGMENTATION
FIGURE 14 Asia-PAcific is expected to DOMINATE THE GLOBAL GLASSWARE MARKET and IS EXPECTED TO GROW WITH THE HIGHEST CAGR IN the forecast period of 2021 to 2028
FIGURE 15 Rising popularity of fine dining across the globe is DRIVING the GLOBAL GLASSWARE MARKET in the forecast period of 2021 to 2028
FIGURE 16 soda lime glass SEGMENT is expected to account for the largest share of the GLOBAL GLASSWARE MARKET in 2021 & 2028
FIGURE 17 Asia-Pacific is the fastest growing market for GLASSWARE MARKET manufacturers in the forecast period of 2021 to 2028
FIGURE 18 DRIVERS, RESTRAINTs, OPPORTUNITies AND CHALLENGEs OF global glassware Market
FIGURE 19 Global Luxury Hotel Count, in Luxury Class, 2002-2018 (Approximate)
FIGURE 20 Global GLASSWARE market, BY material, 2020
FIGURE 21 Global GLASSWARE market,BY style, 2020
FIGURE 22 Global GLASSWARE market, BY distribution channel, 2020
FIGURE 23 Global GLASSWARE market, BY price range, 2020
FIGURE 24 Global GLASSWARE market, BY end-use, 2020
FIGURE 25 GLOBAL glassware market: SNAPSHOT (2020)
FIGURE 26 GLOBAL glassware market: by geography (2020)
FIGURE 27 GLOBAL glassware market: by geography (2021 & 2028)
FIGURE 28 GLOBAL glassware market: by geography (2020 & 2028)
FIGURE 29 GLOBAL glassware market: by material (2021-2028)
FIGURE 30 ASIA-PACIFIC Glassware market: SNAPSHOT (2020)
FIGURE 31 ASIA-PACIFIC Glassware market: by COUNTRY (2020)
FIGURE 32 ASIA-PACIFIC Glassware market: by COUNTRY (2021 & 2028)
FIGURE 33 ASIA-PACIFIC Glassware market: by COUNTRY (2020 & 2028)
FIGURE 34 ASIA-PACIFIC Glassware market: by Material (2021-2028)
FIGURE 35 EUROPE Glassware market: SNAPSHOT (2020)
FIGURE 36 EUROPE Glassware market: by COUNTRY (2020)
FIGURE 37 EUROPE Glassware market: by COUNTRY (2021 & 2028)
FIGURE 38 EUROPE Glassware market: by COUNTRY (2020 & 2028)
FIGURE 39 EUROPE Glassware market: by Material (2021-2028)
FIGURE 40 NORTH AMERICA Glassware market: SNAPSHOT (2020)
FIGURE 41 NORTH AMERICA Glassware market: by COUNTRY (2020)
FIGURE 42 NORTH AMERICA Glassware market: by COUNTRY (2021 & 2028)
FIGURE 43 NORTH AMERICA Glassware market: by COUNTRY (2020 & 2028)
FIGURE 44 NORTH AMERICA Glassware market: by material (2021-2028)
FIGURE 45 SOUTH AMERICA Glassware market: SNAPSHOT (2020)
FIGURE 46 SOUTH AMERICA Glassware market: by COUNTRY (2020)
FIGURE 47 SOUTH AMERICA Glassware market: by COUNTRY (2021 & 2028)
FIGURE 48 SOUTH AMERICA Glassware market: by COUNTRY (2020 & 2028)
FIGURE 49 SOUTH AMERICA Glassware market: by Material (2021-2028)
FIGURE 50 MIDDLE EAST AND AFRICA Glassware market: SNAPSHOT (2020)
FIGURE 51 MIDDLE EAST AND AFRICA Glassware market: by COUNTRY (2020)
FIGURE 52 MIDDLE EAST AND AFRICA Glassware market: by COUNTRY (2021 & 2028)
FIGURE 53 MIDDLE EAST AND AFRICA Glassware market: by COUNTRY (2020 & 2028)
FIGURE 54 MIDDLE EAST AND AFRICA Glassware market: by Material (2021-2028)
FIGURE 55 GLOBAL GLASSWARE MARKET: company share 2020 (%)
FIGURE 56 north AMERICA GLASSWARE MARKET: COMPANY SHARE 2020 (%)
FIGURE 57 EUROPE GLASSWARE MARKET: company share 2020 (%)
FIGURE 58 Asia-Pacific GLASSWARE MARKET: COMPANY SHARE 2020 (%)
研究方法
数据收集和基准年分析是使用具有大样本量的数据收集模块完成的。该阶段包括通过各种来源和策略获取市场信息或相关数据。它包括提前检查和规划从过去获得的所有数据。它同样包括检查不同信息源中出现的信息不一致。使用市场统计和连贯模型分析和估计市场数据。此外,市场份额分析和关键趋势分析是市场报告中的主要成功因素。要了解更多信息,请请求分析师致电或下拉您的询问。
DBMR 研究团队使用的关键研究方法是数据三角测量,其中包括数据挖掘、数据变量对市场影响的分析和主要(行业专家)验证。数据模型包括供应商定位网格、市场时间线分析、市场概览和指南、公司定位网格、专利分析、定价分析、公司市场份额分析、测量标准、全球与区域和供应商份额分析。要了解有关研究方法的更多信息,请向我们的行业专家咨询。
可定制
Data Bridge Market Research 是高级形成性研究领域的领导者。我们为向现有和新客户提供符合其目标的数据和分析而感到自豪。报告可定制,包括目标品牌的价格趋势分析、了解其他国家的市场(索取国家列表)、临床试验结果数据、文献综述、翻新市场和产品基础分析。目标竞争对手的市场分析可以从基于技术的分析到市场组合策略进行分析。我们可以按照您所需的格式和数据样式添加您需要的任意数量的竞争对手数据。我们的分析师团队还可以为您提供原始 Excel 文件数据透视表(事实手册)中的数据,或者可以帮助您根据报告中的数据集创建演示文稿。

