North America Green Bio Polyols Market
市场规模(十亿美元)
CAGR :
% 
 USD
262.80 Million
USD
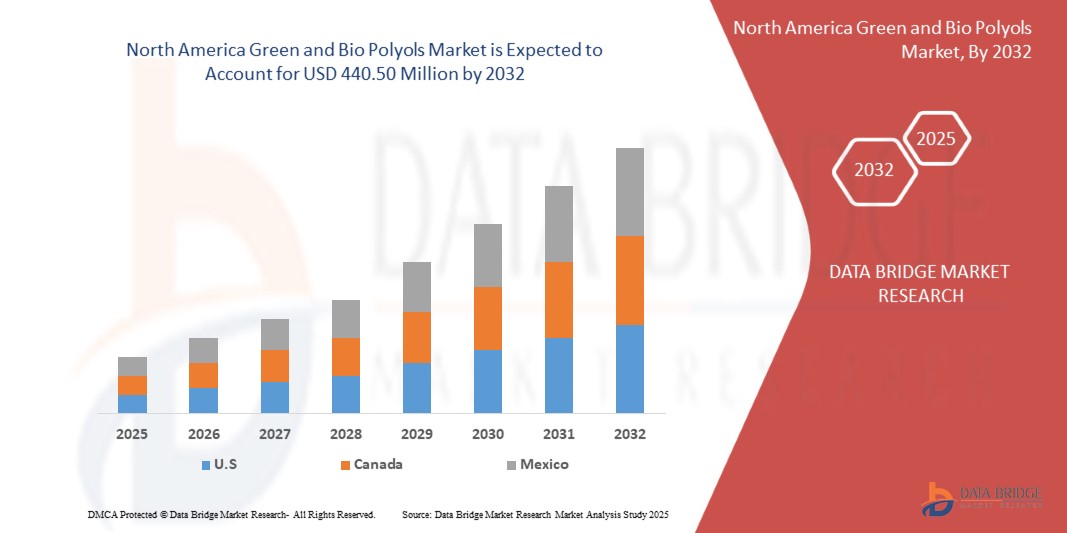
440.50 Million
2024
2032
USD
262.80 Million
USD
440.50 Million
2024
2032
| 2025 –2032 | |
| USD 262.80 Million | |
| USD 440.50 Million | |
| % | |
北美綠色和生物多元醇市場細分,按類型(聚醚多元醇和聚酯多元醇)、應用(泡沫、塗料、黏合劑、密封劑、彈性體等)– 產業趨勢和預測至 2032 年
綠色和生物多元醇市場分析
作物綠色和生物多元醇市場對運動和運動鞋等各種應用中的剛性和柔性聚氨酯的需求不斷增加,因為消費者越來越多地尋求環保替代品,以最大限度地減少環境影響,同時確保可持續的做法和更少的環境影響,從而推動全球市場成長。
綠色和生物多元醇市場規模
北美綠色和生物多元醇市場預計將從 2024 年的 2.628 億美元增至 2032 年的 4.405 億美元,在 2025 年至 2032 年的預測期內,複合年增長率將大幅增長 6.8%。除了對市場價值、成長率、細分、地理覆蓋範圍和主要參與者等市場情景的洞察外,Data Bridge Market Research 策劃的市場報告還包括深入的專家分析、定價分析、品牌份額分析、消費者調查、人口統計分析、供應鏈分析、價值鏈分析、原材料/消耗品概述、供應商選擇標準、PESTLE 分析、波特分析和監管框架。
綠色和生物多元醇市場趨勢
“可持續材料意識的提高”
北美對永續性的日益重視極大地影響了對綠色和生物基多元醇的需求,重塑了市場格局。隨著人們越來越意識到化石燃料衍生產品對環境的影響,消費者和產業都轉向永續材料。這種範式轉變催化了綠色和生物多元醇的創新和採用,這些多元醇來自植物油和再生材料等可再生資源。
建築、汽車和包裝等關鍵產業正在採用這些環保多元醇,以符合更嚴格的監管框架和不斷變化的消費者偏好。各地區政府都在推出激勵措施和強制措施來減少碳足跡,這進一步推動了對生物替代品的需求。在汽車產業,消費者對環境影響較小的汽車的偏好日益增長,推動了生物聚氨酯泡棉的採用,這種泡棉廣泛應用於座椅、內裝和絕緣材料。同樣,建築業正在利用綠色多元醇來生產節能隔熱材料,以滿足對 LEED 等綠色建築認證日益增長的需求。
此外,跨國公司也越來越多地將永續性融入其品牌策略,選擇環保原料來提升其市場聲譽。這種轉變不僅解決了企業社會責任 (CSR) 目標,而且還將這些公司定位為環保市場的創新者。此外,在教育活動和媒體報導的推動下,消費者意識的提高已將永續性從小眾關注轉變為主流市場驅動力。這種日益增強的意識正在重塑各行業的購買模式,對綠色和生物多元醇等永續解決方案產生強勁需求。
報告範圍和市場細分
|
屬性 |
綠色和生物多元醇市場關鍵市場洞察 |
|
涵蓋的領域 |
|
|
覆蓋國家 |
美國、墨西哥和加拿大 |
|
主要市場參與者 |
嘉吉公司(美國)、巴斯夫(德國)、Emery Oleochemicals(美國)、Stepan Company(美國)、萬華化學(中國)、ALBERDINGK BOLEY GmbH(德國)、BioBased Technologies(美國)和 Aurorium(美國) |
|
市場機會 |
|
|
加值資料資訊集 |
除了對市場價值、成長率、細分、地理覆蓋範圍和主要參與者等市場情景的洞察之外,Data Bridge Market Research 策劃的市場報告還包括深入的專家分析、定價分析、品牌份額分析、消費者調查、人口統計分析、供應鏈分析、價值鏈分析、原材料/消耗品概述、供應商選擇標準、PESTLE 分析、波特分析和監管框架。 |
綠色和生物多元醇市場定義
Green and bio polyols are environmentally friendly alternatives to conventional polyols used in the production of polyurethane foams, coatings, adhesives, and elastomers. These polyols are derived from renewable resources such as vegetable oils (e.g., soy, castor, or palm oil), natural sugars, or another biomass. They help reduce reliance on petroleum-based feedstock and contribute to lower greenhouse gas emissions during production. Green polyols emphasize sustainable production methods with minimal environmental impact, whereas bio polyols specifically highlight their biological or renewable origin. Both types retain comparable chemical and physical properties to traditional polyols, making them suitable for diverse industrial applications. Additionally, they support circular economy principles, with some being recyclable or biodegradable. The use of green and bio polyols aligns with growing North America demands for sustainable materials in sectors like automotive, construction, and packaging, as industries transition toward eco-friendly manufacturing solutions.
Green and Bio Polyols Market Dynamics
Drivers
- Increasing Demand for Rigid and Flexible Polyurethane in Various Applications Like Sports and Athletic Footwear
The growing demand for rigid and flexible polyurethane in diverse applications, particularly in sports and athletic footwear, is a key driver accelerating the growth of the North America green and bio polyols market. As industries increasingly prioritize sustainability, the adoption of bio-based polyols for polyurethane production is gaining momentum, especially in high-demand sectors such as footwear. In the sports and athletic footwear industry, polyurethane plays a crucial role due to its lightweight, durable, and versatile properties. Rigid polyurethanes are widely used for structural components, while flexible variants are integral in cushioning and midsole applications. With rising consumer preference for eco-friendly products, footwear manufacturers are shifting toward bio-based polyurethanes to meet market demands and align with sustainability goals. Leading sportswear brands like Adidas, Nike, and Puma are at the forefront of this transformation. For instance, Adidas’ Futurecraft. Footprint sneakers incorporate bio-based polyurethane derived from renewable materials, reflecting the brand's commitment to reducing its environmental impact. Similarly, Nike is integrating bio-polyols in its product lines to create performance footwear that balances sustainability and functionality. The market for bio-polyols is further propelled by increasing awareness among consumers regarding the environmental impact of conventional polyurethane. As customers demand greener alternatives, companies are leveraging bio-based polyols to differentiate their products and strengthen their market positioning. Additionally, the rise of athleisure as a lifestyle trend is expanding the application scope of polyurethane, driving higher production volumes of bio-based variants. The ability of green and bio polyols to reduce greenhouse gas emissions and reliance on fossil fuels aligns seamlessly with North America environmental targets, attracting investments from industry players. For Instance, Allbirds utilizes bio-based polyurethane derived from sugarcane in its footwear. The company’s SweetFoam innovation has become a benchmark in the industry for sustainable midsole production, further driving demand for green polyols
Circular Economy Focuses on Maximizing Resource Efficiency by Minimizing Waste and Promoting the Reuse
The concept of a circular economy is rapidly gaining traction across industries, and its focus on maximizing resource efficiency by minimizing waste and promoting the reuse of materials is becoming a key driver of the North America green and bio polyols market. This economic model encourages manufacturers to adopt sustainable practices, such as using renewable resources, reducing energy consumption, and recycling materials, which aligns seamlessly with the growing demand for environmentally friendly solutions in the production of polyurethane products. In a circular economy, the emphasis is on reducing the reliance on virgin, petroleum-based resources and instead utilizing bio-based alternatives, such as green and bio polyols. These renewable polyols are derived from plant-based feedstocks or waste materials, contributing to a reduction in greenhouse gas emissions and supporting sustainable production processes. This shift is particularly important in industries such as automotive, construction, and consumer goods, where the use of traditional, non-renewable materials is being increasingly scrutinized. Leading companies are embracing circular economy principles by incorporating bio-based polyols into their product offerings. For example, BASF’s PolyTHF products, used in various applications, are now produced with a focus on sustainability and renewable feedstocks, contributing to a circular economy. Likewise, Covestro’s commitment to circularity is evident in its development of polyurethanes based on recycled CO2 and bio-based polyols, reducing reliance on fossil fuels and promoting a more sustainable supply chain
Opportunities
Increased Construction Activities, Particularly in Emerging Economies
監管部門對環保產品的推動為北美綠色和生物多元醇市場創造了重大機會。隨著世界各國政府實施更嚴格的環境法規和永續發展目標,對由可再生和可生物降解材料製成的產品的需求日益增長。生物基多元醇用於生產永續泡沫、塗料和黏合劑,符合這些監管要求,為石油基產品提供了替代品。綠建築認證和節能標準進一步支持了這一轉變,鼓勵製造商在其產品中採用環保材料。因此,這些監管趨勢推動了綠色和生物多元醇市場的發展,促進了建築、汽車和包裝等各行業的創新和擴張。對環保產品的監管推動將為北美綠色和生物多元醇市場創造巨大機遇,鼓勵更永續、可再生的替代品轉型。隨著政府實施更嚴格的環境法規並設定雄心勃勃的永續發展目標,企業將被迫採用生物基和循環解決方案來滿足這些要求。這種監管轉變將促進創新,提高永續多元醇的可用性,並滿足消費者對環保產品日益增長的偏好。
監理推動環保產品
監管部門對環保產品的推動為全球綠色和生物多元醇市場創造了重大機會。隨著世界各國政府實施更嚴格的環境法規和永續發展目標,對由可再生和可生物降解材料製成的產品的需求日益增長。生物基多元醇用於生產永續泡沫、塗料和黏合劑,符合這些監管要求,為石油基產品提供了替代品。綠建築認證和節能標準進一步支持了這一轉變,鼓勵製造商在其產品中採用環保材料。因此,這些監管趨勢推動了綠色和生物多元醇市場的發展,促進了建築、汽車和包裝等各行業的創新和擴張。總之,監管部門對環保產品的推動將為全球綠色和生物多元醇市場創造巨大的機會,鼓勵向更永續、可再生的替代方案轉變。隨著政府實施更嚴格的環境法規並設定雄心勃勃的永續發展目標,企業將被迫採用生物基和循環解決方案來滿足這些要求。這種監管轉變將促進創新,提高永續多元醇的可用性,並滿足消費者對環保產品日益增長的偏好。
限制/挑戰
- 關於使用綠色和生物多元醇的嚴格規定
生物基多元醇的高生產成本仍是其在北美市場廣泛應用的關鍵限制因素。與受益於成熟、經濟高效的製造流程和完善的供應鏈的傳統多元醇不同,生物基多元醇依賴可再生原料,如植物油、農業廢棄物或其他生物質。這些原料通常涉及複雜的萃取、精煉和加工步驟,從而大大增加生產成本。成本上升的主要驅動因素之一是依賴先進技術和基礎設施將生物基原料轉化為高品質的多元醇。這些技術,包括酵素處理或發酵,需要大量的資本投資和營運支出。此外,生物基多元醇領域尚未實現規模經濟,進一步加劇了與石油基替代品之間的成本差距。原料的多變性和有限性也是造成高昂成本的原因之一。農業產量波動、季節限制以及其他使用相同生物質資源的產業的競爭等因素可能會推高原料價格。例如,常用於生物多元醇生產的大豆油或蓖麻油經常因食品和生物燃料行業的需求而面臨價格壓力。這些成本因素使得生物基多元醇對於包裝、汽車和消費品等價格敏感的產業缺乏吸引力。公司可能會猶豫是否要從傳統多元醇轉型,特別是在永續性認證無法提供顯著競爭優勢或消費者支付溢價意願有限的市場中。
- 多元醇(聚氨酯)生產的嚴格監管
對多元醇(聚氨酯)生產的嚴格規定增加了合規成本和營運複雜性,為北美綠色和生物多元醇市場帶來了重大挑戰。美國NESHAP、歐洲REACH等法規以及世界各國的法律都要求企業投資先進技術,以減少排放、確保化學品安全並滿足環境標準。這些法規通常要求對製造流程進行大量測試、記錄和調整,這可能會減慢生產速度、增加營運成本並設定市場進入障礙,特別是對於向永續和生物基生產方法過渡的公司而言。例如
美國
國家有害空氣污染物排放標準 (NESHAP) 規定新建和現有工廠設施的有害空氣污染物排放量減少約 70%,從而導致更高的合規成本和潛在的營運延遲。
歐洲
REACH (Registration, Evaluation, Authorization and Restriction of Chemicals) Comprehensive regulations requiring safety testing and documentation for chemicals, impacting the production process and increasing R&D costs for compliance.
India
Environmental Protection Act, 1986 Regulations to control pollution and ensure safe manufacturing practices, necessitating adherence to environmental safety protocols, which may increase production costs.
Impact and Current Market Scenario of Raw Material Shortage and Shipping Delays
Data Bridge Market Research offers a high-level analysis of the market and delivers information by keeping in account the impact and current market environment of raw material shortage and shipping delays. This translates into assessing strategic possibilities, creating effective action plans, and assisting businesses in making important decisions.
Apart from the standard report, we also offer in-depth analysis of the procurement level from forecasted shipping delays, distributor mapping by region, commodity analysis, production analysis, price mapping trends, sourcing, category performance analysis, supply chain risk management solutions, advanced benchmarking, and other services for procurement and strategic support.
Expected Impact of Economic Slowdown on the Pricing and Availability of Products
When economic activity slows, industries begin to suffer. The forecasted effects of the economic downturn on the pricing and accessibility of the products are taken into account in the market insight reports and intelligence services provided by DBMR. With this, our clients can typically keep one step ahead of their competitors, project their sales and revenue, and estimate their profit and loss expenditures.
North America Green and Bio Polyols Market Scope
The market is segmented on the basis of type and application. The growth amongst these segments will help you analyze meagre growth segments in the industries and provide the users with a valuable market overview and market insights to help them make strategic decisions for identifying core market applications.
Type
- Polyether Polyols
- Polyester Polyols
Application
- Foam
- Coatings
- Adhesives
- Sealants
- Elastomers
- Others
North America Green and Bio Polyols Market Regional Analysis
The market is analyzed and market size insights and trends are provided by country, type, and application as referenced above.
The countries covered in the market are U.S., Mexico, and Canada.
U.S. is dominating the North American green and bio polyols market due to its well-established industrial base and significant investments in sustainable and renewable technologies. The country has a strong presence of key players in the bio-based chemical sector, including major chemical companies that are shifting towards environmentally friendly production methods.
U.S. is expected to be the fastest-growing country in the North American green and bio polyols market due to increasing consumer demand for eco-friendly products and the rising adoption of green chemistry practices. With a growing focus on reducing carbon footprints and promoting sustainability across various industries, the demand for bio-based polyols in sectors such as construction, automotive, and packaging is expanding.
The country section of the report also provides individual market impacting factors and changes in regulation in the market domestically that impacts the current and future trends of the market. Data points like down-stream and upstream value chain analysis, technical trends and porter's five forces analysis, case studies are some of the pointers used to forecast the market scenario for individual countries. Also, the presence and availability of North America brands and their challenges faced due to large or scarce competition from local and domestic brands, impact of domestic tariffs and trade routes are considered while providing forecast analysis of the country data.
North America Green and Bio Polyols Market Share
The market competitive landscape provides details by competitors. Details included are company overview, company financials, revenue generated, market potential, investment in research and development, new market initiatives, North America presence, production sites and facilities, production capacities, company strengths and weaknesses, product launch, product width and breadth, application dominance. The above data points provided are only related to the companies' focus related to market.
Green and Bio Polyols Market Leaders Operating in the Market Are:
- Cargill, Incorporated (U.S.)
- BASF SE (Germany)
- Emery Oleochemicals (U.S.)
- Stepan Company (U.S.)
- Wanhua (China)
- ALBERDINGK BOLEY GmbH (Germany)
- BioBased Technologies (U.S.)
- Aurorium (U.S.)
Latest Developments in Green and Bio Polyols Market
- In November 2024, Krishna Enterprise and Alberdingk Boley announced their collaboration in water-based acrylic dispersions for the Indian market. Since 1985, Krishna Enterprise has provided innovative solutions in coatings, and Gaurang Goradia visited Alberdingk in October to sign the partnership agreement
- In October 2024, Cargill has been awarded the INDI 4.0 2024 Smart Factory award by Indonesia’s Ministry of Industry for successfully implementing Industry 4.0 technologies at its cocoa processing facility in Gresik. This recognition highlights Cargill’s commitment to advanced manufacturing practices, including automation, real-time data monitoring, and energy management, aimed at enhancing efficiency and sustainability
- 2023 年 7 月,Stepan 榮獲 2023 年世界金融永續發展獎,以表彰其對永續發展和環保實踐的承諾。該獎項凸顯了 Stepan 在跨產業創造創新、環保解決方案方面的努力,鞏固了其在永續商業實踐方面的領導地位
- 2024 年 6 月,特種原料製造商 Aurorium 宣布推出 Haelium Pharmaceutical Solutions,體現了對醫療保健的長期承諾。經過數十年的創新,Haelium 產品線使 Aurorium 成為北美醫藥成分領域的領導者,體現了獨特的卓越方法
- 2024 年 6 月,巴斯夫擴大了其產品組合,推出了生物質平衡 (BMB) ecoflex,這是一種經認證的可堆肥生物聚合物,適用於包裝行業。這款 ecoflexF Blend C1200 BMB 使用來自有機廢棄物的可再生原料,減少了化石資源的消耗,並降低了 60% 的碳足跡
SKU-

目录
1 引言
1.1 研究目標
1.2 市場定義
1.3 概述
1.4 限制
1.5 覆蓋市場
2 市場區隔
2.1 覆蓋市場
2.2 地理範圍
研究需時 2.3 年
2.4 貨幣和定價
2.5 DBMR三腳架資料驗證模型
2.6 多變量建模
2.7 與關鍵意見領袖的初步訪談
2.8 DBMR 市場地位網格
2.9 DBMR 供應商份額分析
2.1 市場應用覆蓋網格
2.11 第二手資料
2.12 假設
3 執行摘要
4 項優質見解
4.1 佩爾斯特分析
4.1.1 政治因素
4.1.2 經濟因素
4.1.3 社會因素
4.1.4 技術因素
4.1.5 環境因素
4.1.6 法律因素
4.1.7 結論
4.2 波特五力模型
4.2.1 新進入者的威脅
4.2.2 替代品的威脅
4.2.3 供應商的議價能力
4.2.4 購買者的議價能力
4.2.5 競爭對手
4.3 進出口情景
4.4 物價指數
4.5 生產消耗分析
4.6 供應商選擇標準
4.6.1 品質和一致性
4.6.2 技術專長
4.6.3 供應鏈可靠性
4.6.4 合規性和可持續性
4.6.5 成本和定價結構
4.6.6 金融穩定
4.6.7 靈活性和客製化性
4.6.8 風險管理與應急計劃
4.7 氣候變遷情景
4.7.1 環境問題
4.7.2 產業反應
4.7.3 政府的作用
4.7.4 分析師建議
4.8 生產能力概覽
4.8.1 當前生產能力
4.8.2 產能區域分佈
4.8.3 技術進步與創新
4.8.4 產能擴張與未來預測
4.9 原料覆蓋範圍
4.9.1 植物油
4.9.1.1 蓖麻油
4.9.1.2 大豆油
4.9.1.3 棕櫚油
4.9.2 農業殘留物和廢棄生物質
4.9.2.1 玉米秸稈
4.9.2.2 麥秸和稻殼
4.9.3 糖基原料
4.9.3.1 糖醇
4.9.4 藻類和其他新來源
4.9.4.1 藻類
4.9.5 廢油和副產品
4.9.5.1 廢棄食用油
4.9.6 結論
4.1 供應鏈分析
4.10.1 概述
4.10.2 物流成本情景
4.10.2.1 運輸成本
4.10.2.2 倉儲和庫存管理
4.10.2.3 北美供應鏈中斷
4.10.3 物流服務提供者的重要性
4.10.3.1 原料採購與運輸
4.10.3.2 物流的可持續性
4.10.3.3 北美分銷和供應鏈協調
4.10.3.4 技術整合
4.10.4 結論
4.11 製造商的技術進步
4.11.1 原料創新與原料優化
4.11.1.1 先進催化與綠色化學
4.11.1.2 原料多樣化
4.11.2 先進的生產技術
4.11.2.1 生物催化和酵素過程
4.11.2.2 綠色溶劑和無溶劑工藝
4.11.2.3 連續和流動化學
4.11.3 流程整合與能源效率
4.11.3.1 熱整合與能量回收
4.11.3.2 過程強化
4.11.4 性能和產品創新
4.11.4.1 針對特定應用的客製化生物多元醇
4.11.4.2 增強耐用性和穩定性
4.11.5 循環經濟與減廢
4.11.5.1 生物基多元醇的回收利用
4.11.5.2 零廢棄製造
4.11.6 結論
5 監理範圍
5.1 環境法規和標準
5.1.1 碳足跡和溫室氣體排放
5.1.2 永續性和生物降解性
5.1.3 REACH和化學品安全法規
5.2 原料採購及農業法規
5.2.1 原料的永續採購
5.2.2 農業環境法規
5.2.3 可追溯性和認證
5.3 產品安全和法規合規性
5.3.1 安全和毒性法規
5.3.2 可燃性標準
5.4 循環經濟與廢棄物管理法規
5.4.1 生產者延伸責任(EPR)
5.4.2 塑膠廢棄物和包裝法規
5.5 區域法規和標準
5.6 結論
6 市場概覽
6.1 驅動程式
6.1.1 永續材料意識的不斷提高
6.1.2 體育和運動鞋等各種應用對硬質和軟質聚氨酯的需求不斷增加
6.1.3 循環經濟注重透過減少浪費和促進再利用來最大限度地提高資源效率
6.2 限制
6.2.1 與傳統多元醇相比的性能限制
6.2.2 生物基多元醇生產成本高
6.3 機遇
6.3.1 建築活動增加,尤其是在新興經濟體
6.3.2 加強環保產品監管
6.3.3 生產技術進步
6.4 挑戰
6.4.1 多元醇(聚氨酯)生產的嚴格監管
7 北美綠色和生物多元醇市場(按類型)
7.1 概述
7.2 聚醚多元醇
7.3 聚酯多元醇
8 北美綠色和生物多元醇市場(按應用)
8.1 概述
8.2 泡沫
8.3 塗層
8.4 黏合劑
8.5 密封劑
8.6 彈性體
8.7 其他
9 北美綠色和生物多元醇市場(按地區)
9.1 北美
9.1.1 美國
9.1.2 加拿大
9.1.3 墨西哥
10 北美綠色與生物多元醇市場:公司格局
10.1 公司份額分析:北美
11 SWOT分析
12 公司簡介
12.1 嘉吉公司
12.1.1 公司概況
12.1.2 公司股份分析
12.1.3 產品組合
12.1.4 最近的發展
12.2 巴斯夫
12.2.1 公司概況
12.2.2 收入分析
12.2.3 公司股份分析
12.2.4 產品組合
12.2.5 最近的發展
12.3 金剛砂油脂化學品
12.3.1 公司概況
12.3.2 公司股份分析
12.3.3 產品組合
12.3.4 最近的發展
12.4 史蒂芬公司
12.4.1 公司概況
12.4.2 收入分析
12.4.3 公司股份分析
12.4.4 產品組合
12.4.5 最近的發展
12.5 POLYLABS TM。
12.5.1 公司概況
12.5.2 公司股份分析
12.5.3 產品組合
12.5.4 最近的發展
12.6 阿爾伯丁克‧博利有限公司
12.6.1 公司概況
12.6.2 產品組合
12.6.3 最近的發展
12.7 金盒子
12.7.1 公司概況
12.7.2 產品組合
12.7.3 最近的發展
12.8 生物基技術
12.8.1 公司概況
12.8.2 產品組合
12.8.3 最近的發展
12.9 WANHUA
12.9.1 公司概況
12.9.2 收入分析
12.9.3 產品組合
12.9.4 最近的發展
13 問卷
14份相關報告
表格列表
表 1 各國針對多元醇(聚氨酯)所生產的規定
表 2 2018-2032 年北美綠色與生物多元醇市場(按類型劃分)(千美元)
表 3 2018-2032 年北美綠色和生物多元醇市場(按類型劃分)(千噸)
表4 2018-2032年北美綠色與生物多元醇市場中聚醚多元醇的細分市場(千美元)
表5 2018-2032年北美綠色和生物多元醇市場中的聚醚多元醇(按類別劃分)(千美元)
表 6 2018-2032 年北美綠色與生物多元醇市場中的聚酯多元醇(細分) (千美元)
表7 2018-2032年北美綠色和生物多元醇市場中的聚酯多元醇(按類別劃分)(千美元)
表 8 北美綠色和生物多元醇市場,按應用,2018-2032(千美元)
表 9 2018-2032 年北美綠色與生物多元醇泡棉市場(細分市場) (千美元)
表 10 北美綠色和生物多元醇市場,按國家/地區,2018-2032(千美元)
表 11 2018-2032 年北美綠色和生物多元醇市場(按國家/地區劃分)(千噸)
表 12 北美綠色和生物多元醇市場,按類型,2018-2032(千美元)
表 13 2018-2032 年北美綠色與生物多元醇市場(按類型)(千噸)
表14 北美綠色和生物多元醇市場中的聚醚多元醇,按細分,2018-2032(千美元)
表15 2018-2032年北美綠色和生物多元醇市場中的聚醚多元醇(按類別劃分)(千美元)
表16 2018-2032年北美綠色與生物多元醇市場中的聚酯多元醇(細分)(千美元)
表17 2018-2032年北美綠色和生物多元醇市場中的聚酯多元醇(按類別劃分)(千美元)
表 18 北美綠色和生物多元醇市場,按應用,2018-2032(千美元)
表19 北美綠色與生物多元醇市場中聚酯多元醇泡沫,依細分,2018-2032(千美元)
表 20 美國綠色和生物多元醇市場,按類型,2018-2032(千美元)
表 21 美國綠色與生物多元醇市場,依類型,2018-2032(千噸)
表22 美國綠色與生物多元醇市場中的聚醚多元醇,依細分,2018-2032(千美元)
表23 美國綠色與生物多元醇市場中的聚醚多元醇,依類別,2018-2032(千美元)
表24 美國綠色和生物多元醇市場中的聚酯多元醇,按細分,2018-2032(千美元)
表25 美國綠色與生物多元醇市場中的聚酯多元醇,依類別,2018-2032(千美元)
表26 美國綠色和生物多元醇市場,按應用,2018-2032(千美元)
表27 美國綠色和生物多元醇市場中的聚酯多元醇泡沫,按細分,2018-2032(千美元)
表28 加拿大綠色和生物多元醇市場,按類型,2018-2032(千美元)
表29 加拿大綠色與生物多元醇市場,依類型,2018-2032(千噸)
表30 加拿大綠色和生物多元醇市場中的聚醚多元醇,按細分,2018-2032(千美元)
表31 加拿大綠色和生物多元醇市場中的聚醚多元醇,按類別,2018-2032(千美元)
表32 加拿大綠色和生物多元醇市場中的聚酯多元醇,按細分,2018-2032(千美元)
表33 加拿大綠色和生物多元醇市場中的聚酯多元醇,按類別,2018-2032(千美元)
表 34 加拿大綠色和生物多元醇市場,按應用,2018-2032(千美元)
表35 加拿大綠色和生物多元醇市場中的聚酯多元醇泡沫,按細分,2018-2032(千美元)
表 36 墨西哥綠色和生物多元醇市場,按類型,2018-2032(千美元)
表 37 墨西哥綠色和生物多元醇市場,按類型,2018-2032(千噸)
表38 墨西哥綠色和生物多元醇市場中的聚醚多元醇,按細分,2018-2032(千美元)
表39 墨西哥綠色和生物多元醇市場中的聚醚多元醇,依類別,2018-2032(千美元)
表40 墨西哥綠色和生物多元醇市場中的聚酯多元醇,按細分,2018-2032(千美元)
表41 墨西哥綠色和生物多元醇市場中的聚酯多元醇,依類別,2018-2032(千美元)
表42墨西哥綠色和生物多元醇市場,按應用,2018-2032(千美元)
表43 墨西哥泡沫聚酯多元醇在綠色和生物多元醇市場的應用,按細分,2018-2032(千美元)
图片列表
圖 1 北美綠色與生物多元醇市場
圖 2 北美綠色與生物多元醇市場:數據三角測量
圖 3 北美綠色與生物多元醇市場:DROC 分析
圖 4 北美綠色與生物多元醇市場:北美與區域市場分析
圖5 北美綠色與生物多元醇市場:公司研究分析
圖 6 北美綠色與生物多元醇市場:多變量建模
圖 7 北美綠色與生物多元醇市場:訪談人口統計
圖 8 北美綠色與生物多元醇市場:DBMR 市場地位網格
圖9 北美綠色和生物多元醇市場:供應商份額分析
圖 10 北美綠色和生物多元醇市場:應用覆蓋範圍
圖 11 北美綠色與生物多元醇市場:細分
圖 12 北美綠色和生物多元醇市場(按類型),2024 年
圖13 北美綠色與生物多元醇市場執行摘要
圖 14 戰略決策
圖 15 預計可持續材料意識的提高將在預測期內推動北美綠色和生物多元醇市場的發展
圖 16 預計聚醚多元醇將在 2025 年和 2032 年佔據北美綠色和生物多元醇市場的最大份額
圖 17 PESTEL 分析
圖 18 波特五力模型
圖 19 進出口情境(千美元)
圖20 北美綠色與生物多元醇市場,2023-2032,平均售價(美元/噸)
圖21 生產消費分析
圖 22 供應商選擇標準
圖 23 北美綠色和生物多元醇市場的驅動因素、限制因素、機會和挑戰
圖24 印度國家公路總長度(公里)(2014-2023)
圖 25 印度機場數量(2014-2024)
圖 26 北美綠色與生物多元醇市場:依類型,2024 年
圖 27 北美綠色與生物多元醇市場:依應用,2024 年
圖 28 北美綠色與生物多元醇市場:快照(2024 年)
圖29 北美綠色和生物多元醇市場:2024年公司佔有率(%)
研究方法
数据收集和基准年分析是使用具有大样本量的数据收集模块完成的。该阶段包括通过各种来源和策略获取市场信息或相关数据。它包括提前检查和规划从过去获得的所有数据。它同样包括检查不同信息源中出现的信息不一致。使用市场统计和连贯模型分析和估计市场数据。此外,市场份额分析和关键趋势分析是市场报告中的主要成功因素。要了解更多信息,请请求分析师致电或下拉您的询问。
DBMR 研究团队使用的关键研究方法是数据三角测量,其中包括数据挖掘、数据变量对市场影响的分析和主要(行业专家)验证。数据模型包括供应商定位网格、市场时间线分析、市场概览和指南、公司定位网格、专利分析、定价分析、公司市场份额分析、测量标准、全球与区域和供应商份额分析。要了解有关研究方法的更多信息,请向我们的行业专家咨询。
可定制
Data Bridge Market Research 是高级形成性研究领域的领导者。我们为向现有和新客户提供符合其目标的数据和分析而感到自豪。报告可定制,包括目标品牌的价格趋势分析、了解其他国家的市场(索取国家列表)、临床试验结果数据、文献综述、翻新市场和产品基础分析。目标竞争对手的市场分析可以从基于技术的分析到市场组合策略进行分析。我们可以按照您所需的格式和数据样式添加您需要的任意数量的竞争对手数据。我们的分析师团队还可以为您提供原始 Excel 文件数据透视表(事实手册)中的数据,或者可以帮助您根据报告中的数据集创建演示文稿。

