Kenya Uganda Tanzania And Rwanda Potato Processing Market
Marktgröße in Milliarden USD
CAGR :
% 
 USD
553.15 Million
USD
720.84 Million
2023
2034
USD
553.15 Million
USD
720.84 Million
2023
2034
| 2024 –2034 | |
| USD 553.15 Million | |
| USD 720.84 Million | |
| % | |
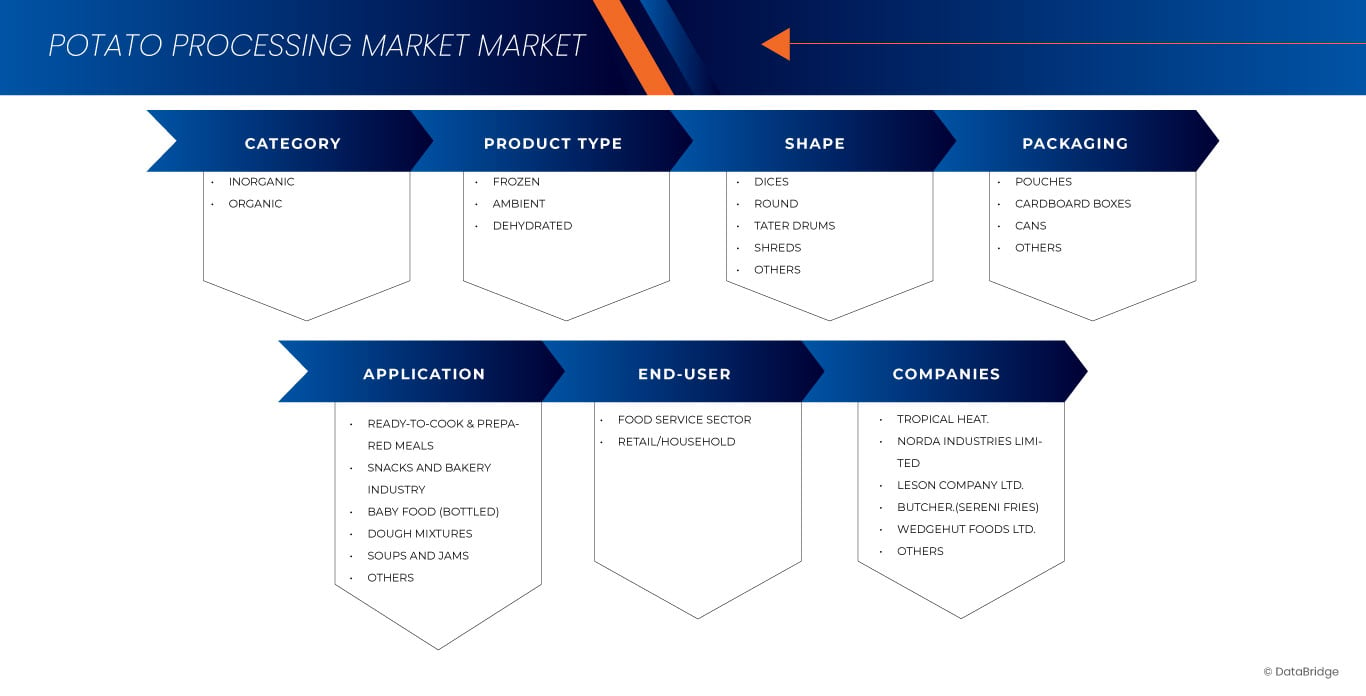
Kenya, Uganda, Tanzania, and Rwanda Potato Processing Market, By Category (Inorganic and Organic), Product Type (Frozen, Ambient, and Dehydrated), Shape (Dices, Round, Tater Drums, Shreds, and Others), Packaging (Pouches, Cardboard Boxes, Cans and Others), By Application (Ready-To-Cook & Prepared Meals, Snacks and Bakery Industry, Baby Food (Bottled), Dough Mixtures, Soups and Jams, and Others), End User (Food Service Sector and Retail/Household) – Industry Trends and Forecast to 2034.
Potato Processing Market Analysis
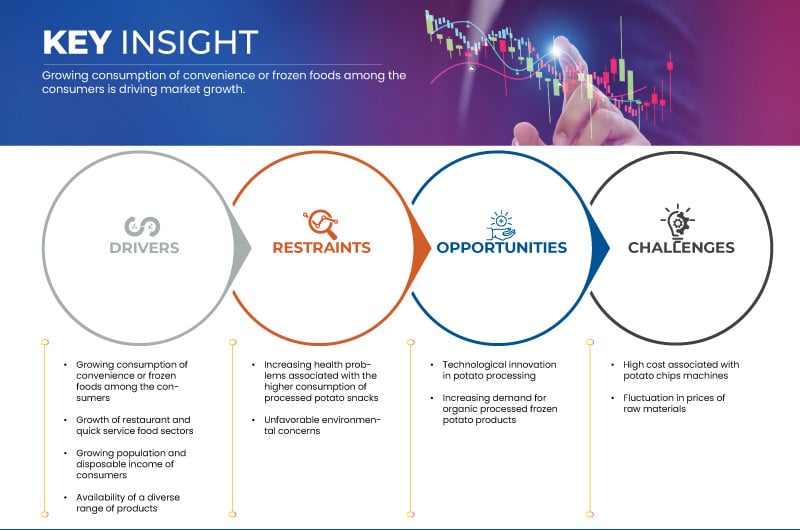
Growing consumption of conveniene or frozen foods among the consumers and growing popularity of restaurant and quick service food sectors is driving the market growth.Technological innovation in potato processing and increasing demand for organic processed frozen potato products provodes opportunities in the market.Moreover, availability of a diverse range of products driving market growth.
Potato Processing Market Size
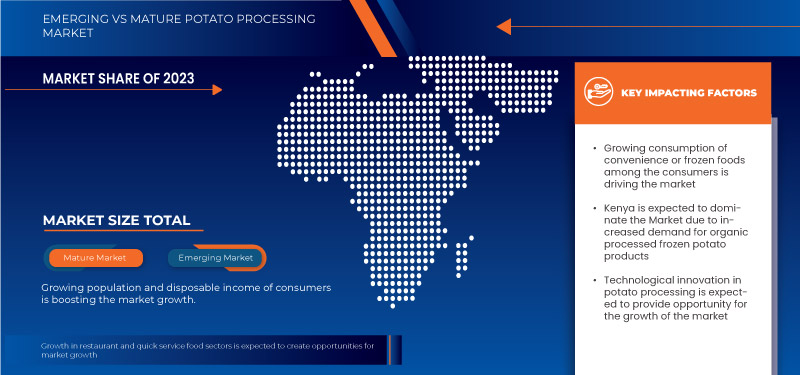
The Kenya, Uganda, Tanzania, and Rwanda potato processing market is expected to reach USD 720.84 million by 2034 from USD 553.15 million in 2023, growing with a substantial CAGR of 2.5% in the forecast period of 2024 to 2034.
Potato Processing Market Trends
“Growing Consumption of Convenience or Frozen Foods among the Consumers”
There is an increasing trend in the demand for convenience or frozen foods. Numerous factors have contributed to the rise in demand for frozen or convenient potato products. First of all, as a result of busier lifestyles, people now need quick and simple meal options. The products made from frozen potatoes provide a fast and easy solution. Additionally, frozen potato products have a longer shelf life than fresh potato products, which makes them a sensible choice for customers who want to stock up on essentials.
Moreover, because frozen potato products are adaptable and can be used in a variety of dishes, from sides to main courses, both home cooks and food service providers favor them. Furthermore, the cost of frozen potato products is frequently lower than that of fresh potatoes, which is another important consideration for people trying to cut costs on groceries. Overall, the rising demand for frozen potato products is being driven by a combination of convenience, usefulness, versatility, and affordability.
Report Scope and Potato Processing Market Segmentation
|
Attributes |
Potato Processing Key Market Insights |
|
Segmentation |
|
|
Countries Covered |
Kenya, Uganda, Rwanda, Tanzania |
|
Key Market Players |
Tropical Heat.(Kenya), Norda Industries Limited (Kenya), Leson Company Ltd (Tanzania), Butcher (Kenya), Wedgehut Foods Ltd (Kenya), and Hollanda FairFoods LTD (Rwanda) |
|
Market Opportunities |
|
|
Value Added Data Infosets |
In addition to the insights on market scenarios such as market value, growth rate, segmentation, geographical coverage, and major players, the market reports curated by the Data Bridge Market Research also include in-depth expert analysis, pricing analysis, brand share analysis, consumer survey, demography analysis, supply chain analysis, value chain analysis, raw material/consumables overview, vendor selection criteria, PESTLE Analysis, Porter Analysis, and regulatory framework. |
Potato Processing Market Definition
Potato processing involves a multitude of techniques to achieve desired end products. This process is typically carried out in specialized potato processing plants that are equipped with various tools and equipment. The typical steps involved in the production of French fries, chips, flakes, and starch include cleaning, peeling, and washing, slicing, and blanching of fresh potatoes. Processed potato products are used by households, fast food chains, and restaurants as they are already partially prepared, which reduces the time required to prepare dishes such as French fries, soups, salads, and potato snacks. Processed potato is used in a variety of applications by many end-user industries, including snack industry, ready to cook foods industry, bakery, and foodservice industry among others.
Potato Processing Market Dynamics
Drivers
- Growing consumption of convenience or frozen foods among the consumers
There is an increasing trend in the demand for convenience or frozen foods. Numerous factors have contributed to the rise in demand for frozen or convenient potato products. First of all, as a result of busier lifestyles, people now need quick and simple meal options. The products made from frozen potatoes provide a fast and easy solution. Additionally, frozen potato products have a longer shelf life than fresh potato products, which makes them a sensible choice for customers who want to stock up on essentials.Moreover, because frozen potato products are adaptable and can be used in a variety of dishes, from sides to main courses, both home cooks and food service providers favor them. Furthermore, the cost of frozen potato products is frequently lower than that of fresh potatoes, which is another important consideration for people trying to cut costs on groceries. Overall, the rising demand for frozen potato products is being driven by a combination of convenience, usefulness, versatility, and affordability.
For instance,
- In 2021, according to an article published on Researchgate, over the past 50 years, African consumers have increasingly purchased processed food. This trend has accelerated in recent decades due to a surge in the supply side of the processing sector, with Small and Medium Enterprises (SMEs) and large private companies making significant investments. Packaged, industrialized, ultra-processed foods and sugar-sweetened beverages (SSBs) now constitute a growing proportion of the processed food consumed
The increasing demand for convenience and frozen potato products is driven by the need for quick, easy, and versatile meal options amidst busier lifestyles. The extended shelf life, affordability, and adaptability of frozen potatoes further contribute to their growing popularity.
- Growth of restaurant and quick service food sectors
The expansion of the Kenya, Uganda, Tanzania, and Rwanda potato processing market has been significantly fuelled by the expansion of the restaurant and quick service food industries. The demand for foods made from potatoes has increased as more people around the world look for quick, tasty, and affordable meal options. Fast food restaurants and other food service providers frequently choose potatoes because they are a versatile and affordable ingredient. In order to meet this expanding demand, potato processing businesses have been expanding their operations, opening up new scope for farmers, processors, and other players in the East African food industry.
The expansion of the quick-service food and restaurant industries has had a significant impact on the potato processing market. The demand for potato-based goods like French fries, hash browns, and mashed potatoes has increased as fast food restaurants and other food service providers continue to broaden their menus and provide more options. Additionally, the growth of fast-casual dining has given the potato processing industry more opportunities because it offers better food at a marginally higher price point than traditional fast food. Due to this trend, upscale fast-casual restaurants are increasingly serving specialty potato products like gourmet fries and other specialty potato products. Overall, it is anticipated that the expansion of the restaurant and quick-service food industries will continue to fuel demand for products used in the processing of potatoes, opening up a new business scope for those involved in the sector in the coming years.
For instance,
- According to a report by Glovo, the food services market in Kenya has seen significant growth, with a 160% rise in local food orders compared to 2021, reflecting an increasing preference for ordering food from kibandas and local street food shops
Hence, the market for potato processing has been significantly impacted by the expansion of the restaurant and quick-service food industries. The industry has grown as a result of the rising demand for quick, tasty, and affordable meal options, opening up new business opportunities for growers, processors, and other participants in the food supply chain. Additionally, new and inventive products can now be created by potato processing companies thanks to advancements in processing technology, which has increased demand. The quick service and restaurant food industries' ongoing expansion, along with ongoing innovations in potato processing, bode well for the future growth of the potato processing market.
Opportunities
- Technological innovation in potato processing
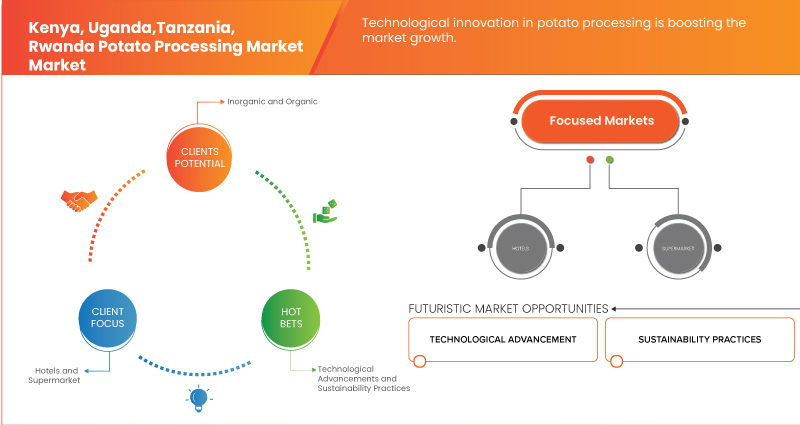
Technological innovation presents a significant opportunity for the potato processing market in Kenya, Rwanda, and Tanzania, offering transformative potential for productivity, efficiency, and market growth. As the potato industry in these regions evolves, advanced technologies can address existing challenges and unlock new avenues for development. One of the primary benefits of technological innovation is enhanced processing efficiency. Modern processing equipment, such as high-performance peelers, slicers, and fryers, can significantly improve the speed and quality of potato processing. Automation technologies, including robotic systems for sorting and packaging, reduce manual labor and increase production capacity. These advancements enable processors to meet the growing demand for potato products while maintaining consistent quality and reducing operational costs. For instance, automated systems can handle larger volumes of potatoes with precision, ensuring uniformity in processed products like chips and fries and minimizing waste.
Technological advancements also play a crucial role in sustainability. Energy-efficient processing equipment and waste reduction technologies contribute to more environmentally friendly operations. For example, innovations in energy recovery systems and water recycling technologies can significantly reduce the environmental footprint of potato processing. These sustainable practices not only align with the trends towards greener production but also appeal to increasingly eco-conscious consumers. By adopting such technologies, processors in Kenya, Rwanda, and Tanzania can enhance their market competitiveness and appeal to international buyers who prioritize sustainability.
For instance,
- According to a blog published on Potato Business, modern potato processors use data from intelligent machines to improve production yields and ensure consistent product quality. Sensors placed at critical points, such as before packaging or after freezing, continuously collect data to monitor process parameters. This data is shared across the production line, allowing for seamless integration and better control of the entire process
Thus, the potato processing markets are significantly impacted by technological advancements because they enable manufacturers to operate more effectively, save money, and seize new opportunities. The development of automation, robotics, and digital technologies has allowed the processing of potatoes to be more efficient, reduce energy use, and enhance product quality.
- Increasing demand for organic processed frozen potato products
The growing consumer preference for organic and natural foods has significantly increased demand for organic frozen potato products in recent years in African countries like Kenya, Rwanda, and others. Products made from organic frozen potatoes are made from potatoes that were grown without the use of artificial fertilizers, pesticides, or GMOs. Compared to traditional frozen potato products, these products have a number of advantages, such as a lower risk of chemical exposure, improved environmental sustainability, and higher nutritional value. Consumers can feel confident in the quality and safety of the products they are buying because the organic certification process makes sure that the production process abides by strict standards. The demand for organic frozen potato products is likely to increase as consumers continue to look for healthier and more organic food options. This will present producers with opportunities to diversify their product lines and take advantage of this expanding market.
Many producers are now providing a wide variety of organic options to meet this market segment's growing demand for organic frozen potato products. These goods consist of frozen potatoes in various forms, such as organic tater tots, hash browns, and French fries. To meet a broader range of consumer preferences, some manufacturers have even gone a step further by providing non-GMO and gluten-free options. To satisfy the demands of environmentally conscious consumers, many manufacturers are also implementing sustainable production techniques, such as using renewable energy sources and cutting waste.
For instance,
- In Kenya, there is a notable increase in the demand for organic potato products, driven by a growing awareness of healthy eating. This shift is evident in the rise of organic markets and restaurants, such as the Bridges Organic Restaurant in Nairobi. Sales and marketing manager Suzanne Gathitu highlights that the restaurant sources its potatoes exclusively from certified organic farmers, ensuring that the produce is free from pesticides, chemicals, and GMOs. This growing demand for organic options reflects a broader trend toward healthier lifestyles and the need for safe, chemical-free food
Thus, the rising consumer demand for organic and natural foods is significantly boosting the market for organic frozen potato products in African countries like Kenya and Rwanda. These products offer advantages such as reduced chemical exposure, improved environmental sustainability, and higher nutritional value. As consumer preferences increasingly favor healthier, organic options, producers are diversifying their offerings to include various forms of organic frozen potatoes and incorporating sustainable practices. This trend not only meets the growing demand but also presents opportunities for market expansion and innovation in the organic food sector.
Restraints/Challenges
- Increasing health problems associated with the higher consumption of processed potato snacks
Potatoes are an incredibly versatile root vegetable consumed in a variety of dishes all around the world. However, Potatoes in the processed form are typically categorized as high-fat and sodium foods. High acrylamide levels are present in processed potato snacks due to the use of high heat in processing and frying potatoes, which makes them unhealthier for human health. High glycemic index makes them unfit for diabetic patients as they immediately spike their blood sugar levels.
The side effects associated with health due to these processed potato snacks are listed below-
- Excess consumption of processed potato snacks can raise blood pressure
- Potato chips can increase the chances of heart disease
- Potato snacks can increase the risk of stroke
- It can cause intense weight gain
- High GI makes them spike the blood sugar level
- Higher intake of processed potato snacks elevates levels of triglycerides and total cholesterol levels
Thus, the side effects such as weight gain and obesity are increasing day by day owing to increased consumption of potato chips and snacks, which may restrain the growth of the market.
For instance,
- In 2024, according to an article published in The New Times, a recent study by the Rwanda Biomedical Centre (RBC) reveals a rise in obesity among Rwandans. The prevalence of overweight individuals increased from 14 percent in 2013 to 18.6 percent in 2022. The study, which surveyed 5,676 people across all provinces, highlighted that the rate of overweight women rose significantly from 19 percent to 26 percent, while overweight men saw a modest increase from 9 percent to 11.5 percent
Thus, the high intake of processed potato snacks may increase cholesterol levels, which may result in heart risks. Therefore, the increased awareness about the side effects of processed potato snacks among consumers may restrain the growth of the market.
- Unfavorable environmental concerns
Potato cultivation in Kenya, Rwanda, and Tanzania faces significant environmental challenges that constrain the growth of the potato processing market in these regions. These ecological concerns impact not only the agricultural practices but also the broader potato supply chain, affecting the market dynamics for processed potato products.
Ein großes Umweltproblem ist der übermäßige Einsatz chemischer Düngemittel und Pestizide. Um die Erträge zu steigern und Schädlinge und Krankheiten zu bekämpfen, verlassen sich viele Kartoffelbauern stark auf diese Chemikalien. Übermäßiger Einsatz führt jedoch zu Bodenerosion, verringerter Bodenfruchtbarkeit und Verunreinigung von Wasserquellen. Diese Umweltbelastung kann zu Kartoffeln minderer Qualität und höheren Produktionskosten führen, was sich letztlich auf die Konsistenz und den Preis der für die Verarbeitung verfügbaren Rohstoffe auswirkt. Da der Markt für verarbeitete Kartoffelprodukte wächst, wird die Nachhaltigkeit des Kartoffelanbaus immer wichtiger. Die langfristige Rentabilität der Kartoffelproduktion wird durch Bodenerosion bedroht, die die Ernteerträge und -qualität verringern und damit die Versorgung mit Rohkartoffeln zur Verarbeitung beeinträchtigen kann.
Zum Beispiel,
- Laut einem Artikel, der 2017 auf der Website der Weltbankgruppe in Tansania veröffentlicht wurde, wirkte sich Wasserknappheit zunehmend auf landwirtschaftliche Praktiken aus, darunter auch auf den Kartoffelanbau. Obwohl das Land über eine Vielzahl von Süßwasserseen und Flüssen verfügt, haben das schnelle Bevölkerungswachstum und die wirtschaftliche Expansion den pro Kopf verfügbaren erneuerbaren Süßwasservorrat von über 3.000 m³ auf etwa 1.600 m³ reduziert. Dieser Rückgang hat zu schwerem Wasserstress geführt, der sich insbesondere am Großen Ruaha-Fluss zeigt, der nun mehrere Monate im Jahr trocken ist. Die Hauptursache ist die Ausweitung der informellen Bewässerung flussaufwärts, die zwar den einzelnen Landwirten wirtschaftliche Vorteile bietet, aber zu einer nicht nachhaltigen Wassernutzung beigetragen hat.
Somit waren die Wetterschwankungen und die spezifischen Temperaturansprüche der Kartoffeln ein Grund für die verringerte Kartoffelproduktion in der gesamten Region, was sich letztlich auf den Markt auswirkt und somit das Marktwachstum in der afrikanischen Region erheblich bremst.
Dieser Marktbericht enthält Einzelheiten zu neuen Entwicklungen, Handelsvorschriften, Import-Export-Analysen, Produktionsanalysen, Wertschöpfungskettenoptimierungen, Marktanteilen, Auswirkungen inländischer und lokaler Marktteilnehmer, analysiert Chancen in Bezug auf neue Einnahmequellen, Änderungen der Marktvorschriften, strategische Marktwachstumsanalysen, Marktgröße, Kategoriemarktwachstum, Anwendungsnischen und -dominanz, Produktzulassungen, Produkteinführungen, geografische Expansionen und technologische Innovationen auf dem Markt. Um weitere Informationen zum Markt zu erhalten, wenden Sie sich an Data Bridge Market Research, um einen Analystenbericht zu erhalten. Unser Team hilft Ihnen dabei, eine fundierte Marktentscheidung zu treffen, um Marktwachstum zu erzielen.
Auswirkungen von Rohstoffknappheit und Lieferverzögerungen und aktuelles Marktszenario
Data Bridge Market Research bietet eine umfassende Marktanalyse und liefert Informationen, indem es die Auswirkungen und das aktuelle Marktumfeld von Rohstoffknappheit und Lieferverzögerungen berücksichtigt. Dies bedeutet, dass strategische Möglichkeiten bewertet, wirksame Aktionspläne erstellt und Unternehmen bei wichtigen Entscheidungen unterstützt werden.
Neben dem Standardbericht bieten wir auch detaillierte Analysen des Beschaffungsniveaus anhand prognostizierter Lieferverzögerungen, Händlerzuordnung nach Regionen, Warenanalysen, Produktionsanalysen, Preiszuordnungstrends, Beschaffung, Kategorieleistungsanalysen, Lösungen zum Lieferkettenrisikomanagement, erweitertes Benchmarking und andere Dienste für Beschaffung und strategische Unterstützung.
Erwartete Auswirkungen der Konjunkturabschwächung auf die Preisgestaltung und Verfügbarkeit von Produkten
Wenn die Wirtschaftstätigkeit nachlässt, leiden auch die Branchen darunter. Die prognostizierten Auswirkungen des Konjunkturabschwungs auf die Preisgestaltung und Verfügbarkeit der Produkte werden in den von DBMR bereitgestellten Markteinblickberichten und Informationsdiensten berücksichtigt. Damit sind unsere Kunden ihren Konkurrenten in der Regel immer einen Schritt voraus, können ihre Umsätze und Erträge prognostizieren und ihre Gewinn- und Verlustaufwendungen abschätzen.
Marktumfang für die Kartoffelverarbeitung
Der Markt ist in sechs wichtige Segmente unterteilt, basierend auf Kategorie, Produkttyp, Form, Verpackung, Anwendung und Endbenutzer. Das Wachstum dieser Segmente hilft Ihnen bei der Analyse schwacher Wachstumssegmente in den Branchen und bietet den Benutzern einen wertvollen Marktüberblick und Markteinblicke, die ihnen dabei helfen, strategische Entscheidungen zur Identifizierung der wichtigsten Marktanwendungen zu treffen.
Kategorie
- Anorganisch
- Organisch
Produkttyp
- Gefroren
- Tiefgekühlt, nach Produkttyp
- Tiefgekühlte Pommes Frites
- Tiefgekühlt, nach Produkttyp
- Fettarme Pommes Frites
- Süßkartoffelpommes
- Sonstiges
- Tiefgekühlte Pommes Frites, nach Typ
- Gerade geschnittene Pommes
- Curly geschnittene Pommes
- Crinkle-Pommes
- Sonstiges
- Tiefgekühlte Pommes Frites
- Kartoffelspezialitäten
- Kartoffelspezialitäten, von Cut Specialties
- Keile
- Scheiben
- Bratkartoffeln
- Sonstiges
- Kartoffelspezialitäten, von Mash Specialties
- Normales Püree
- Kartoffelkroketten
- Noissettes
- Herzoginnen
- Sonstiges
- Kartoffelspezialitäten von Shredded Specialties
- Rösti
- Kartoffelrösti
- Kartoffelpuffer
- Sonstiges
- Kartoffelspezialitäten, von Cut Specialties
- Umgebung
- Umgebungstemperatur, nach Produkttyp
- Chips
- Flocken
- Sonstiges
- Umgebungstemperatur, nach Produkttyp
- Tiefgekühlt, nach Produkttyp
- Dehydriert, nach Produkttyp
- Dehydriert, nach Produkttyp
- Kartoffelgranulat
- Stärke
- Dehydriert, nach Produkttyp
- Sonstiges
Form
- Würfel
- Runden
- Tater Drums
- Fetzen
- Sonstiges
Verpackung
- Beutel
- Kartons
- Dosen
- Sonstiges
Anwendung
- Kochfertiggerichte & Fertiggerichte
- Snack- und Backwarenindustrie
- Babynahrung (Flaschennahrung)
- Teigmischungen
- Suppen und Marmeladen
- Sonstiges
Endbenutzer
- Gastronomie
- Gastronomiesektor, nach Endverbraucher
- Restaurant
- Restaurant, nach Typ
- Restaurantkette
- Unabhängiges Restaurant
- Restaurant, nach Servicekategorie
- Schnellrestaurants
- Full-Service-Restaurants
- Restaurant, nach Typ
- Hotel
- Cafe
- Bars und Clubs
- Gastronomie
- Sonstiges
- Restaurant
- Gastronomiesektor, nach Endverbraucher
Regionale Analyse des Kartoffelverarbeitungsmarktes
Der Markt wird analysiert und es werden Einblicke in die Marktgröße und Trends nach Kategorie, Produkttyp, Form, Verpackung, Anwendung und Endbenutzer wie oben angegeben bereitgestellt.
Die vom Markt abgedeckten Länder sind Kenia, Tansania, Ruanda und Uganda.
Kenia wird voraussichtlich den Markt für Kartoffelverarbeitung dominieren, da das Land über eine gut ausgebaute Infrastruktur und moderne Verarbeitungstechnologie verfügt. Auch höhere Investitionen in diesem Sektor im Vergleich zu anderen ostafrikanischen Ländern dürften das Marktwachstum weiter ankurbeln.
Der Länderabschnitt des Berichts enthält auch Angaben zu einzelnen marktbeeinflussenden Faktoren und Änderungen der Regulierung auf dem Inlandsmarkt, die sich auf die aktuellen und zukünftigen Trends des Marktes auswirken. Datenpunkte wie Downstream- und Upstream-Wertschöpfungskettenanalysen, technische Trends und Porters Fünf-Kräfte-Analyse sowie Fallstudien sind einige der Anhaltspunkte, die zur Prognose des Marktszenarios für einzelne Länder verwendet werden. Bei der Bereitstellung von Prognoseanalysen der Länderdaten werden auch die Präsenz und Verfügbarkeit regionaler Marken und ihre Herausforderungen aufgrund großer oder geringer Konkurrenz durch lokale und inländische Marken sowie die Auswirkungen inländischer Zölle und Handelsrouten berücksichtigt.
Marktanteil bei der Kartoffelverarbeitung
Die Wettbewerbslandschaft des Marktes liefert Einzelheiten zu den Wettbewerbern. Zu den enthaltenen Einzelheiten gehören Unternehmensübersicht, Unternehmensfinanzen, erzielter Umsatz, Marktpotenzial, Investitionen in Forschung und Entwicklung, neue Marktinitiativen, regionale Präsenz, Produktionsstandorte und -anlagen, Produktionskapazitäten, Stärken und Schwächen des Unternehmens, Produkteinführung, Produktbreite und -umfang, Anwendungsdominanz. Die oben angegebenen Datenpunkte beziehen sich nur auf den Fokus der Unternehmen in Bezug auf den Markt.
Die auf dem Markt tätigen Marktführer im Bereich Kartoffelverarbeitung sind:
- Tropische Hitze (Kenia)
- Norda Industries Limited (Kenia)
- Leson Company Ltd (Tansania)
- Metzger (Kenia)
- Wedgehut Foods Ltd (Kenia)
- Hollanda FairFoods LTD (Ruanda)
Neueste Entwicklungen auf dem Kartoffelverarbeitungsmarkt
- Im April 2022 hat Tropical Heat neue Produktlinien auf den Markt gebracht, darunter gesunde Snacks und Frühstückszerealien. Das kommende Sortiment umfasst innovative Produkte wie Reiskuchen aus braunem Reis und aromatisierte Schokoladenreiskuchen, die eine kalorienarme Alternative zu herkömmlichen Snacks bieten. Diese Produkte sollen die Lücke zwischen Gesundheit und Geschmack schließen und Verbraucher ansprechen, die nach nahrhaften und dennoch geschmackvollen Optionen suchen. Darüber hinaus erweitert Tropical Heat seine Marktpräsenz und ist derzeit in 25 Ländern tätig. Mit Plänen, bald 30 Länder zu erreichen.
- Im August 2022 hat Butcher. (Sereni Fries) ein neues Produkt auf den Markt gebracht: Tiefkühl-Chips. Das Produkt umfasst drei Schnitte – Streichholz, mittel und Standard – und bietet Komfort, Qualität und eine kürzere Zubereitungszeit. Diese Erweiterung hat dem Unternehmen geholfen, seine Produktionskapazität auf 40 Tonnen pro Tag zu steigern und den Einzelhandels- und Exportmarkt zu erschließen. Durch diese Produkteinführung wurden auch 15 neue Arbeitsplätze geschaffen, wodurch die Belegschaft von 48 auf 63 Mitarbeiter anwuchs.
- Im Jahr 2022 hat Butcher. (Sereni Fries) seine Good Potato Initiative auf der Veranstaltung vom 30. Mai bis 2. Juni auf dem 11. Weltkartoffelkongress in Dublin, T, vorgestellt. Dieses Programm schulte kenianische Kleinbauern in guter landwirtschaftlicher Praxis und klimafreundlicher landwirtschaftlicher Praxis, um Herausforderungen wie traditionelle Anbaumethoden und unzureichende Informationen zu überwinden. Diese Initiative zielte darauf ab, die Ernteproduktivität zu steigern, Verluste nach der Ernte zu reduzieren und den Lebensstandard der Bauern durch Vertragslandwirtschaft zu verbessern. Sie konzentriert sich auch auf die Armutsbekämpfung, die Schaffung von Arbeitsplätzen und die Verbesserung der Ernährungssicherheit, was Frauen und Jugendlichen erheblich zugutekommt.
- Im September 2022 hat sich Wedgehut Foods Ltd. auf die Wertsteigerung von Kartoffelsorten wie Markies, Shangi, Arizona und Destiny spezialisiert. Als Teil des Mavuno Zaidi-Programms mit Syngenta und IDH hat das Unternehmen geplant, 100.000 Landwirte mit Finanzierungen zu unterstützen. Sie arbeiten auch mit AgricoPSA zusammen, um die Kartoffelwertschöpfungskette in Kenia voranzutreiben.
SKU-
Erhalten Sie Online-Zugriff auf den Bericht zur weltweit ersten Market Intelligence Cloud

- Interaktives Datenanalyse-Dashboard
- Unternehmensanalyse-Dashboard für Chancen mit hohem Wachstumspotenzial
- Zugriff für Research-Analysten für Anpassungen und Abfragen
- Konkurrenzanalyse mit interaktivem Dashboard
- Aktuelle Nachrichten, Updates und Trendanalyse
- Nutzen Sie die Leistungsfähigkeit der Benchmark-Analyse für eine umfassende Konkurrenzverfolgung
Inhaltsverzeichnis
1 EINLEITUNG
1.1 ZIELE DER STUDIE
1.2 MARKTDEFINITION
1.3 ÜBERBLICK
1.4 EINSCHRÄNKUNGEN
1.5 ABGEDECKTE MÄRKTE
2 MARKTSEGMENTIERUNG
2.1 ABGEDECKTE MÄRKTE
2.2 GEOGRAFISCHER UMFANG
2,3 JAHRE FÜR DIE STUDIE
2.4 WÄHRUNG UND PREISE
2.5 DBMR-Dreibeindatenvalidierungsmodell
2.6 MULTIVARIATE MODELLIERUNG
2.7 PRIMÄRINTERVIEWS MIT WICHTIGEN MEINUNGSFÜHRERN
2.8 DBMR-Marktpositionsraster
2.9 Marktanwendungs-Abdeckungsraster
2.1 DBMR-Lieferantenanteilsanalyse
2.11 SEKUNDÄRQUELLEN
2.12 ANNAHMEN
3 ZUSAMMENFASSUNG
4 PREMIUM-EINBLICKE
4.1 PREISINDEX
4.2 ÜBERSICHT ÜBER DIE PRODUKTIONSKAPAZITÄT (KILO-TONNEN)
4.3 LIEFERKETTE DES KARTOFFELVERARBEITUNGSMARKTES IN KENIA, UGANDA, TANSANIA UND RUANDA
4.3.1 ROHSTOFFBESCHAFFUNG
4.3.2 VERARBEITUNG
4.3.3 MARKETING UND VERTRIEB
4.3.4 ENDBENUTZER
4.4 MARKENAUSBLICK
4.5 WACHSTUMSSTRATEGIEN DER WICHTIGSTEN MARKTPLAYER
4.6 AUSWIRKUNGEN DER WIRTSCHAFTLICHEN VERLANGSAMUNG AUF DEN MARKT
4.6.1 ÜBERSICHT
4.6.2 SCHLUSSFOLGERUNG
4.7 IMPORT UND EXPORT
4.8 MARKET SHARE OF POTATO PROCESSED PRODUCTS AMONG POTATO BASED SNACKS, 2023, (%)
4.9 TECHNOLOGICAL INNOVATION
4.1 OVERVIEW ON POTATO COLD STORAGE
4.10.1 FOOD-GRADE POTATO STORAGE
4.10.2 PROCESSING-GRADE POTATO STORAGE
4.10.3 STORAGE AND UTILIZATION CAPACITY
4.10.4 UTILIZATION
4.11 FACTORS AFFECTING BUYING DECISION
4.11.1 LARGE PRODUCT RANGE
4.11.2 COMPANY AUTHENTICITY
4.11.3 INCOME
4.12 INDUSTRY TRENDS AND FUTURE PERSPECTIVE OF KENYA, UGANDA, RWANDA, AND TANZANIA POTATO PROCESSING MARKET
4.12.1 INDUSTRY TRENDS
4.12.2 FUTURE TRENDS
4.13 PRODUCTION CAPACITY ANALYSIS ON POTATO PROCESSORS
4.13.1 PRODUCTION CAPACITY ANALYSIS ON POTATO PROCESSORS, BY PRODUCT TYPE, 2022-2024, (TONS)
4.13.2 PRODUCTION CAPACITY ANALYSIS ON POTATO PROCESSORS, BY APPLICATION, 2022-2024, (TONS)
4.13.3 PRODUCTION CAPACITY ANALYSIS ON POTATO INDUSTRY, BY GRADE, 2022-2024, (TONS)
5 REGULATION COVERAGE
6 MARKET OVERVIEW
6.1 DRIVERS
6.1.1 GROWING CONSUMPTION OF CONVENIENCE OR FROZEN FOODS AMONG THE CONSUMERS
6.1.2 GROWTH OF RESTAURANT AND QUICK SERVICE FOOD SECTORS
6.1.3 GROWING POPULATION AND DISPOSABLE INCOME OF CONSUMERS
6.1.4 AVAILABILITY OF A DIVERSE RANGE OF PRODUCTS
6.2 RESTRAINTS
6.2.1 INCREASING HEALTH PROBLEMS ASSOCIATED WITH THE HIGHER CONSUMPTION OF PROCESSED POTATO SNACKS
6.2.2 UNFAVORABLE ENVIRONMENTAL CONCERNS
6.3 OPPORTUNITIES
6.3.1 TECHNOLOGICAL INNOVATION IN POTATO PROCESSING
6.3.2 INCREASING DEMAND FOR ORGANIC PROCESSED FROZEN POTATO PRODUCTS
6.4 CHALLENGES
6.4.1 HIGH COST ASSOCIATED WITH POTATO CHIPS MACHINES
6.4.2 FLUCTUATION IN PRICES OF RAW MATERIALS
7 KENYA, UGANDA, TANZANIA, AND RWANDA POTATO PROCESSING MARKET, BY CATEGORY
7.1 OVERVIEW
7.2 INORGANIC
7.3 ORGANIC
8 KENYA, UGANDA, TANZANIA, AND RWANDA POTATO PROCESSING MARKET, BY PRODUCT TYPE
8.1 OVERVIEW
8.2 FROZEN
8.3 AMBIENT
8.4 DEHYDRATED
9 KENYA, UGANDA, TANZANIA, AND RWANDA POTATO PROCESSING MARKET, BY SHAPE
9.1 OVERVIEW
9.2 DICES
9.3 ROUND
9.4 TATER DRUMS
9.5 SHREDS
9.6 OTHERS
10 KENYA, UGANDA, TANZANIA, AND RWANDA POTATO PROCESSING MARKET, BY PACKAGING
10.1 OVERVIEW
10.2 POUCHES
10.3 CARDBOARD BOXES
10.4 CAN
10.5 OTHERS
11 KENYA, UGANDA, TANZANIA, AND RWANDA POTATO PROCESSING MARKET, BY APPLICATION
11.1 OVERVIEW
11.2 READY-TO-COOK & PREPARED MEALS
11.3 SNACKS AND BAKERY INDUSTRY
11.4 BABY FOOD (BOTTLED)
11.5 DOUGH MIXTURES
11.6 SOUPS AND JAMS
11.7 OTHERS
12 KENYA, UGANDA, TANZANIA, AND RWANDA POTATO PROCESSING MARKET, BY END-USER
12.1 OVERVIEW
12.2 FOOD SERVICE SECTOR
12.3 RETAIL/HOUSEHOLD
13 KENYA, UGANDA, TANZANIA AND, RWANDA POTATO PROCESSING MARKET, BY COUNTRY
13.1 OVERVIEW
13.1.1 KENYA
13.1.2 RWANDA
13.1.3 UGANDA
13.1.4 TANZANIA
14 KENYA, UGANDA, TANZANIA AND RWANDA POTATO PROCESSING MARKET: COMPANY LANDSCAPE
14.1 COMPANY SHARE ANALYSIS: KENYA, UGANDA, TANZANIA, AND RWANDA
15 SWOT ANALYSIS
16 COMPANY PROFILE
16.1 TROPICAL HEAT.
16.1.1 COMPANY SNAPSHOT
16.1.2 PRODUCT PORTFOLIO
16.1.3 RECENT DEVELOPMENTS
16.2 NORDA INDUSTRIES LIMITED
16.2.1 COMPANY SNAPSHOT
16.2.2 PRODUCT PORTFOLIO
16.2.3 RECENT DEVELOPMENTS
16.3 LESON COMPANY LTD
16.3.1 COMPANY SNAPSHOT
16.3.2 PRODUCT PORTFOLIO
16.3.3 RECENT DEVELOPMENTS
16.4 BUTCHER. (SERENI FRIES)
16.4.1 COMPANY SNAPSHOT
16.4.2 PRODUCT PORTFOLIO
16.4.3 RECENT DEVELOPMENTS
16.5 WEDGEHUT FOODS LTD.
16.5.1 COMPANY SNAPSHOT
16.5.2 PRODUCT PORTFOLIO
16.5.3 RECENT DEVELOPMENTS
16.6 HOLLANDA FAIRFOODS LTD
16.6.1 COMPANY SNAPSHOT
16.6.2 1.6.2 PRODUCT PORTFOLIO
16.6.3 RECENT DEVELOPMENT
17 QUESTIONNAIRE
18 RELATED REPORTS
Tabellenverzeichnis
TABELLE 1 DURCHSCHNITTLICHER IMPORT VON KARTOFFELCHIPS UND TIEFKÜHL-FERTIGSCHNITT-KARTOFFELCHIPS, 2020-21, (HS-CODE: - 200410) (TONNEN)
TABELLE 2 REGULIERUNGSABDECKUNG
TABELLE 3: KARTOFFELVERARBEITUNGSMARKT IN KENIA, UGANDA, TANSANIA UND RUANDA, NACH KATEGORIE, 2022–2034 (TAUSEND USD)
TABELLE 4: KARTOFFELVERARBEITUNGSMARKT IN KENIA, UGANDA, TANSANIA UND RUANDA, NACH KATEGORIE, 2022–2034 (TONNEN)
TABELLE 5: KARTOFFELVERARBEITUNGSMARKT IN KENIA, UGANDA, TANSANIA UND RUANDA, DURCHSCHNITTLICHER VERKAUFSPREIS NACH KATEGORIE (USD/KG)
TABELLE 6: KARTOFFELVERARBEITUNGSMARKT IN KENIA, UGANDA, TANSANIA UND RUANDA: NACH PRODUKTTYP, 2022–2034 (TAUSEND USD)
TABELLE 7: KARTOFFELVERARBEITUNGSMARKT IN KENIA, UGANDA, TANSANIA UND RUANDA, NACH PRODUKTTYP, 2022–2034 (TONNEN)
TABELLE 8: KENIA, UGANDA, TANSANIA UND RUANDA – MÄRKTE FÜR DIE VERARBEITUNG VON TIEFKÜHLKARTOFFELN, NACH PRODUKTTYP, 2022–2034 (TAUSEND USD)
TABELLE 9: KENIA, UGANDA, TANSANIA UND RUANDA – MARKT FÜR TIEFKÜHLKARTOFFELVERARBEITUNG, NACH PRODUKTTYP, 2022–2034 (TONNEN)
TABELLE 10: TIEFKÜHLPOMMES FRITES IN KENIA, UGANDA, TANSANIA UND RUANDA AUF DEM KARTOFFELVERARBEITUNGSMARKT, NACH PRODUKTTYP, 2022–2034 (TAUSEND USD)
TABELLE 11: TIEFKÜHLPOMMES FRITES IN KENIA, UGANDA, TANSANIA UND RUANDA AUF DEM KARTOFFELVERARBEITUNGSMARKT, NACH TYP, 2022–2034 (TAUSEND USD)
TABELLE 12: KARTOFFELSPEZIALITÄTEN AUS KENIA, UGANDA, TANSANIA UND RUANDA AUF DEM KARTOFFELVERARBEITUNGSMARKT, NACH GESCHNITTENEN SPEZIALITÄTEN, 2022–2034 (TAUSEND USD)
TABELLE 13: KARTOFFELSPEZIALITÄTEN AUS KENIA, UGANDA, TANSANIA UND RUANDA AUF DEM KARTOFFELVERARBEITUNGSMARKT, NACH PÜREESPEZIALITÄTEN, 2022–2034 (TAUSEND USD)
TABELLE 14: KARTOFFELSPEZIALITÄTEN AUS KENIA, UGANDA, TANSANIA UND RUANDA AUF DEM MARKT FÜR DIE KARTOFFELVERARBEITUNG, NACH GESCHNITTENEN SPEZIALITÄTEN, 2022–2034 (TAUSEND USD)
TABELLE 15: UMGEBUNGSWERT IM KARTOFFELVERARBEITUNGSMARKT IN KENIA, UGANDA, TANSANIA UND RUANDA, NACH PRODUKTTYP, 2022–2034 (TAUSEND USD)
TABELLE 16: UMGEBUNGSWERT IM KARTOFFELVERARBEITUNGSMARKT IN KENIA, UGANDA, TANSANIA UND RUANDA, NACH PRODUKTTYP, 2022–2034 (TONNEN)
TABELLE 17 KENIA, UGANDA, TANSANIA UND RUANDA – DEHYDRIERTER KARTOFFELVERARBEITUNGSMARKT, NACH PRODUKTTYP, 2022–2034 (TAUSEND USD)
TABELLE 18 KENIA, UGANDA, TANSANIA UND RUANDA – DEHYDRIERTES KARTOFFELVERARBEITUNGSMARKT, NACH PRODUKTTYP, 2022–2034 (TONNEN)
TABELLE 19: KARTOFFELVERARBEITUNGSMÄRKTE IN KENIA, UGANDA, TANSANIA UND RUANDA, NACH FORM, 2022–2034 (TAUSEND USD)
TABELLE 20: KARTOFFELVERARBEITUNGSMARKT IN KENIA, UGANDA, TANSANIA UND RUANDA, NACH VERPACKUNG, 2022–2034 (TAUSEND USD)
TABELLE 21: KARTOFFELVERARBEITUNGSMARKT IN KENIA, UGANDA, TANSANIA UND RUANDA, NACH ANWENDUNG, 2022–2034 (TAUSEND USD)
TABELLE 22: KARTOFFELVERARBEITUNGSMARKT IN KENIA, UGANDA, TANSANIA UND RUANDA, NACH ENDVERBRAUCHER, 2022–2034 (TAUSEND USD)
TABELLE 23: KENIA, UGANDA, TANSANIA UND RUANDA – LEBENSMITTELSERVICESEKTOR IM KARTOFFELVERARBEITUNGSMARKT, NACH ENDVERBRAUCHER, 2022–2034 (TAUSEND USD)
TABELLE 24 KENIA, UGANDA, TANSANIA UND RUANDA – RESTAURANT AUF DEM KARTOFFELVERARBEITUNGSMARKT, NACH TYP, 2022–2034 (TAUSEND USD)
TABELLE 25: Restaurants in Kenia, Uganda, Tansania und Ruanda auf dem Markt für Kartoffelverarbeitung, nach Dienstleistungskategorie, 2022–2034 (Tausend USD)
TABELLE 26: KARTOFFELVERARBEITUNGSMARKT IN KENIA, UGANDA, TANSANIA UND RUANDA, NACH LÄNDERN, 2022–2034 (TAUSEND USD)
TABELLE 27: KARTOFFELVERARBEITUNGSMARKT IN KENIA, UGANDA, TANSANIA UND RUANDA, NACH LÄNDERN, 2022–2034 (TONNEN)
TABELLE 28 KENIANISCHER MARKT FÜR KARTOFFELVERARBEITUNG, NACH KATEGORIE, 2022–2034 (TAUSEND USD)
TABELLE 29 KENIANISCHER MARKT FÜR KARTOFFELVERARBEITUNG, NACH KATEGORIE, 2022–2034 (TONNEN)
TABELLE 30 KENIANISCHER MARKT FÜR DIE KARTOFFELVERARBEITUNG, DURCHSCHNITTLICHER VERKAUFSPREIS NACH KATEGORIE (USD/KG)
TABELLE 31 KENIANISCHER MARKT FÜR KARTOFFELVERARBEITUNG, NACH PRODUKTTYP, 2022–2034 (TAUSEND USD)
TABELLE 32 KENIANISCHER MARKT FÜR KARTOFFELVERARBEITUNG, NACH PRODUKTTYP, 2022–2034 (TONNEN)
TABELLE 33 KENIA – MARKT FÜR TIEFKÜHLKARTOFFELVERARBEITUNG, NACH PRODUKTTYP, 2022–2034 (TAUSEND USD)
TABELLE 34 KENIA – MARKT FÜR TIEFKÜHLKARTOFFELVERARBEITUNG, NACH PRODUKTTYP, 2022–2034 (TONNEN)
TABELLE 35: KENIANISCHER MARKT FÜR TIEFKÜHLPOMMES FRITES AUF DEM KARTOFFELVERARBEITUNGSMARKT, NACH PRODUKTTYP, 2022–2034 (TAUSEND USD)
TABELLE 36: KENIANISCHER MARKT FÜR TIEFKÜHLPOMMES FRITES AUF DEM KARTOFFELVERARBEITUNGSMARKT, NACH PRODUKTTYP, 2022–2034 (TAUSEND USD)
TABELLE 37 KENIA-KARTOFFELSPEZIALITÄTEN AUF DEM KARTOFFELVERARBEITUNGSMARKT, NACH SCHNITTSPEZIALITÄTEN, 2022–2034 (TAUSEND USD)
TABELLE 38 KENIA-KARTOFFELSPEZIALITÄTEN AUF DEM KARTOFFELVERARBEITUNGSMARKT, NACH PÜREE-SPEZIALITÄTEN, 2022–2034 (TAUSEND USD)
TABELLE 39 KENIA: KARTOFFELSPEZIALITÄTEN AUF DEM MARKT FÜR DIE KARTOFFELVERARBEITUNG, NACH GESCHNITTENEN SPEZIALITÄTEN, 2022–2034 (TAUSEND USD)
TABELLE 40 KENIA AMBIENT IM KARTOFFELVERARBEITUNGSMARKT, NACH PRODUKTTYP, 2022–2034 (TAUSEND USD)
TABELLE 41 KENIA: UMGEBUNGSWERT IM KARTOFFELVERARBEITUNGSMARKT, NACH PRODUKTTYP, 2022–2034 (TONNEN)
TABELLE 42 KENIA – MARKT FÜR DEHYDRIERTE KARTOFFELVERARBEITUNG, NACH PRODUKTTYP, 2022–2034 (TAUSEND USD)
TABELLE 43 KENIA – MARKT FÜR DEHYDRIERTE KARTOFFELVERARBEITUNG, NACH PRODUKTTYP, 2022–2034 (TONNEN)
TABELLE 44 KENIANISCHER MARKT FÜR KARTOFFELVERARBEITUNG, NACH FORM, 2022–2034 (TAUSEND USD)
TABELLE 45 KENIANISCHER MARKT FÜR KARTOFFELVERARBEITUNG, NACH VERPACKUNG, 2022–2034 (TAUSEND USD)
TABELLE 46 KENIANISCHER MARKT FÜR KARTOFFELVERARBEITUNG, NACH ANWENDUNG, 2022–2034 (TAUSEND USD)
TABELLE 47 KENIANISCHER MARKT FÜR KARTOFFELVERARBEITUNG, NACH ENDVERBRAUCHER, 2022–2034 (TAUSEND USD)
TABELLE 48 KENIAS LEBENSMITTELSERVICESEKTOR IM KARTOFFELVERARBEITUNGSMARKT, NACH ENDVERBRAUCHER, 2022–2034 (TAUSEND USD)
TABELLE 49 KENIA RESTAURANT IM KARTOFFELVERARBEITUNGSMARKT, NACH TYP, 2022–2034 (TAUSEND USD)
TABELLE 50 KENIANISCHE RESTAURANTS IM KARTOFFELVERARBEITUNGSMARKT, NACH SERVICEKATEGORIE, 2022–2034 (TAUSEND USD)
TABELLE 51: RUANDA-MARKT FÜR KARTOFFELVERARBEITUNG, NACH KATEGORIE, 2022–2034 (TAUSEND USD)
TABELLE 52: RUANDA-MARKT FÜR KARTOFFELVERARBEITUNG, NACH KATEGORIE, 2022–2034 (TONNEN)
TABELLE 53 RUANDA-MARKT FÜR DIE KARTOFFELVERARBEITUNG, DURCHSCHNITTLICHER VERKAUFSPREIS NACH KATEGORIE (USD/KG)
TABELLE 54 – RUANDA-MARKT FÜR KARTOFFELVERARBEITUNG, NACH PRODUKTTYP, 2022–2034 (TAUSEND USD)
TABELLE 55: RUANDA-MARKT FÜR KARTOFFELVERARBEITUNG, NACH PRODUKTTYP, 2022–2034 (TONNEN)
TABELLE 56 RUANDA MARKT FÜR TIEFKÜHLKARTOFFELVERARBEITUNG, NACH PRODUKTTYP, 2022–2034 (TAUSEND USD)
TABELLE 57 RUANDA – MARKT FÜR TIEFKÜHLKARTOFFELVERARBEITUNG, NACH PRODUKTTYP, 2022–2034 (TONNEN)
TABELLE 58: RUANDA – TIEFKÜHLPOMMES FRITES AUF DEM MARKT DER KARTOFFELVERARBEITUNG, NACH PRODUKTTYP, 2022–2034 (TAUSEND USD)
TABELLE 59: RUANDA – TIEFKÜHLPOMMES FRITES AUF DEM MARKT DER KARTOFFELVERARBEITUNG, NACH PRODUKTTYP, 2022–2034 (TAUSEND USD)
TABELLE 60 RUANDA-KARTOFFELSPEZIALITÄTEN AUF DEM KARTOFFELVERARBEITUNGSMARKT, NACH GESCHNITTENEN SPEZIALITÄTEN, 2022–2034 (TAUSEND USD)
TABELLE 61 RUANDA-KARTOFFELSPEZIALITÄTEN AUF DEM KARTOFFELVERARBEITUNGSMARKT, NACH PÜREE-SPEZIALITÄTEN, 2022–2034 (TAUSEND USD)
TABELLE 62: RUANDA-KARTOFFELSPEZIALITÄTEN AUF DEM MARKT FÜR DIE KARTOFFELVERARBEITUNG, NACH GESCHNITTENEN SPEZIALITÄTEN 2022–2034 (TAUSEND USD)
TABELLE 63 RUANDA AMBIENT IM KARTOFFELVERARBEITUNGSMARKT, NACH PRODUKTTYP, 2022–2034 (TAUSEND USD)
TABELLE 64 RUANDA AMBIENT IM KARTOFFELVERARBEITUNGSMARKT, NACH PRODUKTTYP, 2022–2034 (TONNEN)
TABELLE 65 – RUANDA – MARKT FÜR DEHYDRIERTE KARTOFFELVERARBEITUNG, NACH PRODUKTTYP, 2022–2034 (TAUSEND USD)
TABELLE 66 RUANDA – MARKT FÜR DEHYDRIERTE KARTOFFELVERARBEITUNG, NACH PRODUKTTYP, 2022–2034 (TONNEN)
TABELLE 67 RUANDA-MARKT FÜR KARTOFFELVERARBEITUNG, NACH FORM, 2022–2034 (TAUSEND USD)
TABELLE 68 RUANDA-MARKT FÜR KARTOFFELVERARBEITUNG, NACH VERPACKUNG, 2022–2034 (TAUSEND USD)
TABELLE 69 MARKT FÜR KARTOFFELVERARBEITUNG IN RUANDA, NACH ANWENDUNG, 2022–2034 (TAUSEND USD)
TABELLE 70: RUANDA-MARKT FÜR KARTOFFELVERARBEITUNG, NACH ENDVERBRAUCHER, 2022–2034 (TAUSEND USD)
TABELLE 71: RUANDA, LEBENSMITTELSERVICESEKTOR IM KARTOFFELVERARBEITUNGSMARKT, NACH ENDVERBRAUCHER, 2022–2034 (TAUSEND USD)
TABELLE 72 RUANDA-RESTAURANT IM KARTOFFELVERARBEITUNGSMARKT, NACH TYP, 2022–2034 (TAUSEND USD)
TABELLE 73 RUANDA-RESTAURANT IM KARTOFFELVERARBEITUNGSMARKT, NACH DIENSTLEISTUNGSKATEGORIE, 2022–2034 (TAUSEND USD)
TABELLE 74: UGANDA-MARKT FÜR KARTOFFELVERARBEITUNG, NACH KATEGORIE, 2022–2034 (TAUSEND USD)
TABELLE 75: UGANDA-MARKT FÜR KARTOFFELVERARBEITUNG, NACH KATEGORIE, 2022–2034 (TONNEN)
TABELLE 76 RUANDA-MARKT FÜR DIE KARTOFFELVERARBEITUNG, DURCHSCHNITTLICHER VERKAUFSPREIS NACH KATEGORIE (USD/KG)
TABELLE 77: UGANDA-MARKT FÜR KARTOFFELVERARBEITUNG, NACH PRODUKTTYP, 2022–2034 (TAUSEND USD)
TABELLE 78: UGANDA-MARKT FÜR KARTOFFELVERARBEITUNG, NACH PRODUKTTYP, 2022–2034 (TONNEN)
TABELLE 79 – UGANDA – MARKT FÜR TIEFKÜHLKARTOFFELVERARBEITUNG, NACH PRODUKTTYP, 2022–2034 (TAUSEND USD)
TABELLE 80 UGANDA – MARKT FÜR TIEFKÜHLKARTOFFELVERARBEITUNG, NACH PRODUKTTYP, 2022–2034 (TONNEN)
TABELLE 81: TIEFKÜHLPOMMES FRITES IN UGANDA AUF DEM MARKT DER KARTOFFELVERARBEITUNG, NACH PRODUKTTYP, 2022–2034 (TAUSEND USD)
TABELLE 82: TIEFKÜHLPOMMES FRITES IN UGANDA AUF DEM MARKT DER KARTOFFELVERARBEITUNG, NACH PRODUKTTYP, 2022–2034 (TAUSEND USD)
TABELLE 83 UGANDA-KARTOFFELSPEZIALITÄTEN AUF DEM KARTOFFELVERARBEITUNGSMARKT, NACH SCHNITTSPEZIALITÄTEN, 2022–2034 (TAUSEND USD)
TABELLE 84 UGANDA – KARTOFFELSPEZIALITÄTEN AUF DEM MARKT FÜR KARTOFFELVERARBEITUNG, NACH PÜREE-SPEZIALITÄTEN, 2022–2034 (TAUSEND USD)
TABELLE 85 UGANDA – KARTOFFELSPEZIALITÄTEN AUF DEM MARKT FÜR DIE KARTOFFELVERARBEITUNG, NACH GESCHNITTENEN SPEZIALITÄTEN, 2022–2034 (TAUSEND USD)
TABELLE 86 UGANDA – MARKT FÜR DIE UMGEBUNG VON KARTOFFELN, NACH PRODUKTTYP, 2022–2034 (TAUSEND USD)
TABELLE 87 UGANDA-UMGEBUNGSKRÄFTE IM KARTOFFELVERARBEITUNGSMARKT, NACH PRODUKTTYP, 2022–2034 (TONNEN)
TABELLE 88 UGANDA – MARKT FÜR DEHYDRIERTE KARTOFFELVERARBEITUNG, NACH PRODUKTTYP, 2022–2034 (TAUSEND USD)
TABELLE 89 – UGANDA – MARKT FÜR DEHYDRIERTE KARTOFFELVERARBEITUNG, NACH PRODUKTTYP, 2022–2034 (TONNEN)
TABELLE 90: UGANDA-MARKT FÜR KARTOFFELVERARBEITUNG, NACH FORM, 2022–2034 (TAUSEND USD)
TABELLE 91: UGANDA-MARKT FÜR KARTOFFELVERARBEITUNG, NACH VERPACKUNG, 2022–2034 (TAUSEND USD)
TABLE 92 UGANDA POTATO PROCESSING MARKET, BY APPLICATION, 2022-2034 (USD THOUSAND)
TABLE 93 UGANDA POTATO PROCESSING MARKET, BY END-USER, 2022-2034 (USD THOUSAND)
TABLE 94 UGANDA FOOD SERVICE SECTOR IN POTATO PROCESSING MARKET, BY END-USER, 2022-2034 (USD THOUSAND)
TABLE 95 UGANDA RESTAURANT IN POTATO PROCESSING MARKET, BY TYPE, 2022-2034 (USD THOUSAND)
TABLE 96 UGANDA RESTAURANT IN POTATO PROCESSING MARKET, BY SERVICE CATEGORY, 2022-2034 (USD THOUSAND)
TABLE 97 TANZANIA POTATO PROCESSING MARKET, BY CATEGORY, 2022-2034 (USD THOUSAND)
TABLE 98 TANZANIA POTATO PROCESSING MARKET, BY CATEGORY, 2022-2034 (TONS)
TABLE 99 TANZANIA POTATO PROCESSING MARKET,AVERAGE SELLING PRICE, BY CATEGORY, 2022-2034 (USD/TONS)
TABLE 100 TANZANIA POTATO PROCESSING MARKET, AVERAGE SELLING PRICE, BY CATEGORY, (USD/KG)
TABLE 101 TANZANIA POTATO PROCESSING MARKET, BY PRODUCT TYPE, 2022-2034 (USD THOUSAND)
TABLE 102 TANZANIA POTATO PROCESSING MARKET, BY PRODUCT TYPE, 2022-2034 (TONS)
TABLE 103 TANZANIA FROZEN IN POTATO PROCESSING MARKET, BY PRODUCT TYPE, 2022-2034 (USD THOUSAND)
TABLE 104 TANZANIA FROZEN IN POTATO PROCESSING MARKET, BY PRODUCT TYPE, 2022-2034 (TONS)
TABLE 105 TANZANIA FROZEN FRENCH FRIES IN POTATO PROCESSING MARKET, BY PRODUCT TYPE, 2022-2034 (USD THOUSAND)
TABLE 106 TANZANIA FROZEN FRENCH FRIES IN POTATO PROCESSING MARKET, BY PRODUCT TYPE, 2022-2034 (USD THOUSAND)
TABLE 107 TANZANIA POTATO SPECIALTIES IN POTATO PROCESSING MARKET, BY CUT SPECIALTIES, 2022-2034 (USD THOUSAND)
TABLE 108 TANZANIA POTATO SPECIALTIES IN POTATO PROCESSING MARKET, MASH SPECIALTIES, 2022-2034 (USD THOUSAND)
TABLE 109 TANZANIA POTATO SPECIALTIES IN POTATO PROCESSING MARKET, BY SHREDDED SPECIALTIES, 2022-2034 (USD THOUSAND)
TABLE 110 TANZANIA AMBIENT IN POTATO PROCESSING MARKET, BY PRODUCT TYPE, 2022-2034 (USD THOUSAND)
TABLE 111 TANZANIA AMBIENT IN POTATO PROCESSING MARKET, BY PRODUCT TYPE, 2022-2034 (TONS)
TABLE 112 TANZANIA DEHYDRATED IN POTATO PROCESSING MARKET, BY PRODUCT TYPE, 2022-2034 (USD THOUSAND)
TABLE 113 TANZANIA DEHYDRATED IN POTATO PROCESSING MARKET, BY PRODUCT TYPE, 2022-2034 (TONS)
TABLE 114 TANZANIA POTATO PROCESSING MARKET, BY SHAPE, 2022-2034 (USD THOUSAND)
TABLE 115 TANZANIA POTATO PROCESSING MARKET, BY PACKAGING, 2022-2034 (USD THOUSAND)
TABLE 116 TANZANIA POTATO PROCESSING MARKET, BY APPLICATION, 2022-2034 (USD THOUSAND)
TABLE 117 TANZANIA POTATO PROCESSING MARKET, BY END-USER, 2022-2034 (USD THOUSAND)
TABLE 118 TANZANIA FOOD SERVICE SECTOR IN POTATO PROCESSING MARKET, BY END-USER, 2022-2034 (USD THOUSAND)
TABLE 119 TANZANIA RESTAURANT IN POTATO PROCESSING MARKET, BY TYPE, 2022-2034 (USD THOUSAND)
TABLE 120 TANZANIA RESTAURANT IN POTATO PROCESSING MARKET, BY SERVICE CATEGORY, 2022-2034 (USD THOUSAND)
Abbildungsverzeichnis
FIGURE 1 KENYA, UGANDA, TANZANIA, AND RWANDA POTATO PROCESSING MARKET
FIGURE 2 KENYA, UGANDA, TANZANIA, AND RWANDA POTATO PROCESSING MARKET: DATA TRIANGULATION
FIGURE 3 KENYA, UGANDA, TANZANIA, AND RWANDA POTATO PROCESSING MARKET: DROC ANALYSIS
ABBILDUNG 4: KARTOFFELVERARBEITUNGSMARKT IN KENIA, UGANDA, TANSANIA UND RUANDA: LÄNDERMARKTANALYSE
ABBILDUNG 5: KARTOFFELVERARBEITUNGSMARKT IN KENIA, UGANDA, TANSANIA UND RUANDA: UNTERNEHMENSFORSCHUNGSANALYSE
ABBILDUNG 6: KARTOFFELVERARBEITUNGSMARKT IN KENIA, UGANDA, TANSANIA UND RUANDA: MULTIVARIATE MODELLIERUNG
ABBILDUNG 7: KARTOFFELVERARBEITUNGSMARKT IN KENIA, UGANDA, TANSANIA UND RUANDA: DEMOGRAFISCHE INTERVIEWDATEN
ABBILDUNG 8: KARTOFFELVERARBEITUNGSMARKT IN KENIA, UGANDA, TANSANIA UND RUANDA: DBMR-MARKTPOSITIONSRASTER
ABBILDUNG 9: KARTOFFELVERARBEITUNGSMARKT IN KENIA, UGANDA, TANSANIA UND RUANDA: ANALYSE DER ANBIETERANTEILE
ABBILDUNG 10 KENIA, UGANDA, TANSANIA UND RUANDA – KARTOFFELVERARBEITUNGSMARKT: ANALYSE DER ANBIETERANTEILE
ABBILDUNG 11: KARTOFFELVERARBEITUNGSMARKT IN KENIA, UGANDA, TANSANIA UND RUANDA: SEGMENTIERUNG
ABBILDUNG 12 DER WACHSENDE VERBRAUCH VON CONVENIENCE- ODER TIEFKÜHLLEBENSMITTELN UNTER DEN VERBRAUCHERN WIRD ERWARTET, DEN KARTOFFELVERARBEITUNGSMARKT IN KENIA, UGANDA, TANSANIA UND RUANDA IM PROGNOSEZEITRAUM ANZUTREIBEN
ABBILDUNG 13 DAS ANORGANISCHE SEGMENT WIRD VORAUSSICHTLICH DEN GRÖSSTEN ANTEIL DES KARTOFFELVERARBEITUNGSMARKTES IN KENIA, UGANDA, TANSANIA UND RUANDA IN DEN JAHREN 2024 UND 2034 AUSMACHEN
ABBILDUNG 14: KARTOFFELVERARBEITUNGSMARKT IN KENIA, UGANDA, TANSANIA UND RUANDA, 2024–2034, DURCHSCHNITTLICHER VERKAUFSPREIS (USD/KG)
ABBILDUNG 15 LIEFERKETTE DES KARTOFFELVERARBEITUNGSMARKTES IN KENIA, UGANDA, TANSANIA UND RUANDA
ABBILDUNG 16 TREIBER, EINSCHRÄNKUNGEN, CHANCEN UND HERAUSFORDERUNGEN DES KARTOFFELVERARBEITUNGSMARKTES IN KENIA, UGANDA, TANSANIA UND RUANDA
ABBILDUNG 17 KARTOFFELVERARBEITUNGSMARKT IN KENIA, UGANDA, TANSANIA UND RUANDA: KATEGORIE, 2023
ABBILDUNG 18 KARTOFFELVERARBEITUNGSMARKT IN KENIA, UGANDA, TANSANIA UND RUANDA: PRODUKTTYP, 2023
ABBILDUNG 19: KARTOFFELVERARBEITUNGSMARKT IN KENIA, UGANDA, TANSANIA UND RUANDA: SHAPE, 2023
ABBILDUNG 20 KENIA, UGANDA, TANSANIA UND RUANDA – KARTOFFELVERARBEITUNGSMARKT: VERPACKUNG, 2023
ABBILDUNG 21 KENIA, UGANDA, TANSANIA UND RUANDA – KARTOFFELVERARBEITUNGSMARKT: ANWENDUNG, 2023
ABBILDUNG 22 KENIA, UGANDA, TANSANIA UND RUANDA: KARTOFFELVERARBEITUNGSMARKT: ENDVERBRAUCHER, 2023
ABBILDUNG 23 KENIA, UGANDA, TANSANIA UND RUANDA – KARTOFFELVERARBEITUNGSMARKT – UNTERNEHMENSANTEIL 2023 (%)
Forschungsmethodik
Die Datenerfassung und Basisjahresanalyse werden mithilfe von Datenerfassungsmodulen mit großen Stichprobengrößen durchgeführt. Die Phase umfasst das Erhalten von Marktinformationen oder verwandten Daten aus verschiedenen Quellen und Strategien. Sie umfasst die Prüfung und Planung aller aus der Vergangenheit im Voraus erfassten Daten. Sie umfasst auch die Prüfung von Informationsinkonsistenzen, die in verschiedenen Informationsquellen auftreten. Die Marktdaten werden mithilfe von marktstatistischen und kohärenten Modellen analysiert und geschätzt. Darüber hinaus sind Marktanteilsanalyse und Schlüsseltrendanalyse die wichtigsten Erfolgsfaktoren im Marktbericht. Um mehr zu erfahren, fordern Sie bitte einen Analystenanruf an oder geben Sie Ihre Anfrage ein.
Die wichtigste Forschungsmethodik, die vom DBMR-Forschungsteam verwendet wird, ist die Datentriangulation, die Data Mining, die Analyse der Auswirkungen von Datenvariablen auf den Markt und die primäre (Branchenexperten-)Validierung umfasst. Zu den Datenmodellen gehören ein Lieferantenpositionierungsraster, eine Marktzeitlinienanalyse, ein Marktüberblick und -leitfaden, ein Firmenpositionierungsraster, eine Patentanalyse, eine Preisanalyse, eine Firmenmarktanteilsanalyse, Messstandards, eine globale versus eine regionale und Lieferantenanteilsanalyse. Um mehr über die Forschungsmethodik zu erfahren, senden Sie eine Anfrage an unsere Branchenexperten.
Anpassung möglich
Data Bridge Market Research ist ein führendes Unternehmen in der fortgeschrittenen formativen Forschung. Wir sind stolz darauf, unseren bestehenden und neuen Kunden Daten und Analysen zu bieten, die zu ihren Zielen passen. Der Bericht kann angepasst werden, um Preistrendanalysen von Zielmarken, Marktverständnis für zusätzliche Länder (fordern Sie die Länderliste an), Daten zu klinischen Studienergebnissen, Literaturübersicht, Analysen des Marktes für aufgearbeitete Produkte und Produktbasis einzuschließen. Marktanalysen von Zielkonkurrenten können von technologiebasierten Analysen bis hin zu Marktportfoliostrategien analysiert werden. Wir können so viele Wettbewerber hinzufügen, wie Sie Daten in dem von Ihnen gewünschten Format und Datenstil benötigen. Unser Analystenteam kann Ihnen auch Daten in groben Excel-Rohdateien und Pivot-Tabellen (Fact Book) bereitstellen oder Sie bei der Erstellung von Präsentationen aus den im Bericht verfügbaren Datensätzen unterstützen.

