Asia Pacific Nuts Market
Tamaño del mercado en miles de millones de dólares
Tasa de crecimiento anual compuesta (CAGR) :
% 
 USD
5.76 Billion
USD
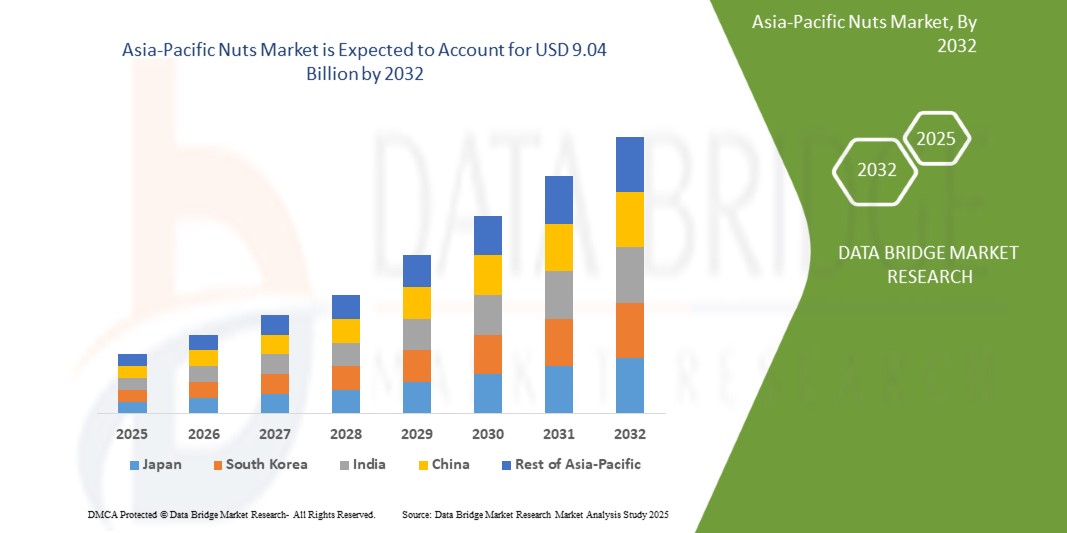
9.04 Billion
2024
2032
USD
5.76 Billion
USD
9.04 Billion
2024
2032
| 2025 –2032 | |
| USD 5.76 Billion | |
| USD 9.04 Billion | |
| % | |
|
Segmentación del mercado de frutos secos de Asia-Pacífico, por tipo de producto (frutos secos de árbol, frutos secos cacahuetes, frutos secos híbridos/otros y otros), forma (enteros, mantequilla, molidos, mitades, trozos, aceite, leche, pasta, crema, trozos tostados, recubiertos, harina, polvo, picados, rebanados, en cubos, triturados, blanqueados enteros, congelados, secados por aspersión, encapsulados y otros), naturaleza (convencional y orgánico), método de procesamiento (crudos, tostados, salados, blanqueados, aromatizados, sin sal, glaseados, confitados, caramelizados, ahumados, germinados, fermentados, liofilizados, encurtidos, fritos al vacío, deshidratados y otros), grado (grado A (calidad de exportación premium), grado B (uso doméstico de calidad media), grado roto (uso en panadería y confitería), grado de aceite, grado industrial, grado rechazado (alimento animal)), vida útil (
Tamaño del mercado de frutos secos
- El tamaño del mercado de nueces de Asia-Pacífico se valoró en USD 5.76 mil millones en 2024 y se espera que alcance los USD 9.04 mil millones para 2032 , con una CAGR del 5,9% durante el período de pronóstico.
- El mercado de los frutos secos se ve impulsado principalmente por la creciente concienciación sobre sus beneficios para la salud, ya que son una fuente rica de fibra, proteínas, minerales, vitaminas y otros antioxidantes. Son una buena fuente de grasas saturadas y contribuyen a la salud cardiovascular. Los consumidores suelen ser conscientes de las preferencias por los snacks veganos en todo el mundo.
Análisis del mercado de frutos secos
- Un fruto seco es una fruta compuesta por una cáscara dura no comestible y una semilla comestible. Son una buena fuente de grasas saludables, fibra y otros nutrientes beneficiosos. Cada tipo de fruto seco ofrece diferentes beneficios. Los frutos secos se encuentran entre las mejores fuentes de proteínas vegetales. Una dieta rica en frutos secos ayuda a prevenir factores de riesgo como la inflamación o algunas enfermedades crónicas.
- Comer frutos secos con regularidad mejora la salud en muchos sentidos, como reducir el riesgo de diabetes y enfermedades cardíacas, así como los niveles de colesterol y triglicéridos. A pesar de su alto contenido calórico, este nutritivo tratamiento rico en fibra también puede ayudar a perder peso.
- Se prevé que Asia-Pacífico crezca a la tasa de crecimiento anual compuesta (TCAC) más rápida, del 5,9 %, entre 2025 y 2032, impulsada por la rápida urbanización, el aumento de la población de clase media y los cambios en los hábitos alimentarios. El creciente consumo de frutos secos como aperitivos e ingredientes en recetas tradicionales y modernas está expandiendo el mercado en toda la región.
- China ostentará la mayor cuota de mercado en Asia-Pacífico en 2024, gracias a su vasta población, una mayor concienciación sobre la salud y la expansión de las redes minoristas y de comercio electrónico. El mercado está impulsado por la sólida producción nacional de nueces y la creciente demanda de almendras y anacardos importados.
- Se espera que el segmento de frutos secos domine el mercado debido a su amplia disponibilidad, asequibilidad y extensa variedad de productos.
Alcance del informe y segmentación del mercado de frutos secos
|
Atributos |
Perspectivas clave del mercado de frutos secos |
|
Segmentos cubiertos |
|
|
Países cubiertos |
Asia-Pacífico
|
|
Actores clave del mercado |
|
|
Oportunidades de mercado |
|
|
Conjuntos de información de datos de valor añadido |
Además de los conocimientos sobre escenarios de mercado, como valor de mercado, tasa de crecimiento, segmentación, cobertura geográfica y actores principales, los informes de mercado seleccionados por Data Bridge Market Research también incluyen análisis en profundidad de expertos, análisis de precios, análisis de participación de marca, encuesta de consumidores, análisis demográfico, análisis de la cadena de suministro, análisis de la cadena de valor, descripción general de materias primas/consumibles, criterios de selección de proveedores, análisis PESTLE, análisis de Porter y marco regulatorio. |
Tendencias del mercado de frutos secos
Tendencia creciente hacia refrigerios más saludables y opciones nutritivas
- El mercado de los frutos secos está en rápido crecimiento, impulsado por las crecientes tendencias de snacks saludables. Los consumidores buscan snacks nutritivos y prácticos, y los frutos secos se adaptan perfectamente a esta demanda gracias a su alto contenido en proteínas, fibra y grasas saludables. A medida que aumenta la concienciación sobre el bienestar, los frutos secos se están convirtiendo en la opción preferida para picar sin remordimientos, impulsando el crecimiento del mercado y fomentando la innovación en la oferta de productos.
- Un factor clave de la popularidad de los frutos secos como refrigerio es la creciente concienciación sobre la salud entre los consumidores. Valorados por su contenido nutricional, los frutos secos se consideran una alternativa saludable a los refrigerios tradicionales. Son ricos en vitaminas, minerales, fibra y proteínas esenciales, y contienen grasas monoinsaturadas y poliinsaturadas cardiosaludables. Su portabilidad y practicidad los hacen ideales para estilos de vida ajetreados, ofreciendo una solución rápida y nutritiva para un refrigerio durante todo el día.
- Por ejemplo, en junio de 2024, según Business Standard Private Ltd., Nutraj anunció el lanzamiento de su nuevo producto, el "NutrajSnackrite Daily Nutrition Pack". Este paquete, cuidadosamente diseñado, contiene prácticas bolsitas llenas de una deliciosa y nutritiva mezcla de frutos secos, que combina una variedad de frutos secos y frutas deshidratadas de primera calidad. Dirigido a consumidores preocupados por su salud, ofrece una opción perfecta para llevar que aporta nutrientes esenciales y energía durante todo el día, satisfaciendo la creciente demanda de opciones de refrigerios saludables y sabrosos.
Dinámica del mercado de frutos secos
Conductor
Aumento del consumo diario de diversos productos derivados de los frutos secos
- El mercado de los frutos secos está experimentando un crecimiento significativo, impulsado principalmente por el aumento del consumo mundial de frutos secos. Uno de los factores clave que impulsa este auge es la creciente concienciación de los consumidores sobre sus beneficios para la salud.
- Además, la transición hacia una alimentación basada en plantas y limpia ha popularizado los frutos secos como refrigerio natural y saludable. La comodidad también juega un papel crucial, ya que son fáciles de llevar y consumir en cualquier lugar, adaptándose a la perfección al ajetreado estilo de vida moderno. Asimismo, la innovación en productos, incluyendo nuevos sabores, envases y opciones listas para consumir, ha ampliado su atractivo, animando a más consumidores a incorporar los frutos secos en su dieta diaria e impulsando la expansión del mercado en Asia-Pacífico.
- Por ejemplo, en septiembre de 2024, según Forbes Media LLC, Daily Crunch recaudó 4 millones de dólares en financiación de Serie A para impulsar su expansión en el creciente mercado de snacks de frutos secos. La inversión se centra en ampliar su gama de snacks de frutos secos germinados, como almendras, nueces y anacardos, aumentar la producción y la disponibilidad en tiendas para satisfacer la creciente demanda de productos de frutos secos nutritivos para llevar en Asia-Pacífico.
Restricción/Desafío
La volatilidad de los precios frena el crecimiento del mercado de frutos secos .
- La volatilidad de los precios es un factor importante que frena el crecimiento del mercado de frutos secos de Asia-Pacífico. La fluctuación de los precios, impulsada por fenómenos meteorológicos impredecibles como sequías, inundaciones y heladas, interrumpe las cadenas de suministro y genera incertidumbre tanto para productores como para compradores. Por ejemplo, las condiciones adversas en regiones productoras clave, como California, han provocado una reducción de la producción y un fuerte aumento de los precios, lo que dificulta que los fabricantes mantengan la estabilidad de los costes de sus productos.
- Además, las tensiones comerciales y los aranceles cambiantes exacerban aún más la inestabilidad de los precios, lo que limita la expansión del mercado. Esta imprevisibilidad desalienta la inversión y dificulta la planificación a largo plazo del sector. Como resultado, los consumidores podrían enfrentarse a precios más altos o a una menor disponibilidad, lo que puede frenar la demanda. Abordar la volatilidad de los precios es crucial para garantizar un crecimiento constante y la sostenibilidad del mercado de frutos secos de Asia-Pacífico.
- Por ejemplo, en junio de 2024, según el SGGP, la Asociación del Anacardo de Vietnam (VINACAS) creó un grupo de trabajo específico para abordar las fluctuaciones de precios de los anacardos crudos. Este grupo colabora con el gobierno y los ministerios para estabilizar los precios, con el objetivo de reducir las interrupciones en la cadena de suministro y promover el crecimiento sostenible de la industria del anacardo en Vietnam.
Alcance del mercado de frutos secos
El mercado de nueces de Asia y el Pacífico está segmentado en doce segmentos notables según el tipo de producto, forma, naturaleza, método de procesamiento, grado, vida útil, certificación, empaque, tamaño del empaque, rango de precios, uso final y canal de distribución.
- Por tipo de producto
Según el tipo de producto, el mercado de frutos secos se segmenta en frutos secos de árbol, cacahuetes, frutos secos híbridos/de otro tipo, entre otros. Se proyecta que este segmento domine el mercado con una cuota de mercado del 52,38 % en 2025, impulsado por la amplia popularidad y disponibilidad de almendras, anacardos, nueces, pistachos y otras variedades. Su consolidada presencia en la dieta mundial, sumada a su alto valor nutricional y su creciente uso en refrigerios saludables, convierte a los frutos secos en la categoría preferida. Además, el comercio mundial de almendras y anacardos, especialmente desde Estados Unidos, India y Vietnam, impulsa el crecimiento de este segmento.
- Por formulario
Según su presentación, el mercado se segmenta en frutos secos enteros, mantequilla, molidos, mitades, trozos, aceite, leche, pasta, crema, trozos tostados, rebozados, harina, polvo, picados, rebanados, en cubos, triturados, blanqueados, congelados, secados por aspersión, encapsulados, entre otros. En 2025, se prevé que el segmento entero lidere el segmento de frutos secos con una cuota de mercado del 12,11 %, impulsado por la creciente concienciación sobre la salud y la preferencia de los consumidores por alimentos sin procesar y de etiqueta limpia. Los frutos secos enteros ofrecen comodidad, atractivo visual y una sensación de frescura, lo que los convierte en una excelente opción tanto para el consumo directo como para aplicaciones culinarias.
- Por naturaleza
Debido a su naturaleza, el mercado de frutos secos se segmenta en convencionales y orgánicos. Se prevé que el segmento convencional domine el mercado con una cuota del 61,71 % en 2025 gracias a su asequibilidad, facilidad de abastecimiento y sólida presencia en los principales canales de venta minorista. En las regiones en desarrollo y sensibles a los precios, los frutos secos convencionales siguen teniendo una cuota importante gracias a su familiaridad, calidad constante y mayor disponibilidad en comparación con las alternativas orgánicas premium.
- Por método de procesamiento
El mercado se segmenta según el método de procesamiento en crudo, tostado, salado, blanqueado, saborizado, sin sal, glaseado, confitado, caramelizado, ahumado, germinado, fermentado, liofilizado, encurtido, frito al vacío, deshidratado, entre otros. Se prevé que el segmento crudo domine el mercado con una cuota de mercado del 12,70 % en 2025, a medida que las tendencias de consumo cambian hacia alimentos mínimamente procesados y ricos en nutrientes. Los frutos secos crudos conservan enzimas y nutrientes naturales, lo que resulta muy atractivo para las comunidades conscientes de la salud, veganas y con una alimentación limpia.
- Por grado
Según la calidad, el mercado se clasifica en: calidad A (calidad premium de exportación), calidad B (calidad media para uso doméstico), calidad quebrada (para panadería y confitería), calidad para aceite, calidad industrial y calidad rechazada (alimento animal). Se proyecta que el segmento de calidad A domine el mercado con una participación del 34,03 % en 2025, debido principalmente a la creciente demanda internacional de frutos secos de alta calidad y apariencia consistente.
- Por vida útil
El mercado se segmenta según la vida útil en <6 meses, 6-12 meses, 13-18 meses, 18 meses y más de 18 meses. Se prevé que el segmento de <6 meses domine el mercado con una cuota del 36,34 % en 2025, lo que refleja la creciente demanda de frutos secos frescos y recién cosechados. Los consumidores premium, especialmente en los sectores minorista y de la salud, asocian una vida útil corta con un mejor sabor, textura y valor nutricional.
- Por certificación
En cuanto a las certificaciones, el mercado incluye ISO 22000/HACCP, USDA Organic, EU Organic, Non-GMO Verified, Gluten Free Certified, Kosher, Halal, Vegan Certified, Fair Trade, Rainforest Alliance, Carbon Neutral Certified, entre otras. Se proyecta que el segmento ISO 22000/HACCP lidere el mercado con una cuota de mercado del 20,64 % en 2025, debido al aumento de las regulaciones mundiales de seguridad alimentaria y a la demanda de productos de frutos secos trazables, higiénicos y de calidad garantizada.
- Por embalaje
Los tipos de envases incluyen bolsas de plástico, envases sellados al vacío, frascos de PET, bolsas de papel, latas compuestas, sacos tejidos a granel, frascos de vidrio, sobres/porciones individuales, cajas de regalo, envases de origen biológico/compostables, latas metálicas, envases ecológicos resellables, barritas envueltas en papel de aluminio, envases de recarga y otros. En 2025, se prevé que el segmento de bolsas de plástico domine el mercado con una cuota de mercado del 20,93%, gracias a su comodidad, portabilidad, rentabilidad y durabilidad. Subsegmentos como los envases con cierre hermético también se adaptan bien a los expositores modernos y al uso del consumidor.
- Por tamaño de embalaje
El mercado está segmentado en 101 g–250 g, 251 g–500 g, 51 g–100 g, 25 g–50 g, 501 g–1 kg, 1,1 kg–2,5 kg, 2,6 kg–5 kg, 5,1 kg–10 kg, 10,1 kg–25 kg, 25,1 kg–50 kg, 50 kg y <25 g. En 2025, se prevé que el segmento de 101 g–250 g domine el mercado con una cuota de mercado del 15,49 %, dirigido al consumo para llevar, las compras de prueba y los snacks saludables. Esta gama equilibra comodidad y precio, lo que la hace atractiva tanto en el comercio minorista moderno como en los canales online.
- Por rango de precio
Los rangos de precios incluyen el económico (USD 1,00-6,00 por kg), el medio (USD 6,01-12,00 por kg), el premium (USD 12,01-20,00 por kg) y el super premium/gourmet (más de USD 20,00 por kg). Se proyecta que el segmento económico domine el mercado con una cuota de mercado del 39,15 % en 2025, gracias a la demanda impulsada por la asequibilidad en los mercados emergentes, los compradores institucionales y los canales minoristas de consumo masivo.
- Por uso final
El mercado se segmenta en consumo directo, snacks, mantequillas y untables de frutos secos, panadería, confitería, fabricación de cereales y granola, nutrición funcional, alternativas lácteas, bebidas, carnes vegetales, culinaria, extracción industrial de aceites, repostería sin harina ni gluten, productos de cuidado personal, usos de origen biológico y agroindustrial, aditivos para alimentos para mascotas, piensos, entre otros. En 2025, se prevé que el segmento de consumo directo domine el mercado con una cuota del 13,61%, debido a la creciente demanda de snacks prácticos y nutritivos. El auge de los estilos de vida saludables y las dietas ricas en proteínas impulsa aún más este segmento en los canales minoristas, online y de viajes.
- Por canal de distribución
Según el canal de distribución, el mercado se segmenta en B2B y B2C. El B2C se divide a su vez en canales offline y online. El offline incluye supermercados/hipermercados, tiendas de conveniencia, tiendas de alimentos saludables, panaderías, tiendas especializadas, hostelería, tiendas libres de impuestos y aerolíneas. El online incluye plataformas de comercio electrónico y sitios web de marcas. Se prevé que el segmento B2B domine el mercado con una cuota del 53,75% en 2025, gracias a la amplia disponibilidad de productos, la confianza en las tiendas físicas y el comportamiento de compra impulsiva, especialmente en los mercados tradicionales y emergentes.
Análisis regional del mercado de frutos secos
Se prevé que Asia-Pacífico crezca a la tasa de crecimiento anual compuesta (TCAC) más rápida, del 5,9 %, entre 2025 y 2032, impulsada por la rápida urbanización, el aumento de la población de clase media y los cambios en los hábitos alimentarios. El creciente consumo de frutos secos como aperitivos e ingredientes en recetas tradicionales y modernas está expandiendo el mercado en toda la región.
Perspectiva del mercado de frutos secos de Japón
En Japón, la creciente concienciación sobre la salud y el envejecimiento de la población impulsan la demanda de alimentos funcionales, como los frutos secos, ricos en nutrientes esenciales. La popularidad de las almendras y las nueces en cereales, dulces y refrigerios para llevar está creciendo rápidamente tanto en zonas urbanas como suburbanas.
Perspectiva del mercado de frutos secos de China
Se prevé que China alcance la tasa de crecimiento anual compuesta (TCAC) más alta de Asia-Pacífico, del 6,6 %, en 2025, gracias a su vasta población, la mayor concienciación sobre la salud y la expansión de las redes minoristas y de comercio electrónico. El mercado se ve impulsado por la sólida producción nacional de nueces y la creciente demanda de almendras y anacardos importados. Las iniciativas gubernamentales que promueven una alimentación saludable y la aparición de marcas premium de frutos secos también están impulsando el crecimiento del mercado.
Cuota de mercado de frutos secos
La industria de los frutos secos está liderada principalmente por empresas bien establecidas, entre las que se incluyen:
- Grupo Olam (Singapur)
- ADM (EE. UU.)
- COSECHAS SELECTAS (Australia)
- Compañía Royal Nut (Australia)
- CACAO Y FRUTOS SECOS JINDAL (India)
- Del Alba (Corea del Sur)
- Now Foods (Canadá)
- BORGES AGRICULTURAL & INDUSTRIAL NUTS, SA (España)
- Wonderful Pistachios LLC (EE. UU.)
Últimos avances en el mercado de frutos secos de Asia-Pacífico
- En abril de 2024, el Grupo Olam anunció una importante expansión de su capacidad de procesamiento de nueces en Nigeria, con el objetivo de aumentar los volúmenes de procesamiento de anacardo tanto para el consumo interno como para la exportación. Esta inversión se alinea con la estrategia de Olam de fortalecer su presencia en productos agrícolas de valor añadido y apoyar las economías locales mediante la creación de empleo y el desarrollo de capacidades en mercados emergentes.
- En marzo de 2024, Blue Diamond Growers presentó una nueva línea de snacks proteicos a base de almendras bajo su marca "Nut-Thins", centrada en opciones de snacks ricos en proteínas y sin gluten. Este lanzamiento responde a la creciente demanda de snacks saludables para llevar y consolida la posición de Blue Diamond en el segmento de snacks funcionales de la industria de los frutos secos.
- En febrero de 2024, Select Harvests anunció la adquisición de nuevos huertos de almendras en Victoria para ampliar su capacidad de producción. Se espera que esta estrategia mejore la integración vertical y garantice un suministro estable de almendras de alta calidad, fortaleciendo la competitividad de la compañía en Asia-Pacífico ante la creciente demanda de los mercados de Asia-Pacífico.
- En enero de 2024, Wonderful Pistachios LLC lanzó una campaña de marketing en Asia-Pacífico titulada "El poder del pistacho", que destaca los beneficios para la salud del consumo de pistachos. La campaña se dirige a los principales mercados internacionales, como India, China y Oriente Medio, y cuenta con el apoyo de influencers y colaboraciones para fomentar la concienciación nutricional.
- En diciembre de 2023, John B. Sanfilippo & Son, Inc. invirtió en automatización y digitalización en su planta de procesamiento de Illinois para aumentar la eficiencia y garantizar una calidad constante en todas sus líneas de productos de cacahuete y frutos secos. La modernización incluye sistemas de clasificación basados en IA y mejores medidas de sostenibilidad en el envasado y el consumo de agua.
- En noviembre de 2023, Borges Agricultural & Industrial Nuts, SA anunció una alianza con una plataforma blockchain para implementar la trazabilidad completa en sus cadenas de suministro de almendras y nueces. Esta iniciativa busca garantizar la transparencia, la certificación de comercio justo y la confianza del consumidor en los mercados europeos y norteamericanos.
SKU-
Obtenga acceso en línea al informe sobre la primera nube de inteligencia de mercado del mundo

- Panel de análisis de datos interactivo
- Panel de análisis de empresas para oportunidades con alto potencial de crecimiento
- Acceso de analista de investigación para personalización y consultas
- Análisis de la competencia con panel interactivo
- Últimas noticias, actualizaciones y análisis de tendencias
- Aproveche el poder del análisis de referencia para un seguimiento integral de la competencia
Tabla de contenido
1 INTRODUCCIÓN
1.1 OBJETIVOS DEL ESTUDIO
1.2 DEFINICIÓN DE MERCADO
1.3 INFORMACIÓN GENERAL
1.4 LIMITACIONES
1.5 MERCADOS CUBIERTOS
2 SEGMENTACIÓN DEL MERCADO
2.1 MERCADOS CUBIERTOS
2.2 ÁMBITO GEOGRÁFICO
2,3 AÑOS CONSIDERADOS PARA EL ESTUDIO
2.4 MONEDA Y PRECIOS
2.5 MODELO DE VALIDACIÓN DE DATOS TRÍPODE DBMR
2.6 MODELADO MULTIVARIADO
2.7 ENTREVISTAS PRINCIPALES CON LÍDERES DE OPINIÓN CLAVE
2.8 CUADRÍCULA DE POSICIÓN DE MERCADO DBMR
2.9 CUADRÍCULA DE COBERTURA DE USO FINAL DEL MERCADO
2.1 ANÁLISIS DE PARTICIPACIÓN DE PROVEEDORES DE DBMR
2.11 FUENTES SECUNDARIAS
2.12 SUPUESTOS
3 RESUMEN EJECUTIVO
4 INFORMACIÓN PREMIUM
4.1 CADENA DE VALOR
4.1.1 PRODUCCIÓN:
4.1.2 TRATAMIENTO:
4.1.3 COMERCIALIZACIÓN/DISTRIBUCIÓN:
4.1.4 COMPRADORES:
4.2 ANÁLISIS DE LA CADENA DE SUMINISTRO
4.3 ANÁLISIS DE LAS CINCO FUERZAS DE PORTER
4.4 ANÁLISIS DE ABASTECIMIENTO DE MATERIA PRIMA
4.5 PANORAMA GENERAL DE LAS INNOVACIONES TECNOLÓGICAS
4.6 ESTRATEGIAS DE CRECIMIENTO ADOPTADAS POR LOS ACTORES CLAVE DEL MERCADO
4.7 FACTORES QUE INFLUYEN EN LA DECISIÓN DE COMPRA DE LOS USUARIOS FINALES
4.8 IMPACTO DE LA DESACELERACIÓN ECONÓMICA EN EL MERCADO
4.8.1 IMPACTO EN EL PRECIO
4.8.2 IMPACTO EN LA CADENA DE SUMINISTRO
4.8.3 IMPACTO EN EL ENVÍO
4.8.4 IMPACTO EN LAS DECISIONES ESTRATÉGICAS DE LA EMPRESA
4.9 MARCO REGULADOR Y DIRECTRICES
4.9.1 DESGLOSE DEL ANÁLISIS DE COSTOS
4.1 SEGUIMIENTO DE INNOVACIÓN Y ANÁLISIS ESTRATÉGICO
4.10.1 ANÁLISIS DE GRANDES ACUERDOS Y ALIANZAS ESTRATÉGICAS
4.10.1.1 EMPRESAS CONJUNTAS
4.10.1.2 FUSIONES Y ADQUISICIONES
4.10.1.3 LICENCIAS Y ASOCIACIONES
4.10.1.4 COLABORACIONES TECNOLÓGICAS
4.10.1.5 DESINVERSIONES ESTRATÉGICAS
4.10.2 NÚMERO DE PRODUCTOS EN DESARROLLO
4.10.3 ETAPA DE DESARROLLO
4.10.4 CRONOGRAMAS E HITOS
4.10.5 ESTRATEGIAS Y METODOLOGÍAS DE INNOVACIÓN
4.10.6 EVALUACIÓN Y MITIGACIÓN DE RIESGOS
4.10.7 PERSPECTIVAS FUTURAS
4.11 ARANCELES E IMPACTO EN EL MERCADO
4.11.1 TASA(S) ARANCELARIA(S) ACTUAL(ES) EN LOS MERCADOS DE LOS 5 PAÍSES PRINCIPALES
4.11.2 PERSPECTIVAS: PRODUCCIÓN LOCAL V/S DEPENDENCIA DE LAS IMPORTACIONES
4.11.3 DINÁMICA DE LOS CRITERIOS DE SELECCIÓN DE PROVEEDORES
4.11.4 IMPACTO EN LA CADENA DE SUMINISTRO
4.11.4.1 ADQUISICIÓN DE MATERIA PRIMA
4.11.4.2 FABRICACIÓN Y PRODUCCIÓN
4.11.4.3 LOGÍSTICA Y DISTRIBUCIÓN
4.11.4.4 PRECIOS DE LANZAMIENTO Y POSICIÓN DEL MERCADO
4.11.5 PARTICIPANTES DE LA INDUSTRIA: ACCIONES PROACTIVAS
4.11.5.1 OPTIMIZACIÓN DE LA CADENA DE SUMINISTRO
4.11.5.2 ESTABLECIMIENTOS DE EMPRESAS CONJUNTAS
4.11.6 IMPACTO EN LOS PRECIOS
4.11.7 INCLINACIÓN REGULADORA
4.11.7.1 SITUACIÓN GEOPOLÍTICA
4.11.7.2 ASOCIACIONES COMERCIALES ENTRE LOS PAÍSES
4.11.7.2.1 TRATADOS DE LIBRE COMERCIO
4.11.7.2.2 ESTABLECIMIENTOS DE ALIANZAS
4.11.7.3 ACREDICIÓN DE ESTADO (INCLUYENDO MFTN)
4.11.7.4 CURSO DE CORRECCIÓN DOMÉSTICA
4.11.7.4.1 ESQUEMAS DE INCENTIVOS PARA IMPULSAR LA PRODUCCIÓN
4.11.7.4.2 ESTABLECIMIENTO DE ZONAS ECONÓMICAS ESPECIALES/PARQUES INDUSTRIALES
4.12 PERSPECTIVA DE LA MARCA
4.12.1 ANÁLISIS COMPARATIVO DE MARCAS
4.12.2 DESCRIPCIÓN GENERAL DEL PRODUCTO Y LA MARCA
4.13 ANÁLISIS DE LA CADENA DE SUMINISTRO
4.13.1 DESCRIPCIÓN GENERAL
4.13.2 ESCENARIO DE COSTOS LOGÍSTICOS
4.13.3 IMPORTANCIA DE LOS PROVEEDORES DE SERVICIOS LOGÍSTICOS
4.14 ANÁLISIS DE PRODUCCIÓN Y CONSUMO
4.15 ANÁLISIS DE IMPORTACIÓN-EXPORTACIÓN
4.16 ANÁLISIS DE PATENTES
4.16.1 CALIDAD Y RESISTENCIA DE LA PATENTE
4.16.2 FAMILIAS DE PATENTES
4.16.3 NÚMERO DE FAMILIAS DE PATENTES INTERNACIONALES POR AÑO DE PUBLICACIÓN
4.17 LICENCIAS Y COLABORACIONES
4.17.1 PANORAMA DE PATENTES DE EMPRESAS
4.18 PANORAMA DE PATENTES DE LA REGIÓN
4.19 ESTRATEGIA Y GESTIÓN DE LA PROPIEDAD INTELECTUAL
4.2 ANÁLISIS DE PATENTES
4.21 ESCENARIO DE MÁRGENES DE GANANCIA
4.22 ANÁLISIS DE PRECIOS
4.23 ANÁLISIS DEL ECOSISTEMA INDUSTRIAL
4.23.1 EMPRESAS DESTACADAS
4.23.2 PEQUEÑAS Y MEDIANAS EMPRESAS
4.23.3 USUARIOS FINALES
4.24 IMPACTO DE LA DESACELERACIÓN ECONÓMICA EN EL MERCADO DE FRUTOS SECOS DE ASIA-PACÍFICO
4.24.1 IMPACTO EN LOS PRECIOS
4.24.2 IMPACTO EN LA CADENA DE SUMINISTRO
4.24.3 IMPACTO EN EL ENVÍO
4.24.4 IMPACTO EN LA DEMANDA
4.24.5 IMPACTO EN LAS DECISIONES ESTRATÉGICAS
5 DESCRIPCIÓN GENERAL DEL MERCADO
5.1 CONTROLADORES
5.1.1 TENDENCIA CRECIENTE EN ASIA-PACÍFICO HACIA OPCIONES DE REFRIGERIOS MÁS SALUDABLES Y NUTRITIVAS
5.1.2 AUMENTO DEL CONSUMO DIARIO DE DIVERSOS PRODUCTOS DE FRUTOS SECOS
5.1.3 AUMENTO DE LA DEMANDA DE DIETAS A BASE DE PLANTAS EN ASIA-PACÍFICO
5.1.4 IMPULSO DEL CRECIMIENTO DEL COMERCIO ELECTRÓNICO QUE IMPULSA LA ACCESIBILIDAD DE LOS PRODUCTOS DE FRUTOS SECOS
5.2 RESTRICCIONES
5.2.1 LA VOLATILIDAD DE PRECIOS LIMITA EL CRECIMIENTO EN EL MERCADO DE FRUTOS SECOS
5.2.2 INTERRUPCIONES DE LA CADENA DE SUMINISTRO
5.2.3 IMPACTO DEL CAMBIO CLIMÁTICO EN LA ESTABILIDAD DEL MERCADO
5.3 OPORTUNIDADES
5.3.1 INNOVACIÓN EN PRODUCTOS DE FRUTOS SECOS SABORIZADOS Y LISTOS PARA COMER
5.3.2 MODIFICACIÓN EN LA PRODUCCIÓN DE FRUTOS SECOS
5.3.3 AUMENTO DEL USO DE FRUTOS SECOS EN PRODUCTOS DE PANADERÍA Y CONFITERÍA
5.4 DESAFÍOS
5.4.1 EL AUMENTO DE LAS SEQUÍAS, LAS OLAS DE CALOR Y LAS LLUVIAS IMPREDECIBLES AMENAZAN EL RENDIMIENTO Y LA CALIDAD DE LOS CULTIVOS
5.4.2 LA ESCASEZ DE MANO DE OBRA EN LAS TEMPORADAS DE COSECHA Y LA DEPENDENCIA DE LA MANO DE OBRA MANUAL AUMENTAN LOS DESAFÍOS DE COSTOS Y DE CUMPLIMIENTO
6 MERCADO DE FRUTOS SECOS DE ASIA-PACÍFICO, POR TIPO DE PRODUCTO
6.1 INFORMACIÓN GENERAL
6.2 FRUTOS SECOS
6.2.1 FRUTOS SECOS, POR TIPO
6.2.1.1 Almendras
6.2.1.2 Anacardos
6.2.1.3 Nueces
6.2.1.4 Pistachos
6.2.1.5 Avellanas
6.2.1.6 Nueces pecanas
6.2.1.7 Nueces de macadamia
6.2.1.8 Piñones
6.2.1.9 Nueces de Brasil
6.2.1.10 Castañas
6.2.1.11 Nueces Pili
6.2.1.12 Nueces de Barukas
6.2.1.13 Otros
6.3 CACAHUATES
6.3.1 MANÍ, POR MANÍ
6.3.1.1 Corredor
6.3.1.2 Virginia
6.3.1.3 Español
6.3.1.4 Valencia
6.3.1.5 Otros
6.4 HÍBRIDOS/OTROS FRUTOS SECOS
6.4.1 FRUTOS SECOS HÍBRIDOS/OTROS, POR TIPO
6.4.1.1 Cocos
6.4.1.2 Nueces de betel
6.4.1.3 Chufas
6.4.1.4 Nueces de ginkgo
6.4.1.5 Otros
6.5 OTROS
7 MERCADO DE FRUTOS SECOS DE ASIA-PACÍFICO, FORMA
7.1 INFORMACIÓN GENERAL
7.2 ENTERO
7.3 MANTEQUILLA
7.4 TIERRA
7.5 MITADES
7.6 PIEZAS
7.7 ACEITE
7.8 LECHE
7.9 PEGAR
7.1 CREMA
7.11 PIEZAS ASADAS
7.12 RECUBIERTO
7.13 HARINA
7.14 POLVO
7.15 PICADO
7.16 REBANADO
7.17 CUBOS
7.18 APLASTADO
7.19 BLANCHEADO ENTERO
7.2 CONGELADO
7.21 SECADO POR ASPERSIÓN
7.22 ENCAPSULADO
7.23 OTROS
8. EL MERCADO DE FRUTOS SECOS DE ASIA-PACÍFICO, POR NATURALEZA
8.1 INFORMACIÓN GENERAL
8.2 CONVENCIONAL
8.3 ORGÁNICO
9 MERCADO DE FRUTOS SECOS DE ASIA-PACÍFICO, POR MÉTODO DE PROCESAMIENTO
9.1 INFORMACIÓN GENERAL
9.2 CRUDO
9.3 ASADO
9.3.1 TOSTADO, POR TIPO
9.3.1.1 TOSTADO EN SECO
9.3.1.2 TOSTADO EN ACEITE
9.4 SALADO
9.5 BLANQUEADO
9.6 SABORIZADO
9.6.1 SABORIZADOS, POR TIPO
9.6.1.1 Endulzado
9.6.1.2 Especiado
9.6.1.3 Recubierto de chocolate
9.6.1.4 Infusión de hierbas
9.6.1.5 Recubierto de yogur
9.6.1.6 Otros
9.7 SIN SAL
9.8 ESMALTADO
9.9 CONFITADA
9.1 CARAMELIZADO
9.11 FUMAR
9.12 BROTARON
9.13 FERMENTADO
9.14 LIOFILIZADO
9.15 EN ESCABECHE
9.16 FRITOS AL VACÍO
9.17 DESHIDRATADO
9.18 OTROS
10 MERCADO DE FRUTOS SECOS DE ASIA-PACÍFICO, POR GRADO
10.1 INFORMACIÓN GENERAL
10.2 GRADO A (CALIDAD DE EXPORTACIÓN PREMIUM)
10.3 GRADO B (USO DOMÉSTICO DE CALIDAD MEDIA)
10.4 GRADO ROTO (USO EN PANADERÍA Y CONFITERÍA)
10.5 ACEITE DE GRADO
10.6 GRADO INDUSTRIAL
10.7 GRADO DE RECHAZO (ALIMENTO PARA ANIMALES)
11 MERCADO DE FRUTOS SECOS DE ASIA-PACÍFICO, POR VIDA ÚTIL
11.1 INFORMACIÓN GENERAL
11.2 <6 MESES
11.3 6–12 MESES
11.4 13–18 MESES
11.5 18 MESES
11.6 MÁS DE 18 MESES
12 MERCADO DE FRUTOS SECOS DE ASIA-PACÍFICO, POR CERTIFICACIÓN
12.1 INFORMACIÓN GENERAL
12.2 ISO 22000/HACCP
12.3 USDA ORGÁNICO
12.4 ORGÁNICO UE
12.5 VERIFICADO SIN OMG
12.6 CERTIFICADO SIN GLUTEN
12.7 KOSHER
12.8 Halal
12.9 CERTIFICADO VEGANO
12.1 COMERCIO JUSTO
12.11 ALIANZA DE LA SELVA TROPICAL
12.12 CERTIFICACIÓN DE NEUTRO EN CARBONO
12.13 OTROS
13 MERCADO DE FRUTOS SECOS DE ASIA-PACÍFICO, ENVASADO
13.1 INFORMACIÓN GENERAL
13.2 BOLSAS DE PLÁSTICO
13.2.1 BOLSAS DE PLÁSTICO, POR TIPO
13.2.1.1 Paquetes con cierre de cremallera vertical
13.2.1.2 Paquetes de almohadas
13.3 ENVASES SELLADOS AL VACÍO
13.4 FRASCO DE PET
13.5 BOLSAS DE PAPEL
13.6 LATAS COMPUESTAS
13.7 SACOS TEJIDOS A GRANEL
13.8 FRASCOS DE VIDRIO
13,9 SOBRES/RACIONES INDIVIDUALES
13.1 CAJAS DE REGALO
13.11 DE BASE BIOLÓGICA/COMPOSTABLE
13.12 LATAS DE METAL
13.13 ENVASES ECOLÓGICOS RESELLABLES
13.14 BARRAS ENVUELTAS EN PAPEL DE ALUMINIO
13.15 PAQUETES DE RECARGA
13.16 OTROS
14 MERCADO DE FRUTOS SECOS DE ASIA-PACÍFICO, POR TAMAÑO DE ENVASE
14.1 INFORMACIÓN GENERAL
14.2 101G–250G
14.3 251G–500G
14.4 51G–100G
14.5 25G–50G
14.6 501G–1KG
14.7 1,1 kg–2,5 kg
14.8 2,6 kg–5 kg
14.9 5.1KG–10KG
14.1 10.1KG–25KG
14.11 25,1 kg–50 kg
14.12 50 kg
14.13 <25G
15 MERCADO DE FRUTOS SECOS DE ASIA-PACÍFICO, POR RANGO DE PRECIOS
15.1 INFORMACIÓN GENERAL
15.2 ECONOMÍA/PRESUPUESTO (USD 1,00-6,00 POR KG)
15.3 GAMA MEDIA (USD 6,01-12,00 POR KG)
15.4 PREMIUM (USD 12.01-20.00 POR KG)
15.5 SUPER PREMIUM/GOURMET (MÁS DE USD 20.00 POR KG)
16 MERCADO DE FRUTOS SECOS DE ASIA-PACÍFICO, POR USO FINAL
16.1 DESCRIPCIÓN GENERAL
16.2 CONSUMO DIRECTO
16.3 APERITIVOS
16.4 MANTEQUILLA DE FRUTOS SECOS Y UNTABLES
16.5 INDUSTRIA DE PANADERÍA
16.6 INDUSTRIA DE CONFITERÍA
16.7 FABRICACIÓN DE CEREALES Y GRANOLA
16.8 NUTRICIÓN FUNCIONAL
16.8.1 NUTRICIÓN FUNCIONAL, POR TIPO
16.8.1.1 Barras de proteína
16.8.1.2 Sustitutos de comidas
16.8.1.3 Suplementos
16.8.1.4 Otros
16.9 ALTERNATIVAS LÁCTEOS
16.1 INDUSTRIA DE BEBIDAS
16.10.1 INDUSTRIA DE BEBIDAS, POR TIPO
16.10.1.1 Leche de nueces
16.10.1.2 Bebidas proteicas a base de frutos secos
16.10.1.3 Bebidas de frutos secos fermentados
16.10.1.4 Otros
16.11 CARNES DE ORIGEN VEGETAL
16.12 CULINARIO
16.12.1 CULINARIO, POR TIPO
16.12.1.1 Guarnición
16.12.1.2 Salsas
16.12.1.3 Condimentos
16.12.1.4 Otros
16.13 EXTRACCIÓN INDUSTRIAL DE PETRÓLEO
16.14 HORNEAR SIN HARINA NI GLUTEN
16.15 PRODUCTOS DE CUIDADO PERSONAL
16.15.1 PRODUCTOS DE CUIDADO PERSONAL, POR TIPO
16.15.1.1 Cuidado de la piel
16.15.1.2 Aceite para el cabello
16.15.1.3 Exfoliantes
16.15.1.4 Otros
16.16 USOS DE BASE BIOLÓGICA Y AGROINDUSTRIALES
16.16.1 USOS DE BASE BIOLÓGICA Y AGROINDUSTRIALES, POR TIPO
16.16.1.1 Carbón activado
16.16.1.2 Abrasivos
16.16.1.3 Aditivos para biocombustibles
16.16.1.4 Otros
16.17 ADITIVOS PARA ALIMENTOS DE MASCOTAS
16.18 ALIMENTO PARA ANIMALES
16.18.1 ALIMENTOS PARA ANIMALES, POR TIPO
16.18.1.1 Residuos de harina
16.18.1.2 Conchas
16.18.1.3 Otros
16.19 OTROS
17 MERCADO DE FRUTOS SECOS DE ASIA-PACÍFICO, POR CANAL DE DISTRIBUCIÓN
17.1 INFORMACIÓN GENERAL
17.2 B2B
17.3 B2C
17.3.1 B2C, POR TIPO
17.3.1.1 Sin conexión
17.3.1.1.1 Supermercados/Hipermercados
17.3.1.1.2 Tiendas de conveniencia
17.3.1.1.3 Tiendas de alimentos saludables
17.3.1.1.4 Panaderías
17.3.1.1.5 Tiendas especializadas
17.3.1.1.6 Hostelería y restauración
17.3.1.1.7 Tiendas libres de impuestos
17.3.1.1.8 Aerolíneas
17.3.1.1.9 Otros
17.3.1.2 En línea
17.3.1.2.1 Mercados de comercio electrónico
17.3.1.2.2 Sitios web propiedad de la marca
18 MERCADO DE FRUTOS SECOS DE ASIA-PACÍFICO, POR REGIÓN
18.1 ASIA PACÍFICO
18.1.1 CHINA
18.1.2 INDIA
18.1.3 JAPÓN
18.1.4 COREA DEL SUR
18.1.5 AUSTRALIA
18.1.6 MALASIA
18.1.7 INDONESIA
18.1.8 TAILANDIA
18.1.9 FILIPINAS
18.1.10 SINGAPUR
18.1.11 HONG KONG
18.1.12 NUEVA ZELANDA
18.1.13 TAIWÁN
18.1.14 RESTO DE ASIA-PACÍFICO
19 PANORAMA EMPRESARIAL DEL MERCADO DE FRUTOS SECOS DE ASIA-PACÍFICO
19.1 ANÁLISIS DE LAS ACCIONES DE LA EMPRESA: GLOBAL
20 ANÁLISIS FODA
21 PERFILES DE EMPRESAS
21.1 ADM
21.1.1 INSTANTÁNEA DE LA EMPRESA
21.1.2 ANÁLISIS DE INGRESOS
21.1.3 ANÁLISIS DE LAS ACCIONES DE LA EMPRESA
21.1.4 PORTAFOLIO DE PRODUCTOS
21.1.5 DESARROLLO RECIENTE
21.2 GRUPO OLAM
21.2.1 INSTANTÁNEA DE LA EMPRESA
21.2.2 ANÁLISIS DE INGRESOS
21.2.3 ANÁLISIS DE LAS ACCIONES DE LA EMPRESA
21.2.4 PORTAFOLIO DE PRODUCTOS
21.2.5 DESARROLLO RECIENTE
21.3 BARRY CALLEBAUT
21.3.1 INSTANTÁNEA DE LA EMPRESA
21.3.2 ANÁLISIS DE INGRESOS
21.3.3 ANÁLISIS DE LAS ACCIONES DE LA EMPRESA
21.3.4 PORTAFOLIO DE PRODUCTOS
21.3.5 DESARROLLO RECIENTE
21.4 CULTIVADORES DE DIAMANTES AZULES.
21.4.1 INSTANTÁNEA DE LA EMPRESA
21.4.2 ANÁLISIS DE LAS ACCIONES DE LA EMPRESA
21.4.3 PORTAFOLIO DE PRODUCTOS
21.4.4 DESARROLLOS/NOTICIAS RECIENTES
21.5 JOHN B. SANFILIPPO & HIJO, INC.
21.5.1 INSTANTÁNEA DE LA EMPRESA
21.5.2 ANÁLISIS DE INGRESOS
21.5.3 ANÁLISIS DE LAS ACCIONES DE LA EMPRESA
21.5.4 PORTAFOLIO DE PRODUCTOS
21.5.5 DESARROLLOS RECIENTES
21.6 BORGES AGRICULTURAL & INDUSTRIAL NUTS, SA
21.6.1 INSTANTÁNEA DE LA EMPRESA
21.6.2 ANÁLISIS DE INGRESOS
21.6.3 PORTAFOLIO DE PRODUCTOS
21.6.4 DESARROLLOS/NOTICIAS RECIENTES
21.7 DEL ALBA.
21.7.1 INSTANTÁNEA DE LA EMPRESA
21.7.2 PORTAFOLIO DE PRODUCTOS
21.7.3 DESARROLLO RECIENTE/NOTICIAS
21.8 ALIMENTOS DIAMANTE
21.8.1 INSTANTÁNEA DE LA EMPRESA
21.8.2 PORTAFOLIO DE PRODUCTOS
21.8.3 DESARROLLOS/NOTICIAS RECIENTES
21.9 GOLDEN PEANUT COMPANY, LLC
21.9.1 INSTANTÁNEA DE LA EMPRESA
21.9.2 PORTAFOLIO DE PRODUCTOS
21.9.3 DESARROLLOS RECIENTES
21.1 NUEZ GOURMET
21.10.1 INSTANTÁNEA DE LA EMPRESA
21.10.2 PORTAFOLIO DE PRODUCTOS
21.10.3 DESARROLLOS/NOTICIAS RECIENTES
21.11 COMPAÑÍA DE NUECES HINES
21.11.1 INSTANTÁNEA DE LA EMPRESA
21.11.2 PORTAFOLIO DE PRODUCTOS
21.12 CORPORACIÓN DE ALIMENTOS HORMEL
21.12.1 INSTANTÁNEA DE LA EMPRESA
21.12.2 ANÁLISIS DE INGRESOS
21.12.3 PORTAFOLIO DE PRODUCTOS
21.12.4 DESARROLLOS/NOTICIAS RECIENTES
21.13 INTERSNACK GROUP GMBH & CO. KG
21.13.1 COMPANY SNAPSHOT
21.13.2 PRODUCT PORTFOLIO
21.13.3 RECENT DEVELOPMENTS
21.14 JINDAL COCOA
21.14.1 COMPANY SNAPSHOT
21.14.2 PRODUCT PORTFOLIO
21.14.3 RECENT DEVELOPMENTS
21.15 MARIANI NUT COMPANY
21.15.1 COMPANY SNAPSHOT
21.15.2 PRODUCT PORTFOLIO
21.15.3 RECENT DEVELOPMENTS
21.16 MOUNT FRANKLIN FOODS
21.16.1 COMPANY SNAPSHOT
21.16.2 PRODUCT PORTFOLIO
21.16.3 RECENT DEVELOPMENTS
21.17 NOW FOODS
21.17.1 COMPANY SNAPSHOT
21.17.2 PRODUCT PORTFOLIO
21.17.3 RECENT DEVELOPMENTS/NEWS
21.18 NUTLAND
21.18.1 COMPANY SNAPSHOT
21.18.2 PRODUCT PORTFOLIO
21.18.3 RECENT DEVELOPMENTS
21.19 NUTWORK HANDELSGESELLSCHAFT MBH
21.19.1 COMPANY SNAPSHOT
21.19.2 PRODUCT PORTFOLIO
21.19.3 RECENT DEVELOPMENTS/NEWS
21.2 POINDEXTER NUT COMPANY
21.20.1 COMPANY SNAPSHOT
21.20.2 PRODUCT PORTFOLIO
21.20.3 RECENT DEVELOPMENTS
21.21 ROYAL NUT COMPANY
21.21.1 COMPANY SNAPSHOT
21.21.2 PRODUCT PORTFOLIO
21.21.3 RECENT DEVELOPMENTS
21.22 SAHALE SNACKS
21.22.1 COMPANY SNAPSHOT
21.22.2 PRODUCT PORTFOLIO
21.22.3 RECENT DEVELOPMENTS
21.23 SANTÉ NUTS
21.23.1 COMPANY SNAPSHOT
21.23.2 PRODUCT PORTFOLIO
21.23.3 RECENT DEVELOPMENTS/NEWS
21.24 SELECT HARVESTS LIMITED
21.24.1 COMPANY SNAPSHOT
21.24.2 REVENUE ANALYSIS
21.24.3 PRODUCT PORTFOLIO
21.24.4 RECENT DEVELOPMENTS/NEWS
21.25 SETTON PISTACHIO OF TERRA BELLA, INC.
21.25.1 COMPANY SNAPSHOT
21.25.2 PRODUCT PORTFOLIO
21.25.3 RECENT DEVELOPMENTS
21.26 TERRANUT
21.26.1 COMPANY SNAPSHOT
21.26.2 PRODUCT PORTFOLIO
21.26.3 RECENT DEVELOPMENTS/NEW
21.27 TREEHOUSE CALIFORNIA ALMONDS, LLC
21.27.1 COMPANY SNAPSHOT
21.27.2 PRODUCT PORTFOLIO
21.27.3 RECENT DEVELOPMENT
21.28 THE DAILY NUT CO.
21.28.1 COMPANY SNAPSHOT
21.28.2 PRODUCT PORTFOLIO
21.28.3 RECENT DEVELOPMENTS/NEWS
21.29 WONDERFUL PISTACHIOS LLC
21.29.1 COMPANY SNAPSHOT
21.29.2 PRODUCT PORTFOLIO
21.29.3 RECENT DEVELOPMENTS/NEWS
21.3 WESTERN NUT COMPANY INC.
21.30.1 COMPANY SNAPSHOT
21.30.2 PRODUCT PORTFOLIO
21.30.3 RECENT DEVELOPMENTS/NEWS
22 QUESTIONNAIRE
23 RELATED REPORTS
Lista de Tablas
CUADRO 1 MARCO REGULADOR Y DIRECTRICES
TABLA 2 COSTOS DE LOS EQUIPOS CLAVE Y DE LAS PLANTAS DE PROCESAMIENTO DE ANACARDOS EN GENERAL
TABLA 3 DESARROLLOS RECIENTES EN EL SECTOR DE LOS NUECES, DESTACANDO LANZAMIENTOS DE NUEVOS PRODUCTOS, INNOVACIONES Y TENDENCIAS
TABLA 4 CRONOGRAMAS E HITOS EN LA INDUSTRIA DE LOS FRUTOS SECOS
CUADRO 5 TASAS ARANCELARIAS DE IMPORTACIÓN DE FRUTOS SECOS EN LOS 5 MERCADOS PRINCIPALES (2024)
CUADRO 6 PRODUCCIÓN LOCAL VS DEPENDENCIA DE LAS IMPORTACIONES
TABLA 7 INCLINACIÓN REGULADORA
CUADRO 8 ASOCIACIONES COMERCIALES ENTRE LOS PAÍSES
CUADRO 9 ESTABLECIMIENTOS DE ALIANZAS
CUADRO 10 ESTABLECIMIENTO DE ZONAS ECONÓMICAS ESPECIALES (ZEE) Y PARQUES INDUSTRIALES
TABLA 11 ANÁLISIS COMPARATIVO DE MARCAS
CUADRO 12 PRODUCCIÓN
CUADRO 13 CONSUMO
TABLA 14 COMPORTAMIENTO DE COMPRA DEL CONSUMIDOR
CUADRO 15 CONJUNTOS DE DATOS DE EXPORTACIÓN
TABLA 16 CONJUNTOS DE DATOS DE IMPORTACIÓN
TABLA 17 COMPORTAMIENTO DE COMPRA DEL CONSUMIDOR
TABLA 18 MERCADO DE FRUTOS SECOS DE ASIA-PACÍFICO, POR TIPO DE PRODUCTO, 2018-2032 (MILES DE USD)
CUADRO 19 MERCADO DE FRUTOS SECOS DE ASIA-PACÍFICO, POR TIPO DE PRODUCTO, 2018-2032 (MILES DE TONELADAS)
TABLA 20 NUECES DE ASIA-PACÍFICO EN EL MERCADO DE NUECES, POR REGIÓN, 2018-2032 (MILES DE USD)
TABLA 21 NUECES DE ASIA-PACÍFICO EN EL MERCADO DE NUECES, POR TIPO, 2018-2032 (MILES DE USD)
TABLA 22. MERCADO DE FRUTOS SECOS DE ASIA-PACÍFICO, POR REGIÓN, 2018-2032 (MILES DE USD)
TABLA 23 MERCADO DE CACAHUATES DE ASIA-PACÍFICO, POR TIPO, 2018-2032 (MILES DE USD)
TABLA 24 NUECES HÍBRIDAS/OTRAS EN EL MERCADO DE NUECES DE ASIA-PACÍFICO, POR REGIÓN, 2018-2032 (MILES DE USD)
TABLA 25 NUECES HÍBRIDAS/OTRAS EN EL MERCADO DE NUECES DE ASIA-PACÍFICO, POR TIPO, 2018-2032 (MILES DE USD)
TABLA 26 OTROS MERCADOS DE FRUTOS SECOS DE ASIA-PACÍFICO, POR REGIÓN, 2018-2032 (MILES DE USD)
TABLA 27 MERCADO DE FRUTOS SECOS DE ASIA-PACÍFICO, POR FORMA, 2018-2032 (MILES DE USD)
CUADRO 28 MERCADO DE FRUTOS SECOS EN TODO EL ÁREA DE ASIA Y EL PACÍFICO, POR REGIÓN, 2018-2032 (MILES DE USD)
TABLA 29 MERCADO DE MANTEQUILLA EN FRUTOS SECOS DE ASIA-PACÍFICO, POR REGIÓN, 2018-2032 (MILES DE USD)
TABLA 30 MERCADO DE FRUTOS SECOS EN ASIA-PACÍFICO, POR REGIÓN, 2018-2032 (MILES DE USD)
TABLA 31 MITADES EN EL MERCADO DE FRUTOS SECOS DE ASIA-PACÍFICO, POR REGIÓN, 2018-2032 (MILES DE USD)
TABLA 32. MERCADO DE FRUTOS SECOS DE ASIA-PACÍFICO, POR REGIÓN, 2018-2032 (MILES DE USD)
TABLA 33 MERCADO DE PETRÓLEO Y FRUTOS SECOS DE ASIA-PACÍFICO, POR REGIÓN, 2018-2032 (MILES DE USD)
CUADRO 34 MERCADO DE LECHE Y FRUTOS SECOS DE ASIA-PACÍFICO, POR REGIÓN, 2018-2032 (MILES DE USD)
TABLA 35 MERCADO DE PASTA DE FRUTOS SECOS DE ASIA-PACÍFICO, POR REGIÓN, 2018-2032 (MILES DE USD)
TABLA 36 MERCADO DE CREMA DE FRUTOS SECOS DE ASIA-PACÍFICO, POR REGIÓN, 2018-2032 (MILES DE USD)
TABLA 37 MERCADO DE FRUTOS SECOS TOSTADOS EN ASIA-PACÍFICO, POR REGIÓN, 2018-2032 (MILES DE USD)
TABLA 38 MERCADO DE FRUTOS SECOS RECUBIERTOS DE ASIA-PACÍFICO, POR REGIÓN, 2018-2032 (MILES DE USD)
CUADRO 39 MERCADO DE HARINA DE FRUTOS SECOS DE ASIA-PACÍFICO, POR REGIÓN, 2018-2032 (MILES DE USD)
TABLA 40 MERCADO DE FRUTOS SECOS EN POLVO DE ASIA-PACÍFICO, POR REGIÓN, 2018-2032 (MILES DE USD)
TABLA 41 MERCADO DE FRUTOS SECOS PICADOS DE ASIA-PACÍFICO, POR REGIÓN, 2018-2032 (MILES DE USD)
TABLA 42 MERCADO DE FRUTOS SECOS EN ASIA-PACÍFICO, POR REGIÓN, 2018-2032 (MILES DE USD)
TABLA 43 MERCADO DE FRUTOS SECOS EN CUBITOS DE ASIA-PACÍFICO, POR REGIÓN, 2018-2032 (MILES DE USD)
TABLA 44 MERCADO DE FRUTOS SECOS TRITURADOS DE ASIA-PACÍFICO, POR REGIÓN, 2018-2032 (MILES DE USD)
TABLA 45 MERCADO DE FRUTOS SECOS BLANQUEADOS ENTEROS DE ASIA-PACÍFICO, POR REGIÓN, 2018-2032 (MILES DE USD)
CUADRO 46 MERCADO DE FRUTOS SECOS CONGELADOS DE ASIA-PACÍFICO, POR REGIÓN, 2018-2032 (MILES DE USD)
TABLA 47 MERCADO DE FRUTOS SECOS ASPERIZADOS DE ASIA-PACÍFICO, POR REGIÓN, 2018-2032 (MILES DE USD)
CUADRO 48 MERCADO DE FRUTOS SECOS EN CAPSULADO EN ASIA-PACÍFICO, POR REGIÓN, 2018-2032 (MILES DE USD)
TABLA 49 OTROS MERCADOS DE FRUTOS SECOS DE ASIA-PACÍFICO, POR REGIÓN, 2018-2032 (MILES DE USD)
TABLA 50 MERCADO DE FRUTOS SECOS DE ASIA-PACÍFICO, POR NATURALEZA, 2018-2032 (MILES DE USD)
CUADRO 51 MERCADO DE FRUTOS SECOS CONVENCIONALES DE ASIA-PACÍFICO, POR REGIÓN, 2018-2032 (MILES DE USD)
TABLA 52 MERCADO DE FRUTOS SECOS ORGÁNICOS DE ASIA-PACÍFICO, POR REGIÓN, 2018-2032 (MILES DE USD)
CUADRO 53 MERCADO DE FRUTOS SECOS DE ASIA-PACÍFICO, POR MÉTODO DE PROCESAMIENTO, 2018-2032 (MILES DE USD)
TABLA 54 MERCADO DE FRUTOS SECOS DE ASIA-PACÍFICO, POR REGIÓN, 2018-2032 (MILES DE USD)
TABLA 55 MERCADO DE FRUTOS SECOS TOSTADOS DE ASIA-PACÍFICO, POR REGIÓN, 2018-2032 (MILES DE USD)
TABLA 56 MERCADO DE FRUTOS SECOS TOSTADOS DE ASIA-PACÍFICO, POR TIPO, 2018-2032 (MILES DE USD)
CUADRO 57 MERCADO DE FRUTOS SECOS SALADOS DE ASIA-PACÍFICO, POR REGIÓN, 2018-2032 (MILES DE USD)
TABLA 58 MERCADO DE FRUTOS SECOS BLANQUEADOS DE ASIA-PACÍFICO, POR REGIÓN, 2018-2032 (MILES DE USD)
TABLA 59 MERCADO DE FRUTOS SECOS CON SABOR A ASIA-PACÍFICO, POR REGIÓN, 2018-2032 (MILES DE USD)
TABLA 60 MERCADO DE FRUTOS SECOS CON SABOR A ASIA-PACÍFICO, POR TIPO, 2018-2032 (MILES DE USD)
TABLA 61 MERCADO DE FRUTOS SECOS SIN SAL DE ASIA-PACÍFICO, POR REGIÓN, 2018-2032 (MILES DE USD)
CUADRO 62 MERCADO DE NUECES GLASEADAS DE ASIA-PACÍFICO, POR REGIÓN, 2018-2032 (MILES DE USD)
TABLA 63 MERCADO DE FRUTOS SECOS CONFITADOS DE ASIA-PACÍFICO, POR REGIÓN, 2018-2032 (MILES DE USD)
TABLA 64 MERCADO DE FRUTOS SECOS CARAMELIZADOS DE ASIA-PACÍFICO, POR REGIÓN, 2018-2032 (MILES DE USD)
TABLA 65 MERCADO DE FRUTOS SECOS AHUMADOS DE ASIA-PACÍFICO, POR REGIÓN, 2018-2032 (MILES DE USD)
TABLA 66 MERCADO DE FRUTOS SECOS GERMINADOS EN ASIA-PACÍFICO, POR REGIÓN, 2018-2032 (MILES DE USD)
CUADRO 67 MERCADO DE FRUTOS SECOS FERMENTADOS DE ASIA-PACÍFICO, POR REGIÓN, 2018-2032 (MILES DE USD)
TABLA 68 MERCADO DE FRUTOS SECOS LIOFILIZADOS DE ASIA-PACÍFICO, POR REGIÓN, 2018-2032 (MILES DE USD)
TABLA 69 MERCADO DE FRUTOS SECOS ENCURTIDOS DE ASIA-PACÍFICO, POR REGIÓN, 2018-2032 (MILES DE USD)
TABLA 70 MERCADO DE FRUTOS SECOS FRITOS AL VACÍO DE ASIA-PACÍFICO, POR REGIÓN, 2018-2032 (MILES DE USD)
TABLA 71 MERCADO DE FRUTOS SECOS DESHIDRATADOS DE ASIA-PACÍFICO, POR REGIÓN, 2018-2032 (MILES DE USD)
TABLA 72 OTROS MERCADOS DE FRUTOS SECOS DE ASIA-PACÍFICO, POR REGIÓN, 2018-2032 (MILES DE USD)
TABLA 73 MERCADO DE FRUTOS SECOS DE ASIA-PACÍFICO, POR GRADO, 2018-2032 (MILES DE USD)
CUADRO 74 MERCADO DE FRUTOS SECOS DE GRADO A (CALIDAD DE EXPORTACIÓN PREMIUM) DE ASIA-PACÍFICO, POR REGIÓN, 2018-2032 (MILES DE USD)
CUADRO 75 ASIA-PACÍFICO GRADO B (USO NACIONAL DE CALIDAD MEDIA) EN EL MERCADO DE FRUTOS SECOS, POR REGIÓN, 2018-2032 (MILES DE USD)
TABLA 76 ASIA-PACÍFICO GRADO DE FRUTOS SECOS (USO EN PANADERÍA Y CONFITERÍA), POR REGIÓN, 2018-2032 (MILES DE USD)
TABLA 77 MERCADO DE NUECES POR GRADO DE ACEITE DE ASIA-PACÍFICO, POR REGIÓN, 2018-2032 (MILES DE USD)
TABLA 78 MERCADO DE FRUTOS SECOS DE GRADO INDUSTRIAL DE ASIA-PACÍFICO, POR REGIÓN, 2018-2032 (MILES DE USD)
TABLA 79 GRADO RECHAZADO DE ASIA-PACÍFICO (ALIMENTO PARA ANIMALES) EN EL MERCADO DE FRUTOS SECOS, POR REGIÓN, 2018-2032 (MILES DE USD)
TABLA 80 MERCADO DE FRUTOS SECOS DE ASIA-PACÍFICO, POR VIDA ÚTIL, 2018-2032 (MILES DE USD)
TABLA 81 ASIA-PACÍFICO <6 MESES EN EL MERCADO DE FRUTOS SECOS, POR REGIÓN, 2018-2032 (MILES DE USD)
TABLA 82 MERCADO DE FRUTOS SECOS EN ASIA-PACÍFICO, 6 A 12 MESES, POR REGIÓN, 2018-2032 (MILES DE USD)
CUADRO 83 MERCADO DE FRUTOS SECOS DE ASIA-PACÍFICO, 13-18 MESES, POR REGIÓN, 2018-2032 (MILES DE USD)
TABLA 84 MERCADO DE FRUTOS SECOS EN ASIA-PACÍFICO, 18 MESES, POR REGIÓN, 2018-2032 (MILES DE USD)
TABLA 85 ASIA-PACÍFICO MÁS DE 18 MESES EN EL MERCADO DE FRUTOS SECOS, POR REGIÓN, 2018-2032 (MILES DE USD)
TABLA 86 MERCADO DE FRUTOS SECOS DE ASIA-PACÍFICO, POR CERTIFICACIÓN, 2018-2032 (MILES DE USD)
TABLA 87 ASIA-PACÍFICO ISO 22000/HACCP EN EL MERCADO DE FRUTOS SECOS, POR REGIÓN, 2018-2032 (MILES DE USD)
TABLA 88 MERCADO DE FRUTOS SECOS ORGÁNICOS DEL USDA DE ASIA-PACÍFICO, POR REGIÓN, 2018-2032 (MILES DE USD)
TABLA 89 MERCADO DE FRUTOS SECOS ORGÁNICOS DE ASIA-PACÍFICO DE LA UE, POR REGIÓN, 2018-2032 (MILES DE USD)
TABLA 90 MERCADO DE FRUTOS SECOS VERIFICADO SIN OMG DE ASIA-PACÍFICO, POR REGIÓN, 2018-2032 (MILES DE USD)
TABLA 91 CERTIFICACIÓN SIN GLUTEN EN EL MERCADO DE FRUTOS SECOS DE ASIA-PACÍFICO, POR REGIÓN, 2018-2032 (MILES DE USD)
TABLA 92 MERCADO DE FRUTOS SECOS KOSHER EN ASIA-PACÍFICO, POR REGIÓN, 2018-2032 (MILES DE USD)
TABLA 93 MERCADO DE FRUTOS SECOS HALAL EN ASIA-PACÍFICO, POR REGIÓN, 2018-2032 (MILES DE USD)
TABLA 94 CERTIFICACIÓN VEGANA EN EL MERCADO DE FRUTOS SECOS DE ASIA-PACÍFICO, POR REGIÓN, 2018-2032 (MILES DE USD)
CUADRO 95 MERCADO DE COMERCIO JUSTO DE FRUTOS SECOS EN ASIA-PACÍFICO, POR REGIÓN, 2018-2032 (MILES DE USD)
CUADRO 96 ALIANZA DE LA SELVA TROPICAL DE ASIA Y EL PACÍFICO EN EL MERCADO DE FRUTOS SECOS, POR REGIÓN, 2018-2032 (MILES DE USD)
TABLA 97 ASIA-PACÍFICO CERTIFICACIÓN DE NEUTRO EN CARBONO EN EL MERCADO DE FRUTOS SECOS, POR REGIÓN, 2018-2032 (MILES DE USD)
TABLA 98 OTROS MERCADOS DE FRUTOS SECOS DE ASIA-PACÍFICO, POR REGIÓN, 2018-2032 (MILES DE USD)
TABLA 99 MERCADO DE FRUTOS SECOS DE ASIA-PACÍFICO, POR ENVASE, 2018-2032 (MILES DE USD)
TABLA 100 BOLSAS DE PLÁSTICO EN EL MERCADO DE FRUTOS SECOS DE ASIA-PACÍFICO, POR REGIÓN, 2018-2032 (MILES DE USD)
TABLA 101 TABLA 14 BOLSAS DE PLÁSTICO EN EL MERCADO DE FRUTOS SECOS DE ASIA-PACÍFICO, POR TIPO, 2018-2032 (MILES DE USD)
TABLA 102 ENVASES SELLADOS AL VACÍO EN EL MERCADO DE FRUTOS SECOS DE ASIA-PACÍFICO, POR REGIÓN, 2018-2032 (MILES DE USD)
TABLA 103 FRASCO DE PET EN EL MERCADO DE FRUTOS SECOS DE ASIA-PACÍFICO, POR REGIÓN, 2018-2032 (MILES DE USD)
TABLA 104 BOLSAS DE PAPEL EN EL MERCADO DE FRUTOS SECOS DE ASIA-PACÍFICO, POR REGIÓN, 2018-2032 (MILES DE USD)
TABLA 105 LATAS COMPUESTAS EN EL MERCADO DE FRUTOS SECOS DE ASIA-PACÍFICO, POR REGIÓN, 2018-2032 (MILES DE USD)
TABLA 106 SACOS TEJIDOS A GRANEL EN EL MERCADO DE FRUTOS SECOS DE ASIA-PACÍFICO, POR REGIÓN, 2018-2032 (MILES DE USD)
TABLA 107 FRASCO DE VIDRIO EN EL MERCADO DE FRUTOS SECOS DE ASIA-PACÍFICO, POR REGIÓN, 2018-2032 (MILES DE USD)
TABLA 108 MERCADO DE FRUTOS SECOS EN SOBRES/PORCIONES INDIVIDUALES DE ASIA-PACÍFICO, POR REGIÓN, 2018-2032 (MILES DE USD)
TABLA 109 CAJAS DE REGALO EN EL MERCADO DE FRUTOS SECOS DE ASIA-PACÍFICO, POR REGIÓN, 2018-2032 (MILES DE USD)
TABLA 110 MERCADO DE FRUTOS SECOS DE BASE BIOLÓGICA/COMPOSTABLES DE ASIA-PACÍFICO, POR REGIÓN, 2018-2032 (MILES DE USD)
TABLA 111 MERCADO DE LATAS DE METAL DE ASIA-PACÍFICO EN FRUTOS SECOS, POR REGIÓN, 2018-2032 (MILES DE USD)
TABLA 112 ENVASES ECOLÓGICOS RESELLABLES EN EL MERCADO DE FRUTOS SECOS DE ASIA-PACÍFICO, POR REGIÓN, 2018-2032 (MILES DE USD)
TABLA 113 MERCADO DE NUECES ENVASADOS EN LÁMINA DE ASIA-PACÍFICO, POR REGIÓN, 2018-2032 (MILES DE USD)
TABLA 114 MERCADO DE ENVASES DE RECARGA DE FRUTOS SECOS DE ASIA-PACÍFICO, POR REGIÓN, 2018-2032 (MILES DE USD)
TABLA 115 OTROS MERCADOS DE FRUTOS SECOS DE ASIA-PACÍFICO, POR REGIÓN, 2018-2032 (MILES DE USD)
TABLA 116 MERCADO DE FRUTOS SECOS DE ASIA-PACÍFICO, POR TAMAÑO DE ENVASE, 2018-2032 (MILES DE USD)
TABLA 117 MERCADO DE FRUTOS SECOS DE 101G A 250G EN ASIA-PACÍFICO, POR REGIÓN, 2018-2032 (MILES DE USD)
TABLA 118 MERCADO DE FRUTOS SECOS DE 251G A 500G EN ASIA-PACÍFICO, POR REGIÓN, 2018-2032 (MILES DE USD)
TABLA 119 MERCADO DE FRUTOS SECOS DE 51G A 100G EN ASIA-PACÍFICO, POR REGIÓN, 2018-2032 (MILES DE USD)
TABLA 120 MERCADO DE FRUTOS SECOS DE 25G A 50G EN ASIA-PACÍFICO, POR REGIÓN, 2018-2032 (MILES DE USD)
TABLA 121 MERCADO DE FRUTOS SECOS DE 501 G A 1 KG EN ASIA-PACÍFICO, POR REGIÓN, 2018-2032 (MILES DE USD)
TABLA 122 MERCADO DE FRUTOS SECOS DE 1,1 KG A 2,5 KG EN ASIA-PACÍFICO, POR REGIÓN, 2018-2032 (MILES DE USD)
TABLA 123 MERCADO DE FRUTOS SECOS DE 2,6 KG A 5 KG EN ASIA-PACÍFICO, POR REGIÓN, 2018-2032 (MILES DE USD)
TABLA 124 MERCADO DE FRUTOS SECOS DE 5,1 KG A 10 KG EN ASIA-PACÍFICO, POR REGIÓN, 2018-2032 (MILES DE USD)
TABLA 125 MERCADO DE FRUTOS SECOS DE 10,1 KG A 25 KG EN ASIA-PACÍFICO, POR REGIÓN, 2018-2032 (MILES DE USD)
TABLA 126 ASIA-PACÍFICO 25,1KG–50KG EN EL MERCADO DE FRUTOS SECOS, POR REGIÓN, 2018-2032 (MILES DE USD)
TABLA 127 MERCADO DE FRUTOS SECOS DE 50 KG EN ASIA-PACÍFICO, POR REGIÓN, 2018-2032 (MILES DE USD)
TABLA 128 MERCADO DE FRUTOS SECOS <25G EN ASIA-PACÍFICO, POR REGIÓN, 2018-2032 (MILES DE USD)
CUADRO 129 MERCADO DE FRUTOS SECOS DE ASIA-PACÍFICO, POR RANGO DE PRECIOS, 2018-2032 (MILES DE USD)
CUADRO 130 ECONOMÍA/PRESUPUESTO DE ASIA-PACÍFICO (USD 1,00-6,00 POR KG) EN EL MERCADO DE FRUTOS SECOS, POR REGIÓN, 2018-2032 (MILES DE USD)
CUADRO 131 MERCADO DE FRUTOS SECOS DE PRECIO MEDIO (USD 6,01-12,00 POR KG) EN ASIA-PACÍFICO, POR REGIÓN, 2018-2032 (MILES DE USD)
CUADRO 132 PRIMA DE ASIA-PACÍFICO (USD 12,01-20,00 POR KG) EN EL MERCADO DE FRUTOS SECOS, POR REGIÓN, 2018-2032 (MILES DE USD)
CUADRO 133 MERCADO DE FRUTOS SECOS SUPERPREMIUM/GOURMET (MÁS DE USD 20,00 POR KG) EN ASIA-PACÍFICO, POR REGIÓN, 2018-2032 (MILES DE USD)
CUADRO 134 MERCADO DE FRUTOS SECOS DE ASIA-PACÍFICO, POR USO FINAL, 2018-2032 (MILES DE USD)
CUADRO 135 CONSUMO DIRECTO DE FRUTOS SECOS EN EL MERCADO DE ASIA-PACÍFICO, POR REGIÓN, 2018-2032 (MILES DE USD)
TABLA 136 MERCADO DE SNACKS DE FRUTOS SECOS EN ASIA-PACÍFICO, POR REGIÓN, 2018-2032 (MILES DE USD)
TABLA 137 MANTEQUILLA DE FRUTOS SECOS Y CREMA PARA UNTAR EN EL MERCADO DE FRUTOS SECOS DE ASIA-PACÍFICO, POR REGIÓN, 2018-2032 (MILES DE USD)
TABLA 138 INDUSTRIA DE PANADERÍA DE ASIA-PACÍFICO EN EL MERCADO DE FRUTOS SECOS, POR REGIÓN, 2018-2032 (MILES DE USD)
TABLA 139 INDUSTRIA DE CONFITERÍA DE ASIA-PACÍFICO EN EL MERCADO DE FRUTOS SECOS, POR REGIÓN, 2018-2032 (MILES DE USD)
TABLA 140 FABRICACIÓN DE CEREALES Y GRANOLA EN EL MERCADO DE FRUTOS SECOS DE ASIA-PACÍFICO, POR REGIÓN, 2018-2032 (MILES DE USD)
TABLA 141 MERCADO DE NUTRICIÓN FUNCIONAL DE FRUTOS SECOS EN ASIA-PACÍFICO, POR REGIÓN, 2018-2032 (MILES DE USD)
TABLA 142 MERCADO DE NUTRICIÓN FUNCIONAL DE FRUTOS SECOS EN ASIA-PACÍFICO, POR TIPO, 2018-2032 (MILES DE USD)
TABLA 143 ALTERNATIVAS LÁCTEOS EN EL MERCADO DE FRUTOS SECOS DE ASIA-PACÍFICO, POR REGIÓN, 2018-2032 (MILES DE USD)
TABLA 144 INDUSTRIA DE BEBIDAS DE ASIA-PACÍFICO EN EL MERCADO DE FRUTOS SECOS, POR REGIÓN, 2018-2032 (MILES DE USD)
TABLA 145 INDUSTRIA DE BEBIDAS DE ASIA-PACÍFICO EN EL MERCADO DE FRUTOS SECOS, POR TIPO, 2018-2032 (MILES DE USD)
TABLA 146 MERCADO DE CARNES VEGETALES EN FRUTOS SECOS DE ASIA-PACÍFICO, POR REGIÓN, 2018-2032 (MILES DE USD)
TABLA 147 MERCADO DE NUECES Y ARTÍCULOS CULINARIOS DE ASIA-PACÍFICO, POR REGIÓN, 2018-2032 (MILES DE USD)
TABLA 148 MERCADO DE FRUTOS SECOS EN LA REGIÓN DE ASIA-PACÍFICO, POR TIPO, 2018-2032 (MILES DE USD)
CUADRO 149 EXTRACCIÓN DE ACEITE INDUSTRIAL EN EL MERCADO DE FRUTOS SECOS DE ASIA-PACÍFICO, POR REGIÓN, 2018-2032 (MILES DE USD)
TABLA 150 MERCADO DE HARINAS Y NUECES PARA HORNEAR SIN GLUTEN EN ASIA-PACÍFICO, POR REGIÓN, 2018-2032 (MILES DE USD)
TABLA 151 PRODUCTOS DE CUIDADO PERSONAL EN EL MERCADO DE FRUTOS SECOS DE ASIA-PACÍFICO, POR REGIÓN, 2018-2032 (MILES DE USD)
TABLA 152 PRODUCTOS DE CUIDADO PERSONAL EN EL MERCADO DE FRUTOS SECOS DE ASIA-PACÍFICO, POR TIPO, 2018-2032 (MILES DE USD)
TABLA 153 USOS DE PRODUCTOS DE ORIGEN BIOLÓGICO Y AGROINDUSTRIALES EN EL MERCADO DE FRUTOS SECOS DE ASIA-PACÍFICO, POR REGIÓN, 2018-2032 (MILES DE USD)
TABLA 154 USOS DE BIOBASE Y AGROINDUSTRIALES EN EL MERCADO DE FRUTOS SECOS DE ASIA-PACÍFICO, POR TIPO, 2018-2032 (MILES DE USD)
TABLA 155 ADITIVOS PARA ALIMENTOS DE MASCOTAS EN EL MERCADO DE FRUTOS SECOS DE ASIA-PACÍFICO, POR REGIÓN, 2018-2032 (MILES DE USD)
TABLA 156 MERCADO DE ALIMENTOS ANIMALES EN FRUTOS SECOS DE ASIA-PACÍFICO, POR REGIÓN, 2018-2032 (MILES DE USD)
TABLA 157 MERCADO DE ALIMENTOS ANIMALES EN FRUTOS SECOS DE ASIA-PACÍFICO, POR TIPO, 2018-2032 (MILES DE USD)
TABLA 158 OTROS MERCADOS DE FRUTOS SECOS DE ASIA-PACÍFICO, POR REGIÓN, 2018-2032 (MILES DE USD)
TABLA 159 MERCADO DE FRUTOS SECOS DE ASIA-PACÍFICO, POR CANAL DE DISTRIBUCIÓN, 2018-2032 (MILES DE USD)
TABLA 160 MERCADO B2B DE FRUTOS SECOS EN ASIA-PACÍFICO, POR REGIÓN, 2018-2032 (MILES DE USD)
TABLA 161 MERCADO DE FRUTOS SECOS B2C DE ASIA-PACÍFICO, POR REGIÓN, 2018-2032 (MILES DE USD)
TABLA 162 MERCADO DE FRUTOS SECOS B2C DE ASIA-PACÍFICO, POR TIPO, 2018-2032 (MILES DE USD)
TABLA 163 MERCADO DE FRUTOS SECOS SIN CONEXIÓN EN ASIA-PACÍFICO, POR TIPO, 2018-2032 (MILES DE USD)
TABLA 164 MERCADO DE FRUTOS SECOS EN LÍNEA EN ASIA-PACÍFICO, POR TIPO, 2018-2032 (MILES DE USD)
CUADRO 165 MERCADO DE FRUTOS SECOS DE ASIA-PACÍFICO, POR PAÍS, 2018-2032 (MILES DE USD)
TABLA 166 MERCADO DE FRUTOS SECOS DE ASIA-PACÍFICO, POR TIPO DE PRODUCTO, 2018-2032 (MILES DE USD)
CUADRO 167 MERCADO DE FRUTOS SECOS DE ASIA-PACÍFICO, POR TIPO DE PRODUCTO, 2018-2032 (MILES DE TONELADAS)
TABLA 168 NUECES DE ASIA-PACÍFICO EN EL MERCADO DE NUECES, POR TIPO, 2018-2032 (MILES DE USD)
TABLA 169 MERCADO DE FRUTOS SECOS DE ASIA-PACÍFICO, POR CACAHUATE, 2018-2032 (MILES DE USD)
TABLA 170 NUECES HÍBRIDAS/OTRAS EN EL MERCADO DE NUECES DE ASIA-PACÍFICO, POR TIPO, 2018-2032 (MILES DE USD)
TABLA 171 MERCADO DE FRUTOS SECOS DE ASIA-PACÍFICO, POR FORMA, 2018-2032 (MILES DE USD)
TABLA 172 MERCADO DE FRUTOS SECOS DE ASIA-PACÍFICO, POR NATURALEZA, 2018-2032 (MILES DE USD)
CUADRO 173 MERCADO DE FRUTOS SECOS DE ASIA-PACÍFICO, POR MÉTODO DE PROCESAMIENTO, 2018-2032 (MILES DE USD)
TABLA 174 MERCADO DE FRUTOS SECOS TOSTADOS DE ASIA-PACÍFICO, POR TIPO, 2018-2032 (MILES DE USD)
TABLA 175 MERCADO DE FRUTOS SECOS CON SABOR A ASIA-PACÍFICO, POR TIPO, 2018-2032 (MILES DE USD)
TABLA 176 MERCADO DE FRUTOS SECOS DE ASIA-PACÍFICO, POR GRADO, 2018-2032 (MILES DE USD)
TABLA 177 MERCADO DE FRUTOS SECOS DE ASIA-PACÍFICO, POR VIDA ÚTIL, 2018-2032 (MILES DE USD)
TABLA 178 MERCADO DE FRUTOS SECOS DE ASIA-PACÍFICO, POR CERTIFICACIÓN, 2018-2032 (MILES DE USD)
TABLA 179 MERCADO DE FRUTOS SECOS DE ASIA-PACÍFICO, POR ENVASE, 2018-2032 (MILES DE USD)
TABLA 180 BOLSAS DE PLÁSTICO EN EL MERCADO DE FRUTOS SECOS DE ASIA-PACÍFICO, POR TIPO, 2018-2032 (MILES DE USD)
TABLA 181 MERCADO DE FRUTOS SECOS DE ASIA-PACÍFICO, POR TAMAÑO DE ENVASE, 2018-2032 (MILES DE USD)
CUADRO 182 MERCADO DE FRUTOS SECOS DE ASIA-PACÍFICO, POR RANGO DE PRECIOS, 2018-2032 (MILES DE USD)
CUADRO 183 MERCADO DE FRUTOS SECOS DE ASIA-PACÍFICO, POR USO FINAL, 2018-2032 (MILES DE USD)
TABLA 184 MERCADO DE NUTRICIÓN FUNCIONAL DE FRUTOS SECOS EN ASIA-PACÍFICO, POR TIPO, 2018-2032 (MILES DE USD)
TABLA 185 INDUSTRIA DE BEBIDAS DE ASIA-PACÍFICO EN EL MERCADO DE FRUTOS SECOS, POR TIPO, 2018-2032 (MILES DE USD)
TABLA 186 MERCADO DE FRUTOS SECOS EN LA REGIÓN DE ASIA-PACÍFICO, POR TIPO, 2018-2032 (MILES DE USD)
TABLA 187 PRODUCTOS DE CUIDADO PERSONAL EN EL MERCADO DE FRUTOS SECOS DE ASIA-PACÍFICO, POR TIPO, 2018-2032 (MILES DE USD)
TABLA 188 USOS DE PRODUCTOS DE ORIGEN BIOLÓGICO Y AGROINDUSTRIALES EN EL MERCADO DE FRUTOS SECOS DE ASIA-PACÍFICO, POR TIPO, 2018-2032 (MILES DE USD)
TABLA 189 MERCADO DE ALIMENTOS ANIMALES EN FRUTOS SECOS DE ASIA-PACÍFICO, POR TIPO, 2018-2032 (MILES DE USD)
CUADRO 190 MERCADO DE FRUTOS SECOS DE ASIA-PACÍFICO, POR CANAL DE DISTRIBUCIÓN, 2018-2032 (MILES DE USD)
TABLA 191 MERCADO DE FRUTOS SECOS B2C DE ASIA-PACÍFICO, POR TIPO, 2018-2032 (MILES DE USD)
TABLA 192 MERCADO DE FRUTOS SECOS SIN CONEXIÓN EN ASIA-PACÍFICO, POR TIPO, 2018-2032 (MILES DE USD)
TABLA 193 MERCADO DE FRUTOS SECOS EN LÍNEA EN ASIA-PACÍFICO, POR TIPO, 2018-2032 (MILES DE USD)
TABLA 194 MERCADO DE NUECES DE CHINA, POR TIPO DE PRODUCTO, 2018-2032 (MILES DE USD)
TABLA 195 MERCADO DE NUECES DE CHINA, POR TIPO DE PRODUCTO, 2018-2032 (MILES DE TONELADAS)
TABLA 196 NUECES DE ÁRBOL DE CHINA EN EL MERCADO DE NUECES, POR TIPO, 2018-2032 (MILES DE USD)
TABLA 197 NUECES DE MANÍ DE CHINA EN EL MERCADO DE NUECES, POR CACAHUATE, 2018-2032 (MILES DE USD)
TABLA 198 NUECES HÍBRIDAS/OTRAS DE CHINA EN EL MERCADO DE NUECES, POR TIPO, 2018-2032 (MILES DE USD)
TABLA 199 MERCADO DE NUECES DE CHINA, POR FORMA, 2018-2032 (MILES DE USD)
TABLA 200 MERCADO DE NUECES DE CHINA, POR NATURALEZA, 2018-2032 (MILES DE USD)
TABLA 201 MERCADO DE NUECES DE CHINA, POR MÉTODO DE PROCESAMIENTO, 2018-2032 (MILES DE USD)
TABLA 202 MERCADO DE FRUTOS SECOS TOSTADOS DE CHINA, POR TIPO, 2018-2032 (MILES DE USD)
TABLA 203 MERCADO DE FRUTOS SECOS CON SABOR A CHINA, POR TIPO, 2018-2032 (MILES DE USD)
TABLA 204 MERCADO DE NUECES DE CHINA, POR GRADO, 2018-2032 (MILES DE USD)
TABLA 205 MERCADO DE NUECES DE CHINA, POR VIDA ÚTIL, 2018-2032 (MILES DE USD)
TABLA 206 MERCADO DE NUECES DE CHINA, POR CERTIFICACIÓN, 2018-2032 (MILES DE USD)
TABLA 207 MERCADO DE NUECES DE CHINA, POR ENVASE, 2018-2032 (MILES DE USD)
TABLA 208 BOLSAS DE PLÁSTICO DE CHINA EN EL MERCADO DE FRUTOS SECOS, POR TIPO, 2018-2032 (MILES DE USD)
TABLA 209 MERCADO DE NUECES DE CHINA, POR TAMAÑO DE ENVASE, 2018-2032 (MILES DE USD)
TABLA 210 MERCADO DE NUECES DE CHINA, POR RANGO DE PRECIOS, 2018-2032 (MILES DE USD)
TABLA 211 MERCADO DE NUECES DE CHINA, POR USO FINAL, 2018-2032 (MILES DE USD)
TABLA 212 MERCADO DE NUTRICIÓN FUNCIONAL DE NUECES EN CHINA, POR TIPO, 2018-2032 (MILES DE USD)
TABLA 213 INDUSTRIA DE BEBIDAS DE CHINA EN EL MERCADO DE FRUTOS SECOS, POR TIPO, 2018-2032 (MILES DE USD)
TABLA 214 MERCADO DE NUECES EN CHINA, POR TIPO, 2018-2032 (MILES DE USD)
TABLA 215 PRODUCTOS DE CUIDADO PERSONAL EN EL MERCADO DE FRUTOS SECOS DE CHINA, POR TIPO, 2018-2032 (MILES DE USD)
TABLA 216 USOS DE PRODUCTOS DE ORIGEN BIOLÓGICO Y AGROINDUSTRIALES EN EL MERCADO DE FRUTOS SECOS DE CHINA, POR TIPO, 2018-2032 (MILES DE USD)
TABLA 217 MERCADO DE ALIMENTOS ANIMALES EN NUECES DE CHINA, POR TIPO, 2018-2032 (MILES DE USD)
TABLA 218 MERCADO DE NUECES DE CHINA, POR CANAL DE DISTRIBUCIÓN, 2018-2032 (MILES DE USD)
TABLA 219 MERCADO DE NUECES B2C DE CHINA, POR TIPO, 2018-2032 (MILES DE USD)
TABLA 220 CHINA DESCONECTADA EN EL MERCADO DE FRUTOS SECOS, POR TIPO, 2018-2032 (MILES DE USD)
TABLA 221 PARTICIPACIÓN EN EL MERCADO DE FRUTOS SECOS DE CHINA, POR TIPO, 2018-2032 (MILES DE USD)
TABLA 222 MERCADO DE NUECES DE LA INDIA, POR TIPO DE PRODUCTO, 2018-2032 (MILES DE USD)
TABLA 223 MERCADO DE NUECES DE LA INDIA, POR TIPO DE PRODUCTO, 2018-2032 (MILES DE TONELADAS)
TABLA 224 NUECES EN EL MERCADO DE NUECES DE LA INDIA, POR TIPO, 2018-2032 (MILES DE USD)
TABLA 225 NUECES DE MANÍ EN EL MERCADO DE NUECES DE LA INDIA, POR CACAHUATE, 2018-2032 (MILES DE USD)
TABLA 226 INDIA NUECES HÍBRIDAS/OTRAS EN EL MERCADO DE NUECES, POR TIPO, 2018-2032 (MILES DE USD)
TABLA 227 MERCADO DE NUECES DE LA INDIA, POR FORMA, 2018-2032 (MILES DE USD)
TABLA 228 MERCADO DE NUECES DE LA INDIA, POR NATURALEZA, 2018-2032 (MILES DE USD)
TABLA 229 MERCADO DE NUECES DE LA INDIA, POR MÉTODO DE PROCESAMIENTO, 2018-2032 (MILES DE USD)
TABLA 230 MERCADO DE FRUTOS SECOS TOSTADOS EN INDIA, POR TIPO, 2018-2032 (MILES DE USD)
TABLA 231 MERCADO DE FRUTOS SECOS SABORIZADOS EN INDIA, POR TIPO, 2018-2032 (MILES DE USD)
TABLA 232 MERCADO DE NUECES DE LA INDIA, POR GRADO, 2018-2032 (MILES DE USD)
TABLA 233 MERCADO DE NUECES DE LA INDIA, POR VIDA ÚTIL, 2018-2032 (MILES DE USD)
TABLA 234 MERCADO DE NUECES DE LA INDIA, POR CERTIFICACIÓN, 2018-2032 (MILES DE USD)
TABLA 235 MERCADO DE FRUTOS SECOS DE LA INDIA, POR ENVASE, 2018-2032 (MILES DE USD)
TABLA 236 BOLSAS DE PLÁSTICO EN EL MERCADO DE FRUTOS SECOS DE LA INDIA, POR TIPO, 2018-2032 (MILES DE USD)
TABLA 237 MERCADO DE NUECES DE LA INDIA, POR TAMAÑO DE ENVASE, 2018-2032 (MILES DE USD)
TABLA 238 MERCADO DE NUECES DE LA INDIA, POR RANGO DE PRECIOS, 2018-2032 (MILES DE USD)
TABLA 239 MERCADO DE NUECES DE LA INDIA, POR USO FINAL, 2018-2032 (MILES DE USD)
TABLA 240 NUTRICIÓN FUNCIONAL EN EL MERCADO DE FRUTOS SECOS DE LA INDIA, POR TIPO, 2018-2032 (MILES DE USD)
TABLA 241 INDUSTRIA DE BEBIDAS EN EL MERCADO DE FRUTOS SECOS DE LA INDIA, POR TIPO, 2018-2032 (MILES DE USD)
TABLA 242 MERCADO DE FRUTOS SECOS EN LA INDIA, POR TIPO, 2018-2032 (MILES DE USD)
TABLA 243 PRODUCTOS DE CUIDADO PERSONAL EN EL MERCADO DE FRUTOS SECOS DE LA INDIA, POR TIPO, 2018-2032 (MILES DE USD)
TABLA 244 USOS DE ORIGEN BIOLÓGICO Y AGROINDUSTRIAL EN EL MERCADO DE FRUTOS SECOS DE LA INDIA, POR TIPO, 2018-2032 (MILES DE USD)
TABLA 245 MERCADO DE ALIMENTOS ANIMALES EN NUECES DE LA INDIA, POR TIPO, 2018-2032 (MILES DE USD)
TABLA 246 MERCADO DE NUECES DE LA INDIA, POR CANAL DE DISTRIBUCIÓN, 2018-2032 (MILES DE USD)
TABLA 247 INDIA B2C EN EL MERCADO DE FRUTOS SECOS, POR TIPO, 2018-2032 (MILES DE USD)
TABLA 248 INDIA SIN CONEXIÓN EN EL MERCADO DE FRUTOS SECOS, POR TIPO, 2018-2032 (MILES DE USD)
TABLA 249 INDIA EN EL MERCADO DE FRUTOS SECOS EN LÍNEA, POR TIPO, 2018-2032 (MILES DE USD)
TABLA 250 MERCADO DE FRUTOS SECOS DE JAPÓN, POR TIPO DE PRODUCTO, 2018-2032 (MILES DE USD)
TABLA 251 MERCADO DE FRUTOS SECOS DE JAPÓN, POR TIPO DE PRODUCTO, 2018-2032 (MILES DE TONELADAS)
TABLA 252 NUECES DE ÁRBOL EN EL MERCADO DE NUECES DE JAPÓN, POR TIPO, 2018-2032 (MILES DE USD)
TABLA 253 NUECES DE CACAHUATE EN EL MERCADO DE NUECES DE JAPÓN, POR CACAHUATE, 2018-2032 (MILES DE USD)
TABLA 254 NUECES HÍBRIDAS/OTRAS EN EL MERCADO DE NUECES DE JAPÓN, POR TIPO, 2018-2032 (MILES DE USD)
TABLA 255 MERCADO DE FRUTOS SECOS DE JAPÓN, POR FORMA, 2018-2032 (MILES DE USD)
TABLA 256 MERCADO DE FRUTOS SECOS DE JAPÓN, POR NATURALEZA, 2018-2032 (MILES DE USD)
TABLA 257 MERCADO DE NUECES DE JAPÓN, POR MÉTODO DE PROCESAMIENTO, 2018-2032 (MILES DE USD)
TABLA 258 MERCADO DE FRUTOS SECOS TOSTADOS EN JAPÓN, POR TIPO, 2018-2032 (MILES DE USD)
TABLA 259 MERCADO DE FRUTOS SECOS CON SABOR A JAPÓN, POR TIPO, 2018-2032 (MILES DE USD)
TABLA 260 MERCADO DE FRUTOS SECOS DE JAPÓN, POR GRADO, 2018-2032 (MILES DE USD)
TABLA 261 MERCADO DE FRUTOS SECOS DE JAPÓN, POR VIDA ÚTIL, 2018-2032 (MILES DE USD)
TABLA 262 MERCADO DE NUECES JAPONESAS, POR CERTIFICACIÓN, 2018-2032 (MILES DE USD)
TABLA 263 MERCADO DE FRUTOS SECOS DE JAPÓN, POR ENVASE, 2018-2032 (MILES DE USD)
TABLA 264 BOLSAS DE PLÁSTICO EN EL MERCADO DE FRUTOS SECOS DE JAPÓN, POR TIPO, 2018-2032 (MILES DE USD)
TABLA 265 MERCADO DE FRUTOS SECOS DE JAPÓN, POR TAMAÑO DE ENVASE, 2018-2032 (MILES DE USD)
TABLA 266 MERCADO DE NUECES JAPONESAS, POR RANGO DE PRECIOS, 2018-2032 (MILES DE USD)
TABLA 267 MERCADO DE FRUTOS SECOS DE JAPÓN, POR USO FINAL, 2018-2032 (MILES DE USD)
TABLA 268 MERCADO DE NUTRICIÓN FUNCIONAL DE FRUTOS SECOS EN JAPÓN, POR TIPO, 2018-2032 (MILES DE USD)
TABLA 269 INDUSTRIA DE BEBIDAS EN EL MERCADO DE FRUTOS SECOS DE JAPÓN, POR TIPO, 2018-2032 (MILES DE USD)
TABLA 270 MERCADO DE NUECES Y ARTÍCULOS CULINARIOS DE JAPÓN, POR TIPO, 2018-2032 (MILES DE USD)
TABLA 271 PRODUCTOS DE CUIDADO PERSONAL EN EL MERCADO DE FRUTOS SECOS DE JAPÓN, POR TIPO, 2018-2032 (MILES DE USD)
TABLA 272 USOS DE PRODUCTOS DE ORIGEN BIOLÓGICO Y AGROINDUSTRIALES EN EL MERCADO DE FRUTOS SECOS DE JAPÓN, POR TIPO, 2018-2032 (MILES DE USD)
TABLA 273 MERCADO DE ALIMENTOS ANIMALES EN NUECES DE JAPÓN, POR TIPO, 2018-2032 (MILES DE USD)
TABLA 274 MERCADO DE NUECES JAPONESAS, POR CANAL DE DISTRIBUCIÓN, 2018-2032 (MILES DE USD)
TABLA 275 MERCADO DE NUECES B2C EN JAPÓN, POR TIPO, 2018-2032 (MILES DE USD)
TABLA 276 JAPÓN SIN CONEXIÓN EN EL MERCADO DE FRUTOS SECOS, POR TIPO, 2018-2032 (MILES DE USD)
TABLA 277 MERCADO DE FRUTOS SECOS EN LÍNEA EN JAPÓN, POR TIPO, 2018-2032 (MILES DE USD)
TABLA 278 MERCADO DE FRUTOS SECOS DE COREA DEL SUR, POR TIPO DE PRODUCTO, 2018-2032 (MILES DE USD)
TABLA 279 MERCADO DE FRUTOS SECOS DE COREA DEL SUR, POR TIPO DE PRODUCTO, 2018-2032 (MILES DE TONELADAS)
TABLA 280 NUECES DE COREA DEL SUR EN EL MERCADO DE NUECES, POR TIPO, 2018-2032 (MILES DE USD)
TABLA 281 NUECES DE COREA DEL SUR EN EL MERCADO DE NUECES, POR CACAHUATE, 2018-2032 (MILES DE USD)
TABLA 282 NUECES HÍBRIDAS/OTRAS DE COREA DEL SUR EN EL MERCADO DE NUECES, POR TIPO, 2018-2032 (MILES DE USD)
TABLA 283 MERCADO DE FRUTOS SECOS DE COREA DEL SUR, POR FORMA, 2018-2032 (MILES DE USD)
TABLA 284 MERCADO DE FRUTOS SECOS DE COREA DEL SUR, POR NATURALEZA, 2018-2032 (MILES DE USD)
TABLA 285 MERCADO DE FRUTOS SECOS DE COREA DEL SUR, POR MÉTODO DE PROCESAMIENTO, 2018-2032 (MILES DE USD)
TABLA 286 MERCADO DE FRUTOS SECOS TOSTADOS DE COREA DEL SUR, POR TIPO, 2018-2032 (MILES DE USD)
TABLA 287 MERCADO DE FRUTOS SECOS CON SABOR A COREA DEL SUR, POR TIPO, 2018-2032 (MILES DE USD)
TABLA 288 MERCADO DE FRUTOS SECOS DE COREA DEL SUR, POR GRADO, 2018-2032 (MILES DE USD)
TABLA 289 MERCADO DE FRUTOS SECOS DE COREA DEL SUR, POR VIDA ÚTIL, 2018-2032 (MILES DE USD)
TABLA 290 MERCADO DE FRUTOS SECOS DE COREA DEL SUR, POR CERTIFICACIÓN, 2018-2032 (MILES DE USD)
TABLA 291 MERCADO DE FRUTOS SECOS DE COREA DEL SUR, POR ENVASE, 2018-2032 (MILES DE USD)
TABLA 292 BOLSAS DE PLÁSTICO DE COREA DEL SUR EN EL MERCADO DE FRUTOS SECOS, POR TIPO, 2018-2032 (MILES DE USD)
TABLA 293 MERCADO DE FRUTOS SECOS DE COREA DEL SUR, POR TAMAÑO DE ENVASE, 2018-2032 (MILES DE USD)
TABLA 294 MERCADO DE FRUTOS SECOS DE COREA DEL SUR, POR RANGO DE PRECIOS, 2018-2032 (MILES DE USD)
CUADRO 295 MERCADO DE FRUTOS SECOS DE COREA DEL SUR, POR USO FINAL, 2018-2032 (MILES DE USD)
TABLA 296 MERCADO DE NUTRICIÓN FUNCIONAL DE COREA DEL SUR EN FRUTOS SECOS, POR TIPO, 2018-2032 (MILES DE USD)
TABLA 297 INDUSTRIA DE BEBIDAS DE COREA DEL SUR EN EL MERCADO DE FRUTOS SECOS, POR TIPO, 2018-2032 (MILES DE USD)
TABLA 298 MERCADO DE FRUTOS SECOS DE COREA DEL SUR, POR TIPO, 2018-2032 (MILES DE USD)
TABLA 299 PRODUCTOS DE CUIDADO PERSONAL DE COREA DEL SUR EN EL MERCADO DE FRUTOS SECOS, POR TIPO, 2018-2032 (MILES DE USD)
TABLA 300 USOS DE PRODUCTOS DE ORIGEN BIOLÓGICO Y AGROINDUSTRIALES EN EL MERCADO DE FRUTOS SECOS DE COREA DEL SUR, POR TIPO, 2018-2032 (MILES DE USD)
TABLA 301 MERCADO DE ALIMENTOS ANIMALES EN FRUTOS SECOS DE COREA DEL SUR, POR TIPO, 2018-2032 (MILES DE USD)
TABLA 302 MERCADO DE FRUTOS SECOS DE COREA DEL SUR, POR CANAL DE DISTRIBUCIÓN, 2018-2032 (MILES DE USD)
TABLA 303 MERCADO DE FRUTOS SECOS B2C DE COREA DEL SUR, POR TIPO, 2018-2032 (MILES DE USD)
TABLA 304 COREA DEL SUR SIN CONEXIÓN EN EL MERCADO DE FRUTOS SECOS, POR TIPO, 2018-2032 (MILES DE USD)
TABLA 305 MERCADO DE FRUTOS SECOS EN LÍNEA DE COREA DEL SUR, POR TIPO, 2018-2032 (MILES DE USD)
TABLA 306 MERCADO DE FRUTOS SECOS DE AUSTRALIA, POR TIPO DE PRODUCTO, 2018-2032 (MILES DE USD)
TABLA 307 MERCADO DE FRUTOS SECOS DE AUSTRALIA, POR TIPO DE PRODUCTO, 2018-2032 (MILES DE TONELADAS)
TABLA 308 NUECES EN EL MERCADO DE NUECES DE AUSTRALIA, POR TIPO, 2018-2032 (MILES DE USD)
TABLA 309 AUSTRALIA: CACAHUATES EN EL MERCADO DE FRUTOS SECOS, POR CACAHUATE, 2018-2032 (MILES DE USD)
TABLA 310 NUECES HÍBRIDAS/OTRAS EN EL MERCADO DE NUECES DE AUSTRALIA, POR TIPO, 2018-2032 (MILES DE USD)
TABLA 311 MERCADO DE FRUTOS SECOS DE AUSTRALIA, POR FORMA, 2018-2032 (MILES DE USD)
TABLA 312 MERCADO DE FRUTOS SECOS DE AUSTRALIA, POR NATURALEZA, 2018-2032 (MILES DE USD)
TABLA 313 MERCADO DE FRUTOS SECOS DE AUSTRALIA, POR MÉTODO DE PROCESAMIENTO, 2018-2032 (MILES DE USD)
TABLA 314 MERCADO DE FRUTOS SECOS TOSTADOS DE AUSTRALIA, POR TIPO, 2018-2032 (MILES DE USD)
TABLA 315 MERCADO DE FRUTOS SECOS SABORIZADOS EN AUSTRALIA, POR TIPO, 2018-2032 (MILES DE USD)
TABLA 316 MERCADO DE FRUTOS SECOS DE AUSTRALIA, POR GRADO, 2018-2032 (MILES DE USD)
TABLA 317 MERCADO DE FRUTOS SECOS DE AUSTRALIA, POR VIDA ÚTIL, 2018-2032 (MILES DE USD)
TABLA 318 MERCADO DE FRUTOS SECOS DE AUSTRALIA, POR CERTIFICACIÓN, 2018-2032 (MILES DE USD)
TABLA 319 MERCADO DE FRUTOS SECOS DE AUSTRALIA, POR ENVASE, 2018-2032 (MILES DE USD)
TABLA 320 BOLSAS DE PLÁSTICO EN EL MERCADO DE FRUTOS SECOS DE AUSTRALIA, POR TIPO, 2018-2032 (MILES DE USD)
TABLA 321 MERCADO DE FRUTOS SECOS DE AUSTRALIA, POR TAMAÑO DE ENVASE, 2018-2032 (MILES DE USD)
TABLA 322 MERCADO DE FRUTOS SECOS DE AUSTRALIA, POR RANGO DE PRECIOS, 2018-2032 (MILES DE USD)
TABLA 323 MERCADO DE FRUTOS SECOS DE AUSTRALIA, POR USO FINAL, 2018-2032 (MILES DE USD)
TABLA 324 MERCADO DE NUTRICIÓN FUNCIONAL DE FRUTOS SECOS DE AUSTRALIA, POR TIPO, 2018-2032 (MILES DE USD)
TABLA 325 INDUSTRIA DE BEBIDAS DE AUSTRALIA EN EL MERCADO DE FRUTOS SECOS, POR TIPO, 2018-2032 (MILES DE USD)
TABLA 326 MERCADO DE FRUTOS SECOS EN AUSTRALIA, POR TIPO, 2018-2032 (MILES DE USD)
TABLA 327 PRODUCTOS DE CUIDADO PERSONAL EN EL MERCADO DE FRUTOS SECOS DE AUSTRALIA, POR TIPO, 2018-2032 (MILES DE USD)
TABLA 328 USOS BIOLÓGICOS Y AGROINDUSTRIALES EN EL MERCADO DE FRUTOS SECOS DE AUSTRALIA, POR TIPO, 2018-2032 (MILES DE USD)
TABLA 329 MERCADO DE ALIMENTOS ANIMALES EN FRUTOS SECOS DE AUSTRALIA, POR TIPO, 2018-2032 (MILES DE USD)
TABLA 330 MERCADO DE FRUTOS SECOS DE AUSTRALIA, POR CANAL DE DISTRIBUCIÓN, 2018-2032 (MILES DE USD)
TABLA 331 MERCADO DE FRUTOS SECOS B2C DE AUSTRALIA, POR TIPO, 2018-2032 (MILES DE USD)
TABLA 332 AUSTRALIA FUERA DE LÍNEA EN EL MERCADO DE FRUTOS SECOS, POR TIPO, 2018-2032 (MILES DE USD)
TABLA 333 AUSTRALIA EN EL MERCADO DE FRUTOS SECOS EN LÍNEA, POR TIPO, 2018-2032 (MILES DE USD)
TABLA 334 MERCADO DE FRUTOS SECOS DE MALASIA, POR TIPO DE PRODUCTO, 2018-2032 (MILES DE USD)
TABLA 335 MERCADO DE FRUTOS SECOS DE MALASIA, POR TIPO DE PRODUCTO, 2018-2032 (MILES DE TONELADAS)
TABLA 336 NUECES DE MALASIA EN EL MERCADO DE NUECES, POR TIPO, 2018-2032 (MILES DE USD)
TABLA 337 NUECES DE MANÍ DE MALASIA EN EL MERCADO DE NUECES, POR CACAHUATE, 2018-2032 (MILES DE USD)
TABLA 338 NUECES HÍBRIDAS/OTRAS DE MALASIA EN EL MERCADO DE NUECES, POR TIPO, 2018-2032 (MILES DE USD)
TABLA 339 MERCADO DE FRUTOS SECOS DE MALASIA, POR FORMA, 2018-2032 (MILES DE USD)
TABLA 340 MERCADO DE FRUTOS SECOS DE MALASIA, POR NATURALEZA, 2018-2032 (MILES DE USD)
TABLA 341 MERCADO DE NUECES DE MALASIA, POR MÉTODO DE PROCESAMIENTO, 2018-2032 (MILES DE USD)
TABLA 342 MERCADO DE FRUTOS SECOS TOSTADOS DE MALASIA, POR TIPO, 2018-2032 (MILES DE USD)
TABLA 343 MERCADO DE FRUTOS SECOS CON SABOR A MALASIA, POR TIPO, 2018-2032 (MILES DE USD)
TABLA 344 MERCADO DE FRUTOS SECOS DE MALASIA, POR GRADO, 2018-2032 (MILES DE USD)
TABLA 345 MERCADO DE FRUTOS SECOS DE MALASIA, POR VIDA ÚTIL, 2018-2032 (MILES DE USD)
TABLA 346 MERCADO DE FRUTOS SECOS DE MALASIA, POR CERTIFICACIÓN, 2018-2032 (MILES DE USD)
TABLA 347 MERCADO DE FRUTOS SECOS DE MALASIA, POR ENVASE, 2018-2032 (MILES DE USD)
TABLA 348 BOLSAS DE PLÁSTICO EN EL MERCADO DE FRUTOS SECOS DE MALASIA, POR TIPO, 2018-2032 (MILES DE USD)
TABLA 349 MERCADO DE FRUTOS SECOS DE MALASIA, POR TAMAÑO DE ENVASE, 2018-2032 (MILES DE USD)
TABLA 350 MERCADO DE FRUTOS SECOS DE MALASIA, POR RANGO DE PRECIOS, 2018-2032 (MILES DE USD)
TABLA 351 MERCADO DE FRUTOS SECOS DE MALASIA, POR USO FINAL, 2018-2032 (MILES DE USD)
TABLA 352 MERCADO DE NUTRICIÓN FUNCIONAL DE FRUTOS SECOS DE MALASIA, POR TIPO, 2018-2032 (MILES DE USD)
TABLA 353 INDUSTRIA DE BEBIDAS DE MALASIA EN EL MERCADO DE FRUTOS SECOS, POR TIPO, 2018-2032 (MILES DE USD)
TABLA 354 MERCADO DE NUECES Y PRODUCTOS CULINARIOS DE MALASIA, POR TIPO, 2018-2032 (MILES DE USD)
TABLA 355 PRODUCTOS DE CUIDADO PERSONAL EN EL MERCADO DE FRUTOS SECOS DE MALASIA, POR TIPO, 2018-2032 (MILES DE USD)
TABLA 356 USOS BIOLÓGICOS Y AGROINDUSTRIALES EN EL MERCADO DE FRUTOS SECOS DE MALASIA, POR TIPO, 2018-2032 (MILES DE USD)
TABLA 357 MERCADO DE ALIMENTOS ANIMALES EN FRUTOS SECOS DE MALASIA, POR TIPO, 2018-2032 (MILES DE USD)
TABLA 358 MERCADO DE FRUTOS SECOS DE MALASIA, POR CANAL DE DISTRIBUCIÓN, 2018-2032 (MILES DE USD)
TABLA 359 MERCADO DE NUECES B2C DE MALASIA, POR TIPO, 2018-2032 (MILES DE USD)
TABLA 360 MALASIA SIN CONEXIÓN EN EL MERCADO DE FRUTOS SECOS, POR TIPO, 2018-2032 (MILES DE USD)
TABLA 361 MERCADO DE FRUTOS SECOS EN LÍNEA DE MALASIA, POR TIPO, 2018-2032 (MILES DE USD)
TABLA 362 MERCADO DE FRUTOS SECOS DE INDONESIA, POR TIPO DE PRODUCTO, 2018-2032 (MILES DE USD)
TABLA 363 MERCADO DE FRUTOS SECOS DE INDONESIA, POR TIPO DE PRODUCTO, 2018-2032 (MILES DE TONELADAS)
TABLA 364 NUECES EN EL MERCADO DE NUECES DE INDONESIA, POR TIPO, 2018-2032 (MILES DE USD)
TABLA 365. MERCADO DE FRUTOS SECOS DE INDONESIA, POR CACAHUATE, 2018-2032 (MILES DE USD)
TABLA 366 NUECES HÍBRIDAS/OTRAS EN EL MERCADO DE NUECES DE INDONESIA, POR TIPO, 2018-2032 (MILES DE USD)
TABLA 367 MERCADO DE FRUTOS SECOS DE INDONESIA, POR FORMA, 2018-2032 (MILES DE USD)
TABLA 368 MERCADO DE FRUTOS SECOS DE INDONESIA, POR NATURALEZA, 2018-2032 (MILES DE USD)
TABLA 369 MERCADO DE FRUTOS SECOS DE INDONESIA, POR MÉTODO DE PROCESAMIENTO, 2018-2032 (MILES DE USD)
TABLA 370 MERCADO DE FRUTOS SECOS TOSTADOS DE INDONESIA, POR TIPO, 2018-2032 (MILES DE USD)
TABLA 371 MERCADO DE FRUTOS SECOS SABORIZADOS EN INDONESIA, POR TIPO, 2018-2032 (MILES DE USD)
TABLA 372 MERCADO DE FRUTOS SECOS DE INDONESIA, POR GRADO, 2018-2032 (MILES DE USD)
TABLA 373 MERCADO DE FRUTOS SECOS DE INDONESIA, POR VIDA ÚTIL, 2018-2032 (MILES DE USD)
TABLA 374 MERCADO DE FRUTOS SECOS DE INDONESIA, POR CERTIFICACIÓN, 2018-2032 (MILES DE USD)
TABLA 375 MERCADO DE FRUTOS SECOS DE INDONESIA, POR ENVASE, 2018-2032 (MILES DE USD)
TABLA 376 BOLSAS DE PLÁSTICO EN EL MERCADO DE FRUTOS SECOS DE INDONESIA, POR TIPO, 2018-2032 (MILES DE USD)
TABLA 377 MERCADO DE FRUTOS SECOS DE INDONESIA, POR TAMAÑO DE ENVASE, 2018-2032 (MILES DE USD)
TABLA 378 MERCADO DE FRUTOS SECOS DE INDONESIA, POR RANGO DE PRECIOS, 2018-2032 (MILES DE USD)
CUADRO 379 MERCADO DE FRUTOS SECOS DE INDONESIA, POR USO FINAL, 2018-2032 (MILES DE USD)
TABLA 380 MERCADO DE NUTRICIÓN FUNCIONAL DE FRUTOS SECOS DE INDONESIA, POR TIPO, 2018-2032 (MILES DE USD)
TABLA 381 INDUSTRIA DE BEBIDAS EN EL MERCADO DE FRUTOS SECOS DE INDONESIA, POR TIPO, 2018-2032 (MILES DE USD)
TABLA 382 MERCADO DE NUECES Y PRODUCTOS CULINARIOS DE INDONESIA, POR TIPO, 2018-2032 (MILES DE USD)
TABLA 383 PRODUCTOS DE CUIDADO PERSONAL EN EL MERCADO DE FRUTOS SECOS DE INDONESIA, POR TIPO, 2018-2032 (MILES DE USD)
TABLA 384 USOS BIOLÓGICOS Y AGROINDUSTRIALES EN EL MERCADO DE FRUTOS SECOS DE INDONESIA, POR TIPO, 2018-2032 (MILES DE USD)
TABLA 385 MERCADO DE ALIMENTOS ANIMALES EN NUECES DE INDONESIA, POR TIPO, 2018-2032 (MILES DE USD)
TABLA 386 MERCADO DE FRUTOS SECOS DE INDONESIA, POR CANAL DE DISTRIBUCIÓN, 2018-2032 (MILES DE USD)
TABLA 387 INDONESIA B2C MERCADO DE FRUTOS SECOS, POR TIPO, 2018-2032 (MILES DE USD)
TABLA 388 INDONESIA FUERA DE LÍNEA EN EL MERCADO DE FRUTOS SECOS, POR TIPO, 2018-2032 (MILES DE USD)
TABLA 389 MERCADO DE FRUTOS SECOS EN LÍNEA DE INDONESIA, POR TIPO, 2018-2032 (MILES DE USD)
TABLA 390 MERCADO DE FRUTOS SECOS DE TAILANDIA, POR TIPO DE PRODUCTO, 2018-2032 (MILES DE USD)
TABLA 391 MERCADO DE FRUTOS SECOS DE TAILANDIA, POR TIPO DE PRODUCTO, 2018-2032 (MILES DE TONELADAS)
TABLA 392 NUECES DE TAILANDIA EN EL MERCADO DE NUECES, POR TIPO, 2018-2032 (MILES DE USD)
TABLA 393 NUECES DE CACAHUATE EN EL MERCADO DE NUECES DE TAILANDIA, POR CACAHUATE, 2018-2032 (MILES DE USD)
TABLA 394 NUECES HÍBRIDAS/OTRAS EN EL MERCADO DE NUECES DE TAILANDIA, POR TIPO, 2018-2032 (MILES DE USD)
TABLA 395 MERCADO DE FRUTOS SECOS DE TAILANDIA, POR FORMA, 2018-2032 (MILES DE USD)
TABLA 396 MERCADO DE FRUTOS SECOS DE TAILANDIA, POR NATURALEZA, 2018-2032 (MILES DE USD)
TABLA 397 MERCADO DE FRUTOS SECOS DE TAILANDIA, POR MÉTODO DE PROCESAMIENTO, 2018-2032 (MILES DE USD)
TABLA 398 MERCADO DE FRUTOS SECOS TOSTADOS EN TAILANDIA, POR TIPO, 2018-2032 (MILES DE USD)
TABLA 399 MERCADO DE FRUTOS SECOS CON SABOR A TAILANDIA, POR TIPO, 2018-2032 (MILES DE USD)
TABLA 400 MERCADO DE FRUTOS SECOS DE TAILANDIA, POR GRADO, 2018-2032 (MILES DE USD)
TABLA 401 MERCADO DE FRUTOS SECOS DE TAILANDIA, POR VIDA ÚTIL, 2018-2032 (MILES DE USD)
TABLA 402 MERCADO DE FRUTOS SECOS DE TAILANDIA, POR CERTIFICACIÓN, 2018-2032 (MILES DE USD)
TABLA 403 MERCADO DE FRUTOS SECOS DE TAILANDIA, POR ENVASE, 2018-2032 (MILES DE USD)
TABLA 404 BOLSAS DE PLÁSTICO EN EL MERCADO DE FRUTOS SECOS DE TAILANDIA, POR TIPO, 2018-2032 (MILES DE USD)
TABLA 405 MERCADO DE FRUTOS SECOS DE TAILANDIA, POR TAMAÑO DE ENVASE, 2018-2032 (MILES DE USD)
TABLA 406 MERCADO DE FRUTOS SECOS DE TAILANDIA, POR RANGO DE PRECIOS, 2018-2032 (MILES DE USD)
TABLA 407 MERCADO DE FRUTOS SECOS DE TAILANDIA, POR USO FINAL, 2018-2032 (MILES DE USD)
TABLA 408 MERCADO DE NUTRICIÓN FUNCIONAL DE FRUTOS SECOS DE TAILANDIA, POR TIPO, 2018-2032 (MILES DE USD)
TABLA 409 INDUSTRIA DE BEBIDAS DE TAILANDIA EN EL MERCADO DE FRUTOS SECOS, POR TIPO, 2018-2032 (MILES DE USD)
TABLA 410 MERCADO DE FRUTOS SECOS EN TAILANDIA, POR TIPO, 2018-2032 (MILES DE USD)
TABLA 411 PRODUCTOS DE CUIDADO PERSONAL EN EL MERCADO DE FRUTOS SECOS DE TAILANDIA, POR TIPO, 2018-2032 (MILES DE USD)
TABLA 412 USOS DE PRODUCTOS DE ORIGEN BIOLÓGICO Y AGROINDUSTRIALES EN EL MERCADO DE FRUTOS SECOS DE TAILANDIA, POR TIPO, 2018-2032 (MILES DE USD)
TABLA 413 MERCADO DE ALIMENTOS ANIMALES EN FRUTOS SECOS DE TAILANDIA, POR TIPO, 2018-2032 (MILES DE USD)
TABLA 414 MERCADO DE FRUTOS SECOS DE TAILANDIA, POR CANAL DE DISTRIBUCIÓN, 2018-2032 (MILES DE USD)
TABLA 415 MERCADO DE FRUTOS SECOS B2C DE TAILANDIA, POR TIPO, 2018-2032 (MILES DE USD)
TABLA 416 TAILANDIA SIN CONEXIÓN EN EL MERCADO DE FRUTOS SECOS, POR TIPO, 2018-2032 (MILES DE USD)
TABLA 417 MERCADO DE FRUTOS SECOS EN LÍNEA DE TAILANDIA, POR TIPO, 2018-2032 (MILES DE USD)
TABLA 418 MERCADO DE FRUTOS SECOS DE FILIPINAS, POR TIPO DE PRODUCTO, 2018-2032 (MILES DE USD)
TABLA 419 MERCADO DE FRUTOS SECOS DE FILIPINAS, POR TIPO DE PRODUCTO, 2018-2032 (MILES DE TONELADAS)
TABLA 420 FRUTOS SECOS EN EL MERCADO DE FRUTOS SECOS DE FILIPINAS, POR TIPO, 2018-2032 (MILES DE USD)
TABLA 421 FILIPINAS: NUECES DE MANÍ EN EL MERCADO DE NUECES, POR CACAHUATE, 2018-2032 (MILES DE USD)
TABLA 422 FRUTOS SECOS HÍBRIDOS/OTROS EN EL MERCADO DE FRUTOS SECOS DE FILIPINAS, POR TIPO, 2018-2032 (MILES DE USD)
TABLA 423 MERCADO DE FRUTOS SECOS DE FILIPINAS, POR FORMA, 2018-2032 (MILES DE USD)
TABLA 424 MERCADO DE FRUTOS SECOS DE FILIPINAS, POR NATURALEZA, 2018-2032 (MILES DE USD)
TABLA 425 MERCADO DE FRUTOS SECOS DE FILIPINAS, POR MÉTODO DE PROCESAMIENTO, 2018-2032 (MILES DE USD)
TABLA 426 MERCADO DE FRUTOS SECOS TOSTADOS EN FILIPINAS, POR TIPO, 2018-2032 (MILES DE USD)
TABLA 427 MERCADO DE FRUTOS SECOS SABORIZADOS EN FILIPINAS, POR TIPO, 2018-2032 (MILES DE USD)
TABLA 428 MERCADO DE FRUTOS SECOS DE FILIPINAS, POR GRADO, 2018-2032 (MILES DE USD)
TABLA 429 MERCADO DE FRUTOS SECOS DE FILIPINAS, POR VIDA ÚTIL, 2018-2032 (MILES DE USD)
TABLA 430 MERCADO DE FRUTOS SECOS DE FILIPINAS, POR CERTIFICACIÓN, 2018-2032 (MILES DE USD)
TABLA 431 MERCADO DE FRUTOS SECOS DE FILIPINAS, POR ENVASE, 2018-2032 (MILES DE USD)
TABLA 432 BOLSAS DE PLÁSTICO EN EL MERCADO DE FRUTOS SECOS DE FILIPINAS, POR TIPO, 2018-2032 (MILES DE USD)
TABLA 433 MERCADO DE FRUTOS SECOS DE FILIPINAS, POR TAMAÑO DE ENVASE, 2018-2032 (MILES DE USD)
TABLA 434 MERCADO DE FRUTOS SECOS DE FILIPINAS, POR RANGO DE PRECIOS, 2018-2032 (MILES DE USD)
TABLA 435 MERCADO DE FRUTOS SECOS DE FILIPINAS, POR USO FINAL, 2018-2032 (MILES DE USD)
TABLA 436 MERCADO DE NUTRICIÓN FUNCIONAL DE FRUTOS SECOS DE FILIPINAS, POR TIPO, 2018-2032 (MILES DE USD)
TABLA 437 INDUSTRIA DE BEBIDAS DE FILIPINAS EN EL MERCADO DE FRUTOS SECOS, POR TIPO, 2018-2032 (MILES DE USD)
TABLA 438 MERCADO DE FRUTOS SECOS EN FILIPINAS, POR TIPO, 2018-2032 (MILES DE USD)
TABLA 439 PRODUCTOS DE CUIDADO PERSONAL EN EL MERCADO DE FRUTOS SECOS DE FILIPINAS, POR TIPO, 2018-2032 (MILES DE USD)
TABLA 440 USOS DE FRUTOS SECOS EN EL MERCADO DE FRUTOS SECOS DE FILIPINAS, POR TIPO, 2018-2032 (MILES DE USD)
TABLA 441 MERCADO DE ALIMENTOS ANIMALES EN FRUTOS SECOS DE FILIPINAS, POR TIPO, 2018-2032 (MILES DE USD)
TABLA 442 MERCADO DE FRUTOS SECOS DE FILIPINAS, POR CANAL DE DISTRIBUCIÓN, 2018-2032 (MILES DE USD)
TABLA 443 FILIPINAS B2C EN EL MERCADO DE FRUTOS SECOS, POR TIPO, 2018-2032 (MILES DE USD)
TABLA 444 FILIPINAS SIN CONEXIÓN EN EL MERCADO DE FRUTOS SECOS, POR TIPO, 2018-2032 (MILES DE USD)
TABLA 445 MERCADO DE FRUTOS SECOS EN LÍNEA DE FILIPINAS, POR TIPO, 2018-2032 (MILES DE USD)
TABLA 446 MERCADO DE FRUTOS SECOS DE SINGAPUR, POR TIPO DE PRODUCTO, 2018-2032 (MILES DE USD)
TABLA 447 MERCADO DE FRUTOS SECOS DE SINGAPUR, POR TIPO DE PRODUCTO, 2018-2032 (MILES DE TONELADAS)
TABLA 448 NUECES DE SINGAPUR EN EL MERCADO DE NUECES, POR TIPO, 2018-2032 (MILES DE USD)
TABLA 449 NUECES DE MANÍ DE SINGAPUR EN EL MERCADO DE NUECES, POR CACAHUATE, 2018-2032 (MILES DE USD)
TABLA 450 NUECES HÍBRIDAS/OTRAS EN EL MERCADO DE NUECES DE SINGAPUR, POR TIPO, 2018-2032 (MILES DE USD)
TABLA 451 MERCADO DE FRUTOS SECOS DE SINGAPUR, POR FORMA, 2018-2032 (MILES DE USD)
TABLA 452 MERCADO DE FRUTOS SECOS DE SINGAPUR, POR NATURALEZA, 2018-2032 (MILES DE USD)
TABLA 453 MERCADO DE FRUTOS SECOS DE SINGAPUR, POR MÉTODO DE PROCESAMIENTO, 2018-2032 (MILES DE USD)
TABLA 454 MERCADO DE FRUTOS SECOS TOSTADOS DE SINGAPUR, POR TIPO, 2018-2032 (MILES DE USD)
TABLA 455 MERCADO DE FRUTOS SECOS CON SABOR A SINGAPUR, POR TIPO, 2018-2032 (MILES DE USD)
TABLA 456 MERCADO DE FRUTOS SECOS DE SINGAPUR, POR GRADO, 2018-2032 (MILES DE USD)
TABLA 457 MERCADO DE FRUTOS SECOS DE SINGAPUR, POR VIDA ÚTIL, 2018-2032 (MILES DE USD)
TABLA 458 MERCADO DE FRUTOS SECOS DE SINGAPUR, POR CERTIFICACIÓN, 2018-2032 (MILES DE USD)
TABLA 459 MERCADO DE FRUTOS SECOS DE SINGAPUR, POR ENVASE, 2018-2032 (MILES DE USD)
TABLA 460 BOLSAS DE PLÁSTICO DE SINGAPUR EN EL MERCADO DE FRUTOS SECOS, POR TIPO, 2018-2032 (MILES DE USD)
TABLA 461 MERCADO DE FRUTOS SECOS DE SINGAPUR, POR TAMAÑO DE ENVASE, 2018-2032 (MILES DE USD)
TABLA 462 MERCADO DE FRUTOS SECOS DE SINGAPUR, POR RANGO DE PRECIOS, 2018-2032 (MILES DE USD)
TABLA 463 MERCADO DE FRUTOS SECOS DE SINGAPUR, POR USO FINAL, 2018-2032 (MILES DE USD)
TABLA 464 MERCADO DE NUTRICIÓN FUNCIONAL DE FRUTOS SECOS DE SINGAPUR, POR TIPO, 2018-2032 (MILES DE USD)
TABLA 465 INDUSTRIA DE BEBIDAS DE SINGAPUR EN EL MERCADO DE FRUTOS SECOS, POR TIPO, 2018-2032 (MILES DE USD)
TABLA 466 MERCADO DE NUECES Y PRODUCTOS CULINARIOS DE SINGAPUR, POR TIPO, 2018-2032 (MILES DE USD)
TABLA 467 PRODUCTOS DE CUIDADO PERSONAL EN EL MERCADO DE FRUTOS SECOS DE SINGAPUR, POR TIPO, 2018-2032 (MILES DE USD)
TABLA 468 USOS DE PRODUCTOS DE ORIGEN BIOLÓGICO Y AGROINDUSTRIALES EN EL MERCADO DE FRUTOS SECOS DE SINGAPUR, POR TIPO, 2018-2032 (MILES DE USD)
TABLA 469 MERCADO DE ALIMENTOS ANIMALES EN FRUTOS SECOS DE SINGAPUR, POR TIPO, 2018-2032 (MILES DE USD)
TABLA 470 MERCADO DE FRUTOS SECOS DE SINGAPUR, POR CANAL DE DISTRIBUCIÓN, 2018-2032 (MILES DE USD)
TABLA 471 MERCADO DE FRUTOS SECOS B2C DE SINGAPUR, POR TIPO, 2018-2032 (MILES DE USD)
TABLA 472 SINGAPUR SIN CONEXIÓN EN EL MERCADO DE FRUTOS SECOS, POR TIPO, 2018-2032 (MILES DE USD)
TABLA 473 MERCADO DE FRUTOS SECOS EN LÍNEA EN SINGAPUR, POR TIPO, 2018-2032 (MILES DE USD)
TABLA 474 MERCADO DE FRUTOS SECOS DE HONG KONG, POR TIPO DE PRODUCTO, 2018-2032 (MILES DE USD)
TABLA 475 MERCADO DE FRUTOS SECOS DE HONG KONG, POR TIPO DE PRODUCTO, 2018-2032 (MILES DE TONELADAS)
TABLA 476 NUECES DE HONG KONG EN EL MERCADO DE NUECES, POR TIPO, 2018-2032 (MILES DE USD)
TABLA 477 NUECES DE HONG KONG EN EL MERCADO DE NUECES, POR CACAHUATE, 2018-2032 (MILES DE USD)
TABLA 478 NUECES HÍBRIDAS/OTRAS DE HONG KONG EN EL MERCADO DE NUECES, POR TIPO, 2018-2032 (MILES DE USD)
TABLA 479 MERCADO DE FRUTOS SECOS DE HONG KONG, POR FORMA, 2018-2032 (MILES DE USD)
TABLA 480 MERCADO DE FRUTOS SECOS DE HONG KONG, POR NATURALEZA, 2018-2032 (MILES DE USD)
TABLA 481 MERCADO DE FRUTOS SECOS DE HONG KONG, POR MÉTODO DE PROCESAMIENTO, 2018-2032 (MILES DE USD)
TABLA 482 MERCADO DE FRUTOS SECOS TOSTADOS DE HONG KONG, POR TIPO, 2018-2032 (MILES DE USD)
TABLA 483 MERCADO DE FRUTOS SECOS CON SABOR A HONG KONG, POR TIPO, 2018-2032 (MILES DE USD)
TABLA 484 MERCADO DE FRUTOS SECOS DE HONG KONG, POR GRADO, 2018-2032 (MILES DE USD)
TABLA 485 MERCADO DE FRUTOS SECOS DE HONG KONG, POR VIDA ÚTIL, 2018-2032 (MILES DE USD)
TABLA 486 MERCADO DE FRUTOS SECOS DE HONG KONG, POR CERTIFICACIÓN, 2018-2032 (MILES DE USD)
TABLA 487 MERCADO DE FRUTOS SECOS DE HONG KONG, POR ENVASE, 2018-2032 (MILES DE USD)
TABLA 488 BOLSAS DE PLÁSTICO DE HONG KONG EN EL MERCADO DE FRUTOS SECOS, POR TIPO, 2018-2032 (MILES DE USD)
TABLA 489 MERCADO DE FRUTOS SECOS DE HONG KONG, POR TAMAÑO DE ENVASE, 2018-2032 (MILES DE USD)
TABLA 490 MERCADO DE FRUTOS SECOS DE HONG KONG, POR RANGO DE PRECIOS, 2018-2032 (MILES DE USD)
TABLA 491 MERCADO DE FRUTOS SECOS DE HONG KONG, POR USO FINAL, 2018-2032 (MILES DE USD)
TABLA 492 MERCADO DE NUTRICIÓN FUNCIONAL DE FRUTOS SECOS DE HONG KONG, POR TIPO, 2018-2032 (MILES DE USD)
TABLA 493 INDUSTRIA DE BEBIDAS DE HONG KONG EN EL MERCADO DE FRUTOS SECOS, POR TIPO, 2018-2032 (MILES DE USD)
TABLA 494 MERCADO DE FRUTOS SECOS EN LA COCINA DE HONG KONG, POR TIPO, 2018-2032 (MILES DE USD)
TABLA 495 PRODUCTOS DE CUIDADO PERSONAL EN EL MERCADO DE FRUTOS SECOS DE HONG KONG, POR TIPO, 2018-2032 (MILES DE USD)
TABLA 496 USOS DE PRODUCTOS DE ORIGEN BIOLÓGICO Y AGROINDUSTRIALES EN EL MERCADO DE FRUTOS SECOS DE HONG KONG, POR TIPO, 2018-2032 (MILES DE USD)
TABLA 497 MERCADO DE ALIMENTOS PARA ANIMALES Y FRUTOS SECOS DE HONG KONG, POR TIPO, 2018-2032 (MILES DE USD)
TABLA 498 MERCADO DE FRUTOS SECOS DE HONG KONG, POR CANAL DE DISTRIBUCIÓN, 2018-2032 (MILES DE USD)
TABLA 499 MERCADO DE FRUTOS SECOS B2C EN HONG KONG, POR TIPO, 2018-2032 (MILES DE USD)
TABLA 500 MERCADO DE FRUTOS SECOS SIN CONEXIÓN EN HONG KONG, POR TIPO, 2018-2032 (MILES DE USD)
TABLA 501 MERCADO DE FRUTOS SECOS EN LÍNEA EN HONG KONG, POR TIPO, 2018-2032 (MILES DE USD)
TABLA 502 MERCADO DE FRUTOS SECOS DE NUEVA ZELANDA, POR TIPO DE PRODUCTO, 2018-2032 (MILES DE USD)
TABLA 503 MERCADO DE FRUTOS SECOS DE NUEVA ZELANDA, POR TIPO DE PRODUCTO, 2018-2032 (MILES DE TONELADAS)
TABLA 504 NUECES DE NUEVA ZELANDA EN EL MERCADO DE NUECES, POR TIPO, 2018-2032 (MILES DE USD)
TABLA 505 NUECES DE MANÍ DE NUEVA ZELANDA EN EL MERCADO DE NUECES, POR CACAHUATE, 2018-2032 (MILES DE USD)
TABLA 506 NUECES HÍBRIDAS/OTRAS EN EL MERCADO DE NUECES DE NUEVA ZELANDA, POR TIPO, 2018-2032 (MILES DE USD)
TABLA 507 MERCADO DE FRUTOS SECOS DE NUEVA ZELANDA, POR FORMA, 2018-2032 (MILES DE USD)
TABLA 508 MERCADO DE FRUTOS SECOS DE NUEVA ZELANDA, POR NATURALEZA, 2018-2032 (MILES DE USD)
TABLA 509 MERCADO DE FRUTOS SECOS DE NUEVA ZELANDA, POR MÉTODO DE PROCESAMIENTO, 2018-2032 (MILES DE USD)
TABLA 510 MERCADO DE FRUTOS SECOS TOSTADOS DE NUEVA ZELANDA, POR TIPO, 2018-2032 (MILES DE USD)
TABLA 511 MERCADO DE FRUTOS SECOS CON SABOR A NUEVA ZELANDA, POR TIPO, 2018-2032 (MILES DE USD)
TABLA 512 MERCADO DE FRUTOS SECOS DE NUEVA ZELANDA, POR GRADO, 2018-2032 (MILES DE USD)
TABLA 513 MERCADO DE FRUTOS SECOS DE NUEVA ZELANDA, POR VIDA ÚTIL, 2018-2032 (MILES DE USD)
TABLA 514 MERCADO DE FRUTOS SECOS DE NUEVA ZELANDA, POR CERTIFICACIÓN, 2018-2032 (MILES DE USD)
TABLA 515 MERCADO DE FRUTOS SECOS DE NUEVA ZELANDA, POR ENVASE, 2018-2032 (MILES DE USD)
TABLA 516 BOLSAS DE PLÁSTICO DE NUEVA ZELANDA EN EL MERCADO DE FRUTOS SECOS, POR TIPO, 2018-2032 (MILES DE USD)
TABLA 517 MERCADO DE FRUTOS SECOS DE NUEVA ZELANDA, POR TAMAÑO DE ENVASE, 2018-2032 (MILES DE USD)
TABLA 518 MERCADO DE FRUTOS SECOS DE NUEVA ZELANDA, POR RANGO DE PRECIOS, 2018-2032 (MILES DE USD)
CUADRO 519 MERCADO DE FRUTOS SECOS DE NUEVA ZELANDA, POR USO FINAL, 2018-2032 (MILES DE USD)
TABLA 520 MERCADO DE NUTRICIÓN FUNCIONAL DE FRUTOS SECOS DE NUEVA ZELANDA, POR TIPO, 2018-2032 (MILES DE USD)
TABLA 521 INDUSTRIA DE BEBIDAS DE NUEVA ZELANDA EN EL MERCADO DE FRUTOS SECOS, POR TIPO, 2018-2032 (MILES DE USD)
TABLA 522 MERCADO DE FRUTOS SECOS EN NUEVA ZELANDA, POR TIPO, 2018-2032 (MILES DE USD)
TABLA 523 PRODUCTOS DE CUIDADO PERSONAL DE NUEVA ZELANDA EN EL MERCADO DE FRUTOS SECOS, POR TIPO, 2018-2032 (MILES DE USD)
TABLA 524 USOS DE PRODUCTOS DE ORIGEN BIOLÓGICO Y AGROINDUSTRIALES EN EL MERCADO DE FRUTOS SECOS DE NUEVA ZELANDA, POR TIPO, 2018-2032 (MILES DE USD)
TABLA 525 MERCADO DE ALIMENTOS ANIMALES EN FRUTOS SECOS DE NUEVA ZELANDA, POR TIPO, 2018-2032 (MILES DE USD)
TABLA 526 MERCADO DE FRUTOS SECOS DE NUEVA ZELANDA, POR CANAL DE DISTRIBUCIÓN, 2018-2032 (MILES DE USD)
TABLA 527 MERCADO DE FRUTOS SECOS B2C DE NUEVA ZELANDA, POR TIPO, 2018-2032 (MILES DE USD)
TABLA 528 NUEVA ZELANDA SIN CONEXIÓN EN EL MERCADO DE FRUTOS SECOS, POR TIPO, 2018-2032 (MILES DE USD)
TABLA 529 NUEVA ZELANDA EN LÍNEA EN EL MERCADO DE FRUTOS SECOS, POR TIPO, 2018-2032 (MILES DE USD)
TABLA 530 MERCADO DE FRUTOS SECOS DE TAIWÁN, POR TIPO DE PRODUCTO, 2018-2032 (MILES DE USD)
TABLA 531 MERCADO DE FRUTOS SECOS DE TAIWÁN, POR TIPO DE PRODUCTO, 2018-2032 (MILES DE TONELADAS)
TABLA 532 NUECES DE TAIWÁN EN EL MERCADO DE NUECES, POR TIPO, 2018-2032 (MILES DE USD)
TABLA 533 NUECES DE MANÍ DE TAIWÁN EN EL MERCADO DE NUECES, POR CACAHUATE, 2018-2032 (MILES DE USD)
TABLA 534 NUECES HÍBRIDAS/OTRAS EN EL MERCADO DE NUECES DE TAIWÁN, POR TIPO, 2018-2032 (MILES DE USD)
TABLA 535 MERCADO DE FRUTOS SECOS DE TAIWÁN, POR FORMA, 2018-2032 (MILES DE USD)
TABLA 536 MERCADO DE FRUTOS SECOS DE TAIWÁN, POR NATURALEZA, 2018-2032 (MILES DE USD)
TABLA 537 MERCADO DE FRUTOS SECOS DE TAIWÁN, POR MÉTODO DE PROCESAMIENTO, 2018-2032 (MILES DE USD)
TABLA 538 MERCADO DE FRUTOS SECOS TOSTADOS DE TAIWÁN, POR TIPO, 2018-2032 (MILES DE USD)
TABLA 539 MERCADO DE FRUTOS SECOS SABORIZADOS EN TAIWÁN, POR TIPO, 2018-2032 (MILES DE USD)
TABLA 540 MERCADO DE FRUTOS SECOS DE TAIWÁN, POR GRADO, 2018-2032 (MILES DE USD)
TABLA 541 MERCADO DE FRUTOS SECOS DE TAIWÁN, POR VIDA ÚTIL, 2018-2032 (MILES DE USD)
TABLA 542 MERCADO DE FRUTOS SECOS DE TAIWÁN, POR CERTIFICACIÓN, 2018-2032 (MILES DE USD)
TABLA 543 MERCADO DE FRUTOS SECOS DE TAIWÁN, POR ENVASE, 2018-2032 (MILES DE USD)
TABLA 544 BOLSAS DE PLÁSTICO EN EL MERCADO DE FRUTOS SECOS DE TAIWÁN, POR TIPO, 2018-2032 (MILES DE USD)
TABLA 545 MERCADO DE FRUTOS SECOS DE TAIWÁN, POR TAMAÑO DE ENVASE, 2018-2032 (MILES DE USD)
TABLA 546 MERCADO DE FRUTOS SECOS DE TAIWÁN, POR RANGO DE PRECIOS, 2018-2032 (MILES DE USD)
TABLA 547 MERCADO DE FRUTOS SECOS DE TAIWÁN, POR USO FINAL, 2018-2032 (MILES DE USD)
TABLA 548 NUTRICIÓN FUNCIONAL EN EL MERCADO DE FRUTOS SECOS DE TAIWÁN, POR TIPO, 2018-2032 (MILES DE USD)
TABLA 549 INDUSTRIA DE BEBIDAS DE TAIWÁN EN EL MERCADO DE FRUTOS SECOS, POR TIPO, 2018-2032 (MILES DE USD)
TABLA 550 MERCADO DE FRUTOS SECOS EN TAIWÁN, POR TIPO, 2018-2032 (MILES DE USD)
TABLA 551 PRODUCTOS DE CUIDADO PERSONAL EN EL MERCADO DE FRUTOS SECOS DE TAIWÁN, POR TIPO, 2018-2032 (MILES DE USD)
TABLA 552 USOS DE PRODUCTOS BIOLÓGICOS Y AGROINDUSTRIALES EN EL MERCADO DE FRUTOS SECOS DE TAIWÁN, POR TIPO, 2018-2032 (MILES DE USD)
TABLA 553 MERCADO DE ALIMENTOS ANIMALES EN NUECES DE TAIWÁN, POR TIPO, 2018-2032 (MILES DE USD)
TABLA 554 MERCADO DE FRUTOS SECOS DE TAIWÁN, POR CANAL DE DISTRIBUCIÓN, 2018-2032 (MILES DE USD)
TABLA 555 MERCADO DE NUECES B2C EN TAIWÁN, POR TIPO, 2018-2032 (MILES DE USD)
TABLA 556 TAIWÁN SIN CONEXIÓN EN EL MERCADO DE FRUTOS SECOS, POR TIPO, 2018-2032 (MILES DE USD)
TABLA 557 MERCADO DE FRUTOS SECOS EN LÍNEA DE TAIWÁN, POR TIPO, 2018-2032 (MILES DE USD)
TABLA 558 RESTO DEL MERCADO DE FRUTOS SECOS DE ASIA-PACÍFICO, POR TIPO DE PRODUCTO, 2018-2032 (MILES DE USD)
TABLA 559 RESTO DEL MERCADO DE FRUTOS SECOS DE ASIA-PACÍFICO, POR TIPO DE PRODUCTO, 2018-2032 (MILES DE TONELADAS)
Lista de figuras
FIGURA 1 MERCADO DE FRUTOS SECOS DE ASIA-PACÍFICO
FIGURA 2 MERCADO DE FRUTOS SECOS DE ASIA-PACÍFICO: TRIANGULACIÓN DE DATOS
FIGURA 3 MERCADO DE FRUTOS SECOS DE ASIA-PACÍFICO: ANÁLISIS DROC
FIGURA 4 MERCADO DE FRUTOS SECOS DE ASIA-PACÍFICO: ANÁLISIS DEL MERCADO DE ASIA-PACÍFICO VS. REGIONAL
FIGURA 5 MERCADO DE FRUTOS SECOS DE ASIA-PACÍFICO: ANÁLISIS DE INVESTIGACIÓN DE EMPRESAS
FIGURA 6 MERCADO DE FRUTOS SECOS DE ASIA-PACÍFICO: MODELADO MULTIVARIADO
FIGURA 7 CURVA DE LÍNEA DE TIEMPO DEL MERCADO DE FRUTOS SECOS DE ASIA-PACÍFICO
FIGURA 8 MERCADO DE FRUTOS SECOS DE ASIA-PACÍFICO: DATOS DEMOGRÁFICOS DE LA ENTREVISTA
FIGURA 9 MERCADO DE FRUTOS SECOS DE ASIA-PACÍFICO: CUADRÍCULA DE POSICIÓN DE MERCADO DBMR
FIGURA 10 MERCADO DE FRUTOS SECOS DE ASIA-PACÍFICO: CUADRÍCULA DE COBERTURA DE USO FINAL DEL MERCADO
FIGURA 11 MERCADO DE FRUTOS SECOS DE ASIA-PACÍFICO: ANÁLISIS DE LA PARTICIPACIÓN DE LOS PROVEEDORES
FIGURA 12 MERCADO DE FRUTOS SECOS DE ASIA-PACÍFICO: SEGMENTACIÓN
FIGURA 13 RESUMEN EJECUTIVO
FIGURA 14 DESARROLLO ESTRATÉGICO DEL MERCADO DE FRUTOS SECOS DE ASIA-PACÍFICO
FIGURA 15 CUATRO SEGMENTOS COMPRENDEN EL MERCADO DE FRUTOS SECOS DE ASIA-PACÍFICO, POR TIPO DE PRODUCTO
FIGURA 16 SE ESPERA QUE LA TENDENCIA CRECIENTE DE ASIA-PACÍFICO HACIA OPCIONES DE REFRIGERIOS MÁS SALUDABLES Y NUTRITIVAS IMPULSE EL MERCADO DE FRUTOS SECOS DE ASIA-PACÍFICO EN EL PERÍODO DE PRONÓSTICO
FIGURA 17 SE ESPERA QUE EL SEGMENTO DE FRUTOS SECOS REPRESENTE LA MAYOR PARTICIPACIÓN DEL MERCADO DE FRUTOS SECOS DE ASIA-PACÍFICO EN 2025 Y 2032
FIGURA 18 CADENA DE VALOR DEL MERCADO DE FRUTOS SECOS
FIGURA 19 ANÁLISIS DE LA CADENA DE SUMINISTRO DEL MERCADO DE FRUTOS SECOS
FIGURA 20 NÚMERO TOTAL DE TRANSACCIONES
FIGURA 21 TRANSACCIONES POR TIPO
FIGURA 22 TRANSACCIONES POR SEGMENTO
FIGURA 23 PERSPECTIVA DE LA CAPACIDAD DE PRODUCCIÓN
FIGURA 24 DESCRIPCIÓN GENERAL DEL PRODUCTO Y LA MARCA
FIGURA 25 FAMILIAS DE PATENTES
FIGURA 26 FAMILIAS DE PATENTES
FIGURA 27 CUADRANTE DE EVALUACIÓN DE LA EMPRESA
FIGURA 28 ANÁLISIS DE TENDENCIA DE PRECIOS, 2018-2032 (USD/KG)
FIGURA 29 ÍNDICE DE EXPORTACIÓN DE FRUTOS SECOS DEL PROYECTO TRES (2021-2025)
FIGURA 30 ANÁLISIS DROC
FIGURA 31 FRECUENCIA DE CONSUMO DE FRUTOS SECOS
FIGURA 32 MERCADO DE FRUTOS SECOS DE ASIA-PACÍFICO: POR TIPO DE PRODUCTO, 2024
FIGURA 33 MERCADO DE FRUTOS SECOS DE ASIA-PACÍFICO: FORMULA, 2024
FIGURA 34 MERCADO DE FRUTOS SECOS DE ASIA-PACÍFICO: POR NATURALEZA, 2024
FIGURA 35 MERCADO DE FRUTOS SECOS DE ASIA-PACÍFICO: POR MÉTODO DE PROCESAMIENTO, 2024
FIGURA 36 MERCADO DE FRUTOS SECOS DE ASIA-PACÍFICO: POR GRADO, 2024
FIGURA 37 MERCADO DE FRUTOS SECOS DE ASIA-PACÍFICO: POR VIDA ÚTIL, 2024
FIGURA 38 MERCADO DE FRUTOS SECOS DE ASIA-PACÍFICO: POR CERTIFICACIÓN, 2024
FIGURA 39 MERCADO DE FRUTOS SECOS DE ASIA-PACÍFICO: ENVASADO, 2024
FIGURA 40 MERCADO DE FRUTOS SECOS DE ASIA-PACÍFICO: POR TAMAÑO DE ENVASE, 2024
FIGURA 41 MERCADO DE FRUTOS SECOS DE ASIA-PACÍFICO: POR RANGO DE PRECIOS, 2024
FIGURA 42 MERCADO DE FRUTOS SECOS DE ASIA-PACÍFICO: POR USO FINAL, 2024
FIGURA 43 MERCADO DE FRUTOS SECOS DE ASIA-PACÍFICO: POR CANAL DE DISTRIBUCIÓN, 2024
FIGURA 44 MERCADO DE FRUTOS SECOS DE ASIA-PACÍFICO: UNA INSTANTÁNEA
FIGURA 45 MERCADO DE FRUTOS SECOS DE ASIA-PACÍFICO: PARTICIPACIÓN DE LA EMPRESA 2024 (%)
Metodología de investigación
La recopilación de datos y el análisis del año base se realizan utilizando módulos de recopilación de datos con muestras de gran tamaño. La etapa incluye la obtención de información de mercado o datos relacionados a través de varias fuentes y estrategias. Incluye el examen y la planificación de todos los datos adquiridos del pasado con antelación. Asimismo, abarca el examen de las inconsistencias de información observadas en diferentes fuentes de información. Los datos de mercado se analizan y estiman utilizando modelos estadísticos y coherentes de mercado. Además, el análisis de la participación de mercado y el análisis de tendencias clave son los principales factores de éxito en el informe de mercado. Para obtener más información, solicite una llamada de un analista o envíe su consulta.
La metodología de investigación clave utilizada por el equipo de investigación de DBMR es la triangulación de datos, que implica la extracción de datos, el análisis del impacto de las variables de datos en el mercado y la validación primaria (experto en la industria). Los modelos de datos incluyen cuadrícula de posicionamiento de proveedores, análisis de línea de tiempo de mercado, descripción general y guía del mercado, cuadrícula de posicionamiento de la empresa, análisis de patentes, análisis de precios, análisis de participación de mercado de la empresa, estándares de medición, análisis global versus regional y de participación de proveedores. Para obtener más información sobre la metodología de investigación, envíe una consulta para hablar con nuestros expertos de la industria.
Personalización disponible
Data Bridge Market Research es líder en investigación formativa avanzada. Nos enorgullecemos de brindar servicios a nuestros clientes existentes y nuevos con datos y análisis que coinciden y se adaptan a sus objetivos. El informe se puede personalizar para incluir análisis de tendencias de precios de marcas objetivo, comprensión del mercado de países adicionales (solicite la lista de países), datos de resultados de ensayos clínicos, revisión de literatura, análisis de mercado renovado y base de productos. El análisis de mercado de competidores objetivo se puede analizar desde análisis basados en tecnología hasta estrategias de cartera de mercado. Podemos agregar tantos competidores sobre los que necesite datos en el formato y estilo de datos que esté buscando. Nuestro equipo de analistas también puede proporcionarle datos en archivos de Excel sin procesar, tablas dinámicas (libro de datos) o puede ayudarlo a crear presentaciones a partir de los conjuntos de datos disponibles en el informe.

