Ecuador Rice Market
Tamaño del mercado en miles de millones de dólares
Tasa de crecimiento anual compuesta (CAGR) :
% 
 USD
142.29 Billion
USD
184.61 Billion
2024
2032
USD
142.29 Billion
USD
184.61 Billion
2024
2032
| 2025 –2032 | |
| USD 142.29 Billion | |
| USD 184.61 Billion | |
| % | |
|
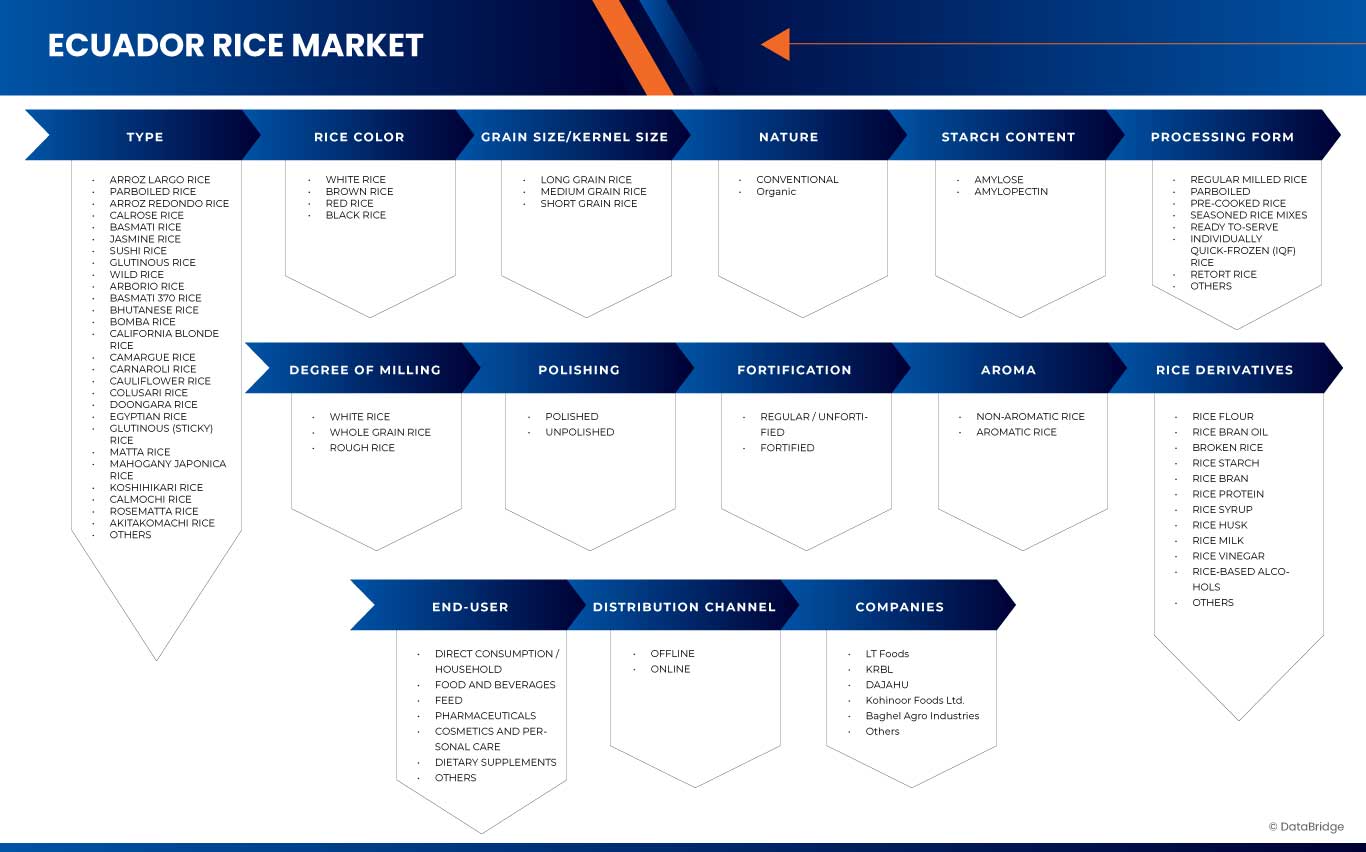
Segmentación del mercado del arroz de Ecuador, por tipo (arroz largo, arroz vaporizado, arroz redondo, arroz Calrose, arroz basmati, arroz jazmín, arroz para sushi, arroz glutinoso, arroz salvaje, arroz arborio, arroz basmati 370, arroz butanés, arroz bomba, arroz rubio de California, arroz Camargue, arroz carnaroli, arroz coliflor, arroz colusari, arroz doongara, arroz egipcio, arroz glutinoso (pegajoso), arroz matta, arroz japónica caoba, arroz koshihikari, arroz calmochi, arroz rosematta, arroz akitakomachi y otros), color del arroz (arroz blanco, arroz integral, arroz rojo y arroz negro), tamaño del grano/tamaño del grano (arroz de grano largo, arroz de grano medio y arroz de grano corto), naturaleza (convencional y orgánico), contenido de almidón (amilosa y amilopectina), forma de procesamiento (arroz molido regular, vaporizado, Arroz precocido, mezclas de arroz sazonadas, arroz listo para servir, arroz congelado individualmente (IQF), arroz de retorta y otros), grado de molienda (arroz blanco, arroz integral y arroz en bruto), pulido (pulido y sin pulir), fortificación (regular/sin fortificar y fortificado), aroma (arroz no aromático y arroz aromático), derivados del arroz (harina de arroz, aceite de salvado de arroz, arroz partido, almidón de arroz, salvado de arroz, proteína de arroz, jarabe de arroz, cáscara de arroz, leche de arroz, vinagre de arroz, alcoholes de arroz y otros), usuario final (consumo directo/doméstico, alimentos y bebidas, piensos, productos farmacéuticos, cosméticos y cuidado personal, suplementos dietéticos y otros), canal de distribución (en línea y fuera de línea): tendencias de la industria y pronóstico hasta 2032
Análisis del mercado del arroz en Ecuador
El mercado arrocero ecuatoriano está impulsado por la creciente necesidad de sistemas agrícolas confiables y de alto rendimiento. Este mercado está experimentando un crecimiento significativo. El arroz ecuatoriano es el preferido por su eficiencia superior, rendimiento robusto y rentabilidad, lo que lo hace ideal para aplicaciones de producción y procesamiento a gran escala. Los avances tecnológicos en riego, equipos agrícolas y sistemas de procesamiento mejoran la productividad y la eficiencia operativa, contribuyendo a mejores rendimientos y a la reducción del consumo de energía. El crecimiento del mercado se ve impulsado además por políticas gubernamentales, iniciativas de agricultura sostenible y la creciente demanda de arroz de producción local. Sin embargo, desafíos como la fluctuación de los precios del mercado, la variabilidad climática y los altos costos operativos obstaculizan el crecimiento. No obstante, la adopción de tecnologías agrícolas modernas, la mejora de la logística y el aumento de la inversión en infraestructura presentan importantes oportunidades, lo que hace que el mercado sea más competitivo e impulsado por la innovación.
Tamaño del mercado del arroz en Ecuador
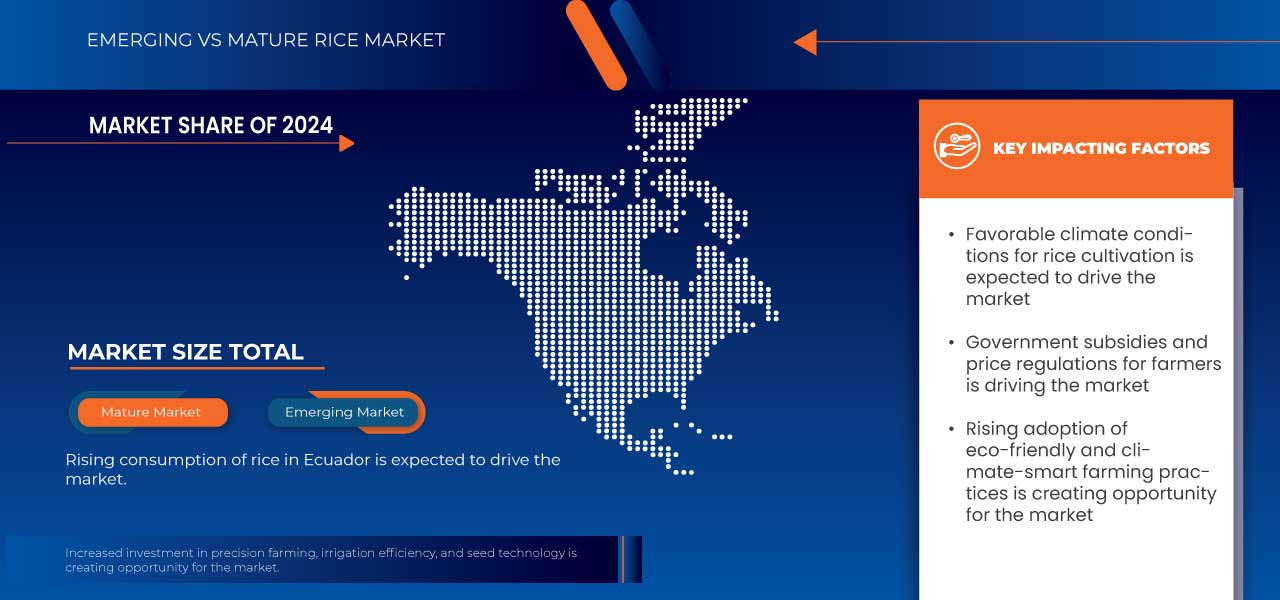
Se espera que el mercado del arroz en Ecuador alcance los USD 184,61 millones para 2032, desde los USD 142,29 millones en 2024, con un crecimiento anual compuesto (CAGR) sustancial del 3,34 % durante el período de pronóstico de 2025 a 2032. Además de la información sobre escenarios de mercado como el valor de mercado, la tasa de crecimiento, la segmentación, la cobertura geográfica y los principales actores, los informes de mercado seleccionados por Data Bridge Market Research también incluyen un análisis profundo de expertos, producción y capacidad por empresa representadas geográficamente, diseños de red de distribuidores y socios, análisis detallado y actualizado de las tendencias de precios y análisis del déficit de la cadena de suministro y la demanda.
Tendencias del mercado del arroz en Ecuador
Aumento del consumo de arroz en Ecuador
El mercado del arroz en Ecuador está impulsado por el crecimiento demográfico, lo que ha generado una mayor demanda de alimentos básicos asequibles y accesibles. El arroz, al ser una fuente rentable y versátil de carbohidratos, es la opción preferida por hogares de todos los niveles de ingresos. Además, la urbanización ha contribuido significativamente al aumento del consumo de arroz. A medida que más personas migran a las zonas urbanas, la demanda de opciones de alimentos prácticos y listos para cocinar ha aumentado, siendo el arroz un ingrediente clave en muchos platos tradicionales y modernos.
Alcance del informe y segmentación del mercado del arroz en Ecuador
|
Atributos |
Perspectivas clave del mercado del arroz ecuatoriano |
|
Segmentos cubiertos |
|
|
Territorios cubiertos |
Guayas, Los Ríos, Manabí, Loja, El Oro, Esmeraldas, Cañar, Azuay, Bolívar, Carchi, Chimborazo, Cotopaxi, Galápagos, Imbabura, Morona Santiago, Napo, Orellana, Pastaza, Pichincha, Santa Elena, Santo Domingo De Los Tsáchilas, Sucumbíos, Tungurahua, Zamora-Chinchipe |
|
Actores clave del mercado |
|
|
Oportunidades de mercado |
|
|
Conjuntos de información de datos de valor añadido |
Además de los conocimientos sobre escenarios de mercado como el valor de mercado, la tasa de crecimiento, la segmentación, la cobertura geográfica y los principales actores, los informes de mercado seleccionados por Data Bridge Market Research también incluyen un análisis profundo de expertos, producción y capacidad por empresa representadas geográficamente, diseños de red de distribuidores y socios, análisis detallado y actualizado de tendencias de precios y análisis deficitario de la cadena de suministro y la demanda. |
Definición del mercado del arroz en Ecuador
El arroz es un cereal básico cultivado globalmente y constituye la principal fuente de alimento para más de la mitad de la población mundial. Perteneciente al género Oryza, las variedades más comunes son Oryza sativa (arroz asiático) y Oryza glaberrima (arroz africano). Es rico en carbohidratos, aportando energía esencial, y se presenta en diversos tipos, como el arroz blanco, integral, basmati y jazmín. El arroz crece en diversos entornos, desde arrozales inundados hasta tierras altas áridas. Es un ingrediente fundamental en muchas cocinas, utilizándose en platos como sushi, biryani y risotto. Su versatilidad, valor nutricional y relevancia global lo convierten en un producto agrícola esencial.
Dinámica del mercado del arroz en Ecuador
Conductores
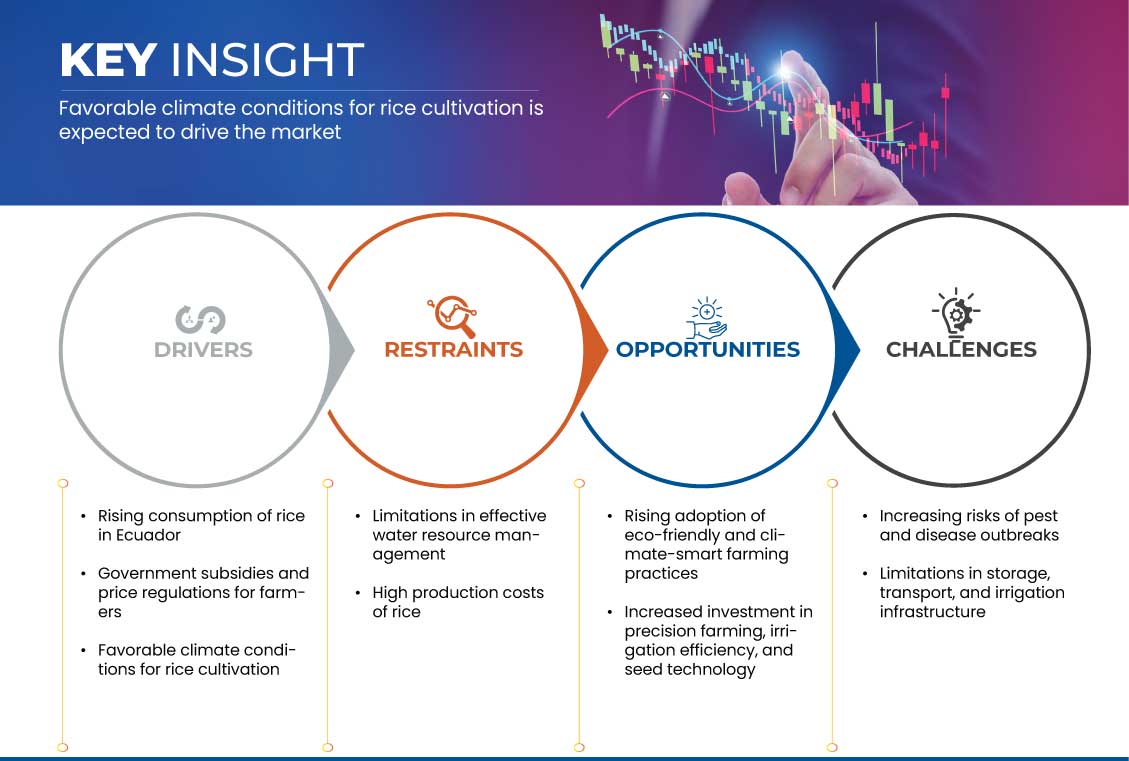
- Aumento del consumo de arroz en Ecuador
El rápido crecimiento de la automatización industrial es un factor clave en la creciente demanda de arroz ecuatoriano a nivel mundial. A medida que las industrias adoptan sistemas más automatizados para mejorar la eficiencia operativa, reducir costos y aumentar la productividad, se acentúa la necesidad de motores confiables y de alto rendimiento que puedan gestionar procesos complejos. El arroz ecuatoriano, conocido por su eficiencia energética, precisión y rendimiento constante, es crucial para impulsar esta transición hacia la automatización.
Uno de los principales impulsores del aumento del consumo de arroz es el crecimiento demográfico de Ecuador, que ha generado una mayor demanda de alimentos básicos asequibles y accesibles. El arroz, al ser una fuente rentable y versátil de carbohidratos, es la opción preferida por hogares de todos los niveles de ingresos. Además, la urbanización ha contribuido significativamente al aumento del consumo de arroz. A medida que más personas migran a las zonas urbanas, se ha disparado la demanda de opciones de alimentos prácticos y listos para cocinar, siendo el arroz un ingrediente clave en muchos platos tradicionales y modernos. Asimismo, los cambios en los hábitos alimentarios contribuyen a la creciente demanda de arroz. Si bien el arroz siempre ha sido un alimento básico en la gastronomía ecuatoriana, su consumo se ve aún más impulsado por la creciente popularidad de los productos a base de arroz y los alimentos procesados. La industria alimentaria está respondiendo a esta tendencia con la introducción de productos innovadores a base de arroz, como el arroz precocido, la harina de arroz y las comidas preparadas, que se adaptan al ajetreado estilo de vida de los consumidores urbanos.
Por ejemplo,
- En abril de 2024, según un informe del USDA, el consumo de arroz en Ecuador continúa en aumento, con un consumo total previsto para la campaña comercial 2024/25 de 915.000 toneladas, ligeramente superior al del año anterior. El consumo per cápita se sitúa en 50 kg/año, con un objetivo de la industria de 51 kg. El arroz sigue siendo el principal carbohidrato en las regiones costeras, consumido hasta tres veces al día, mientras que las poblaciones de las tierras altas lo consumen al menos una vez al día. Además, factores como el deterioro de las reservas antiguas y el mayor uso de subproductos del arroz en la alimentación animal contribuyen a un mayor consumo general.
- Según datos del CEIC, la población de Ecuador ha crecido de manera sostenida, llegando a aproximadamente 18 millones de personas en 2023, frente a los 16 millones de 2010. Este crecimiento ha incrementado directamente la demanda de alimentos básicos como el arroz, que es una piedra angular de la dieta de la mayoría de los hogares.
El creciente consumo de arroz en Ecuador es un factor clave del mercado arrocero del país, impulsado por el crecimiento poblacional, la urbanización, los cambios en la alimentación y las políticas gubernamentales favorables. Estos factores, en conjunto, contribuyen a un mercado sólido y en expansión, que ofrece importantes oportunidades para agricultores, procesadores y minoristas en la cadena de valor del arroz.
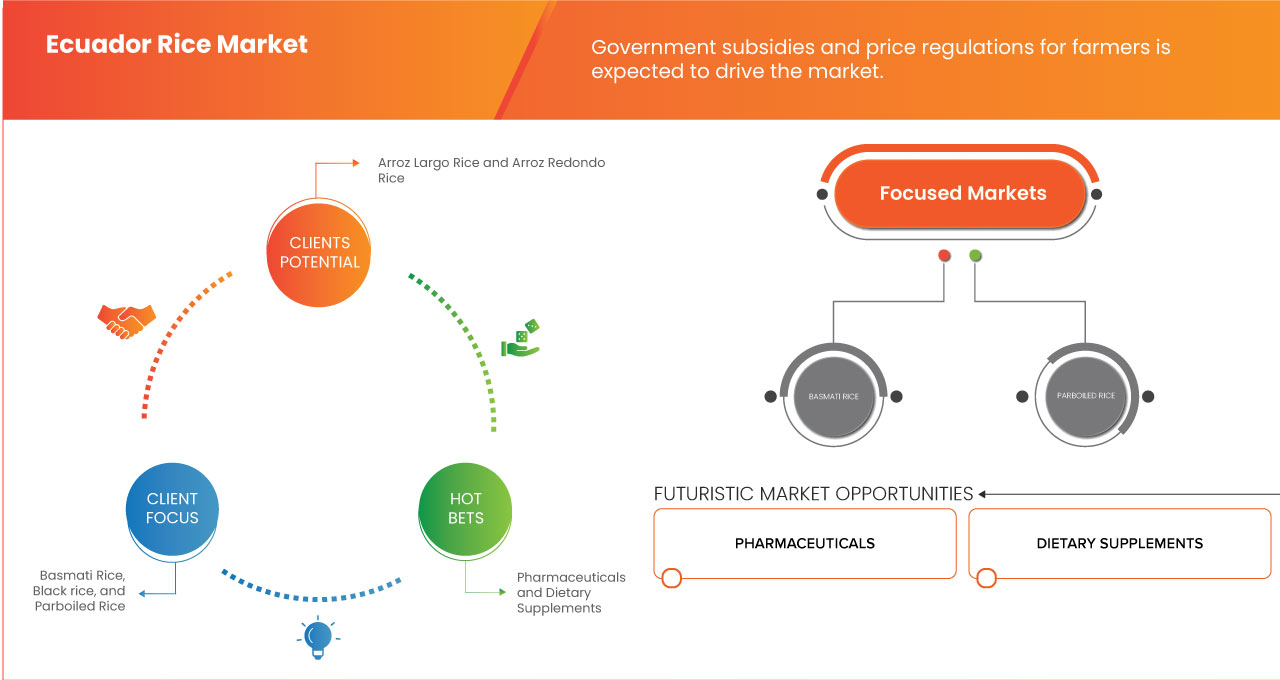
- Subvenciones gubernamentales y regulaciones de precios para los agricultores
Los subsidios gubernamentales brindan un apoyo financiero esencial a los productores de arroz, permitiéndoles cubrir los altos costos de insumos como semillas, fertilizantes y maquinaria. Al reducir la carga financiera de los agricultores, estos subsidios incentivan el aumento de la producción y la inversión en prácticas agrícolas modernas. Por ejemplo, el gobierno ecuatoriano ha implementado programas para distribuir variedades de semillas de alto rendimiento y promover técnicas agrícolas sostenibles, lo que ha resultado en una mayor productividad y un arroz de mayor calidad. Este apoyo no solo impulsa la oferta nacional, sino que también fortalece la competitividad del arroz ecuatoriano en el mercado regional.
Además de lo anterior, las regulaciones de precios son fundamentales para mantener la estabilidad del mercado. El gobierno establece precios mínimos garantizados para el arroz para proteger a los agricultores de la volatilidad de los precios causada por las fluctuaciones en los mercados globales o las condiciones climáticas impredecibles. Esto garantiza que los agricultores reciban una compensación justa por su producción, lo que los incentiva a continuar cultivando incluso en períodos difíciles. Para los consumidores, los controles de precios ayudan a mantener el arroz asequible, garantizando el acceso a este alimento básico para todos los segmentos de la población. Este doble beneficio promueve un entorno de mercado equilibrado donde tanto la oferta como la demanda se gestionan eficazmente.
Además, estas políticas contribuyen a la seguridad alimentaria al reducir la dependencia de las importaciones de arroz. Al apoyar a los agricultores locales y estabilizar los precios, el gobierno garantiza un suministro constante de arroz, incluso en períodos de inestabilidad en el mercado mundial.
Por ejemplo,
- Según un artículo publicado por la FAO (Organización de las Naciones Unidas para la Alimentación y la Agricultura), el gobierno ecuatoriano, a través del Ministerio de Agricultura y Ganadería (MAG), ha implementado programas como el Proyecto de Desarrollo Agropecuario, que brinda a los agricultores acceso subsidiado a semillas de alta calidad, fertilizantes y sistemas de riego.
- En abril de 2022, según un artículo publicado en Tridge, el gobierno ecuatoriano fijó precios mínimos garantizados para el arroz con el fin de proteger a los agricultores de la volatilidad del mercado. Por ejemplo, en 2022, el gobierno estableció un precio mínimo de USD 32 por quintal (100 kg) de arroz paddy. Este precio mínimo garantiza que los agricultores reciban una rentabilidad justa de su inversión, incluso ante fluctuaciones de los precios internacionales.
Oportunidades
- Creciente adopción de prácticas agrícolas ecológicas y climáticamente inteligentes
Los productores de arroz ecuatorianos pueden adoptar una agricultura ecológica y climáticamente inteligente para aumentar la productividad, reducir costos y mantenerse competitivos. Las principales oportunidades residen en la adopción de técnicas sostenibles de gestión del agua. Ante los desafíos que enfrenta Ecuador en materia de recursos hídricos, la implementación de sistemas de riego eficientes, como el riego por goteo y el riego de precisión, permite optimizar el uso del agua y mantener altos rendimientos. Esto no solo reduce los costos de producción, sino que también garantiza la sostenibilidad a largo plazo del cultivo de arroz. Además, los fertilizantes orgánicos y los biofertilizantes están ganando terreno como alternativas viables a los fertilizantes químicos. Ante el aumento de los costos globales de los fertilizantes, los productores de arroz ecuatorianos pueden reducir los gastos en insumos mediante la transición a mejoradores naturales del suelo que mejoran su salud y reducen el impacto ambiental. Este cambio puede posicionar al arroz ecuatoriano como un producto premium y ecológico, atrayendo a los mercados nacionales e internacionales centrados en la sostenibilidad.
Otra gran oportunidad es la integración de variedades de arroz resilientes al clima, tolerantes a la sequía y resistentes a plagas y enfermedades. Invertir en Investigación y Desarrollo (I+D) para mejorar las variedades de semillas puede aumentar la producción, reducir la dependencia de los agroquímicos y mejorar la seguridad alimentaria.
Además, el auge de los mercados de créditos de carbono y las certificaciones de sostenibilidad ofrece a los productores de arroz ecuatorianos una vía para acceder a incentivos financieros. Al adoptar técnicas agrícolas bajas en emisiones, como la labranza mínima y las prácticas de reducción de metano, los agricultores pueden obtener créditos de carbono, lo que genera una fuente adicional de ingresos.
Por ejemplo,
- En 2023, según las Naciones Unidas en Quito, Ecuador, el proyecto de Agricultura Sostenible con Inclusión y Participación de Género lleva más de una década empoderando a agricultores, especialmente a mujeres. Mediante capacitación, asistencia técnica y recursos, el programa ha permitido a miles de personas establecer huertos urbanos y adoptar prácticas agrícolas sostenibles. Esta iniciativa no solo mejora la seguridad alimentaria y la nutrición, sino que también fomenta la independencia económica y la solidaridad comunitaria entre los participantes.
A medida que crece la demanda de los consumidores de productos sostenibles y respetuosos con el clima, el sector arrocero de Ecuador puede aprovechar estas tendencias para aumentar las exportaciones, mejorar la rentabilidad y garantizar la resiliencia del mercado a largo plazo.
- Mayor inversión en agricultura de precisión, eficiencia de riego y tecnología de semillas
A medida que las tendencias agrícolas mundiales cambian hacia soluciones impulsadas por la tecnología, los productores de arroz ecuatorianos pueden aprovechar la agricultura de precisión, la eficiencia del riego y las innovaciones en tecnología de semillas para impulsar la productividad, reducir el desperdicio de recursos y mejorar la competitividad del mercado.
Las tecnologías de agricultura de precisión, como las imágenes satelitales, los sensores de suelo y el análisis de datos, permiten a los agricultores monitorear la salud del suelo, optimizar el uso de fertilizantes y predecir los rendimientos con mayor precisión. Al integrar estas herramientas, los productores de arroz ecuatorianos pueden aumentar la eficiencia, minimizar los costos de insumos y mejorar el rendimiento general del cultivo. La adopción de maquinaria automatizada y equipos guiados por GPS también puede optimizar las operaciones de campo, reduciendo los costos de mano de obra y mejorando la eficiencia de la cosecha. La eficiencia del riego es otra área importante de oportunidad. Ante la escasez de recursos hídricos en Ecuador, la inversión en riego por goteo, nivelación láser de terrenos y sistemas de riego sensibles a la humedad puede ayudar a los agricultores a optimizar el uso del agua y mantener los rendimientos incluso en regiones propensas a la sequía. Estas tecnologías mejoran las iniciativas de conservación del agua, garantizando la sostenibilidad a largo plazo de la producción de arroz y reduciendo la dependencia de los patrones erráticos de lluvia.
Los avances en la tecnología de semillas pueden brindar una oportunidad adicional de crecimiento para la industria arrocera ecuatoriana. Las variedades de arroz de alto rendimiento, resistentes a la sequía y a las plagas pueden mejorar significativamente la productividad, a la vez que reducen la dependencia de los agroquímicos. Al invertir en Investigación y Desarrollo (I+D) y promover el uso de semillas genéticamente mejoradas, Ecuador puede aumentar la producción de arroz, fortalecer la seguridad alimentaria y ampliar las oportunidades de exportación.
Por ejemplo,
- En octubre de 2024, según un artículo de investigación publicado en ResearchGate GmbH, la integración de la tecnología de drones en la agricultura está transformando la agricultura tradicional al permitir la agricultura de precisión, la monitorización del estado de los cultivos y la pulverización eficiente de pesticidas. Los agricultores que utilizan drones pueden evaluar rápidamente las condiciones del campo, detectar enfermedades de forma temprana y aplicar insumos con mayor precisión, reduciendo el desperdicio y aumentando la producción. Estudios de caso a nivel mundial demuestran que los drones mejoran la productividad, minimizan el impacto ambiental y promueven prácticas agrícolas sostenibles, lo que los convierte en una herramienta valiosa para la agricultura moderna.
- En agosto de 2023, según un artículo publicado por el Banco Mundial, el Proyecto de Riego Tecnificado (PIT), respaldado por el Banco Mundial y la AECID, mejoró significativamente el acceso al agua para más de 6.000 familias y 6.300 hectáreas en Ecuador. Los agricultores ahora se benefician de una gestión eficiente del agua, lo que se traduce en un mayor rendimiento de los cultivos y un aumento de sus ingresos.
La integración de estas prácticas agrícolas modernas no solo mejorará la eficiencia de la producción arrocera de Ecuador, sino que también posicionará al país como líder en el cultivo de arroz sostenible y tecnológicamente avanzado. Esta transición hacia una agricultura impulsada por la innovación abrirá las puertas a una mayor rentabilidad, una mejor calidad y una mayor resiliencia ante las fluctuaciones climáticas y del mercado.
Restricciones/Desafíos
- Las industrias aumentan el riesgo de brotes de plagas y enfermedades
La creciente frecuencia y gravedad de los brotes de plagas y enfermedades representa un desafío significativo para el mercado arrocero ecuatoriano, amenazando la productividad, la calidad y la rentabilidad. Con el cambio climático, el aumento de las temperaturas y la humedad crea un entorno más favorable para plagas y patógenos, lo que provoca mayores pérdidas de cultivos y un aumento de los costos de producción.
Plagas como la sogata (Tagosodes orizicolus), los barrenadores del tallo del arroz y las chinches del arroz son cada vez más frecuentes, causando graves daños a las plantas de arroz al alimentarse de la savia y debilitar los tallos. Esto conlleva menores rendimientos y mala calidad del grano, lo que afecta tanto al suministro interno como al potencial de exportación. Además, la resistencia de los insectos a los métodos de control químico dificulta y encarece cada vez más el manejo de plagas para los agricultores. En cuanto a enfermedades, infecciones fúngicas como el tizón del arroz (Pyricularia oryzae) y el virus de la hoja blanca, transmitidas por plagas, se están propagando con mayor rapidez. Estas enfermedades causan decoloración de las hojas, retraso en el crecimiento y reducción de la formación del grano, lo que reduce significativamente la producción total de la cosecha. Con variedades de arroz resistentes a enfermedades inadecuadas y un acceso limitado a soluciones avanzadas de protección de cultivos, los agricultores ecuatorianos enfrentan crecientes dificultades para mitigar estos riesgos.
La carga económica del manejo de plagas y enfermedades está aumentando, obligando a los agricultores a incrementar el uso de pesticidas, invertir en costosas semillas resistentes a las enfermedades y adoptar prácticas de monitoreo más intensivas. Esto no solo incrementa los costos de producción, sino que también genera inquietud sobre la sostenibilidad ambiental y la salud del suelo a largo plazo.
Por ejemplo,
- En octubre de 2024, según un artículo de investigación publicado por la Universidad de Florida, la enfermedad del tizón del arroz, un patógeno fúngico altamente destructivo, representa una grave amenaza para el cultivo de arroz en Ecuador, al reducir significativamente el rendimiento y la calidad de los cultivos. Con esta enfermedad, capaz de destruir entre el 10 % y el 30 % del arroz cosechado a nivel mundial, los productores de arroz ecuatorianos, especialmente en Guayas y Los Ríos, son cada vez más vulnerables debido a las condiciones climáticas húmedas que favorecen el crecimiento de hongos.
El creciente riesgo de brotes de plagas y enfermedades representa un serio desafío para el mercado arrocero ecuatoriano, afectando el rendimiento, la calidad y la rentabilidad general de los cultivos. Con condiciones climáticas favorables que aceleran la propagación de plagas como la sogata y los barrenadores del tallo, así como enfermedades como el tizón del arroz y el virus de la hoja blanca, los agricultores se enfrentan a un aumento de los costos de producción y a una mayor incertidumbre. La dependencia de los controles químicos, la falta de acceso generalizado a variedades resistentes a las enfermedades y las preocupaciones ambientales complican aún más la situación.
- Limitaciones en la gestión eficaz de los recursos hídricos
La deficiente infraestructura de riego y el control insuficiente del agua en las zonas de secano generan incertidumbre para los agricultores, lo que se traduce en rendimientos inconsistentes y mayores riesgos para la producción. Estos desafíos no solo afectan el crecimiento y la calidad de los cultivos, sino que también contribuyen a las fluctuaciones de la oferta que afectan los precios y la competitividad del mercado.
La producción arrocera de Ecuador depende en gran medida de un sistema de doble temporada, con cultivo tanto durante la temporada húmeda como durante la seca. Sin embargo, los sistemas de riego ineficientes limitan la capacidad de los agricultores para maximizar la producción durante los períodos secos, lo que hace que la producción de arroz dependa en gran medida de las precipitaciones. En las zonas de secano, la falta de una adecuada regulación hídrica provoca un exceso de agua en algunas regiones y escasez en otras, lo que provoca un desarrollo desigual de los cultivos y pérdidas de rendimiento. Además, las ineficiencias en la gestión del agua aumentan la vulnerabilidad a las variaciones climáticas, en particular durante los fenómenos de El Niño y La Niña, que generan condiciones climáticas extremas. Las lluvias intensas pueden inundar los arrozales, dañando los cultivos, mientras que las sequías prolongadas generan escasez de agua, reduciendo las áreas de siembra y la producción general. Estas incertidumbres interrumpen la cadena de suministro, generando volatilidad de precios y afectando tanto a productores como a consumidores.
La deficiente infraestructura hídrica también limita la expansión del cultivo de arroz y desalienta la inversión en el sector. Los agricultores se enfrentan a mayores costos operativos al depender de costosos métodos de riego alternativos, lo que reduce la rentabilidad y hace que el cultivo de arroz sea menos sostenible a largo plazo.
Por ejemplo
- Según un artículo publicado en el SDGF, Ecuador enfrenta problemas de gestión de los recursos hídricos, como la contaminación de ríos, la disminución de la disponibilidad de agua superficial y la sobreexplotación de los acuíferos. La falta de políticas hídricas nacionales y la falta de datos hidrológicos actualizados han debilitado aún más la gobernanza del agua. La coordinación ineficiente entre instituciones y la gestión inadecuada de las cuencas hidrográficas han provocado una mala distribución de los recursos. La financiación insuficiente y la normativa deficiente dificultan el acceso sostenible al agua para la agricultura y otros sectores.
Los factores relacionados con la gestión de los recursos hídricos suponen una limitación significativa para el mercado arrocero ecuatoriano, ya que reducen la eficiencia de la producción, aumentan los riesgos climáticos y generan inestabilidad en la cadena de suministro. Sin un acceso confiable al agua, el sector tiene dificultades para mantener un crecimiento constante, lo que afecta tanto el suministro interno como la competitividad del mercado.
Panorama del mercado del arroz en Ecuador
El mercado está segmentado según el tipo de arroz, el color, el tamaño del grano, la naturaleza, el contenido de almidón, la forma de procesamiento, el grado de molienda, el pulido, la fortificación, el aroma, los derivados del arroz, el usuario final y el canal de distribución. El crecimiento de estos segmentos le ayudará a analizar los segmentos de menor crecimiento en las industrias y proporcionará a los usuarios una valiosa visión general del mercado y perspectivas que les ayudarán a tomar decisiones estratégicas para identificar las principales aplicaciones del mercado.
Tipo
- Arroz Largo Rice
- Arroz vaporizado
- Arroz Redondo
- Arroz Calrose
- Arroz basmati
- Arroz jazmín
- Arroz para sushi
- Arroz glutinoso
- Arroz salvaje
- Arroz Arborio
- Arroz Basmati 370
- Arroz butanés
- Arroz bomba
- Arroz rubio de California
- Arroz de Camarga
- Arroz Carnaroli
- Arroz de coliflor
- Arroz Colusari
- Arroz Doongara
- Arroz egipcio
- Arroz glutinoso (pegajoso)
- Arroz Matta
- Arroz japónica de caoba
- Arroz Koshihikari
- Arroz Calmochi
- Arroz Rosematta
- Arroz Akitakomachi
- Otros
Color del arroz
- Arroz blanco
- Arroz integral
- Arroz rojo
- Arroz negro
Tamaño del grano/tamaño del grano
- Arroz de grano largo
- Arroz de grano medio
- Arroz de grano corto
Naturaleza
- Convencional
- Orgánico
Contenido de almidón
- Amilosa
- Amilopectina
Formulario de procesamiento
- Arroz molido regular
- Parboiled
- Arroz precocido
- Mezclas de arroz sazonado
- Listo para servir
- Arroz congelado rápidamente de forma individual (IQF)
- Arroz de retorta
- Otros
Grado de fresado
- Arroz blanco
- Arroz integral
- Arroz en bruto
Pulido
- Pulido
- Sin pulir
Fortificación
- Regular / Sin fortificar
- Fortificado
- Fortificado por proceso
- El secado
- Revestimiento
- Extrusión en caliente
- Encapsulación
- Otros
- Fortificado por proceso
Aroma
- Arroz no aromático
- Arroz aromático
- Arroz aromático, por tipo
- Basmati
- Jazmín
- Arborio
- Arroz dulce
- Rojo aromático
- Japónica negra
- Otros
- Arroz aromático, por tipo
Derivados del arroz
- Harina de arroz
- Aceite de salvado de arroz
- Arroz partido
- almidón de arroz
- salvado de arroz
- Proteína de arroz
- Jarabe de arroz
- cáscara de arroz
- Leche de arroz
- Vinagre de arroz
- Alcoholes a base de arroz
- Otros
Usuario final
- Consumo directo / Hogar
- Alimentos y bebidas
- Alimentos y bebidas, por tipo
- Alimento
- Comida, por tipo
- Panadería
- Panadería, por tipo
- Panes y panecillos
- Galletas y bizcochos
- Tortas y pasteles
- Muffins
- Donas
- Otros
- Panes y panecillos
- Panadería, por tipo
- Alimento
- Alimentos y bebidas, por tipo
- Alimentos procesados
- Alimentos procesados, por tipo
- Fideos
- Pastas
- Snacks extruidos
- Sopas y salsas
- Otros
- Alimentos procesados, por tipo
- Alimentos alternativos a los lácteos
- Confitería
- Confitería, por tipo
- Chocolates
- Confitería de azúcar
- Gomitas
- Caramelos duros
- Otros
- Confitería, por tipo
- Fórmula infantil
- Fórmula infantil, por tipo
- Fórmula infantil estándar
- Fórmula de seguimiento
- Creciendo con leche
- Fórmula especial
- Otros
- Fórmula infantil, por tipo
- Cereales para el desayuno
- Productos lácteos
- Productos lácteos, por tipo
- Yogur
- Queso
- Helado
- Manteca
- Otros
- Productos de carne y aves de corral
- Aderezos y condimentos
- Otros
- Productos lácteos, por tipo
- Bebidas
- Bebidas, por tipo
- Jugos
- Bebidas gaseosas
- Bebidas a base de lácteos
- Bebidas de yogur
- Bebidas saludables
- Bebidas saludables, por tipo
- Bebidas de hidratación con electrolitos
- Bebidas proteicas
- Refuerzos de inmunidad
- Disparos al estómago
- Otros
- Agua probiótica
- Bebidas de kombucha
- Otros
- Bebidas, por tipo
- Alimentar
- Feed, por categoría
- Aves de corral
- Aves de corral, por tipo
- Pollos de engorde
- Capas
- Criadores
- Pollitos y pavipollos
- Otros
- Aves de corral, por tipo
- Rumiantes
- Rumiantes, por tipo
- Vacas lecheras
- Ganado vacuno
- Terneros
- Otros
- Rumiantes, por tipo
- Cerdo
- Porcinos, por tipo
- Cultivador
- Motor de arranque
- Sembrar
- Otros
- Porcinos, por tipo
- Mascota
- Mascota, por tipo
- Perro
- Gato
- Conejo
- Caballo
- Ratones
- Otros
- Mascota, por tipo
- Animal acuático
- Animal acuático, por tipo
- Crustáceos
- Crustáceos, por tipo
- Tilapia
- Carpa
- Trucha
- Salmón
- Otros
- Animal acuático, por tipo
- Pez
- Pescado, por tipo
- Camarón
- Cangrejos
- Krill
- Otros
- Pescado, por tipo
- Moluscos
- Moluscos, por tipo
- Ostras
- mejillones
- Otros
- Otros
- Moluscos, por tipo
- Aves de corral
- Otros
- Alimentación, por función de salud
- Consumo y eficiencia del alimento
- Producir
- Salud intestinal
- Nutrición
- Producción y calidad de huevos
- Inmunidad
- Otros
- Consumo y eficiencia del alimento
- Alimentación, por función de salud
- Feed, por categoría
- productos farmacéuticos
- Productos farmacéuticos, por aplicación
- Salud gastrointestinal
- Modulación del sistema inmunitario
- Trastornos intestinales
- Trastornos metabólicos
- Salud cardiovascular
- Manejo de alergias
- Trastornos inflamatorios intestinales
- Infecciones respiratorias
- Salud mental (psicobióticos)
- Intolerancia a la lactosa
- Obesidad
- Infecciones urogenitales
- Infecciones urogenitales, por tipo
- Diabetes tipo 2
- Cáncer
- Infecciones urogenitales, por tipo
- Productos farmacéuticos, por aplicación
- Salud bucal y dental
- Otros
- Productos farmacéuticos, forma de subproducto
- Tabletas
- Cápsulas
- Bebidas probióticas
- Polvos
- Otros
- Productos farmacéuticos, forma de subproducto
- Cosméticos y cuidado personal
- Cosméticos y cuidado personal, por categoría
- Productos para el cuidado facial
- Productos para el cuidado facial, por tipo
- Cremas y lociones
- Sueros
- Exfoliantes y mascarillas
- Otros
- Productos para el cuidado facial
- Cosméticos y cuidado personal, por categoría
- Productos para el cuidado del cabello
- Productos para el cuidado del cabello, por tipo
- Champú
- Acondicionadores
- Otros
- Productos para el cuidado corporal
- Productos de maquillaje
- Otros
- Productos para el cuidado del cabello, por tipo
- Suplementos dietéticos
- Suplementos dietéticos, por tipo
- Salud inmunológica
- Salud intestinal y digestiva
- Energía y control del peso
- Salud de la mujer
- Aptitud deportiva
- Salud general
- Salud de los huesos y las articulaciones
- Salud gastrointestinal
- Salud mental y cerebral
- Piel/Cabello/Uñas
- Salud cardíaca
- Diabetes
- Anticáncer
- Inmunidad
- Otros
- Suplementos dietéticos, por tipo
- Suplementos dietéticos, por forma de producto
- Cápsulas
- Polvos
- Cápsulas blandas
- Masticables y gomitas
- Otros
- Otros
Canal de distribución
- Desconectado
- Fuera de línea, por tipo
- Ventas minoristas
- Ventas minoristas, por tipo de canal
- Supermercados / Hipermercados
- Mercados locales
- Tiendas especializadas
- Otros
- Ventas minoristas, por tipo de canal
- Ventas minoristas
- Mayoristas / Distribuidores
- Restaurantes
- Cadenas alimentarias (incluidas las cocinas nacionales e internacionales)
- Agricultura
- Programas alimentarios del gobierno (como los subsidios)
- Distribución pública de alimentos
- Otros
- Fuera de línea, por tipo
- En línea
- En línea, por tipo
- Sitios web propiedad de la empresa
- Sitios web de comercio electrónico
- En línea, por tipo
Territorio
- Guayas
- Los Ríos
- Manabí
- Loja
- El Oro
- Esmeraldas
- Cañar
- Azuay
- Bolívar
- Carchi
- Chimborazo
- Cotopaxi
- Galápagos
- Imbabura
- Morona Santiago
- Napo
- Orellana
- Pastaza
- Pichincha
- Santa Elena
- Santo Domingo De Los Tsachilas
- Sucumbíos
- Tungurahua
- Zamora-Chinchipe
Análisis regional del mercado del arroz en Ecuador
Se analiza el mercado y se proporcionan información sobre el tamaño del mercado y las tendencias según el tipo, el color del arroz, el tamaño del grano/tamaño del grano, la naturaleza, el contenido de almidón, la forma de procesamiento, el grado de molienda, el pulido, la fortificación, el aroma, los derivados del arroz, el usuario final y el canal de distribución como se mencionó anteriormente.
Los territorios que abarca el mercado son Guayas, Los Ríos, Manabí, Loja, El Oro, Esmeraldas, Cañar, Azuay, Bolívar, Carchi, Chimborazo, Cotopaxi, Galápagos, Imbabura, Morona Santiago, Napo, Orellana, Pastaza, Pichincha, Santa Elena, Santo Domingo De Los Tsáchilas, Sucumbíos, Tungurahua y Zamora-Chinchipe.
Se espera que Guayas domine el mercado gracias a su clima favorable, suelo fértil y alta capacidad de producción de arroz. Como principal provincia productora de arroz de Ecuador, Guayas mantiene una sólida oferta interna, satisfaciendo la demanda de los consumidores e impulsando eficientemente el crecimiento del mercado.
Guayas es la región de más rápido crecimiento en el mercado, impulsada por su centro económico, la industrialización, el desarrollo de infraestructura y el aumento de las inversiones.
La sección de países del informe también presenta los factores que impactan el mercado individual y los cambios en la regulación del mercado nacional, los cuales impactan las tendencias actuales y futuras. Datos como el análisis de la cadena de valor aguas abajo y aguas arriba, las tendencias técnicas, el análisis de las cinco fuerzas de Porter y los estudios de caso son algunos de los indicadores utilizados para pronosticar el escenario del mercado en cada país. Asimismo, se considera la presencia y disponibilidad de marcas regionales y los desafíos que enfrentan debido a la alta o escasa competencia de marcas locales y nacionales, el impacto de los aranceles internos y las rutas comerciales, al proporcionar un análisis de pronóstico de los datos nacionales.
Cuota de mercado del arroz de Ecuador
El panorama competitivo del mercado proporciona detalles por competidores. Se incluye información general de la empresa, sus estados financieros, ingresos generados, potencial de mercado, inversión en investigación y desarrollo, nuevas iniciativas de mercado, presencia regional, plantas de producción, capacidad de producción, fortalezas y debilidades de la empresa, lanzamiento de productos, alcance y variedad de productos, y dominio de las aplicaciones. Los datos anteriores se refieren únicamente al enfoque de mercado de las empresas.
Los líderes del mercado del arroz de Ecuador que operan en el mercado son:
- LT Foods (India)
- KRBL (India)
- DAJAHU (Ecuador)
- Kohinoor (India)
- Alimentos Ltd. (India)
- Industrias agropecuarias Baghel (India)
- HealGuru Internacional (India)
- Molino de arroz y legumbres Vikas (India)
- Hierbas Al-Fiza (India)
Últimos avances en el mercado del arroz en Ecuador
- En noviembre de 2024, LT Foods, empresa global de bienes de consumo de alta rotación (FMCG), se expandió a Arabia Saudita con la inauguración de una nueva oficina en Riad. Esta estrategia busca aprovechar el mercado de arroz y alimentos a base de arroz, valorado en 2000 millones de dólares, del Reino. Durante los próximos cinco años, LT Foods planea invertir 185 millones de SAR en almacenamiento, existencias y personal, con el objetivo de alcanzar ingresos de 435 millones de SAR. Con marcas como DAAWAT, Hadeel y Mufaddal, la empresa busca satisfacer la creciente demanda de productos de arroz premium en la región.
- En diciembre de 2023, DAAWAT, la marca insignia de LT Foods, fue reconocida como la "Marca Líder" en las calificaciones de arroz seco de Canstar Blue en Australia. El reconocimiento se basó en la obtención de cinco estrellas en diversos parámetros, como sabor, textura, conveniencia del empaque, variedad y gama, y satisfacción general. Este galardón refleja el compromiso de DAAWAT con la entrega de productos de arroz de alta calidad que conecten con los consumidores australianos.
- En septiembre de 2023, LT Foods amplió su portafolio de superalimentos con el lanzamiento del arroz rojo de cocción rápida Daawat, dirigido a consumidores preocupados por su salud. Este arroz, rico en nutrientes, tiene un alto contenido de fitonutrientes y fibra, lo que ofrece múltiples beneficios para la salud y se cocina en tan solo 15 minutos. Envasado en una lata coleccionable y reutilizable de 1 kg, está disponible en las principales plataformas de comercio electrónico y tiendas minoristas modernas de varios estados de la India. Este lanzamiento se suma al éxito del arroz negro de cocción rápida Daawat, lo que refuerza el compromiso de LT Foods de ofrecer opciones de alimentos prácticos y saludables.
SKU-
Obtenga acceso en línea al informe sobre la primera nube de inteligencia de mercado del mundo

- Panel de análisis de datos interactivo
- Panel de análisis de empresas para oportunidades con alto potencial de crecimiento
- Acceso de analista de investigación para personalización y consultas
- Análisis de la competencia con panel interactivo
- Últimas noticias, actualizaciones y análisis de tendencias
- Aproveche el poder del análisis de referencia para un seguimiento integral de la competencia
Tabla de contenido
1 INTRODUCTION
1.1 OBJECTIVES OF THE STUDY
1.2 MARKET DEFINITION
1.3 OVERVIEW
1.4 LIMITATIONS
1.5 MARKETS COVERED
2 MARKET SEGMENTATION
2.1 MARKETS COVERED
2.2 GEOGRAPHICAL SCOPE
2.3 YEARS CONSIDERED FOR THE STUDY
2.4 CURRENCY AND PRICING
2.5 DBMR TRIPOD DATA VALIDATION MODEL
2.6 MULTIVARIATE MODELING
2.7 PRIMARY INTERVIEWS WITH KEY OPINION LEADERS
2.8 DBMR MARKET POSITION GRID
2.9 DBMR VENDOR SHARE ANALYSIS
2.1 MARKET END-USER GRID
2.11 SECONDARY SOURCES
2.12 ASSUMPTIONS
3 EXECUTIVE SUMMARY
4 PREMIUM INSIGHTS
4.1 ECUADOR RICE DERIVATIVES
4.1.1 RICE PRODUCTION IN ECUADOR
4.1.2 RICE DERIVATIVES: GROWING DEMAND AND APPLICATIONS
4.1.2.1 RICE BRAN OIL
4.1.2.2 RICE FLOUR
4.1.2.3 RICE STARCH
4.1.2.4 RICE BRAN MEAL AND ANIMAL FEED
4.1.2.5 FERMENTED RICE PRODUCTS
4.1.2.6 GLOBAL COMPETITION AND MARKET DYNAMICS
4.1.3 CONCLUSION
4.2 FACTORS INFLUENCING PURCHASING DECISION OF END-USERS
4.2.1 PRICE AND AFFORDABILITY
4.2.2 QUALITY AND GRAIN CHARACTERISTICS
4.2.3 BRAND AND PACKAGING
4.2.4 AVAILABILITY AND ACCESSIBILITY
4.2.5 HEALTH AND NUTRITIONAL BENEFITS
4.2.6 CULTURAL AND REGIONAL PREFERENCES
4.2.7 CONSUMER AWARENESS AND MARKETING INFLUENCE
4.2.8 ENVIRONMENTAL AND ETHICAL CONSIDERATIONS
4.2.9 CONCLUSION
4.3 GROWTH STRATEGIES ADOPTED BY KEY MARKET PLAYERS
4.3.1 INVESTMENT IN MODERN AGRICULTURAL TECHNOLOGIES
4.3.2 PRODUCT DIVERSIFICATION AND VALUE-ADDED OFFERINGS
4.3.3 EXPANSION OF DISTRIBUTION CHANNELS
4.3.4 STRATEGIC PARTNERSHIPS AND COLLABORATIONS
4.3.5 FOCUS ON SUSTAINABILITY AND ECO-FRIENDLY PRACTICES
4.3.6 BRAND POSITIONING AND MARKETING INNOVATIONS
4.3.7 CONCLUSION
4.4 INDUSTRY TRENDS AND FUTURE PERSPECTIVES IN ECUADOR’S RICE MARKET
4.4.1 INCREASING ADOPTION OF PRECISION AGRICULTURE
4.4.2 GROWTH OF SUSTAINABLE AND CLIMATE-RESILIENT PRACTICES
4.4.3 EXPANSION OF DIGITAL MARKETPLACES AND E-COMMERCE
4.4.4 GOVERNMENT SUPPORT AND POLICY REFORMS
4.4.5 INCREASING INTEREST IN EXPORT OPPORTUNITIES
4.4.6 FUTURE PERSPECTIVES
4.5 OVERVIEW OF TECHNOLOGICAL INNOVATIONS
4.5.1 TECHNIFIED IRRIGATION SYSTEMS
4.5.2 SYSTEM OF RICE INTENSIFICATION (SRI)
4.5.3 DRONE TECHNOLOGY FOR CROP PROTECTION
4.5.4 DIGITAL AGRICULTURE – AGROTIC AND SMART FARMING
4.5.5 CONCLUSION
4.6 PORTER’S FIVE FORCES
4.6.1 THREAT OF NEW ENTRANTS
4.6.2 BARGAINING POWER OF SUPPLIERS
4.6.3 BARGAINING POWER OF BUYERS
4.6.4 THREAT OF SUBSTITUTE PRODUCTS
4.6.5 INDUSTRY RIVALRY
4.6.6 CONCLUSION
4.7 PRICING ANALYSIS
4.8 PRODUCTION CAPACITY FOR TOP MANUFACTURERS
4.9 VALUE CHAIN ANALYSIS
4.9.1 RAW MATERIAL PROCUREMENT (SEED VARIETIES & AGRICULTURAL INPUTS)
4.9.2 RICE MILLING AND PROCESSING
4.9.3 COMPOUNDING AND ADDITIVES
4.9.4 COMPOUNDING AND ADDITIVES
4.9.5 PACKAGING AND LABELING
4.9.6 END-USE APPLICATIONS (FINAL PRODUCTS)
4.9.7 CONCLUSION
4.1 BRAND OUTLOOK
4.10.1 COMPARATIVE BRAND ANALYSIS
4.10.2 PRODUCT VS BRAND OVERVIEW
4.10.3 PRIVATE LABEL VS BRAND ANALYSIS
4.11 CLIMATE CHANGE SCENARIO FOR THE ECUADOR RICE MARKET
4.11.1 ENVIRONMENTAL CONCERNS
4.11.2 INDUSTRY RESPONSE
4.11.3 GOVERNMENT’S ROLE
4.11.4 ANALYST RECOMMENDATIONS
4.11.5 CONCLUSION
4.12 IMPACT OF ECONOMIC SLOWDOWN ON THE ECUADOR RICE MARKET
4.12.1 IMPACT ON PRICE
4.12.2 IMPACT ON SUPPLY CHAIN
4.12.3 IMPACT ON SHIPMENT
4.12.4 IMPACT ON COMPANY’S STRATEGIC DECISIONS
4.12.5 CONCLUSION
4.13 IMPORT-EXPORT SCENARIO
4.13.1 CONCLUSION
4.14 RAW MATERIAL COVERAGE
4.14.1 AGRICULTURAL INPUTS (SEEDS & CROP MANAGEMENT)
4.14.2 RICE CROP PROTECTION (PESTICIDES, HERBICIDES & FUNGICIDES)
4.14.3 RICE MILLING AND PROCESSING RAW MATERIALS
4.14.4 PACKAGING MATERIALS
4.14.5 RECYCLING AND SUSTAINABILITY INITIATIVES
4.14.6 CONCLUSION
4.15 SUPPLY CHAIN ANALYSIS
4.15.1 OVERVIEW
4.15.2 LOGISTIC COST SCENARIO
4.15.3 IMPORTANCE OF LOGISTICS SERVICE PROVIDERS
5 REGULATORY COVERAGE
6 MARKET OVERVIEW
6.1 DRIVERS
6.1.1 RISING CONSUMPTION OF RICE IN ECUADOR
6.1.2 GOVERNMENT SUBSIDIES AND PRICE REGULATIONS FOR FARMERS
6.1.3 FAVORABLE CLIMATE CONDITIONS FOR RICE CULTIVATION
6.2 RESTRAINTS
6.2.1 LIMITATIONS IN EFFECTIVE WATER RESOURCE MANAGEMENT
6.2.2 HIGH PRODUCTION COSTS OF RICE
6.3 OPPORTUNITIES
6.3.1 RISING ADOPTION OF ECO-FRIENDLY AND CLIMATE-SMART FARMING PRACTICES
6.3.2 INCREASED INVESTMENT IN PRECISION FARMING, IRRIGATION EFFICIENCY, AND SEED TECHNOLOGY
6.4 CHALLENGES
6.4.1 INCREASING RISKS OF PEST AND DISEASE OUTBREAKS
6.4.2 LIMITATIONS IN STORAGE, TRANSPORT, AND IRRIGATION INFRASTRUCTURE
7 ECUADOR RICE MARKET, BY TYPE
7.1 OVERVIEW
7.2 ARROZ LARGO RICE
7.3 PARBOILED RICE
7.4 ARROZ REDONDO RICE
7.5 CALROSE RICE
7.6 BASMATI RICE
7.7 JASMINE RICE
7.8 SUSHI RICE
7.9 GLUTINOUS RICE
7.1 WILD RICE
7.11 ARBORIO RICE
7.12 BASMATI 370 RICE
7.13 BHUTANESE RICE
7.14 BOMBA RICE
7.15 CALIFORNIA BLONDE RICE
7.16 CAMARGUE RICE
7.17 CARNAROLI RICE
7.18 CAULIFLOWER RICE
7.19 COLUSARI RICE
7.2 DOONGARA RICE
7.21 EGYPTIAN RICE
7.22 GLUTINOUS (STICKY) RICE
7.23 MATTA RICE
7.24 MAHOGANY JAPONICA RICE
7.25 KOSHIHIKARI RICE
7.26 CALMOCHI RICE
7.27 ROSEMATTA RICE
7.28 AKITAKOMACHI RICE
7.29 OTHERS
8 ECUADOR RICE MARKET, BY RICE COLOR
8.1 OVERVIEW
8.2 WHITE RICE
8.3 BROWN RICE
8.4 RED RICE
8.5 BLACK RICE
9 ECUADOR RICE MARKET, BY GRAIN SIZE/KERNEL SIZE
9.1 OVERVIEW
9.2 LONG GRAIN RICE
9.3 MEDIUM GRAIN RICE
9.4 SHORT GRAIN RICE
10 ECUADOR RICE MARKET, BY NATURE
10.1 OVERVIEW
10.2 CONVENTIONAL
10.3 ORGANIC
11 ECUADOR RICE MARKET, BY STARCH CONTENT
11.1 OVERVIEW
11.2 AMYLOSE
11.3 AMYLOPECTIN
12 ECUADOR RICE MARKET, BY PROCESSING FORM
12.1 OVERVIEW
12.2 REGULAR MILLED RICE
12.3 PARBOILED
12.4 PRE-COOKED RICE
12.5 SEASONED RICE MIXES
12.6 READY TO-SERVE
12.7 INDIVIDUALLY QUICK-FROZEN (IQF) RICE
12.8 RETORT RICE
12.9 OTHERS
13 ECUADOR RICE MARKET, BY DEGREE OF MILLING
13.1 OVERVIEW
13.2 WHITE RICE
13.3 WHOLE GRAIN RICE
13.4 ROUGH RICE
14 ECUADOR RICE MARKET, BY POLISHING
14.1 OVERVIEW
14.2 POLISHED
14.3 UNPOLISHED
15 ECUADOR RICE MARKET, BY FORTIFICATION
15.1 OVERVIEW
15.2 REGULAR / UNFORTIFIED
15.3 FORTIFIED
16 ECUADOR RICE MARKET, BY AROMA
16.1 OVERVIEW
16.2 NON-AROMATIC RICE
16.3 AROMATIC RICE
17 ECUADOR RICE MARKET, BY RICE DERIVATIVES
17.1 OVERVIEW
17.2 RICE FLOUR
17.3 RICE BRAN OIL
17.4 BROKEN RICE
17.5 RICE STARCH
17.6 RICE BRAN
17.7 RICE PROTEIN
17.8 RICE SYRUP
17.9 RICE HUSK
17.1 RICE MILK
17.11 RICE VINEGAR
17.12 RICE-BASED ALCOHOLS
17.13 OTHERS
18 ECUADOR RICE MARKET, BY END-USER
18.1 OVERVIEW
18.2 DIRECT CONSUMPTION / HOUSEHOLD
18.3 FOOD AND BEVERAGES
18.4 FEED
18.5 PHARMACEUTICALS
18.6 COSMETICS AND PERSONAL CARE
18.7 DIETARY SUPPLEMENTS
18.8 OTHERS
19 ECUADOR RICE MARKET, BY DISTRIBUTION CHANNEL
19.1 OVERVIEW
19.2 OFFLINE
19.3 ONLINE
20 ECUADOR RICE MARKET
20.1 ECUADOR
20.1.1 GUAYAS
20.1.2 LOS RÍOS
20.1.3 MANABÍ
20.1.4 LOJA
20.1.5 EL ORO
20.1.6 ESMERALDAS
20.1.7 CAÑAR
20.1.8 AZUAY
20.1.9 BOLÍVAR
20.1.10 CARCHI
20.1.11 CHIMBORAZO
20.1.12 COTOPAXI
20.1.13 GALÁPAGOS
20.1.14 IMBABURA
20.1.15 MORONA SANTIAGO
20.1.16 NAPO
20.1.17 ORELLANA
20.1.18 PASTAZA
20.1.19 PICHINCHA
20.1.20 SANTA ELENA
20.1.21 SANTO DOMINGO DE LOS TSÁCHILAS
20.1.22 SUCUMBÍOS
20.1.23 TUNGURAHUA
20.1.24 ZAMORA-CHINCHIPE
21 ECUADOR RICE MARKET: COMPANY LANDSCAPE
21.1 COMPANY SHARE ANALYSIS: ECUADOR
22 SWOT ANALYSIS
23 COMPANY PROFILES
23.1 LT FOODS
23.1.1 COMPANY SNAPSHOT
23.1.2 REVENUE ANALYSIS
23.1.3 PRODUCT PORTFOLIO
23.1.4 RECENT DEVELOPMENT
23.2 KRBL
23.2.1 COMPANY SNAPSHOT
23.2.2 REVENUE ANALYSIS
23.2.3 PRODUCT PORTFOLIO
23.2.4 RECENT DEVELOPMENT
23.3 DAJAHU
23.3.1 COMPANY SNAPSHOT
23.3.2 PRODUCT PORTFOLIO
23.3.3 RECENT DEVELOPMENT
23.4 KOHINOOR FOODS LTD
23.4.1 COMPANY SNAPSHOT
23.4.2 REVENUE ANALYSIS
23.4.3 PRODUCT PORTFOLIO
23.4.4 RECENT DEVELOPMENT
23.5 BAGHEL AGRO INDUSTRIES
23.5.1 COMPANY SNAPSHOT
23.5.2 PRODUCT PORTFOLIO
23.5.3 RECENT DEVELOPMENT
23.6 AL-FIZA HERBAL
23.6.1 COMPANY SNAPSHOT
23.6.2 PRODUCT PORTFOLIO
23.6.3 RECENT DEVELOPMENT
23.7 HEALGURU INTERNATIONAL
23.7.1 COMPANY SNAPSHOT
23.7.2 PRODUCT PORTFOLIO
23.7.3 RECENT DEVELOPMENT
23.8 VIKAS RICE AND PULSE MILL
23.8.1 COMPANY SNAPSHOT
23.8.2 PRODUCT PORTFOLIO
23.8.3 RECENT DEVELOPMENT
24 QUESTIONNAIRE
25 RELATED REPORTS
Lista de Tablas
TABLA 1 CAPACIDAD DE PRODUCCIÓN DE LOS PRINCIPALES FABRICANTES
CUADRO 2 ESCENARIO DE IMPORTACIÓN POR PAÍS (MILES DE USD)
CUADRO 3 ESCENARIO DE IMPORTACIÓN, POR PAÍS (TONELADAS)
CUADRO 4 ESCENARIO DE EXPORTACIÓN POR PAÍS (MILES DE USD)
CUADRO 5 ESCENARIO DE EXPORTACIÓN, POR PAÍS (TONELADAS)
CUADRO 6 COBERTURA REGULATORIA
CUADRO 7 MERCADO DE ARROZ DE ECUADOR, POR TIPO, 2018-2032 (MILES DE USD)
CUADRO 8 MERCADO DE ARROZ DEL ECUADOR, POR TIPO, 2018-2032 (TONELADAS)
CUADRO 9 MERCADO DE ARROZ DE ECUADOR, POR TIPO, 2018-2032 (USD/KG)
TABLA 10 MERCADO DE ARROZ DE ECUADOR, POR COLOR DE ARROZ, 2018-2032 (MILES DE USD)
CUADRO 11 MERCADO DE ARROZ DE ECUADOR, POR COLOR DE ARROZ, 2018-2032 (TONELADAS)
CUADRO 12 MERCADO DE ARROZ DE ECUADOR, POR COLOR DE ARROZ, 2018-2032 (USD/KG)
CUADRO 13 MERCADO DE ARROZ DE ECUADOR, POR TAMAÑO DE GRANO, 2018-2032 (MILES DE USD)
CUADRO 14 MERCADO DE ARROZ DE ECUADOR, POR TAMAÑO DE GRANO, 2018-2032 (TONELADAS)
CUADRO 15 MERCADO DE ARROZ DE ECUADOR, POR TAMAÑO DE GRANO, 2018-2032 (USD/KG)
CUADRO 16 MERCADO DE ARROZ DE ECUADOR, POR NATURALEZA, 2018-2032 (MILES DE USD)
CUADRO 17 MERCADO DE ARROZ DEL ECUADOR, POR NATURALEZA, 2018-2032 (TONELADAS)
CUADRO 18 MERCADO DE ARROZ DE ECUADOR, POR NATURALEZA, 2018-2032 (USD/KG)
CUADRO 19 MERCADO DE ARROZ DE ECUADOR, POR CONTENIDO DE ALMIDÓN, 2018-2032 (MILES DE USD)
CUADRO 20 MERCADO DE ARROZ DE ECUADOR, POR CONTENIDO DE ALMIDÓN, 2018-2032 (TONELADAS)
CUADRO 21 MERCADO DE ARROZ DE ECUADOR, POR CONTENIDO DE ALMIDÓN, 2018-2032 (TONELADAS)
CUADRO 22 MERCADO DE ARROZ DEL ECUADOR, SEGÚN FORMA DE PROCESAMIENTO, 2018-2032 (MILES DE USD)
CUADRO 23 MERCADO DE ARROZ DEL ECUADOR, POR FORMA DE PROCESAMIENTO, 2018-2032 (TONELADAS)
CUADRO 24 MERCADO DE ARROZ DE ECUADOR, POR FORMA DE PROCESAMIENTO, 2018-2032 (USD/KG)
CUADRO 25 MERCADO DE ARROZ DEL ECUADOR, SEGÚN GRADO DE MOLIENDA, 2018-2032 (MILES DE USD)
CUADRO 26 MERCADO DE ARROZ DEL ECUADOR, SEGÚN GRADO DE MOLIENDA, 2018-2032 (TONELADAS)
CUADRO 27 MERCADO DE ARROZ DEL ECUADOR, SEGÚN GRADO DE MOLIENDA, 2018-2032 (USD/KG)
CUADRO 28 MERCADO DE ARROZ DE ECUADOR, POR PULIDO, 2018-2032 (MILES DE USD)
CUADRO 29 MERCADO DE ARROZ DE ECUADOR, POR PULIDO, 2018-2032 (TONELADAS)
CUADRO 30 MERCADO DE ARROZ DE ECUADOR, POR PULIDO, 2018-2032 (USD/KG)
CUADRO 31 MERCADO DE ARROZ DE ECUADOR, POR FORTIFICACIÓN, 2018-2032 (MILES DE USD)
CUADRO 32 MERCADO DE ARROZ DE ECUADOR, POR FORTIFICACIÓN, 2018-2032 (TONELADAS)
CUADRO 33 MERCADO DE ARROZ DE ECUADOR, POR FORTIFICACIÓN, 2018-2032 (USD/KG)
CUADRO 34 MERCADO DE ARROZ FORTIFICADO EN ECUADOR, POR PROCESO, 2018-2032 (MILES DE USD)
TABLA 35 MERCADO DE ARROZ DE ECUADOR, POR AROMA, 2018-2032 (MILES DE USD)
CUADRO 36 MERCADO DE ARROZ DE ECUADOR, POR AROMA, 2018-2032 (TONELADAS)
CUADRO 37 MERCADO DE ARROZ DE ECUADOR, POR AROMA, 2018-2032 (USD/KG)
CUADRO 38 ARROZ AROMÁTICO DE ECUADOR EN EL MERCADO DE ARROZ, POR TIPO, 2018-2032 (MILES DE USD)
CUADRO 39 MERCADO DE ARROZ DE ECUADOR, POR DERIVADOS DEL ARROZ, 2018-2032 (MILES DE USD)
CUADRO 40 MERCADO DE ARROZ DE ECUADOR, POR DERIVADOS DEL ARROZ, 2018-2032 (TONELADAS)
CUADRO 41 MERCADO DE ARROZ DE ECUADOR, POR DERIVADOS DEL ARROZ, 2018-2032 (USD/KG)
CUADRO 42 MERCADO DE ARROZ DE ECUADOR, POR USUARIO FINAL, 2018-2032 (MILES DE USD)
CUADRO 43 MERCADO DE ARROZ DE ECUADOR, POR USUARIO FINAL, 2018-2032 (TONELADAS)
CUADRO 44 MERCADO DE ARROZ DE ECUADOR, POR USUARIO FINAL, 2018-2032 (USD/KG)
TABLA 45 MERCADO DE ALIMENTOS Y BEBIDAS EN ARROZ DE ECUADOR, POR TIPO, 2018-2032 (MILES DE USD)
TABLA 46 MERCADO DE ARROZ EN ECUADOR, POR TIPO, 2018-2032 (MILES DE USD)
TABLA 47 MERCADO DE ARROZ DE PANADERÍA EN ECUADOR, POR TIPO, 2018-2032 (MILES DE USD)
TABLA 48 MERCADO DE ARROZ PROCESADO EN ECUADOR, POR TIPO, 2018-2032 (MILES DE USD)
CUADRO 49 MERCADO DE CONFITERÍA EN ARROZ DE ECUADOR, POR TIPO, 2018-2032 (MILES DE USD)
CUADRO 50 MERCADO DE ARROZ DE FÓRMULA INFANTIL EN ECUADOR, POR TIPO, 2018-2032 (MILES DE USD)
TABLA 51 PRODUCTOS LÁCTEOS EN EL MERCADO DE ARROZ DE ECUADOR, POR TIPO, 2018-2032 (MILES DE USD)
TABLA 52 BEBIDAS EN EL MERCADO DE ARROZ DE ECUADOR, POR TIPO, 2018-2032 (MILES DE USD)
TABLA 53 BEBIDAS SALUDABLES EN EL MERCADO DE ARROZ DE ECUADOR, POR TIPO, 2018-2032 (MILES DE USD)
CUADRO 54 MERCADO DE ARROZ ALIMENTICIO EN ECUADOR, POR CATEGORÍA, 2018-2032 (MILES DE USD)
TABLA 55 MERCADO DE AVES DE CORRAL EN ARROZ DE ECUADOR, POR TIPO, 2018-2032 (MILES DE USD)
TABLA 56 RUMIANTES EN EL MERCADO DE ARROZ DE ECUADOR, POR TIPO, 2018-2032 (MILES DE USD)
TABLA 57 MERCADO DE ARROZ PORCINO EN ECUADOR, POR TIPO, 2018-2032 (MILES DE USD)
TABLA 58 MERCADO DE ARROZ DE PET EN ECUADOR, POR TIPO, 2018-2032 (MILES DE USD)
TABLA 59 MERCADO DE ARROZ DE ANIMALES ACUÁTICOS EN ECUADOR, POR TIPO, 2018-2032 (MILES DE USD)
TABLA 60 CRUSTÁCEOS DE ECUADOR EN EL MERCADO DE ARROZ, POR TIPO, 2018-2032 (MILES DE USD)
TABLA 61 MERCADO DE PESCADO EN ARROZ DE ECUADOR, POR TIPO, 2018-2032 (MILES DE USD)
CUADRO 62 MOLUSCOS DE ECUADOR EN EL MERCADO DE ARROZ, POR TIPO, 2018-2032 (MILES DE USD)
CUADRO 63 MERCADO DE ARROZ ALIMENTICIO EN ECUADOR, POR FUNCIÓN SANITARIA, 2018-2032 (MILES DE USD)
TABLA 64 MERCADO DE PRODUCTOS FARMACÉUTICOS EN ARROZ DE ECUADOR, POR APLICACIÓN, 2018-2032 (MILES DE USD)
CUADRO 65 INFECCIONES UROGENTALES EN EL MERCADO DE ARROZ DE ECUADOR, POR TIPO, 2018-2032 (MILES DE USD))
CUADRO 66 MERCADO DE PRODUCTOS FARMACÉUTICOS EN ARROZ DE ECUADOR, POR FORMA DE PRODUCTO, 2018-2032 (MILES DE USD)
TABLA 67 MERCADO DE COSMÉTICOS Y CUIDADO PERSONAL EN ARROZ, POR CATEGORÍA, 2018-2032 (MILES DE USD)
TABLA 68 PRODUCTOS DE CUIDADO FACIAL EN EL MERCADO DE ARROZ DE ECUADOR, POR TIPO, 2018-2032 (MILES DE USD)
TABLA 69 PRODUCTOS PARA EL CUIDADO DEL CABELLO EN EL MERCADO DE ARROZ DE ECUADOR, POR TIPO, 2018-2032 (MILES DE USD)
TABLA 70 MERCADO DE SUPLEMENTOS DIETÉTICOS DE ARROZ EN ECUADOR, POR TIPO, 2018-2032 (MILES DE USD)
CUADRO 71 MERCADO DE SUPLEMENTOS DIETÉTICOS DE ARROZ EN ECUADOR, POR FORMA DE PRODUCTO, 2018-2032 (MILES DE USD)
CUADRO 72 MERCADO DE ARROZ DEL ECUADOR, POR CANAL DE DISTRIBUCIÓN, 2018-2032 (MILES DE USD)
CUADRO 73 MERCADO DE ARROZ DEL ECUADOR, POR CANAL DE DISTRIBUCIÓN, 2018-2032 (TONELADAS)
CUADRO 74 MERCADO DE ARROZ DE ECUADOR, POR CANAL DE DISTRIBUCIÓN, 2018-2032 (USD/KG)
CUADRO 75 ECUADOR FUERA DE LÍNEA EN EL MERCADO DE ARROZ, POR TIPO, 2018-2032 (MILES DE USD)
CUADRO 76 VENTAS AL POR MENOR EN EL MERCADO DE ARROZ EN ECUADOR, POR TIPO DE CANAL, 2018-2032 (MILES DE USD)
TABLA 77 MERCADO DE ARROZ EN LÍNEA DE ECUADOR, POR TIPO, 2018-2032 (MILES DE USD)
CUADRO 78 MERCADO DE ARROZ DEL ECUADOR, POR TERRITORIO, 2018-2032 (MILES DE USD)
CUADRO 79 MERCADO DE ARROZ DEL ECUADOR, POR TERRITORIO, 2018-2032 (TONELADAS)
CUADRO 80 MERCADO DE ARROZ DE GUAYAS, POR TIPO, 2018-2032 (MILES DE USD)
CUADRO 81 MERCADO DE ARROZ DE GUAYAS, POR TIPO, 2018-2032 (TONELADAS)
CUADRO 82 MERCADO DE ARROZ DE GUAYAS, POR TIPO, 2018-2032 (USD/KG)
TABLA 83 MERCADO DEL ARROZ DE GUAYAS, POR COLOR DEL ARROZ, 2018-2032 (MILES DE USD)
CUADRO 84 MERCADO DEL ARROZ DE GUAYAS, POR COLOR DEL ARROZ, 2018-2032 (TONELADAS)
CUADRO 85 MERCADO DEL ARROZ DE GUAYAS, POR COLOR DEL ARROZ, 2018-2032 (USD/KG)
CUADRO 86 MERCADO DE ARROZ DE GUAYAS, POR TAMAÑO DE GRANO, 2018-2032 (MILES DE USD)
CUADRO 87 MERCADO DE ARROZ DE GUAYAS, POR TAMAÑO DE GRANO, 2018-2032 (TONELADAS)
CUADRO 88 MERCADO DE ARROZ DE GUAYAS, POR TAMAÑO DE GRANO, 2018-2032 (USD/KG)
TABLA 89 MERCADO DEL ARROZ DEL GUAYAS, POR NATURALEZA, 2018-2032 (MILES DE USD)
CUADRO 90 MERCADO DEL ARROZ DE GUAYAS, POR NATURALEZA, 2018-2032 (TONELADAS)
CUADRO 91 MERCADO DEL ARROZ DE GUAYAS, POR NATURALEZA, 2018-2032 (USD/KG)
CUADRO 92 MERCADO DE ARROZ DE GUAYAS, POR CONTENIDO DE ALMIDÓN, 2018-2032 (MILES DE USD)
CUADRO 93 MERCADO DE ARROZ DE GUAYAS, POR CONTENIDO DE ALMIDÓN, 2018-2032 (TONELADAS)
CUADRO 94 MERCADO DE ARROZ DE GUAYAS, POR CONTENIDO DE ALMIDÓN, 2018-2032 (USD/KG)
CUADRO 95 MERCADO DE ARROZ DE GUAYAS, SEGÚN FORMA DE PROCESAMIENTO, 2018-2032 (MILES DE USD)
CUADRO 96 MERCADO DE ARROZ DE GUAYAS, SEGÚN FORMA DE PROCESAMIENTO, 2018-2032 (TONELADAS)
CUADRO 97 MERCADO DE ARROZ DE GUAYAS, POR FORMA DE PROCESAMIENTO, 2018-2032 (USD/KG)
CUADRO 98 MERCADO DE ARROZ DE GUAYAS, SEGÚN GRADO DE MOLIENDA, 2018-2032 (MILES DE USD)
CUADRO 99 MERCADO DE ARROZ DE GUAYAS, SEGÚN GRADO DE MOLIENDA, 2018-2032 (TONELADAS)
CUADRO 100 MERCADO DE ARROZ DE GUAYAS, SEGÚN GRADO DE MOLIENDA, 2018-2032 (USD/KG)
CUADRO 101 MERCADO DE ARROZ DE GUAYAS, POR PULIDO, 2018-2032 (MILES DE USD)
CUADRO 102 MERCADO DE ARROZ DE GUAYAS, POR PULIDO, 2018-2032 (TONELADAS)
CUADRO 103 MERCADO DE ARROZ DE GUAYAS, POR PULIDO, 2018-2032 (USD/KG)
CUADRO 104 MERCADO DE ARROZ DE GUAYAS, POR FORTIFICACIÓN, 2018-2032 (MILES DE USD)
CUADRO 105 MERCADO DE ARROZ DE GUAYAS, POR FORTIFICACIÓN, 2018-2032 (TONELADAS)
CUADRO 106 MERCADO DE ARROZ DE GUAYAS, POR FORTIFICACIÓN, 2018-2032 (USD/KG)
CUADRO 107 MERCADO DE ARROZ FORTIFICADO DE GUAYAS, POR PROCESO, 2018-2032 (MILES DE USD)
TABLA 108 MERCADO DEL ARROZ DE GUAYAS, POR AROMA, 2018-2032 (MILES DE USD)
CUADRO 109 MERCADO DEL ARROZ DE GUAYAS, POR AROMA, 2018-2032 (TONELADAS)
CUADRO 110 MERCADO DEL ARROZ DE GUAYAS, POR AROMA, 2018-2032 (USD/KG)
CUADRO 111 ARROZ AROMÁTICO DE GUAYAS EN EL MERCADO DE ARROZ, POR TIPO, 2018-2032 (MILES DE USD)
CUADRO 112 MERCADO DE ARROZ DEL GUAYAS, POR DERIVADOS DEL ARROZ, 2018-2032 (MILES DE USD)
CUADRO 113 MERCADO DE ARROZ DE GUAYAS, POR DERIVADOS DEL ARROZ, 2018-2032 (TONELADAS)
CUADRO 114 MERCADO DE ARROZ DE GUAYAS, POR DERIVADOS DEL ARROZ, 2018-2032 (USD/KG)
CUADRO 115 MERCADO DE ARROZ DE GUAYAS, POR USUARIO FINAL, 2018-2032 (MILES DE USD)
CUADRO 116 MERCADO DE ARROZ DE GUAYAS, POR USUARIO FINAL, 2018-2032 (TONELADAS)
CUADRO 117 MERCADO DE ARROZ DE GUAYAS, POR USUARIO FINAL, 2018-2032 (USD/KG)
TABLA 118 ALIMENTOS Y BEBIDAS EN EL MERCADO DE ARROZ DE GUAYAS, POR TIPO, 2018-2032 (MILES DE USD)
TABLA 119 MERCADO DE ARROZ EN GUAYAS, POR TIPO, 2018-2032 (MILES DE USD)
TABLA 120 MERCADO DE ARROZ EN LA PANADERIA DE GUAYAS, POR TIPO, 2018-2032 (USD MILES)
CUADRO 121 MERCADO DE ALIMENTOS PROCESADOS EN ARROZ DE GUAYAS, POR TIPO, 2018-2032 (MILES DE USD).
CUADRO 122 CONFITERÍA DE GUAYAS EN EL MERCADO DE ARROZ, POR TIPO, 2018-2032 (MILES DE USD)
CUADRO 123 MERCADO DE ARROZ DE FÓRMULA INFANTIL DE GUAYAS, POR TIPO, 2018-2032 (MILES DE USD)
TABLA 124 PRODUCTOS LÁCTEOS DEL GUAYAS EN EL MERCADO DE ARROZ, POR TIPO, 2018-2032 (MILES DE USD)
TABLA 125 BEBIDAS DE GUAYAS EN EL MERCADO DEL ARROZ, POR TIPO, 2018-2032 (MILES DE USD)
TABLA 126 BEBIDAS SALUDABLES DE GUAYAS EN EL MERCADO DE ARROZ, POR TIPO, 2018-2032 (MILES DE USD)
CUADRO 127 MERCADO DE ARROZ PARA ALIMENTOS DE GUAYAS, POR CATEGORÍA, 2018-2032 (MILES DE USD)
TABLA 128 MERCADO DE AVES DE GUAYAS EN ARROZ, POR TIPO, 2018-2032 (MILES DE USD)
CUADRO 129 RUMIANTES DE GUAYAS EN EL MERCADO DE ARROZ, POR TIPO, 2018-2032 (MILES DE USD)
TABLA 130 MERCADO DE ARROZ PORCINO GUAYAS, POR TIPO, 2018-2032 (MILES DE USD)
TABLA 131 GUAYAS PET EN EL MERCADO DE ARROZ, POR TIPO, 2018-2032 (MILES DE USD)
TABLA 132 MERCADO DE ARROZ, POR TIPO, ANIMALES ACUÁTICOS DE GUAYAS, 2018-2032 (MILES DE USD)
CUADRO 133 CRUSTÁCEOS GUAYAS EN EL MERCADO DE ARROZ, POR TIPO, 2018-2032 (MILES DE USD)
TABLA 134 PESCADO DE GUAYAS EN EL MERCADO DE ARROZ, POR TIPO, 2018-2032 (MILES DE USD)
TABLA 135 MOLUSCOS GUAYAS EN EL MERCADO DE ARROZ, POR TIPO, 2018-2032 (MILES DE USD)
CUADRO 136 MERCADO DE ALIMENTOS DE GUAYAS EN ARROZ, SEGÚN FUNCIÓN SANITARIA, 2018-2032 (MILES DE USD).
CUADRO 137 MERCADO DE PRODUCTOS FARMACÉUTICOS DE GUAYAS EN ARROZ, POR APLICACIÓN, 2018-2032 (MILES DE USD)
CUADRO 138 INFECCIONES UROGENITALES EN EL MERCADO DE ARROZ DE GUAYAS, POR TIPO, 2018-2032 (MILES DE USD)
CUADRO 139 MERCADO DE PRODUCTOS FARMACÉUTICOS DE GUAYAS EN ARROZ, POR FORMA DE PRODUCTO, 2018-2032 (MILES DE USD)
TABLA 140 COSMÉTICOS Y CUIDADO PERSONAL EN EL MERCADO DE ARROZ DE GUAYAS, POR CATEGORÍA, 2018-2032 (MILES DE USD)
TABLA 141 PRODUCTOS DE CUIDADO FACIAL DE GUAYAS EN EL MERCADO DE ARROZ, POR TIPO, 2018-2032 (MILES DE USD)
TABLA 142 PRODUCTOS PARA EL CUIDADO DEL CABELLO EN EL MERCADO DE ARROZ DE GUAYAS, POR TIPO, 2018-2032 (MILES DE USD)
TABLA 143 SUPLEMENTOS DIETÉTICOS DE GUAYAS EN EL MERCADO DE ARROZ, POR TIPO, 2018-2032 (MILES DE USD)
CUADRO 144 SUPLEMENTOS DIETÉTICOS DE GUAYAS EN EL MERCADO DE ARROZ, POR FORMA DE PRODUCTO, 2018-2032 (MILES DE USD)
CUADRO 145 MERCADO DE ARROZ DEL GUAYAS, POR CANAL DE DISTRIBUCIÓN, 2018-2032 (MILES DE USD)
CUADRO 146 MERCADO DE ARROZ DEL GUAYAS, POR CANAL DE DISTRIBUCIÓN, 2018-2032 (TONELADAS)
CUADRO 147 MERCADO DE ARROZ DE GUAYAS, POR CANAL DE DISTRIBUCIÓN, 2018-2032 (USD/KG)
CUADRO 148 GUAYAS FUERA DE LÍNEA EN EL MERCADO DE ARROZ, POR TIPO, 2018-2032 (MILES DE USD)
CUADRO 149 VENTAS AL POR MENOR EN EL MERCADO DE ARROZ DE GUAYAS, POR TIPO DE CANAL, 2018-2032 (MILES DE USD)
CUADRO 150 GUAYAS EN LÍNEA EN EL MERCADO DE ARROZ, POR TIPO, 2018-2032 (MILES DE USD)
CUADRO 151 MERCADO DE ARROZ DE LOS RÍOS, POR TIPO, 2018-2032 (MILES DE USD)
CUADRO 152 MERCADO DE ARROZ DE LOS RÍOS, POR TIPO, 2018-2032 (TONELADAS)
CUADRO 153 MERCADO DE ARROZ DE LOS RÍOS, POR TIPO, 2018-2032 (USD/KG)
TABLA 154 MERCADO DE ARROZ DE LOS RÍOS, POR COLOR DE ARROZ, 2018-2032 (MILES DE USD)
TABLA 155 MERCADO DE ARROZ DE LOS RÍOS, POR COLOR DEL ARROZ, 2018-2032 (TONELADAS)
TABLA 156 MERCADO DE ARROZ DE LOS RÍOS, POR COLOR DE ARROZ, 2018-2032 (USD/KG)
CUADRO 157 MERCADO DE ARROZ DE LOS RÍOS, POR TAMAÑO DE GRANO, 2018-2032 (MILES DE USD)
CUADRO 158 MERCADO DE ARROZ DE LOS RÍOS, POR TAMAÑO DE GRANO, 2018-2032 (TONELADAS)
CUADRO 159 MERCADO DE ARROZ DE LOS RÍOS, POR TAMAÑO DE GRANO, 2018-2032 (USD/KG)
TABLA 160 MERCADO DE ARROZ DE LOS RÍOS, POR NATURALEZA, 2018-2032 (MILES DE USD)
CUADRO 161 MERCADO DE ARROZ DE LOS RÍOS, POR NATURALEZA, 2018-2032 (TONELADAS)
CUADRO 162 MERCADO DE ARROZ DE LOS RÍOS, POR NATURALEZA, 2018-2032 (USD/KG)
CUADRO 163 MERCADO DE ARROZ DE LOS RÍOS, POR CONTENIDO DE ALMIDÓN, 2018-2032 (MILES DE USD)
CUADRO 164 MERCADO DE ARROZ DE LOS RÍOS, POR CONTENIDO DE ALMIDÓN, 2018-2032 (TONELADAS)
CUADRO 165 MERCADO DE ARROZ DE LOS RÍOS, POR CONTENIDO DE ALMIDÓN, 2018-2032 (USD/KG)
CUADRO 166 MERCADO DE ARROZ DE LOS RÍOS, SEGÚN FORMA DE PROCESAMIENTO, 2018-2032 (MILES DE USD)
CUADRO 167 MERCADO DE ARROZ DE LOS RÍOS, POR FORMA DE PROCESAMIENTO, 2018-2032 (TONELADAS)
CUADRO 168 MERCADO DE ARROZ DE LOS RÍOS, POR FORMA DE PROCESAMIENTO, 2018-2032 (USD/KG)
CUADRO 169 MERCADO DE ARROZ DE LOS RÍOS, SEGÚN GRADO DE MOLIENDA, 2018-2032 (MILES DE USD)
CUADRO 170 MERCADO DE ARROZ DE LOS RÍOS, POR GRADO DE MOLIENDA, 2018-2032 (TONELADAS)
CUADRO 171 MERCADO DE ARROZ DE LOS RÍOS, SEGÚN GRADO DE MOLIENDA, 2018-2032 (USD/KG)
CUADRO 172 MERCADO DE ARROZ DE LOS RÍOS, POR PULIDO, 2018-2032 (MILES DE USD)
CUADRO 173 MERCADO DE ARROZ DE LOS RÍOS, POR PULIDO, 2018-2032 (TONELADAS)
CUADRO 174 MERCADO DE ARROZ DE LOS RÍOS, POR PULIDO, 2018-2032 (USD/KG)
CUADRO 175 MERCADO DE ARROZ DE LOS RÍOS, POR FORTIFICACIÓN, 2018-2032 (MILES DE USD)
CUADRO 176 MERCADO DE ARROZ DE LOS RÍOS, POR FORTIFICACIÓN, 2018-2032 (TONELADAS)
CUADRO 177 MERCADO DE ARROZ DE LOS RÍOS, POR FORTIFICACIÓN, 2018-2032 (USD/KG)
CUADRO 178 MERCADO DE ARROZ FORTIFICADO DE LOS RÍOS, POR PROCESO, 2018-2032 (MILES DE USD)
TABLA 179 MERCADO DE ARROZ DE LOS RÍOS, POR AROMA, 2018-2032 (MILES DE USD)
TABLA 180 MERCADO DE ARROZ DE LOS RÍOS, POR AROMA, 2018-2032 (TONELADAS)
CUADRO 181 MERCADO DEL ARROZ DE LOS RÍOS, POR AROMA, 2018-2032 (USD/KG)
CUADRO 182 ARROZ AROMÁTICO DE LOS RÍOS EN EL MERCADO DE ARROZ, POR TIPO, 2018-2032 (MILES DE USD)
CUADRO 183 MERCADO DE ARROZ DE LOS RÍOS, POR DERIVADOS DEL ARROZ, 2018-2032 (MILES DE USD)
CUADRO 184 MERCADO DE ARROZ DE LOS RÍOS, POR DERIVADOS DEL ARROZ, 2018-2032 (TONELADAS)
CUADRO 185 MERCADO DEL ARROZ DE LOS RÍOS, POR DERIVADOS DEL ARROZ, 2018-2032 (USD/KG)
CUADRO 186 MERCADO DE ARROZ DE LOS RÍOS, POR USUARIO FINAL, 2018-2032 (MILES DE USD)
CUADRO 187 MERCADO DE ARROZ DE LOS RÍOS, POR USUARIO FINAL, 2018-2032 (TONELADAS)
CUADRO 188 MERCADO DE ARROZ DE LOS RÍOS, POR USUARIO FINAL, 2018-2032 (USD/KG)
TABLA 189 MERCADO DE ALIMENTOS Y BEBIDAS EN ARROZ DE LOS RÍOS, POR TIPO, 2018-2032 (MILES DE USD)
TABLA 190 MERCADO DE ARROZ EN LOS RÍOS, POR TIPO, 2018-2032 (MILES DE USD)
TABLA 191 MERCADO DE ARROZ DE PANADERÍA LOS RÍOS, POR TIPO, 2018-2032 (MILES DE USD)
TABLA 192 MERCADO DE ALIMENTOS PROCESADOS EN ARROZ DE LOS RÍOS, POR TIPO, 2018-2032 (MILES DE USD)
CUADRO 193 MERCADO DE CONFITERÍA EN ARROZ DE LOS RÍOS, POR TIPO, 2018-2032 (MILES DE USD)
CUADRO 194 MERCADO DE ARROZ DE FÓRMULA INFANTIL DE LOS RÍOS, POR TIPO, 2018-2032 (MILES DE USD)
TABLA 195 PRODUCTOS LÁCTEOS EN EL MERCADO DE ARROZ DE LOS RÍOS, POR TIPO, 2018-2032 (MILES DE USD)
TABLA 196 BEBIDAS DE LOS RÍOS EN EL MERCADO DE ARROZ, POR TIPO, 2018-2032 (MILES DE USD)
TABLA 197 BEBIDAS SALUDABLES EN EL MERCADO DE ARROZ DE LOS RÍOS, POR TIPO, 2018-2032 (MILES DE USD)
CUADRO 198 MERCADO DE ARROZ ALIMENTICIO DE LOS RÍOS, POR CATEGORÍA, 2018-2032 (MILES DE USD)
TABLA 199 MERCADO DE AVES DE CORRAL EN ARROZ DE LOS RÍOS, POR TIPO, 2018-2032 (MILES DE USD)
TABLA 200 MERCADO DE ARROZ DE RUMIANTES DE LOS RÍOS, POR TIPO, 2018-2032 (MILES DE USD)
TABLA 201 MERCADO DE ARROZ PORCINO DE LOS RÍOS, POR TIPO, 2018-2032 (MILES DE USD)
TABLA 202 MERCADO DE ARROZ DE PET DE LOS RÍOS, POR TIPO, 2018-2032 (MILES DE USD)
TABLA 203 MERCADO DE ARROZ DE ANIMALES ACUÁTICOS DE LOS RÍOS, POR TIPO, 2018-2032 (MILES DE USD)
TABLA 204 CRUSTÁCEOS EN EL MERCADO DE ARROZ DE LOS RÍOS, POR TIPO, 2018-2032 (MILES DE USD)
TABLA 205 MERCADO DE PESCADO EN ARROZ DE LOS RÍOS, POR TIPO, 2018-2032 (MILES DE USD)
TABLA 206 MOLUSCOS DE LOS RÍOS EN EL MERCADO DE ARROZ, POR TIPO, 2018-2032 (MILES DE USD)
CUADRO 207 MERCADO DE ARROZ ALIMENTICIO EN LOS RÍOS, POR FUNCIÓN SANITARIA, 2018-2032 (MILES DE USD)
TABLA 208 MERCADO DE PRODUCTOS FARMACÉUTICOS EN ARROZ DE LOS RÍOS, POR APLICACIÓN, 2018-2032 (MILES DE USD)
CUADRO 209 INFECCIONES UROGENITALES EN EL MERCADO DE ARROZ DE LOS RÍOS, POR TIPO, 2018-2032 (MILES DE USD)
CUADRO 210 MERCADO DE PRODUCTOS FARMACÉUTICOS EN ARROZ DE LOS RÍOS, POR FORMA DE PRODUCTO, 2018-2032 (MILES DE USD)
TABLA 211 MERCADO DE COSMÉTICOS Y CUIDADO PERSONAL EN ARROZ DE LOS RÍOS, POR CATEGORÍA, 2018-2032 (MILES DE USD)
TABLA 212 PRODUCTOS DE CUIDADO FACIAL EN EL MERCADO DE ARROZ DE LOS RÍOS, POR TIPO, 2018-2032 (MILES DE USD)
TABLA 213 PRODUCTOS PARA EL CUIDADO DEL CABELLO EN EL MERCADO DE ARROZ DE LOS RÍOS, POR TIPO, 2018-2032 (MILES DE USD)
TABLA 214 MERCADO DE SUPLEMENTOS DIETÉTICOS DE ARROZ EN LOS RÍOS, POR TIPO, 2018-2032 (MILES DE USD)
CUADRO 215 MERCADO DE SUPLEMENTOS DIETÉTICOS DE ARROZ DE LOS RÍOS, POR FORMA DE PRODUCTO, 2018-2032 (MILES DE USD)
CUADRO 216 MERCADO DE ARROZ DE LOS RÍOS, POR CANAL DE DISTRIBUCIÓN, 2018-2032 (MILES DE USD)
CUADRO 217 MERCADO DE ARROZ DE LOS RÍOS, POR CANAL DE DISTRIBUCIÓN, 2018-2032 (TONELADAS)
CUADRO 218 MERCADO DE ARROZ DE LOS RÍOS, POR CANAL DE DISTRIBUCIÓN, 2018-2032 (USD/KG)
CUADRO 219 LOS RÍOS FUERA DE LÍNEA EN EL MERCADO DE ARROZ, POR TIPO, 2018-2032 (MILES DE USD)
CUADRO 220 VENTAS AL POR MENOR EN EL MERCADO DE ARROZ DE LOS RÍOS, POR TIPO DE CANAL, 2018-2032 (MILES DE USD)
TABLA 221 MERCADO DE ARROZ EN LÍNEA DE LOS RÍOS, POR TIPO, 2018-2032 (MILES DE USD)
CUADRO 222 MERCADO DE ARROZ DE MANABÍ, POR TIPO, 2018-2032 (MILES DE USD)
CUADRO 223 MERCADO DE ARROZ DE MANABÍ, POR TIPO, 2018-2032 (TONELADAS)
CUADRO 224 MERCADO DE ARROZ DE MANABÍ, POR TIPO, 2018-2032 (USD/KG)
TABLA 225 MERCADO DE ARROZ DE MANABÍ, POR COLOR DE ARROZ, 2018-2032 (MILES DE USD)
CUADRO 226 MERCADO DE ARROZ DE MANABÍ, POR COLOR DE ARROZ, 2018-2032 (TONELADAS)
CUADRO 227 MERCADO DE ARROZ DE MANABÍ, POR COLOR DE ARROZ, 2018-2032 (USD/KG)
CUADRO 228 MERCADO DE ARROZ DE MANABÍ, POR TAMAÑO DE GRANO, 2018-2032 (MILES DE USD)
CUADRO 229 MERCADO DE ARROZ DE MANABÍ, POR TAMAÑO DE GRANO, 2018-2032 (TONELADAS)
CUADRO 230 MERCADO DE ARROZ DE MANABÍ, POR TAMAÑO DE GRANO, 2018-2032 (USD/KG)
CUADRO 231 MERCADO DE ARROZ DE MANABÍ, POR NATURALEZA, 2018-2032 (MILES DE USD)
CUADRO 232 MERCADO DE ARROZ DE MANABÍ, POR NATURALEZA, 2018-2032 (TONELADAS)
CUADRO 233 MERCADO DE ARROZ DE MANABÍ, POR NATURALEZA, 2018-2032 (USD/KG)
CUADRO 234 MERCADO DE ARROZ DE MANABÍ, SEGÚN CONTENIDO DE ALMIDÓN, 2018-2032 (MILES DE USD)
CUADRO 235 MERCADO DE ARROZ DE MANABÍ, POR CONTENIDO DE ALMIDÓN, 2018-2032 (TONELADAS)
CUADRO 236 MERCADO DE ARROZ DE MANABÍ, POR CONTENIDO DE ALMIDÓN, 2018-2032 (USD/KG)
CUADRO 237 MERCADO DE ARROZ DE MANABÍ, SEGÚN FORMA DE PROCESAMIENTO, 2018-2032 (MILES DE USD)
CUADRO 238 MERCADO DE ARROZ DE MANABÍ, SEGÚN FORMA DE PROCESAMIENTO, 2018-2032 (TONELADAS)
CUADRO 239 MERCADO DE ARROZ DE MANABÍ, SEGÚN FORMA DE PROCESAMIENTO, 2018-2032 (USD/KG)
CUADRO 240 MERCADO DE ARROZ DE MANABÍ, SEGÚN GRADO DE MOLIENDA, 2018-2032 (MILES DE USD)
CUADRO 241 MERCADO DE ARROZ DE MANABÍ, SEGÚN GRADO DE MOLIENDA, 2018-2032 (TONELADAS)
CUADRO 242 MERCADO DE ARROZ DE MANABÍ, SEGÚN GRADO DE MOLIENDA, 2018-2032 (USD/KG)
CUADRO 243 MERCADO DE ARROZ DE MANABÍ, POR PULIDO, 2018-2032 (MILES DE USD)
CUADRO 244 MERCADO DE ARROZ DE MANABÍ, POR PULIDO, 2018-2032 (TONELADAS)
CUADRO 245 MERCADO DE ARROZ DE MANABÍ, POR PULIDO, 2018-2032 (USD/KG)
CUADRO 246 MERCADO DE ARROZ DE MANABÍ, POR FORTIFICACIÓN, 2018-2032 (MILES DE USD)
CUADRO 247 MERCADO DE ARROZ DE MANABÍ, POR FORTIFICACIÓN, 2018-2032 (TONELADAS)
CUADRO 248 MERCADO DE ARROZ DE MANABÍ, POR FORTIFICACIÓN, 2018-2032 (USD/KG)
CUADRO 249 MERCADO DE ARROZ FORTIFICADO DE MANABÍ, POR PROCESO, 2018-2032 (USD MILES)
TABLA 250 MERCADO DEL ARROZ DE MANABÍ, POR AROMA, 2018-2032 (MILES DE USD)
CUADRO 251 MERCADO DE ARROZ DE MANABÍ, POR AROMA, 2018-2032 (TONELADAS)
CUADRO 252 MERCADO DEL ARROZ DE MANABÍ, POR AROMA, 2018-2032 (USD/KG)
CUADRO 253 ARROZ AROMÁTICO DE MANABÍ EN EL MERCADO ARROZERO, POR TIPO, 2018-2032 (MILES DE USD)
CUADRO 254 MERCADO DE ARROZ DE MANABÍ, POR DERIVADOS DEL ARROZ, 2018-2032 (MILES DE USD)
CUADRO 255 MERCADO DE ARROZ DE MANABÍ, POR DERIVADOS DEL ARROZ, 2018-2032 (TONELADAS)
CUADRO 256 MERCADO DE ARROZ DE MANABÍ, POR DERIVADOS DEL ARROZ, 2018-2032 (USD/KG)
CUADRO 257 MERCADO DE ARROZ DE MANABÍ, POR USUARIO FINAL, 2018-2032 (MILES DE USD)
CUADRO 258 MERCADO DE ARROZ DE MANABÍ, POR USUARIO FINAL, 2018-2032 (TONELADAS)
CUADRO 259 MERCADO DE ARROZ DE MANABÍ, POR USUARIO FINAL, 2018-2032 (USD/KG)
TABLA 260 ALIMENTOS Y BEBIDAS EN EL MERCADO DE ARROZ DE MANABÍ, POR TIPO, 2018-2032 (MILES DE USD)
TABLA 261 MERCADO DE ARROZ EN MANABÍ, POR TIPO, 2018-2032 (MILES DE USD)
TABLA 262 PANADERÍA EN EL MERCADO DE ARROZ DE MANABÍ, POR TIPO, 2018-2032 (USD MILES)
TABLA 263 MERCADO DE ARROZ PROCESADO EN MANABÍ, POR TIPO, 2018-2032 (MILES DE USD)
TABLA 264 MERCADO DE CONFITERÍA EN ARROZ DE MANABÍ, POR TIPO, 2018-2032 (MILES DE USD)
CUADRO 265 MERCADO DE ARROZ DE FÓRMULA INFANTIL DE MANABÍ, POR TIPO, 2018-2032 (MILES DE USD)
CUADRO 266 PRODUCTOS LÁCTEOS EN EL MERCADO DE ARROZ DE MANABÍ, POR TIPO, 2018-2032 (MILES DE USD)
TABLA 267 BEBIDAS EN EL MERCADO DE ARROZ DE MANABÍ, POR TIPO, 2018-2032 (MILES DE USD)
TABLA 268 BEBIDAS SALUDABLES EN EL MERCADO DE ARROZ DE MANABÍ, POR TIPO, 2018-2032 (MILES DE USD)
CUADRO 269 MERCADO DE ARROZ ALIMENTICIO DE MANABÍ, POR CATEGORÍA, 2018-2032 (MILES DE USD)
TABLA 270 MERCADO DE AVES DE CORRAL EN ARROZ DE MANABÍ, POR TIPO, 2018-2032 (MILES DE USD)
TABLA 271 RUMIANTES MANABÍES EN EL MERCADO DE ARROZ, POR TIPO, 2018-2032 (MILES DE USD)
TABLA 272 MERCADO DE ARROZ PORCINO DE MANABÍ, POR TIPO, 2018-2032 (USD MILES)
TABLA 273 PET EN EL MERCADO DE ARROZ DE MANABÍ, POR TIPO, 2018-2032 (MILES DE USD)
TABLA 274 MERCADO DE ARROZ DE ANIMALES ACUÁTICOS DE MANABÍ, POR TIPO, 2018-2032 (MILES DE USD)
TABLA 275 CRUSTÁCEOS DE MANABÍ EN EL MERCADO DE ARROZ, POR TIPO, 2018-2032 (MILES DE USD)
TABLA 276 PESCADO EN EL MERCADO DE ARROZ DE MANABÍ, POR TIPO, 2018-2032 (MILES DE USD)
TABLA 277 MOLUSCOS DE MANABÍ EN EL MERCADO DE ARROZ, POR TIPO, 2018-2032 (MILES DE USD)
CUADRO 278 MERCADO DE ARROZ ALIMENTICIO EN MANABÍ, SEGÚN FUNCIÓN SANITARIA, 2018-2032 (MILES DE USD)
CUADRO 279 MERCADO DE PRODUCTOS FARMACÉUTICOS EN ARROZ DE MANABÍ, POR APLICACIÓN, 2018-2032 (MILES DE USD)
CUADRO 280 INFECCIONES UROGENTALES EN EL MERCADO DE ARROZ DE MANABÍ, POR TIPO, 2018-2032 (MILES DE USD)
CUADRO 281 MERCADO DE PRODUCTOS FARMACÉUTICOS EN ARROZ DE MANABÍ, POR FORMA DE PRODUCTO, 2018-2032 (MILES DE USD)
TABLA 282 MERCADO DE COSMÉTICOS Y CUIDADO PERSONAL EN ARROZ DE MANABÍ, POR CATEGORÍA, 2018-2032 (MILES DE USD)
TABLA 283 PRODUCTOS DE CUIDADO FACIAL EN EL MERCADO DE ARROZ DE MANABÍ, POR TIPO, 2018-2032 (MILES DE USD)
TABLA 284 PRODUCTOS PARA EL CUIDADO DEL CABELLO EN EL MERCADO DEL ARROZ DE MANABÍ, POR TIPO, 2018-2032 (MILES DE USD)
TABLA 285 SUPLEMENTOS DIETÉTICOS EN EL MERCADO DE ARROZ DE MANABÍ, POR TIPO, 2018-2032 (MILES DE USD)
CUADRO 286 SUPLEMENTOS DIETÉTICOS EN EL MERCADO DE ARROZ DE MANABÍ, POR FORMA DE PRODUCTO, 2018-2032 (MILES DE USD)
CUADRO 287 MERCADO DE ARROZ DE MANABÍ, POR CANAL DE DISTRIBUCIÓN, 2018-2032 (MILES DE USD)
CUADRO 288 MERCADO DE ARROZ DE MANABÍ, POR CANAL DE DISTRIBUCIÓN, 2018-2032 (TONELADAS)
CUADRO 289 MERCADO DE ARROZ DE MANABÍ, POR CANAL DE DISTRIBUCIÓN, 2018-2032 (USD/KG)
CUADRO 290 MANABÍ FUERA DE LÍNEA EN EL MERCADO DE ARROZ, POR TIPO, 2018-2032 (USD MILES)
CUADRO 291 VENTAS AL POR MENOR EN EL MERCADO DE ARROZ DE MANABÍ, POR TIPO DE CANAL, 2018-2032 (MILES DE USD)
CUADRO 292 MERCADO DE ARROZ EN LÍNEA DE MANABÍ, POR TIPO, 2018-2032 (USD MILES)
CUADRO 293 MERCADO DE ARROZ DE LOJA, POR TIPO, 2018-2032 (MILES DE USD)
CUADRO 294 MERCADO DE ARROZ DE LOJA, POR TIPO, 2018-2032 (TONELADAS)
CUADRO 295 MERCADO DE ARROZ DE LOJA, POR TIPO, 2018-2032 (USD/KG)
TABLA 296 MERCADO DE ARROZ DE LOJA, POR COLOR DE ARROZ, 2018-2032 (MILES DE USD)
CUADRO 297 MERCADO DE ARROZ DE LOJA, POR COLOR DE ARROZ, 2018-2032 (TONELADAS)
CUADRO 298 MERCADO DE ARROZ DE LOJA, POR COLOR DE ARROZ, 2018-2032 (USD/KG)
CUADRO 299 MERCADO DE ARROZ DE LOJA, POR TAMAÑO DE GRANO, 2018-2032 (MILES DE USD)
CUADRO 300 MERCADO DE ARROZ DE LOJA, POR TAMAÑO DE GRANO, 2018-2032 (TONELADAS)
CUADRO 301 MERCADO DE ARROZ DE LOJA, POR TAMAÑO DE GRANO, 2018-2032 (USD/KG)
CUADRO 302 MERCADO DE ARROZ DE LOJA, POR NATURALEZA, 2018-2032 (MILES DE USD)
CUADRO 303 MERCADO DE ARROZ DE LOJA, POR NATURALEZA, 2018-2032 (TONELADAS)
CUADRO 304 MERCADO DE ARROZ DE LOJA, POR NATURALEZA, 2018-2032 (USD/KG)
CUADRO 305 MERCADO DE ARROZ DE LOJA, POR CONTENIDO DE ALMIDÓN, 2018-2032 (MILES DE USD)
CUADRO 306 MERCADO DE ARROZ DE LOJA, POR CONTENIDO DE ALMIDÓN, 2018-2032 (TONELADAS)
CUADRO 307 MERCADO DE ARROZ DE LOJA, POR CONTENIDO DE ALMIDÓN, 2018-2032 (USD/KG)
CUADRO 308 MERCADO DE ARROZ DE LOJA, POR FORMA DE PROCESAMIENTO, 2018-2032 (MILES DE USD)
CUADRO 309 MERCADO DE ARROZ DE LOJA, POR FORMA DE PROCESAMIENTO, 2018-2032 (TONELADAS)
CUADRO 310 MERCADO DE ARROZ DE LOJA, POR FORMA DE PROCESAMIENTO, 2018-2032 (USD/KG)
CUADRO 311 MERCADO DE ARROZ DE LOJA, SEGÚN GRADO DE MOLIENDA, 2018-2032 (MILES DE USD)
CUADRO 312 MERCADO DE ARROZ DE LOJA, SEGÚN GRADO DE MOLIENDA, 2018-2032 (TONELADAS)
CUADRO 313 MERCADO DE ARROZ DE LOJA, POR GRADO DE MOLIENDA, 2018-2032 (USD/KG)
CUADRO 314 MERCADO DE ARROZ DE LOJA, POR PULIDO, 2018-2032 (MILES DE USD)
CUADRO 315 MERCADO DE ARROZ DE LOJA, POR PULIDO, 2018-2032 (TONELADAS)
CUADRO 316 MERCADO DE ARROZ DE LOJA, POR PULIDO, 2018-2032 (USD/KG)
CUADRO 317 MERCADO DE ARROZ DE LOJA, POR FORTIFICACIÓN, 2018-2032 (MILES DE USD)
CUADRO 318 MERCADO DE ARROZ DE LOJA, POR FORTIFICACIÓN, 2018-2032 (TONELADAS)
CUADRO 319 MERCADO DE ARROZ DE LOJA, POR FORTIFICACIÓN, 2018-2032 (USD/KG)
CUADRO 320 MERCADO DE ARROZ FORTIFICADO DE LOJA, POR PROCESO, 2018-2032 (MILES DE USD)
TABLA 321 MERCADO DE ARROZ DE LOJA, POR AROMA, 2018-2032 (MILES DE USD)
TABLA 322 MERCADO DE ARROZ DE LOJA, POR AROMA, 2018-2032 (TONELADAS)
TABLA 323 MERCADO DE ARROZ DE LOJA, POR AROMA, 2018-2032 (USD/KG)
TABLA 324 ARROZ AROMÁTICO DE LOJA EN EL MERCADO DE ARROZ, POR TIPO, 2018-2032 (MILES DE USD)
CUADRO 325 MERCADO DE ARROZ DE LOJA, POR DERIVADOS DEL ARROZ, 2018-2032 (MILES DE USD)
CUADRO 326 MERCADO DE ARROZ DE LOJA, POR DERIVADOS DEL ARROZ, 2018-2032 (TONELADAS)
CUADRO 327 MERCADO DE ARROZ DE LOJA, POR DERIVADOS DEL ARROZ, 2018-2032 (USD/KG)
CUADRO 328 MERCADO DE ARROZ DE LOJA, POR USUARIO FINAL, 2018-2032 (MILES DE USD)
CUADRO 329 MERCADO DE ARROZ DE LOJA, POR USUARIO FINAL, 2018-2032 (TONELADAS)
CUADRO 330 MERCADO DE ARROZ DE LOJA, POR USUARIO FINAL, 2018-2032 (USD/KG)
TABLA 331 ALIMENTOS Y BEBIDAS EN EL MERCADO DE ARROZ DE LOJA, POR TIPO, 2018-2032 (MILES DE USD)
TABLA 332 MERCADO DE ARROZ EN LOJA, POR TIPO, 2018-2032 (MILES DE USD)
TABLA 333 PANADERÍA DE LOJA EN EL MERCADO DE ARROZ, POR TIPO, 2018-2032 (MILES DE USD)
TABLA 334 MERCADO DE ALIMENTOS PROCESADOS EN ARROZ DE LOJA, POR TIPO, 2018-2032 (MILES DE USD)
TABLA 335 MERCADO DE CONFITERÍA DE LOJA EN ARROZ, POR TIPO, 2018-2032 (MILES DE USD)
CUADRO 336 FÓRMULAS INFANTILES EN EL MERCADO DE ARROZ DE LOJA, POR TIPO, 2018-2032 (MILES DE USD)
TABLA 337 PRODUCTOS LÁCTEOS DE LOJA EN EL MERCADO DE ARROZ, POR TIPO, 2018-2032 (MILES DE USD)
TABLA 338 BEBIDAS DE LOJA EN EL MERCADO DE ARROZ, POR TIPO, 2018-2032 (MILES DE USD)
TABLA 339 BEBIDAS SALUDABLES EN EL MERCADO DE ARROZ DE LOJA, POR TIPO, 2018-2032 (MILES DE USD)
CUADRO 340 MERCADO DE ARROZ ALIMENTICIO DE LOJA, POR CATEGORÍA, 2018-2032 (MILES DE USD)
TABLA 341 MERCADO DE AVES DE CORRAL EN ARROZ DE LOJA, POR TIPO, 2018-2032 (MILES DE USD)
CUADRO 342 RUMIANTES DE LOJA EN EL MERCADO DE ARROZ, POR TIPO, 2018-2032 (MILES DE USD)
TABLA 343 MERCADO DE ARROZ PORCINO DE LOJA, POR TIPO, 2018-2032 (MILES DE USD)
TABLA 344 PET DE LOJA EN EL MERCADO DE ARROZ, POR TIPO, 2018-2032 (MILES DE USD)
TABLA 345 MERCADO DE ARROZ DE ANIMALES ACUÁTICOS DE LOJA, POR TIPO, 2018-2032 (MILES DE USD)
TABLA 346 CRUSTÁCEOS DE LOJA EN EL MERCADO DE ARROZ, POR TIPO, 2018-2032 (MILES DE USD)
TABLA 347 PESCADO DE LOJA EN EL MERCADO DE ARROZ, POR TIPO, 2018-2032 (MILES DE USD)
TABLA 348 MOLUSCOS DE LOJA EN EL MERCADO DE ARROZ, POR TIPO, 2018-2032 (MILES DE USD)
CUADRO 349 MERCADO DE ARROZ ALIMENTICIO DE LOJA, POR FUNCIÓN SANITARIA, 2018-2032 (MILES DE USD)
TABLA 350 PRODUCTOS FARMACÉUTICOS DE LOJA EN EL MERCADO DE ARROZ, POR APLICACIÓN, 2018-2032 (MILES DE USD)
CUADRO 351 INFECCIONES UROGENITALES EN EL MERCADO DE ARROZ DE LOJA, POR TIPO, 2018-2032 (MILES DE USD)
TABLA 352 PRODUCTOS FARMACÉUTICOS DE LOJA EN EL MERCADO DE ARROZ, POR FORMA DE PRODUCTO, 2018-2032 (MILES DE USD)
TABLA 353 COSMÉTICOS Y CUIDADO PERSONAL EN EL MERCADO DE ARROZ DE LOJA, POR CATEGORÍA, 2018-2032 (MILES DE USD)
TABLA 354 PRODUCTOS DE CUIDADO FACIAL DE LOJA EN EL MERCADO DE ARROZ, POR TIPO, 2018-2032 (MILES DE USD)
TABLA 355 PRODUCTOS PARA EL CUIDADO DEL CABELLO EN EL MERCADO DE ARROZ DE LOJA, POR TIPO, 2018-2032 (MILES DE USD)
TABLA 356 SUPLEMENTOS DIETÉTICOS EN EL MERCADO DE ARROZ DE LOJA, POR TIPO, 2018-2032 (MILES DE USD)
TABLA 357 SUPLEMENTOS DIETÉTICOS EN EL MERCADO DE ARROZ DE LOJA, POR FORMA DE PRODUCTO, 2018-2032 (MILES DE USD)
CUADRO 358 MERCADO DE ARROZ DE LOJA, POR CANAL DE DISTRIBUCIÓN, 2018-2032 (MILES DE USD)
CUADRO 359 MERCADO DE ARROZ DE LOJA, POR CANAL DE DISTRIBUCIÓN, 2018-2032 (TONELADAS)
CUADRO 360 MERCADO DE ARROZ DE LOJA, POR CANAL DE DISTRIBUCIÓN, 2018-2032 (USD/KG)
TABLA 361 LOJA FUERA DE LÍNEA EN EL MERCADO DE ARROZ, POR TIPO, 2018-2032 (MILES DE USD)
TABLA 362 VENTAS AL POR MENOR EN EL MERCADO DE ARROZ DE LOJA, POR TIPO DE CANAL, 2018-2032 (MILES DE USD)
TABLA 363 LOJA EN LÍNEA EN EL MERCADO DE ARROZ, POR TIPO, 2018-2032 (MILES DE USD)
TABLA 364 MERCADO DE ARROZ DE EL ORO, POR TIPO, 2018-2032 (MILES DE USD)
TABLA 365 MERCADO DE ARROZ DE EL ORO, POR TIPO, 2018-2032 (TONELADAS)
TABLA 366 MERCADO DE ARROZ DE EL ORO, POR TIPO, 2018-2032 (USD/KG)
TABLA 367 MERCADO DE ARROZ DE EL ORO, POR COLOR DE ARROZ, 2018-2032 (MILES DE USD)
TABLA 368 MERCADO DE ARROZ DE EL ORO, POR COLOR DEL ARROZ, 2018-2032 (TONELADAS)
TABLA 369 MERCADO DE ARROZ DE EL ORO, POR COLOR DE ARROZ, 2018-2032 (USD/KG)
TABLA 370 MERCADO DE ARROZ DE EL ORO, POR TAMAÑO DE GRANO, 2018-2032 (MILES DE USD)
TABLA 371 MERCADO DE ARROZ DE EL ORO, POR TAMAÑO DE GRANO, 2018-2032 (TONELADAS)
TABLA 372 MERCADO DE ARROZ DE EL ORO, POR TAMAÑO DE GRANO, 2018-2032 (USD/KG)
TABLA 373 MERCADO DE ARROZ DE EL ORO, POR NATURALEZA, 2018-2032 (MILES DE USD)
TABLA 374 MERCADO DE ARROZ DE EL ORO, POR NATURALEZA, 2018-2032 (TONELADAS)
TABLA 375 MERCADO DE ARROZ DE EL ORO, POR NATURALEZA, 2018-2032 (USD/KG)
TABLA 376 MERCADO DE ARROZ DE EL ORO, POR CONTENIDO DE ALMIDÓN, 2018-2032 (MILES DE USD)
TABLA 377 MERCADO DE ARROZ DE EL ORO, POR CONTENIDO DE ALMIDÓN, 2018-2032 (TONELADAS)
TABLA 378 MERCADO DE ARROZ DE EL ORO, POR CONTENIDO DE ALMIDÓN, 2018-2032 (USD/KG)
TABLA 379 MERCADO DE ARROZ DE EL ORO, POR FORMA DE PROCESAMIENTO, 2018-2032 (MILES DE USD)
TABLA 380 MERCADO DE ARROZ DE EL ORO, POR FORMA DE PROCESAMIENTO, 2018-2032 (TONELADAS)
TABLA 381 MERCADO DE ARROZ DE EL ORO, POR FORMA DE PROCESAMIENTO, 2018-2032 (USD/KG)
CUADRO 382 MERCADO DE ARROZ DE EL ORO, SEGÚN GRADO DE MOLIENDA, 2018-2032 (MILES DE USD)
CUADRO 383 MERCADO DE ARROZ DE EL ORO, POR GRADO DE MOLIENDA, 2018-2032 (TONELADAS)
CUADRO 384 MERCADO DE ARROZ DE EL ORO, POR GRADO DE MOLIENDA, 2018-2032 (USD/KG)
TABLA 385 MERCADO DE ARROZ DE EL ORO, POR PULIDO, 2018-2032 (MILES DE USD)
TABLA 386 MERCADO DE ARROZ DE EL ORO, POR PULIDO, 2018-2032 (TONELADAS)
TABLA 387 MERCADO DE ARROZ DE EL ORO, POR PULIDO, 2018-2032 (USD/KG)
TABLA 388 MERCADO DE ARROZ DE EL ORO, POR FORTIFICACIÓN, 2018-2032 (MILES DE USD)
TABLA 389 MERCADO DE ARROZ DE EL ORO, POR FORTIFICACIÓN, 2018-2032 (TONELADAS)
TABLA 390 MERCADO DE ARROZ DE EL ORO, POR FORTIFICACIÓN, 2018-2032 (USD/KG)
TABLA 391 MERCADO DE ARROZ FORTIFICADO DE EL ORO, POR PROCESO, 2018-2032 (MILES DE USD)
TABLA 392 MERCADO DE ARROZ DE EL ORO, POR AROMA, 2018-2032 (MILES DE USD)
TABLA 393 MERCADO DE ARROZ DE EL ORO, POR AROMA, 2018-2032 (TONELADAS)
TABLA 394 MERCADO DE ARROZ DE EL ORO, POR AROMA, 2018-2032 (USD/KG)
TABLA 395 ARROZ AROMÁTICO EL ORO EN EL MERCADO DE ARROZ, POR TIPO, 2018-2032 (MILES DE USD)
TABLA 396 MERCADO DE ARROZ DE EL ORO, POR DERIVADOS DEL ARROZ, 2018-2032 (MILES DE USD)
TABLA 397 MERCADO DE ARROZ DE EL ORO, POR DERIVADOS DEL ARROZ, 2018-2032 (TONELADAS)
CUADRO 398 MERCADO DE ARROZ DE EL ORO, POR DERIVADOS DEL ARROZ, 2018-2032 (USD/KG)
TABLA 399 MERCADO DE ARROZ DE EL ORO, POR USUARIO FINAL, 2018-2032 (MILES DE USD)
TABLA 400 MERCADO DE ARROZ DE EL ORO, POR USUARIO FINAL, 2018-2032 (TONELADAS)
CUADRO 401 MERCADO DE ARROZ DE EL ORO, POR USUARIO FINAL, 2018-2032 (USD/KG)
TABLA 402 MERCADO DE ALIMENTOS Y BEBIDAS EN ARROZ DE EL ORO, POR TIPO, 2018-2032 (MILES DE USD)
TABLA 403 MERCADO DE ARROZ EN EL ORO, POR TIPO, 2018-2032 (MILES DE USD)
TABLA 404 PANADERÍA EL ORO EN EL MERCADO DEL ARROZ, POR TIPO, 2018-2032 (MILES DE USD)
TABLA 405 MERCADO DE ARROZ EN ALIMENTOS PROCESADOS DE EL ORO, POR TIPO, 2018-2032 (MILES DE USD)
TABLA 406 MERCADO DE CONFITERÍA EL ORO EN ARROZ, POR TIPO, 2018-2032 (MILES DE USD)
TABLA 407 MERCADO DE ARROZ DE FÓRMULA INFANTIL DE EL ORO, POR TIPO, 2018-2032 (MILES DE USD)
TABLA 408 PRODUCTOS LÁCTEOS DE EL ORO EN EL MERCADO DE ARROZ, POR TIPO, 2018-2032 (MILES DE USD)
TABLA 409 BEBIDAS DE EL ORO EN EL MERCADO DE ARROZ, POR TIPO, 2018-2032 (MILES DE USD)
TABLA 410 BEBIDAS SALUDABLES DE EL ORO EN EL MERCADO DE ARROZ, POR TIPO, 2018-2032 (MILES DE USD)
TABLA 411 MERCADO DE ARROZ ALIMENTARIO DE EL ORO, POR CATEGORÍA, 2018-2032 (MILES DE USD)
TABLA 412 MERCADO DE AVES DE CORRAL EN ARROZ DE EL ORO, POR TIPO, 2018-2032 (MILES DE USD)
TABLA 413 RUMIANTES DE EL ORO EN EL MERCADO DE ARROZ, POR TIPO, 2018-2032 (MILES DE USD)
TABLA 414 MERCADO DE ARROZ PORCINO DE EL ORO, POR TIPO, 2018-2032 (MILES DE USD)
TABLA 415 MERCADO DE ARROZ PET DE EL ORO, POR TIPO, 2018-2032 (MILES DE USD)
TABLA 416 MERCADO DE ARROZ DE ANIMALES ACUÁTICOS DE EL ORO, POR TIPO, 2018-2032 (MILES DE USD)
TABLA 417 CRUSTÁCEOS DE EL ORO EN EL MERCADO DE ARROZ, POR TIPO, 2018-2032 (MILES DE USD)
TABLA 418 MERCADO DE PESCADO EN ARROZ DE EL ORO, POR TIPO, 2018-2032 (MILES DE USD)
TABLA 419 MOLUSCOS DE EL ORO EN EL MERCADO DE ARROZ, POR TIPO, 2018-2032 (MILES DE USD)
TABLA 420 MERCADO DE ARROZ ALIMENTARIO DE EL ORO, POR FUNCIÓN DE SALUD, 2018-2032 (MILES DE USD)
TABLA 421 PRODUCTOS FARMACÉUTICOS DE EL ORO EN EL MERCADO DE ARROZ, POR APLICACIÓN, 2018-2032 (MILES DE USD)
TABLA 422 INFECCIONES UROGENTALES EN EL MERCADO DE ARROZ DE EL ORO, POR TIPO, 2018-2032 (MILES DE USD)
TABLA 423 PRODUCTOS FARMACÉUTICOS DE EL ORO EN EL MERCADO DE ARROZ, POR FORMA DE PRODUCTO, 2018-2032 (MILES DE USD)
TABLA 424 MERCADO DE COSMÉTICOS Y CUIDADO PERSONAL EN ARROZ DE EL ORO, POR CATEGORÍA, 2018-2032 (MILES DE USD)
TABLA 425 PRODUCTOS DE CUIDADO FACIAL DE EL ORO EN EL MERCADO DE ARROZ, POR TIPO, 2018-2032 (MILES DE USD)
TABLA 426 PRODUCTOS PARA EL CUIDADO DEL CABELLO EN EL MERCADO DE ARROZ DE EL ORO, POR TIPO, 2018-2032 (MILES DE USD)
TABLA 427 SUPLEMENTOS DIETÉTICOS EN EL MERCADO DE ARROZ DE EL ORO, POR TIPO, 2018-2032 (MILES DE USD)
TABLA 428 SUPLEMENTOS DIETÉTICOS EN EL MERCADO DE ARROZ DE EL ORO, POR FORMA DE PRODUCTO, 2018-2032 (MILES DE USD)
TABLA 429 MERCADO DE ARROZ DE EL ORO, POR CANAL DE DISTRIBUCIÓN, 2018-2032 (MILES DE USD)
TABLA 430 MERCADO DE ARROZ DE EL ORO, POR CANAL DE DISTRIBUCIÓN, 2018-2032 (TONELADAS)
TABLA 431 MERCADO DE ARROZ DE EL ORO, POR CANAL DE DISTRIBUCIÓN, 2018-2032 (USD/KG)
TABLA 432 EL ORO FUERA DE LÍNEA EN EL MERCADO DE ARROZ, POR TIPO, 2018-2032 (MILES DE USD)
TABLA 433 VENTAS AL POR MENOR EN EL MERCADO DE ARROZ DE EL ORO, POR TIPO DE CANAL, 2018-2032 (MILES DE USD)
TABLA 434 MERCADO DE ARROZ EN LÍNEA DE EL ORO, POR TIPO, 2018-2032 (MILES DE USD)
TABLA 435 MERCADO DE ARROZ DE ESMERALDAS, POR TIPO, 2018-2032 (MILES DE USD)
CUADRO 436 MERCADO DE ARROZ DE ESMERALDAS, POR TIPO, 2018-2032 (TONELADAS)
CUADRO 437 MERCADO DE ARROZ DE ESMERALDAS, POR TIPO, 2018-2032 (USD/KG)
TABLA 438 MERCADO DE ARROZ DE ESMERALDAS, POR COLOR DE ARROZ, 2018-2032 (MILES DE USD)
TABLA 439 MERCADO DE ARROZ DE ESMERALDAS, POR COLOR DE ARROZ, 2018-2032 (TONELADAS)
TABLA 440 MERCADO DE ARROZ DE ESMERALDAS, POR COLOR DE ARROZ, 2018-2032 (USD/KG)
TABLA 441 MERCADO DE ARROZ ESMERALDAS, POR TAMAÑO DE GRANO, 2018-2032 (MILES DE USD)
CUADRO 442 MERCADO DE ARROZ ESMERALDAS, POR TAMAÑO DE GRANO, 2018-2032 (TONELADAS)
TABLA 443 MERCADO DE ARROZ ESMERALDAS, POR TAMAÑO DE GRANO, 2018-2032 (USD/KG)
TABLA 444 MERCADO DEL ARROZ DE ESMERALDAS, POR NATURALEZA, 2018-2032 (MILES DE USD)
TABLA 445 MERCADO DE ARROZ DE ESMERALDAS, POR NATURALEZA, 2018-2032 (TONELADAS)
TABLA 446 MERCADO DE ARROZ DE ESMERALDAS, POR NATURALEZA, 2018-2032 (USD/KG)
TABLA 447 MERCADO DE ARROZ DE ESMERALDAS, POR CONTENIDO DE ALMIDÓN, 2018-2032 (MILES DE USD)
CUADRO 448 MERCADO DE ARROZ DE ESMERALDAS, POR CONTENIDO DE ALMIDÓN, 2018-2032 (TONELADAS)
CUADRO 449 MERCADO DE ARROZ ESMERALDAS, POR CONTENIDO DE ALMIDÓN, 2018-2032 (USD/KG)
CUADRO 450 MERCADO DE ARROZ DE ESMERALDAS, SEGÚN FORMA DE PROCESAMIENTO, 2018-2032 (MILES DE USD)
TABLA 451 MERCADO DE ARROZ DE ESMERALDAS, POR FORMA DE PROCESAMIENTO, 2018-2032 (TONELADAS)
CUADRO 452 MERCADO DE ARROZ DE ESMERALDAS, POR FORMA DE PROCESAMIENTO, 2018-2032 (USD/KG)
CUADRO 453 MERCADO DE ARROZ DE ESMERALDAS, SEGÚN GRADO DE MOLIENDA, 2018-2032 (MILES DE USD)
CUADRO 454 MERCADO DE ARROZ DE ESMERALDAS, SEGÚN GRADO DE MOLIENDA, 2018-2032 (TONELADAS)
CUADRO 455 MERCADO DE ARROZ DE ESMERALDAS, SEGÚN GRADO DE MOLIENDA, 2018-2032 (USD/KG)
TABLA 456 MERCADO DE ARROZ DE ESMERALDAS, POR PULIDO, 2018-2032 (MILES DE USD)
TABLA 457 MERCADO DE ARROZ ESMERALDAS, POR PULIDO, 2018-2032 (TONELADAS)
TABLA 458 MERCADO DE ARROZ ESMERALDAS, POR PULIDO, 2018-2032 (USD/KG)
TABLA 459 MERCADO DE ARROZ ESMERALDAS, POR FORTIFICACIÓN, 2018-2032 (MILES DE USD)
CUADRO 460 MERCADO DE ARROZ ESMERALDAS, POR FORTIFICACIÓN, 2018-2032 (TONELADAS)
CUADRO 461 MERCADO DE ARROZ ESMERALDAS, POR FORTIFICACIÓN, 2018-2032 (USD/KG)
CUADRO 462 MERCADO DE ARROZ FORTIFICADO DE ESMERALDAS, POR PROCESO, 2018-2032 (MILES DE USD)
TABLA 463 MERCADO DEL ARROZ DE ESMERALDAS, POR AROMA, 2018-2032 (MILES DE USD)
TABLA 464 MERCADO DE ARROZ DE ESMERALDAS, POR AROMA, 2018-2032 (TONELADAS)
TABLA 465 MERCADO DEL ARROZ DE ESMERALDAS, POR AROMA, 2018-2032 (USD/KG)
TABLA 466 ARROZ AROMÁTICO ESMERALDAS EN EL MERCADO DE ARROZ, POR TIPO, 2018-2032 (MILES DE USD)
TABLA 467 MERCADO DE ARROZ DE ESMERALDAS, POR DERIVADOS DEL ARROZ, 2018-2032 (MILES DE USD)
CUADRO 468 MERCADO DE ARROZ DE ESMERALDAS, POR DERIVADOS DEL ARROZ, 2018-2032 (TONELADAS)
CUADRO 469 MERCADO DE ARROZ DE ESMERALDAS, POR DERIVADOS DEL ARROZ, 2018-2032 (USD/KG)
CUADRO 470 MERCADO DE ARROZ DE ESMERALDAS, POR USUARIO FINAL, 2018-2032 (MILES DE USD)
CUADRO 471 MERCADO DE ARROZ DE ESMERALDAS, POR USUARIO FINAL, 2018-2032 (TONELADAS)
CUADRO 472 MERCADO DE ARROZ DE ESMERALDAS, POR USUARIO FINAL, 2018-2032 (USD/KG)
TABLA 473 MERCADO DE ALIMENTOS Y BEBIDAS EN ARROZ DE ESMERALDAS, POR TIPO, 2018-2032 (MILES DE USD)
TABLA 474 MERCADO DE ARROZ EN ESMERALDAS, POR TIPO, 2018-2032 (MILES DE USD)
TABLA 475 PANADERÍA ESMERALDAS EN EL MERCADO DEL ARROZ, POR TIPO, 2018-2032 (USD MILES)
TABLA 476 MERCADO DE ALIMENTOS PROCESADOS EN ARROZ DE ESMERALDAS, POR TIPO, 2018-2032 (MILES DE USD)
TABLA 477 CONFITERÍA ESMERALDAS EN EL MERCADO DE ARROZ, POR TIPO, 2018-2032 (MILES DE USD)
TABLA 478 MERCADO DE ARROZ DE FÓRMULA INFANTIL DE ESMERALDAS, POR TIPO, 2018-2032 (MILES DE USD)
TABLA 479 PRODUCTOS LÁCTEOS DE ESMERALDAS EN EL MERCADO DE ARROZ, POR TIPO, 2018-2032 (MILES DE USD)
TABLA 480 BEBIDAS ESMERALDAS EN EL MERCADO DE ARROZ, POR TIPO, 2018-2032 (MILES DE USD)
TABLA 481 BEBIDAS SALUDABLES EN EL MERCADO DE ARROZ DE ESMERALDAS, POR TIPO, 2018-2032 (MILES DE USD)
CUADRO 482 MERCADO DE ARROZ ALIMENTARIO EN ESMERALDAS, POR CATEGORÍA, 2018-2032 (MILES DE USD)
TABLA 483 MERCADO DE AVES DE CORRAL EN ARROZ DE ESMERALDAS, POR TIPO, 2018-2032 (MILES DE USD)
TABLA 484 RUMIANTES DE ESMERALDAS EN EL MERCADO DE ARROZ, POR TIPO, 2018-2032 (MILES DE USD)
TABLA 485 MERCADO DE ARROZ PORCINO DE ESMERALDAS, POR TIPO, 2018-2032 (MILES DE USD)
TABLA 486 PET EN EL MERCADO DE ARROZ DE ESMERALDAS, POR TIPO, 2018-2032 (MILES DE USD)
TABLA 487 MERCADO DE ARROZ DE ANIMALES ACUÁTICOS DE ESMERALDAS, POR TIPO, 2018-2032 (MILES DE USD)
TABLA 488 CRUSTÁCEOS DE ESMERALDAS EN EL MERCADO DE ARROZ, POR TIPO, 2018-2032 (MILES DE USD)
TABLA 489 PESCADO EN EL MERCADO DE ARROZ DE ESMERALDAS, POR TIPO, 2018-2032 (MILES DE USD)
TABLA 490 MOLUSCOS ESMERALDAS EN EL MERCADO DE ARROZ, POR TIPO, 2018-2032 (MILES DE USD)
CUADRO 491 MERCADO DE ARROZ ALIMENTARIO EN ESMERALDAS, POR FUNCIÓN SANITARIA, 2018-2032 (MILES DE USD)
TABLA 492 PRODUCTOS FARMACÉUTICOS DE ESMERALDAS EN EL MERCADO DE ARROZ, POR APLICACIÓN, 2018-2032 (MILES DE USD)
TABLA 493 INFECCIONES UROGENITALES EN EL MERCADO DE ARROZ DE ESMERALDAS, POR TIPO, 2018-2032 (MILES DE USD)
TABLA 494 PRODUCTOS FARMACÉUTICOS DE ESMERALDAS EN EL MERCADO DE ARROZ, POR FORMA DE PRODUCTO, 2018-2032 (MILES DE USD)
TABLA 495 MERCADO DE COSMÉTICOS Y CUIDADO PERSONAL EN ARROZ DE ESMERALDAS, POR CATEGORÍA, 2018-2032 (MILES DE USD)
TABLA 496 PRODUCTOS DE CUIDADO FACIAL DE ESMERALDAS EN EL MERCADO DE ARROZ, POR TIPO, 2018-2032 (MILES DE USD)
TABLA 497 PRODUCTOS PARA EL CUIDADO DEL CABELLO EN EL MERCADO DE ARROZ DE ESMERALDAS, POR TIPO, 2018-2032 (MILES DE USD)
TABLA 498 SUPLEMENTOS DIETÉTICOS EN EL MERCADO DE ARROZ DE ESMERALDAS, POR TIPO, 2018-2032 (MILES DE USD)
TABLA 499 SUPLEMENTOS DIETÉTICOS EN EL MERCADO DE ARROZ DE ESMERALDAS, POR FORMA DE PRODUCTO, 2018-2032 (MILES DE USD)
TABLA 500 MERCADO DEL ARROZ DE ESMERALDAS, POR CANAL DE DISTRIBUCIÓN, 2018-2032 (MILES DE USD)
CUADRO 501 MERCADO DE ARROZ DE ESMERALDAS, POR CANAL DE DISTRIBUCIÓN, 2018-2032 (TONELADAS)
CUADRO 502 MERCADO DE ARROZ DE ESMERALDAS, POR CANAL DE DISTRIBUCIÓN, 2018-2032 (USD/KG)
TABLA 503 ESMERALDAS FUERA DE LÍNEA EN EL MERCADO DE ARROZ, POR TIPO, 2018-2032 (MILES DE USD)
TABLA 504 VENTAS AL POR MENOR EN EL MERCADO DE ARROZ DE ESMERALDAS, POR TIPO DE CANAL, 2018-2032 (MILES DE USD)
TABLA 505 ESMERALDAS EN LÍNEA EN EL MERCADO DE ARROZ, POR TIPO, 2018-2032 (MILES DE USD)
TABLA 506 MERCADO DE ARROZ DE CAÑAR, POR TIPO, 2018-2032 (MILES DE USD)
CUADRO 507 MERCADO DE ARROZ DE CAÑAR, POR TIPO, 2018-2032 (TONELADAS)
CUADRO 508 MERCADO DE ARROZ DE CAÑAR, POR TIPO, 2018-2032 (USD/KG)
TABLA 509 MERCADO DE ARROZ DE CAÑAR, POR COLOR DE ARROZ, 2018-2032 (MILES DE USD)
TABLA 510 MERCADO DE ARROZ DE CAÑAR, POR COLOR DE ARROZ, 2018-2032 (TONELADAS)
TABLA 511 MERCADO DE ARROZ DE CAÑAR, POR COLOR DE ARROZ, 2018-2032 (USD/KG)
TABLA 512 MERCADO DE ARROZ CAÑAR, POR TAMAÑO DE GRANO, 2018-2032 (MILES DE USD)
CUADRO 513 MERCADO DE ARROZ DE CAÑAR, POR TAMAÑO DE GRANO, 2018-2032 (TONELADAS)
CUADRO 514 MERCADO DE ARROZ CAÑAR, POR TAMAÑO DE GRANO, 2018-2032 (USD/KG)
TABLA 515 MERCADO DEL ARROZ DE CAÑAR, POR NATURALEZA, 2018-2032 (MILES DE USD)
TABLA 516 MERCADO DEL ARROZ DE CAÑAR, POR NATURALEZA, 2018-2032 (TONELADAS)
TABLA 517 MERCADO DEL ARROZ DE CAÑAR, POR NATURALEZA, 2018-2032 (USD/KG)
TABLA 518 MERCADO DE ARROZ DE CAÑAR, POR CONTENIDO DE ALMIDÓN, 2018-2032 (MILES DE USD)
CUADRO 519 MERCADO DE ARROZ DE CAÑAR, POR CONTENIDO DE ALMIDÓN, 2018-2032 (TONELADAS)
TABLA 520 MERCADO DE ARROZ CAÑAR, POR CONTENIDO DE ALMIDÓN, 2018-2032 (USD/KG)
CUADRO 521 MERCADO DE ARROZ DE CAÑAR, SEGÚN FORMA DE PROCESAMIENTO, 2018-2032 (MILES DE USD)
CUADRO 522 MERCADO DE ARROZ DE CAÑAR, SEGÚN FORMA DE PROCESAMIENTO, 2018-2032 (TONELADAS)
CUADRO 523 MERCADO DE ARROZ DE CAÑAR, SEGÚN FORMA DE PROCESAMIENTO, 2018-2032 (USD/KG)
CUADRO 524 MERCADO DE ARROZ DE CAÑAR, SEGÚN GRADO DE MOLIENDA, 2018-2032 (MILES DE USD)
CUADRO 525 MERCADO DE ARROZ DE CAÑAR, SEGÚN GRADO DE MOLIENDA, 2018-2032 (TONELADAS)
CUADRO 526 MERCADO DE ARROZ DE CAÑAR, SEGÚN GRADO DE MOLIENDA, 2018-2032 (USD/KG)
TABLA 527 MERCADO DE ARROZ CAÑAR, POR PULIDO, 2018-2032 (MILES DE USD)
TABLA 528 MERCADO DE ARROZ DE CAÑAR, POR PULIDO, 2018-2032 (TONELADAS)
TABLA 529 MERCADO DE ARROZ CAÑAR, POR PULIDO, 2018-2032 (USD/KG)
TABLA 530 MERCADO DE ARROZ CAÑAR, POR FORTIFICACIÓN, 2018-2032 (MILES DE USD)
CUADRO 531 MERCADO DE ARROZ DE CAÑAR, POR FORTIFICACIÓN, 2018-2032 (TONELADAS)
CUADRO 532 MERCADO DE ARROZ CAÑAR, POR FORTIFICACIÓN, 2018-2032 (USD/KG)
CUADRO 533 MERCADO DE ARROZ FORTIFICADO CAÑAR, POR PROCESO, 2018-2032 (MILES DE USD)
TABLA 534 MERCADO DEL ARROZ DE CAÑAR, POR AROMA, 2018-2032 (MILES DE USD)
TABLA 535 MERCADO DEL ARROZ DE CAÑAR, POR AROMA, 2018-2032 (TONELADAS)
TABLA 536 MERCADO DEL ARROZ DE CAÑAR, POR AROMA, 2018-2032 (USD/KG)
TABLA 537 ARROZ AROMÁTICO CAÑAR EN EL MERCADO DE ARROZ, POR TIPO, 2018-2032 (MILES DE USD)
CUADRO 538 MERCADO DE ARROZ DE CAÑAR, POR DERIVADOS DEL ARROZ, 2018-2032 (MILES DE USD)
CUADRO 539 MERCADO DE ARROZ DE CAÑAR, POR DERIVADOS DEL ARROZ, 2018-2032 (TONELADAS)
CUADRO 540 MERCADO DE ARROZ DE CAÑAR, POR DERIVADOS DEL ARROZ, 2018-2032 (USD/KG)
CUADRO 541 MERCADO DE ARROZ DE CAÑAR, POR USUARIO FINAL, 2018-2032 (MILES DE USD)
CUADRO 542 MERCADO DE ARROZ DE CAÑAR, POR USUARIO FINAL, 2018-2032 (TONELADAS)
CUADRO 543 MERCADO DE ARROZ DE CAÑAR, POR USUARIO FINAL, 2018-2032 (USD/KG)
TABLA 544 ALIMENTOS Y BEBIDAS CAÑAR EN EL MERCADO DE ARROZ, POR TIPO, 2018-2032 (MILES DE USD)
TABLA 545 ALIMENTOS CAÑAR EN EL MERCADO DE ARROZ, POR TIPO, 2018-2032 (MILES DE USD)
TABLA 546 PANADERÍA CAÑAR EN EL MERCADO DE ARROZ, POR TIPO, 2018-2032 (MILES DE USD)
TABLA 547 MERCADO DE ARROZ PROCESADO EN CAÑAR, POR TIPO, 2018-2032 (MILES DE USD)
TABLA 548 CONFITERÍA CAÑAR EN EL MERCADO DE ARROZ, POR TIPO, 2018-2032 (MILES DE USD)
TABLA 549 MERCADO DE ARROZ DE FÓRMULA INFANTIL CAÑAR, POR TIPO, 2018-2032 (MILES DE USD)
TABLA 550 PRODUCTOS LÁCTEOS DE CAÑAR EN EL MERCADO DE ARROZ, POR TIPO, 2018-2032 (MILES DE USD)
TABLA 551 BEBIDAS DE CAÑAR EN EL MERCADO DEL ARROZ, POR TIPO, 2018-2032 (MILES DE USD)
TABLA 552 BEBIDAS SALUDABLES DE CAÑAR EN EL MERCADO DE ARROZ, POR TIPO, 2018-2032 (MILES DE USD)
TABLA 553 ALIMENTO CAÑAR EN EL MERCADO DE ARROZ, POR CATEGORÍA, 2018-2032 (MILES DE USD)
TABLA 554 MERCADO DE AVES DE CAÑAR EN ARROZ, POR TIPO, 2018-2032 (MILES DE USD)
TABLA 555 RUMIANTES CAÑAR EN EL MERCADO DE ARROZ, POR TIPO, 2018-2032 (MILES DE USD)
TABLA 556 CERDO CAÑAR EN EL MERCADO DE ARROZ, POR TIPO, 2018-2032 (MILES DE USD)
TABLA 557 CAÑAR PET EN EL MERCADO DE ARROZ, POR TIPO, 2018-2032 (MILES DE USD)
TABLA 558 MERCADO DE ARROZ, POR TIPO, ANIMALES ACUÁTICOS CAÑAR, 2018-2032 (MILES DE USD)
TABLA 559 CRUSTÁCEOS CAÑAR EN EL MERCADO DE ARROZ, POR TIPO, 2018-2032 (MILES DE USD)
TABLA 560 PESCADO CAÑAR EN EL MERCADO DE ARROZ, POR TIPO, 2018-2032 (MILES DE USD)
TABLA 561 MOLUSCOS CAÑAR EN EL MERCADO DE ARROZ, POR TIPO, 2018-2032 (MILES DE USD)
TABLA 562 ALIMENTO CAÑAR EN EL MERCADO DE ARROZ, POR FUNCIÓN SANITARIA, 2018-2032 (MILES DE USD)
TABLA 563 PRODUCTOS FARMACÉUTICOS DE CAÑAR EN EL MERCADO DE ARROZ, POR APLICACIÓN, 2018-2032 (MILES DE USD)
TABLA 564 INFECCIONES UROGENITALES DE CAÑAR EN EL MERCADO DE ARROZ, POR TIPO, 2018-2032 (MILES DE USD)
TABLA 565 FARMACÉUTICOS DE CAÑAR EN EL MERCADO DE ARROZ, POR FORMA DE PRODUCTO, 2018-2032 (MILES DE USD)
TABLA 566 MERCADO DE COSMÉTICOS Y CUIDADO PERSONAL EN ARROZ DE CAÑAR, POR CATEGORÍA, 2018-2032 (MILES DE USD)
TABLA 567 PRODUCTOS DE CUIDADO FACIAL DE CAÑAR EN EL MERCADO DE ARROZ, POR TIPO, 2018-2032 (MILES DE USD)
TABLA 568 PRODUCTOS PARA EL CUIDADO DEL CABELLO EN EL MERCADO DE ARROZ DE CAÑAR, POR TIPO, 2018-2032 (MILES DE USD)
TABLA 569 SUPLEMENTOS DIETÉTICOS DE CAÑAR EN EL MERCADO DE ARROZ, POR TIPO, 2018-2032 (MILES DE USD)
TABLA 570 SUPLEMENTOS DIETÉTICOS DE CAÑAR EN EL MERCADO DE ARROZ, POR FORMA DE PRODUCTO, 2018-2032 (MILES DE USD)
TABLA 571 MERCADO DE ARROZ DE CAÑAR, POR CANAL DE DISTRIBUCIÓN, 2018-2032 (MILES DE USD)
CUADRO 572 MERCADO DE ARROZ DE CAÑAR, POR CANAL DE DISTRIBUCIÓN, 2018-2032 (TONELADAS)
CUADRO 573 MERCADO DE ARROZ DE CAÑAR, POR CANAL DE DISTRIBUCIÓN, 2018-2032 (USD/KG)
TABLA 574 CAÑAR FUERA DE LÍNEA EN EL MERCADO DE ARROZ, POR TIPO, 2018-2032 (MILES DE USD)
TABLA 575 VENTAS AL POR MENOR EN EL MERCADO DE ARROZ DE CAÑAR, POR TIPO DE CANAL, 2018-2032 (MILES DE USD)
TABLA 576 CAÑAR EN LÍNEA EN EL MERCADO DE ARROZ, POR TIPO, 2018-2032 (MILES DE USD)
TABLA 577 MERCADO DE ARROZ DEL AZUAY, POR TIPO, 2018-2032 (MILES DE USD)
CUADRO 578 MERCADO DE ARROZ DEL AZUAY, POR TIPO, 2018-2032 (TONELADAS)
CUADRO 579 MERCADO DE ARROZ DEL AZUAY, POR TIPO, 2018-2032 (USD/KG)
TABLA 580 MERCADO DEL ARROZ DEL AZUAY, POR COLOR DEL ARROZ, 2018-2032 (MILES DE USD)
TABLA 581 MERCADO DEL ARROZ DEL AZUAY, POR COLOR DEL ARROZ, 2018-2032 (TONELADAS)
TABLA 582 MERCADO DE ARROZ DEL AZUAY, POR COLOR DE ARROZ, 2018-2032 (USD/KG)
TABLA 583 MERCADO DE ARROZ DEL AZUAY, POR TAMAÑO DE GRANO, 2018-2032 (MILES DE USD)
CUADRO 584 MERCADO DE ARROZ DEL AZUAY, POR TAMAÑO DE GRANO, 2018-2032 (TONELADAS)
CUADRO 585 MERCADO DE ARROZ DEL AZUAY, POR TAMAÑO DE GRANO, 2018-2032 (USD/KG)
TABLA 586 MERCADO DEL ARROZ DEL AZUAY, POR NATURALEZA, 2018-2032 (MILES DE USD)
TABLA 587 MERCADO DEL ARROZ DEL AZUAY, POR NATURALEZA, 2018-2032 (TONELADAS)
CUADRO 588 MERCADO DEL ARROZ DEL AZUAY, POR NATURALEZA, 2018-2032 (USD/KG)
CUADRO 589 MERCADO DE ARROZ DEL AZUAY, POR CONTENIDO DE ALMIDÓN, 2018-2032 (MILES DE USD)
CUADRO 590 MERCADO DE ARROZ DEL AZUAY, POR CONTENIDO DE ALMIDÓN, 2018-2032 (TONELADAS)
CUADRO 591 MERCADO DE ARROZ DEL AZUAY, POR CONTENIDO DE ALMIDÓN, 2018-2032 (USD/KG)
CUADRO 592 MERCADO DE ARROZ DEL AZUAY, SEGÚN FORMA DE PROCESAMIENTO, 2018-2032 (MILES DE USD)
TABLA 593 MERCADO DE ARROZ DEL AZUAY, SEGÚN FORMA DE PROCESAMIENTO, 2018-2032 (TONELADAS)
CUADRO 594 MERCADO DE ARROZ DEL AZUAY, SEGÚN FORMA DE PROCESAMIENTO, 2018-2032 (USD/KG)
CUADRO 595 MERCADO DE ARROZ DEL AZUAY, SEGÚN GRADO DE MOLIENDA, 2018-2032 (MILES DE USD)
CUADRO 596 MERCADO DE ARROZ DEL AZUAY, SEGÚN GRADO DE MOLIENDA, 2018-2032 (TONELADAS)
CUADRO 597 MERCADO DE ARROZ DEL AZUAY, SEGÚN GRADO DE MOLIENDA, 2018-2032 (USD/KG)
TABLA 598 MERCADO DE ARROZ DEL AZUAY, POR PULIDO, 2018-2032 (MILES DE USD)
TABLA 599 MERCADO DE ARROZ DEL AZUAY, POR PULIDO, 2018-2032 (TONELADAS)
TABLA 600 MERCADO DE ARROZ DE AZUAY, POR PULIDO, 2018-2032 (USD/KG)
CUADRO 601 MERCADO DE ARROZ DEL AZUAY, POR FORTIFICACIÓN, 2018-2032 (MILES DE USD)
CUADRO 602 MERCADO DE ARROZ DEL AZUAY, POR FORTIFICACIÓN, 2018-2032 (TONELADAS)
CUADRO 603 MERCADO DEL ARROZ DEL AZUAY, POR FORTIFICACIÓN, 2018-2032 (USD/KG)
CUADRO 604 MERCADO DE ARROZ FORTIFICADO DEL AZUAY, POR PROCESO, 2018-2032 (MILES DE USD)
TABLA 605 MERCADO DEL ARROZ DEL AZUAY, POR AROMA, 2018-2032 (MILES DE USD)
TABLA 606 MERCADO DEL ARROZ DEL AZUAY, POR AROMA, 2018-2032 (TONELADAS)
TABLA 607 MERCADO DEL ARROZ DEL AZUAY, POR AROMA, 2018-2032 (USD/KG)
TABLA 608 ARROZ AROMÁTICO DE AZUAY EN EL MERCADO DE ARROZ, POR TIPO, 2018-2032 (MILES DE USD)
CUADRO 609 MERCADO DE ARROZ DEL AZUAY, POR DERIVADOS DEL ARROZ, 2018-2032 (MILES DE USD)
CUADRO 610 MERCADO DE ARROZ DEL AZUAY, POR DERIVADOS DEL ARROZ, 2018-2032 (TONELADAS)
CUADRO 611 MERCADO DE ARROZ DEL AZUAY, POR DERIVADOS DEL ARROZ, 2018-2032 (USD/KG)
CUADRO 612 MERCADO DE ARROZ DEL AZUAY, POR USUARIO FINAL, 2018-2032 (MILES DE USD)
CUADRO 613 MERCADO DE ARROZ DEL AZUAY, POR USUARIO FINAL, 2018-2032 (TONELADAS)
CUADRO 614 MERCADO DE ARROZ DEL AZUAY, POR USUARIO FINAL, 2018-2032 (USD/KG)
TABLA 615 MERCADO DE ALIMENTOS Y BEBIDAS DEL ARROZ DEL AZUAY, POR TIPO, 2018-2032 (MILES DE USD)
TABLA 616 MERCADO DE ARROZ ALIMENTARIO DEL AZUAY, POR TIPO, 2018-2032 (MILES DE USD)
TABLA 617 PANADERIA EN EL MERCADO DE ARROZ DEL AZUAY, POR TIPO, 2018-2032 (MILES DE USD)
TABLA 618 MERCADO DE ALIMENTOS PROCESADOS EN ARROZ DEL AZUAY, POR TIPO, 2018-2032 (MILES DE USD)
TABLA 619 MERCADO DE CONFITERÍA DEL AZUAY EN ARROZ, POR TIPO, 2018-2032 (MILES DE USD)
CUADRO 620 MERCADO DE ARROZ DE FÓRMULA INFANTIL DE AZUAY, POR TIPO, 2018-2032 (MILES DE USD)
TABLA 621 PRODUCTOS LÁCTEOS DEL AZUAY EN EL MERCADO DE ARROZ, POR TIPO, 2018-2032 (MILES DE USD)
TABLA 622 BEBIDAS DEL AZUAY EN EL MERCADO DE ARROZ, POR TIPO, 2018-2032 (MILES DE USD)
TABLA 623 BEBIDAS SALUDABLES EN EL MERCADO DE ARROZ DEL AZUAY, POR TIPO, 2018-2032 (MILES DE USD)
CUADRO 624 MERCADO DE ARROZ ALIMENTARIO EN EL AZUAY, POR CATEGORÍA, 2018-2032 (MILES DE USD)
TABLA 625 MERCADO DE AVES DE CORRAL EN ARROZ DEL AZUAY, POR TIPO, 2018-2032 (MILES DE USD)
CUADRO 626 RUMIANTES DEL AZUAY EN EL MERCADO DE ARROZ, POR TIPO, 2018-2032 (MILES DE USD)
TABLA 627 MERCADO DE ARROZ PORCINO AZUAY, POR TIPO, 2018-2032 (MILES DE USD)
TABLA 628 MERCADO DE ARROZ DE PET AZUAY, POR TIPO, 2018-2032 (MILES DE USD)
TABLA 629 MERCADO DE ARROZ DE ANIMALES ACUÁTICOS DEL AZUAY, POR TIPO, 2018-2032 (MILES DE USD)
CUADRO 630 CRUSTÁCEOS DEL AZUAY EN EL MERCADO DE ARROZ, POR TIPO, 2018-2032 (MILES DE USD)
TABLA 631 PESCADO DEL AZUAY EN EL MERCADO DE ARROZ, POR TIPO, 2018-2032 (MILES DE USD)
TABLA 632 MOLUSCOS DEL AZUAY EN EL MERCADO DE ARROZ, POR TIPO, 2018-2032 (MILES DE USD)
CUADRO 633 MERCADO DE ARROZ ALIMENTARIO EN EL AZUAY, POR FUNCIÓN SANITARIA, 2018-2032 (MILES DE USD)
TABLA 634 MERCADO DE PRODUCTOS FARMACÉUTICOS DEL ARROZ DEL AZUAY, POR APLICACIÓN, 2018-2032 (MILES DE USD)
CUADRO 635 INFECCIONES UROGENITALES EN EL MERCADO DE ARROZ DEL AZUAY, POR TIPO, 2018-2032 (MILES DE USD)
TABLA 636 MERCADO DE FARMACÉUTICOS DEL ARROZ DEL AZUAY, POR FORMA DE PRODUCTO, 2018-2032 (MILES DE USD)
TABLA 637 MERCADO DE COSMÉTICOS Y CUIDADO PERSONAL EN ARROZ DEL AZUAY, POR CATEGORÍA, 2018-2032 (MILES DE USD)
TABLA 638 PRODUCTOS DE CUIDADO FACIAL EN EL MERCADO DE ARROZ DEL AZUAY, POR TIPO, 2018-2032 (MILES DE USD)
TABLA 639 PRODUCTOS PARA EL CUIDADO DEL CABELLO EN EL MERCADO DE ARROZ DEL AZUAY, POR TIPO, 2018-2032 (MILES DE USD)
TABLA 640 SUPLEMENTOS DIETÉTICOS EN EL MERCADO DE ARROZ DEL AZUAY, POR TIPO, 2018-2032 (MILES DE USD)
TABLA 641 SUPLEMENTOS DIETÉTICOS EN EL MERCADO DE ARROZ DEL AZUAY, POR FORMA DE PRODUCTO, 2018-2032 (MILES DE USD)
CUADRO 642 MERCADO DE ARROZ DEL AZUAY, POR CANAL DE DISTRIBUCIÓN, 2018-2032 (MILES DE USD)
CUADRO 643 MERCADO DE ARROZ DEL AZUAY, POR CANAL DE DISTRIBUCIÓN, 2018-2032 (TONELADAS)
CUADRO 644 MERCADO DE ARROZ DEL AZUAY, POR CANAL DE DISTRIBUCIÓN, 2018-2032 (USD/KG)
TABLA 645 AZUAY DESCONECTADO EN EL MERCADO DE ARROZ, POR TIPO, 2018-2032 (MILES DE USD)
TABLA 646 VENTAS AL POR MENOR EN EL MERCADO DE ARROZ DEL AZUAY, POR TIPO DE CANAL, 2018-2032 (MILES DE USD)
TABLA 647 MERCADO DE ARROZ EN LÍNEA DE AZUAY, POR TIPO, 2018-2032 (MILES DE USD)
CUADRO 648 MERCADO DE ARROZ EN BOLÍVAR, POR TIPO, 2018-2032 (MILES DE USD)
CUADRO 649 MERCADO DE ARROZ DE BOLÍVAR, POR TIPO, 2018-2032 (TONELADAS)
CUADRO 650 MERCADO DE ARROZ EN BOLÍVAR, POR TIPO, 2018-2032 (USD/KG)
TABLA 651 MERCADO DE ARROZ EN BOLÍVAR, POR COLOR DE ARROZ, 2018-2032 (MILES DE USD)
TABLA 652 MERCADO DE ARROZ EN BOLÍVAR, POR COLOR DE ARROZ, 2018-2032 (TONELADAS)
TABLA 653 MERCADO DE ARROZ EN BOLÍVAR, POR COLOR DE ARROZ, 2018-2032 (USD/KG)
CUADRO 654 MERCADO DE ARROZ DE BOLÍVAR, POR TAMAÑO DE GRANO, 2018-2032 (MILES DE USD)
CUADRO 655 MERCADO DE ARROZ DE BOLÍVAR, POR TAMAÑO DE GRANO, 2018-2032 (TONELADAS)
CUADRO 656 MERCADO DE ARROZ DE BOLÍVAR, POR TAMAÑO DE GRANO, 2018-2032 (USD/KG)
TABLA 657 MERCADO DEL ARROZ EN BOLÍVAR, POR NATURALEZA, 2018-2032 (MILES DE USD)
CUADRO 658 MERCADO DE ARROZ DE BOLÍVAR, POR NATURALEZA, 2018-2032 (TONELADAS)
CUADRO 659 MERCADO DE ARROZ DE BOLÍVAR, POR NATURALEZA, 2018-2032 (USD/KG)
CUADRO 660 MERCADO DE ARROZ EN BOLÍVAR, SEGÚN CONTENIDO DE ALMIDÓN, 2018-2032 (MILES DE USD)
CUADRO 661 MERCADO DE ARROZ DE BOLÍVAR, POR CONTENIDO DE ALMIDÓN, 2018-2032 (TONELADAS)
CUADRO 662 MERCADO DE ARROZ DE BOLÍVAR, POR CONTENIDO DE ALMIDÓN, 2018-2032 (USD/KG)
CUADRO 663 MERCADO DE ARROZ EN BOLÍVAR, SEGÚN FORMA DE PROCESAMIENTO, 2018-2032 (MILES DE USD)
CUADRO 664 MERCADO DE ARROZ DE BOLÍVAR, SEGÚN FORMA DE PROCESAMIENTO, 2018-2032 (TONELADAS)
CUADRO 665 MERCADO DE ARROZ DE BOLÍVAR, POR FORMA DE PROCESAMIENTO, 2018-2032 (USD/KG)
CUADRO 666 MERCADO DE ARROZ EN BOLÍVAR, SEGÚN GRADO DE MOLIENDA, 2018-2032 (MILES DE USD)
CUADRO 667 MERCADO DE ARROZ DE BOLÍVAR, SEGÚN GRADO DE MOLIENDA, 2018-2032 (TONELADAS)
CUADRO 668 MERCADO DE ARROZ DE BOLÍVAR, SEGÚN GRADO DE MOLIENDA, 2018-2032 (USD/KG)
TABLA 669 MERCADO DE ARROZ EN BOLÍVAR, POR PULIDO, 2018-2032 (MILES DE USD)
CUADRO 670 MERCADO DE ARROZ EN BOLÍVAR, POR PULIDO, 2018-2032 (TONELADAS)
CUADRO 671 MERCADO DE ARROZ EN BOLÍVAR, POR PULIDO, 2018-2032 (USD/KG)
CUADRO 672 MERCADO DE ARROZ EN BOLÍVAR, POR FORTIFICACIÓN, 2018-2032 (MILES DE USD)
CUADRO 673 MERCADO DE ARROZ DE BOLÍVAR, POR FORTIFICACIÓN, 2018-2032 (TONELADAS)
CUADRO 674 MERCADO DE ARROZ BOLÍVAR, POR FORTIFICACIÓN, 2018-2032 (USD/KG)
CUADRO 675 BOLÍVAR FORTIFICADO EN EL MERCADO DE ARROZ, POR PROCESO, 2018-2032 (MILES DE USD)
TABLA 676 MERCADO DEL ARROZ EN BOLÍVAR, POR AROMA, 2018-2032 (MILES DE USD)
TABLA 677 MERCADO DEL ARROZ DE BOLÍVAR, POR AROMA, 2018-2032 (TONELADAS)
TABLA 678 MERCADO DE ARROZ DE BOLÍVAR, POR AROMA, 2018-2032 (USD/KG)
TABLA 679 ARROZ AROMÁTICO EN BOLÍVAR EN EL MERCADO DE ARROZ, POR TIPO, 2018-2032 (MILES DE USD)
TABLA 680 MERCADO DE ARROZ EN BOLÍVAR, POR DERIVADOS DEL ARROZ, 2018-2032 (MILES DE USD)
CUADRO 681 MERCADO DE ARROZ EN BOLÍVAR, POR DERIVADOS DEL ARROZ, 2018-2032 (TONELADAS)
CUADRO 682 MERCADO DE ARROZ EN BOLÍVAR, POR DERIVADOS DEL ARROZ, 2018-2032 (USD/KG)
CUADRO 683 MERCADO DE ARROZ EN BOLÍVAR, POR USUARIO FINAL, 2018-2032 (MILES DE USD)
CUADRO 684 MERCADO DE ARROZ DE BOLÍVAR, POR USUARIO FINAL, 2018-2032 (TONELADAS)
CUADRO 685 MERCADO DE ARROZ EN BOLÍVAR, POR USUARIO FINAL, 2018-2032 (USD/KG)
TABLA 686 ALIMENTOS Y BEBIDAS EN BOLÍVAR EN EL MERCADO DEL ARROZ, POR TIPO, 2018-2032 (MILES DE USD)
TABLA 687 BOLÍVAR ALIMENTOS EN EL MERCADO DE ARROZ, POR TIPO, 2018-2032 (MILES DE USD)
TABLA 688 BOLÍVAR PANADERÍA EN EL MERCADO DE ARROZ, POR TIPO, 2018-2032 (MILES DE USD)
TABLA 689 BOLÍVAR ALIMENTOS PROCESADOS EN EL MERCADO DE ARROZ, POR TIPO, 2018-2032 (MILES DE USD)
TABLA 690 MERCADO DE CONFITERÍA EN ARROZ, POR TIPO, 2018-2032 (MILES DE USD)
TABLA 691 MERCADO DE ARROZ DE FÓRMULA INFANTIL EN BOLÍVAR, POR TIPO, 2018-2032 (MILES DE USD)
TABLA 692 PRODUCTOS LÁCTEOS DE BOLÍVAR EN EL MERCADO DE ARROZ, POR TIPO, 2018-2032 (MILES DE USD)
TABLA 693 BEBIDAS EN BOLÍVAR EN EL MERCADO DEL ARROZ, POR TIPO, 2018-2032 (MILES DE USD)
TABLA 694 BEBIDAS SALUDABLES DE BOLÍVAR EN EL MERCADO DEL ARROZ, POR TIPO, 2018-2032 (MILES DE USD)
TABLA 695 BOLÍVAR ALIMENTOS EN EL MERCADO DE ARROZ, POR CATEGORÍA, 2018-2032 (MILES DE USD)
TABLA 696 MERCADO DE AVES DE BOLÍVAR EN ARROZ, POR TIPO, 2018-2032 (MILES DE USD)
TABLA 697 BOLÍVAR RUMIANTES EN EL MERCADO DE ARROZ, POR TIPO, 2018-2032 (MILES DE USD)
TABLA 698 BOLÍVAR CERDO EN EL MERCADO DE ARROZ, POR TIPO, 2018-2032 (MILES DE USD)
TABLA 699 BOLÍVAR PET EN EL MERCADO DE ARROZ, POR TIPO, 2018-2032 (MILES DE USD)
TABLA 700 BOLÍVAR MERCADO DE ANIMALES ACUÁTICOS EN ARROZ, POR TIPO, 2018-2032 (MILES DE USD)
CUADRO 701 CRUSTÁCEOS DE BOLÍVAR EN EL MERCADO DE ARROZ, POR TIPO, 2018-2032 (MILES DE USD)
TABLA 702 BOLÍVAR PESCADO EN EL MERCADO DE ARROZ, POR TIPO, 2018-2032 (MILES DE USD)
TABLA 703 MOLUSCOS DE BOLÍVAR EN EL MERCADO DE ARROZ, POR TIPO, 2018-2032 (MILES DE USD)
CUADRO 704 MERCADO DE ALIMENTOS EN ARROZ EN BOLÍVAR, POR FUNCIÓN SANITARIA, 2018-2032 (MILES DE USD)
TABLA 705 PRODUCTOS FARMACÉUTICOS EN BOLÍVAR EN EL MERCADO DEL ARROZ, POR APLICACIÓN, 2018-2032 (MILES DE USD)
TABLA 706 BOLÍVAR INFECCIONES UROGENTALES EN EL MERCADO DE ARROZ, POR TIPO, 2018-2032 (MILES DE USD)
TABLA 707 PRODUCTOS FARMACÉUTICOS EN BOLÍVAR EN EL MERCADO DE ARROZ, POR FORMA DE PRODUCTO, 2018-2032 (MILES DE USD)
TABLA 708 MERCADO DE COSMÉTICOS Y CUIDADO PERSONAL EN ARROZ, POR CATEGORÍA, 2018-2032 (MILES DE USD)
TABLA 709 PRODUCTOS DE CUIDADO FACIAL EN EL MERCADO DE ARROZ, POR TIPO, 2018-2032 (MILES DE USD)
TABLA 710 PRODUCTOS PARA EL CUIDADO DEL CABELLO EN EL MERCADO DE ARROZ, POR TIPO, 2018-2032 (MILES DE USD)
TABLA 711 SUPLEMENTOS DIETÉTICOS EN BOLÍVAR EN EL MERCADO DE ARROZ, POR TIPO, 2018-2032 (MILES DE USD)
TABLA 712 SUPLEMENTOS DIETÉTICOS EN BOLÍVAR EN EL MERCADO DE ARROZ, POR FORMA DE PRODUCTO, 2018-2032 (MILES DE USD)
CUADRO 713 MERCADO DE ARROZ DE BOLÍVAR, POR CANAL DE DISTRIBUCIÓN, 2018-2032 (MILES DE USD)
CUADRO 714 MERCADO DE ARROZ DE BOLÍVAR, POR CANAL DE DISTRIBUCIÓN, 2018-2032 (TONELADAS)
CUADRO 715 MERCADO DE ARROZ DE BOLÍVAR, POR CANAL DE DISTRIBUCIÓN, 2018-2032 (USD/KG)
TABLA 716 BOLÍVAR FUERA DE LÍNEA EN EL MERCADO DE ARROZ, POR TIPO, 2018-2032 (MILES DE USD)
TABLA 717 VENTAS AL POR MENOR EN BOLÍVAR EN EL MERCADO DE ARROZ, POR TIPO DE CANAL, 2018-2032 (MILES DE USD)
TABLA 718 BOLÍVAR EN LÍNEA EN EL MERCADO DEL ARROZ, POR TIPO, 2018-2032 (MILES DE USD)
CUADRO 719 MERCADO DE ARROZ DE CARCHI, POR TIPO, 2018-2032 (MILES DE USD)
CUADRO 720 MERCADO DE ARROZ DE CARCHI, POR TIPO, 2018-2032 (TONELADAS)
CUADRO 721 MERCADO DE ARROZ CARCHI, POR TIPO, 2018-2032 (USD/KG)
TABLA 722 MERCADO DE ARROZ DE CARCHI, POR COLOR DE ARROZ, 2018-2032 (MILES DE USD)
TABLA 723 MERCADO DE ARROZ DE CARCHI, POR COLOR DE ARROZ, 2018-2032 (TONELADAS)
TABLA 724 MERCADO DE ARROZ CARCHI, POR COLOR DE ARROZ, 2018-2032 (USD/KG)
TABLA 725 MERCADO DE ARROZ CARCHI, POR TAMAÑO DE GRANO, 2018-2032 (MILES DE USD)
CUADRO 726 MERCADO DE ARROZ CARCHI, POR TAMAÑO DE GRANO, 2018-2032 (TONELADAS)
TABLA 727 MERCADO DE ARROZ CARCHI, POR TAMAÑO DE GRANO, 2018-2032 (USD/KG)
TABLA 728 MERCADO DEL ARROZ DE CARCHI, POR NATURALEZA, 2018-2032 (MILES DE USD)
CUADRO 729 MERCADO DE ARROZ DE CARCHI, POR NATURALEZA, 2018-2032 (TONELADAS)
CUADRO 730 MERCADO DEL ARROZ CARCHI, POR NATURALEZA, 2018-2032 (USD/KG)
CUADRO 731 MERCADO DE ARROZ CARCHI, POR CONTENIDO DE ALMIDÓN, 2018-2032 (MILES DE USD)
CUADRO 732 MERCADO DE ARROZ CARCHI, POR CONTENIDO DE ALMIDÓN, 2018-2032 (TONELADAS)
CUADRO 733 MERCADO DE ARROZ CARCHI, POR CONTENIDO DE ALMIDÓN, 2018-2032 (USD/KG)
CUADRO 734 MERCADO DE ARROZ DE CARCHI, POR FORMA DE PROCESAMIENTO, 2018-2032 (MILES DE USD)
CUADRO 735 MERCADO DE ARROZ DE CARCHI, POR FORMA DE PROCESAMIENTO, 2018-2032 (TONELADAS)
CUADRO 736 MERCADO DE ARROZ CARCHI, POR FORMA DE PROCESAMIENTO, 2018-2032 (USD/KG)
CUADRO 737 MERCADO DE ARROZ DE CARCHI, SEGÚN GRADO DE MOLIENDA, 2018-2032 (MILES DE USD)
CUADRO 738 MERCADO DE ARROZ DE CARCHI, POR GRADO DE MOLIENDA, 2018-2032 (TONELADAS)
CUADRO 739 MERCADO DE ARROZ CARCHI, POR GRADO DE MOLIENDA, 2018-2032 (USD/KG)
TABLA 740 MERCADO DE ARROZ CARCHI, POR PULIDO, 2018-2032 (MILES DE USD)
TABLA 741 MERCADO DE ARROZ CARCHI, POR PULIDO, 2018-2032 (TONELADAS)
CUADRO 742 MERCADO DE ARROZ CARCHI, POR PULIDO, 2018-2032 (USD/KG)
CUADRO 743 MERCADO DE ARROZ CARCHI, POR FORTIFICACIÓN, 2018-2032 (MILES DE USD)
CUADRO 744 MERCADO DE ARROZ DE CARCHI, POR FORTIFICACIÓN, 2018-2032 (TONELADAS)
CUADRO 745 MERCADO DEL ARROZ CARCHI, POR FORTIFICACIÓN, 2018-2032 (USD/KG)
CUADRO 746 MERCADO DE ARROZ FORTIFICADO DE CARCHI, POR PROCESO, 2018-2032 (MILES DE USD)
TABLA 747 MERCADO DEL ARROZ CARCHI, POR AROMA, 2018-2032 (MILES DE USD)
TABLA 748 MERCADO DEL ARROZ DE CARCHI, POR AROMA, 2018-2032 (TONELADAS)
TABLA 749 MERCADO DEL ARROZ CARCHI, POR AROMA, 2018-2032 (USD/KG)
TABLA 750 ARROZ AROMÁTICO CARCHI EN EL MERCADO DEL ARROZ, POR TIPO, 2018-2032 (MILES DE USD)
CUADRO 751 MERCADO DE ARROZ DE CARCHI, POR DERIVADOS DEL ARROZ, 2018-2032 (MILES DE USD)
CUADRO 752 MERCADO DE ARROZ DE CARCHI, POR DERIVADOS DEL ARROZ, 2018-2032 (TONELADAS)
CUADRO 753 MERCADO DE ARROZ DE CARCHI, POR DERIVADOS DEL ARROZ, 2018-2032 (USD/KG)
CUADRO 754 MERCADO DE ARROZ DE CARCHI, POR USUARIO FINAL, 2018-2032 (MILES DE USD)
CUADRO 755 MERCADO DE ARROZ DE CARCHI, POR USUARIO FINAL, 2018-2032 (TONELADAS)
CUADRO 756 MERCADO DE ARROZ CARCHI, POR USUARIO FINAL, 2018-2032 (USD/KG)
TABLA 757 ALIMENTOS Y BEBIDAS DE CARCHI EN EL MERCADO DE ARROZ, POR TIPO, 2018-2032 (MILES DE USD)
TABLA 758 CARCHI EN EL MERCADO DE ARROZ, POR TIPO, 2018-2032 (MILES DE USD)
TABLA 759 PANADERÍA CARCHI EN EL MERCADO DEL ARROZ, POR TIPO, 2018-2032 (MILES DE USD)
TABLA 760 CARCHI ALIMENTOS PROCESADOS EN EL MERCADO DE ARROZ, POR TIPO, 2018-2032 (MILES DE USD)
TABLA 761 CONFITERÍA DE CARCHI EN EL MERCADO DE ARROZ, POR TIPO, 2018-2032 (MILES DE USD)
CUADRO 762 FÓRMULA INFANTIL CARCHI EN EL MERCADO DE ARROZ, POR TIPO, 2018-2032 (MILES DE USD)
TABLA 763 PRODUCTOS LÁCTEOS DE CARCHI EN EL MERCADO DE ARROZ, POR TIPO, 2018-2032 (MILES DE USD)
TABLA 764 BEBIDAS DE CARCHI EN EL MERCADO DE ARROZ, POR TIPO, 2018-2032 (MILES DE USD)
TABLA 765 BEBIDAS SALUDABLES DE CARCHI EN EL MERCADO DE ARROZ, POR TIPO, 2018-2032 (MILES DE USD)
TABLA 766 ALIMENTO DE CARCHI EN EL MERCADO DE ARROZ, POR CATEGORÍA, 2018-2032 (MILES DE USD)
TABLA 767 CARCHI EN EL MERCADO DE ARROZ, POR TIPO, 2018-2032 (MILES DE USD)
TABLA 768 CARCHI RUMIANTES EN EL MERCADO DE ARROZ, POR TIPO, 2018-2032 (MILES DE USD)
TABLA 769 CARCHI PORCINO EN EL MERCADO DE ARROZ, POR TIPO, 2018-2032 (MILES DE USD)
TABLA 770 CARCHI PET EN EL MERCADO DE ARROZ, POR TIPO, 2018-2032 (MILES DE USD)
TABLA 771 CARCHI ANIMAL ACUÁTICO EN EL MERCADO DE ARROZ, POR TIPO, 2018-2032 (MILES DE USD)
TABLA 772 CRUSTÁCEOS CARCHI EN EL MERCADO DE ARROZ, POR TIPO, 2018-2032 (MILES DE USD)
TABLA 773 CARCHI EN EL MERCADO DE ARROZ, POR TIPO, 2018-2032 (MILES DE USD)
TABLA 774 MOLUSCOS CARCHI EN EL MERCADO DE ARROZ, POR TIPO, 2018-2032 (MILES DE USD)
TABLA 775 ALIMENTO DE CARCHI EN EL MERCADO DE ARROZ, POR FUNCIÓN SANITARIA, 2018-2032 (MILES DE USD)
TABLA 776 PRODUCTOS FARMACÉUTICOS DE CARCHI EN EL MERCADO DEL ARROZ, POR APLICACIÓN, 2018-2032 (MILES DE USD)
TABLA 777 INFECCIONES UROGENITALES POR CARCHI EN EL MERCADO DE ARROZ, POR TIPO, 2018-2032 (MILES DE USD)
TABLA 778 PRODUCTOS FARMACÉUTICOS DE CARCHI EN EL MERCADO DE ARROZ, POR FORMA DE PRODUCTO, 2018-2032 (MILES DE USD)
TABLA 779 COSMÉTICOS Y CUIDADO PERSONAL EN EL MERCADO DE ARROZ DE CARCHI, POR CATEGORÍA, 2018-2032 (MILES DE USD)
TABLA 780 PRODUCTOS DE CUIDADO FACIAL DE CARCHI EN EL MERCADO DEL ARROZ, POR TIPO, 2018-2032 (MILES DE USD)
TABLA 781 PRODUCTOS PARA EL CUIDADO DEL CABELLO EN EL MERCADO DE ARROZ DE CARCHI, POR TIPO, 2018-2032 (MILES DE USD)
TABLA 782 SUPLEMENTOS DIETÉTICOS DE CARCHI EN EL MERCADO DE ARROZ, POR TIPO, 2018-2032 (MILES DE USD)
TABLA 783 SUPLEMENTOS DIETÉTICOS DE CARCHI EN EL MERCADO DE ARROZ, POR FORMA DE PRODUCTO, 2018-2032 (MILES DE USD)
CUADRO 784 MERCADO DE ARROZ DE CARCHI, POR CANAL DE DISTRIBUCIÓN, 2018-2032 (MILES DE USD)
CUADRO 785 MERCADO DE ARROZ DE CARCHI, POR CANAL DE DISTRIBUCIÓN, 2018-2032 (TONELADAS)
CUADRO 786 MERCADO DE ARROZ DE CARCHI, POR CANAL DE DISTRIBUCIÓN, 2018-2032 (USD/KG)
TABLA 787 CARCHI FUERA DE LÍNEA EN EL MERCADO DE ARROZ, POR TIPO, 2018-2032 (MILES DE USD)
TABLA 788 VENTAS AL POR MENOR DE CARCHI EN EL MERCADO DE ARROZ, POR TIPO DE CANAL, 2018-2032 (MILES DE USD)
TABLA 789 CARCHI EN LÍNEA EN EL MERCADO DE ARROZ, POR TIPO, 2018-2032 (MILES DE USD)
CUADRO 790 MERCADO DE ARROZ DE CHIMBORAZO, POR TIPO, 2018-2032 (MILES DE USD)
CUADRO 791 MERCADO DE ARROZ DE CHIMBORAZO, POR TIPO, 2018-2032 (TONELADAS)
CUADRO 792 MERCADO DE ARROZ DE CHIMBORAZO, POR TIPO, 2018-2032 (USD/KG)
TABLA 793 MERCADO DE ARROZ DE CHIMBORAZO, POR COLOR DE ARROZ, 2018-2032 (MILES DE USD)
TABLA 794 MERCADO DE ARROZ DE CHIMBORAZO, POR COLOR DE ARROZ, 2018-2032 (TONELADAS)
TABLA 795 MERCADO DE ARROZ DE CHIMBORAZO, POR COLOR DE ARROZ, 2018-2032 (USD/KG)
TABLA 796 MERCADO DE ARROZ DE CHIMBORAZO, POR TAMAÑO DE GRANO, 2018-2032 (MILES DE USD)
CUADRO 797 MERCADO DE ARROZ DE CHIMBORAZO, POR TAMAÑO DE GRANO, 2018-2032 (TONELADAS)
CUADRO 798 MERCADO DE ARROZ CHIMBORAZO, POR TAMAÑO DE GRANO, 2018-2032 (USD/KG)
TABLA 799 MERCADO DE ARROZ DE CHIMBORAZO, POR NATURALEZA, 2018-2032 (MILES DE USD)
CUADRO 800 MERCADO DEL ARROZ DE CHIMBORAZO, POR NATURALEZA, 2018-2032 (TONELADAS)
TABLA 801 MERCADO DEL ARROZ DE CHIMBORAZO, POR NATURALEZA, 2018-2032 (USD/KG)
CUADRO 802 MERCADO DE ARROZ DE CHIMBORAZO, POR CONTENIDO DE ALMIDÓN, 2018-2032 (MILES DE USD)
CUADRO 803 MERCADO DE ARROZ DE CHIMBORAZO, POR CONTENIDO DE ALMIDÓN, 2018-2032 (TONELADAS)
CUADRO 804 MERCADO DE ARROZ DE CHIMBORAZO, POR CONTENIDO DE ALMIDÓN, 2018-2032 (USD/KG)
CUADRO 805 MERCADO DE ARROZ DE CHIMBORAZO, SEGÚN FORMA DE PROCESAMIENTO, 2018-2032 (MILES DE USD)
TABLA 806 MERCADO DE ARROZ DE CHIMBORAZO, POR FORMA DE PROCESAMIENTO, 2018-2032 (TONELADAS)
CUADRO 807 MERCADO DE ARROZ DE CHIMBORAZO, POR FORMA DE PROCESAMIENTO, 2018-2032 (USD/KG)
CUADRO 808 MERCADO DE ARROZ DE CHIMBORAZO, SEGÚN GRADO DE MOLIENDA, 2018-2032 (MILES DE USD)
CUADRO 809 MERCADO DE ARROZ DE CHIMBORAZO, SEGÚN GRADO DE MOLIENDA, 2018-2032 (TONELADAS)
CUADRO 810 MERCADO DE ARROZ DE CHIMBORAZO, SEGÚN GRADO DE MOLIENDA, 2018-2032 (USD/KG)
TABLA 811 MERCADO DE ARROZ DE CHIMBORAZO, POR PULIDO, 2018-2032 (MILES DE USD)
TABLA 812 MERCADO DE ARROZ DE CHIMBORAZO, POR PULIDO, 2018-2032 (TONELADAS)
CUADRO 813 MERCADO DE ARROZ CHIMBORAZO, POR PULIDO, 2018-2032 (USD/KG)
CUADRO 814 MERCADO DE ARROZ CHIMBORAZO, POR FORTIFICACIÓN, 2018-2032 (MILES DE USD)
CUADRO 815 MERCADO DE ARROZ DE CHIMBORAZO, POR FORTIFICACIÓN, 2018-2032 (TONELADAS)
CUADRO 816 MERCADO DE ARROZ CHIMBORAZO, POR FORTIFICACIÓN, 2018-2032 (USD/KG)
CUADRO 817 MERCADO DE ARROZ CHIMBORAZO FORTIFICADO, POR PROCESO, 2018-2032 (MILES DE USD)
TABLA 818 MERCADO DEL ARROZ DE CHIMBORAZO, POR AROMA, 2018-2032 (MILES DE USD)
TABLA 819 MERCADO DE ARROZ DE CHIMBORAZO, POR AROMA, 2018-2032 (TONELADAS)
TABLA 820 MERCADO DEL ARROZ DE CHIMBORAZO, POR AROMA, 2018-2032 (USD/KG)
TABLA 821 ARROZ AROMÁTICO CHIMBORAZO EN EL MERCADO DE ARROZ, POR TIPO, 2018-2032 (MILES DE USD)
CUADRO 822 MERCADO DE ARROZ DE CHIMBORAZO, POR DERIVADOS DEL ARROZ, 2018-2032 (MILES DE USD)
CUADRO 823 MERCADO DE ARROZ DE CHIMBORAZO, POR DERIVADOS DEL ARROZ, 2018-2032 (TONELADAS)
CUADRO 824 MERCADO DE ARROZ DE CHIMBORAZO, POR DERIVADOS DEL ARROZ, 2018-2032 (USD/KG)
CUADRO 825 MERCADO DE ARROZ DE CHIMBORAZO, POR USUARIO FINAL, 2018-2032 (MILES DE USD)
CUADRO 826 MERCADO DE ARROZ DE CHIMBORAZO, POR USUARIO FINAL, 2018-2032 (TONELADAS)
CUADRO 827 MERCADO DE ARROZ DE CHIMBORAZO, POR USUARIO FINAL, 2018-2032 (USD/KG)
TABLA 828 MERCADO DE ALIMENTOS Y BEBIDAS EN ARROZ DE CHIMBORAZO, POR TIPO, 2018-2032 (MILES DE USD)
TABLA 829 ALIMENTOS EN EL MERCADO DE ARROZ DE CHIMBORAZO, POR TIPO, 2018-2032 (MILES DE USD)
TABLA 830 PANADERÍA DE CHIMBORAZO EN EL MERCADO DEL ARROZ, POR TIPO, 2018-2032 (MILES DE USD)
TABLA 831 MERCADO DE ARROZ PROCESADO DE CHIMBORAZO, POR TIPO, 2018-2032 (MILES DE USD)
TABLA 832 MERCADO DE CONFITERÍA DE CHIMBORAZO EN ARROZ, POR TIPO, 2018-2032 (MILES DE USD)
CUADRO 833 MERCADO DE ARROZ DE FÓRMULA INFANTIL DE CHIMBORAZO, POR TIPO, 2018-2032 (MILES DE USD)
TABLA 834 PRODUCTOS LÁCTEOS DE CHIMBORAZO EN EL MERCADO DE ARROZ, POR TIPO, 2018-2032 (MILES DE USD)
TABLA 835 BEBIDAS DE CHIMBORAZO EN EL MERCADO DE ARROZ, POR TIPO, 2018-2032 (MILES DE USD)
TABLA 836 BEBIDAS SALUDABLES DE CHIMBORAZO EN EL MERCADO DE ARROZ, POR TIPO, 2018-2032 (MILES DE USD)
TABLA 837 MERCADO DE ARROZ CHIMBORAZO, POR CATEGORÍA, 2018-2032 (MILES DE USD)
TABLA 838 AVES DE CHIMBORAZO EN EL MERCADO DE ARROZ, POR TIPO, 2018-2032 (MILES DE USD)
TABLA 839 RUMIANTES DE CHIMBORAZO EN EL MERCADO DE ARROZ, POR TIPO, 2018-2032 (MILES DE USD)
TABLA 840 MERCADO DE ARROZ PORCINO CHIMBORAZO, POR TIPO, 2018-2032 (MILES DE USD)
TABLA 841 PET DE CHIMBORAZO EN EL MERCADO DE ARROZ, POR TIPO, 2018-2032 (MILES DE USD)
TABLA 842 MERCADO DE ARROZ DE ANIMALES ACUÁTICOS DE CHIMBORAZO, POR TIPO, 2018-2032 (MILES DE USD)
TABLA 843 CRUSTÁCEOS DE CHIMBORAZO EN EL MERCADO DE ARROZ, POR TIPO, 2018-2032 (MILES DE USD)
TABLA 844 PESCADO DE CHIMBORAZO EN EL MERCADO DE ARROZ, POR TIPO, 2018-2032 (MILES DE USD)
TABLA 845 MOLUSCOS DE CHIMBORAZO EN EL MERCADO DE ARROZ, POR TIPO, 2018-2032 (MILES DE USD)
TABLA 846 MERCADO DE ALIMENTOS DE ARROZ DE CHIMBORAZO, POR FUNCIÓN SANITARIA, 2018-2032 (MILES DE USD)
TABLA 847 PRODUCTOS FARMACÉUTICOS DE CHIMBORAZO EN EL MERCADO DEL ARROZ, POR APLICACIÓN, 2018-2032 (MILES DE USD)
TABLA 848 INFECCIONES UROGENITALES DE CHIMBORAZO EN EL MERCADO DE ARROZ, POR TIPO, 2018-2032 (MILES DE USD)
TABLA 849 PRODUCTOS FARMACÉUTICOS DE CHIMBORAZO EN EL MERCADO DE ARROZ, POR FORMA DE PRODUCTO, 2018-2032 (MILES DE USD)
TABLA 850 MERCADO DE COSMÉTICOS Y CUIDADO PERSONAL EN ARROZ DE CHIMBORAZO, POR CATEGORÍA, 2018-2032 (MILES DE USD)
TABLA 851 PRODUCTOS DE CUIDADO FACIAL DE CHIMBORAZO EN EL MERCADO DE ARROZ, POR TIPO, 2018-2032 (MILES DE USD)
TABLA 852 PRODUCTOS PARA EL CUIDADO DEL CABELLO EN EL MERCADO DE ARROZ DE CHIMBORAZO, POR TIPO, 2018-2032 (MILES DE USD)
TABLA 853 SUPLEMENTOS DIETÉTICOS DE CHIMBORAZO EN EL MERCADO DE ARROZ, POR TIPO, 2018-2032 (MILES DE USD)
TABLA 854 SUPLEMENTOS DIETÉTICOS DE CHIMBORAZO EN EL MERCADO DE ARROZ, POR FORMA DE PRODUCTO, 2018-2032 (MILES DE USD)
TABLA 855 MERCADO DE ARROZ DE CHIMBORAZO, POR CANAL DE DISTRIBUCIÓN, 2018-2032 (MILES DE USD)
TABLA 856 MERCADO DE ARROZ DE CHIMBORAZO, POR CANAL DE DISTRIBUCIÓN, 2018-2032 (TONELADAS)
TABLA 857 MERCADO DE ARROZ DE CHIMBORAZO, POR CANAL DE DISTRIBUCIÓN, 2018-2032 (USD/KG)
TABLA 858 CHIMBORAZO FUERA DE LÍNEA EN EL MERCADO DE ARROZ, POR TIPO, 2018-2032 (MILES DE USD)
TABLA 859 VENTAS AL POR MENOR EN EL MERCADO DE ARROZ DE CHIMBORAZO, POR TIPO DE CANAL, 2018-2032 (MILES DE USD)
TABLA 860 MERCADO DE ARROZ EN LÍNEA DE CHIMBORAZO, POR TIPO, 2018-2032 (MILES DE USD)
CUADRO 861 MERCADO DE ARROZ DE COTOPAXI, POR TIPO, 2018-2032 (MILES DE USD)
CUADRO 862 MERCADO DE ARROZ DE COTOPAXI, POR TIPO, 2018-2032 (TONELADAS)
CUADRO 863 MERCADO DE ARROZ DE COTOPAXI, POR TIPO, 2018-2032 (USD/KG)
TABLA 864 MERCADO DE ARROZ DE COTOPAXI, POR COLOR DE ARROZ, 2018-2032 (MILES DE USD)
TABLA 865 MERCADO DE ARROZ DE COTOPAXI, POR COLOR DE ARROZ, 2018-2032 (TONELADAS)
TABLA 866 MERCADO DE ARROZ DE COTOPAXI, POR COLOR DE ARROZ, 2018-2032 (USD/KG)
TABLA 867 MERCADO DE ARROZ DE COTOPAXI, POR TAMAÑO DE GRANO, 2018-2032 (MILES DE USD)
CUADRO 868 MERCADO DE ARROZ COTOPAXI, POR TAMAÑO DE GRANO, 2018-2032 (TONELADAS)
CUADRO 869 MERCADO DE ARROZ COTOPAXI, POR TAMAÑO DE GRANO, 2018-2032 (USD/KG)
CUADRO 870 MERCADO DE ARROZ DE COTOPAXI, POR NATURALEZA, 2018-2032 (MILES DE USD)
CUADRO 871 MERCADO DE ARROZ DE COTOPAXI, POR NATURALEZA, 2018-2032 (TONELADAS)
CUADRO 872 MERCADO DE ARROZ DE COTOPAXI, POR NATURALEZA, 2018-2032 (USD/KG)
CUADRO 873 MERCADO DE ARROZ DE COTOPAXI, POR CONTENIDO DE ALMIDÓN, 2018-2032 (MILES DE USD)
CUADRO 874 MERCADO DE ARROZ DE COTOPAXI, POR CONTENIDO DE ALMIDÓN, 2018-2032 (TONELADAS)
CUADRO 875 MERCADO DE ARROZ COTOPAXI, POR CONTENIDO DE ALMIDÓN, 2018-2032 (USD/KG)
CUADRO 876 MERCADO DE ARROZ DE COTOPAXI, POR FORMA DE PROCESAMIENTO, 2018-2032 (MILES DE USD)
CUADRO 877 MERCADO DE ARROZ DE COTOPAXI, POR FORMA DE PROCESAMIENTO, 2018-2032 (TONELADAS)
CUADRO 878 MERCADO DE ARROZ DE COTOPAXI, POR FORMA DE PROCESAMIENTO, 2018-2032 (USD/KG)
CUADRO 879 MERCADO DE ARROZ DE COTOPAXI, SEGÚN GRADO DE MOLIENDA, 2018-2032 (MILES DE USD)
CUADRO 880 MERCADO DE ARROZ DE COTOPAXI, SEGÚN GRADO DE MOLIENDA, 2018-2032 (TONELADAS)
CUADRO 881 MERCADO DE ARROZ DE COTOPAXI, SEGÚN GRADO DE MOLIENDA, 2018-2032 (USD/KG)
TABLA 882 MERCADO DE ARROZ DE COTOPAXI, POR PULIDO, 2018-2032 (MILES DE USD)
CUADRO 883 MERCADO DE ARROZ COTOPAXI, POR PULIDO, 2018-2032 (TONELADAS)
TABLA 884 MERCADO DE ARROZ COTOPAXI, POR PULIDO, 2018-2032 (USD/KG)
CUADRO 885 MERCADO DE ARROZ COTOPAXI, POR FORTIFICACIÓN, 2018-2032 (MILES DE USD)
CUADRO 886 MERCADO DE ARROZ COTOPAXI, POR FORTIFICACIÓN, 2018-2032 (TONELADAS)
CUADRO 887 MERCADO DEL ARROZ COTOPAXI, POR FORTIFICACIÓN, 2018-2032 (USD/KG)
CUADRO 888 MERCADO DE ARROZ FORTIFICADO CON COTOPAXI, POR PROCESO, 2018-2032 (MILES DE USD)
TABLA 889 MERCADO DEL ARROZ DE COTOPAXI, POR AROMA, 2018-2032 (MILES DE USD)
CUADRO 890 MERCADO DEL ARROZ DE COTOPAXI, POR AROMA, 2018-2032 (TONELADAS)
TABLA 891 MERCADO DE ARROZ COTOPAXI, POR AROMA, 2018-2032 (USD/KG)
TABLA 892 ARROZ AROMÁTICO COTOPAXI EN EL MERCADO DE ARROZ, POR TIPO, 2018-2032 (MILES DE USD)
CUADRO 893 MERCADO DE ARROZ DE COTOPAXI, POR DERIVADOS DEL ARROZ, 2018-2032 (MILES DE USD)
CUADRO 894 MERCADO DE ARROZ DE COTOPAXI, POR DERIVADOS DEL ARROZ, 2018-2032 (TONELADAS)
CUADRO 895 MERCADO DE ARROZ DE COTOPAXI, POR DERIVADOS DEL ARROZ, 2018-2032 (USD/KG)
CUADRO 896 MERCADO DE ARROZ DE COTOPAXI, POR USUARIO FINAL, 2018-2032 (MILES DE USD)
CUADRO 897 MERCADO DE ARROZ DE COTOPAXI, POR USUARIO FINAL, 2018-2032 (TONELADAS)
CUADRO 898 MERCADO DE ARROZ DE COTOPAXI, POR USUARIO FINAL, 2018-2032 (USD/KG)
TABLA 899 MERCADO DE ALIMENTOS Y BEBIDAS DEL ARROZ DE COTOPAXI, POR TIPO, 2018-2032 (MILES DE USD)
TABLA 900 MERCADO DE ARROZ EN COTOPAXI, POR TIPO, 2018-2032 (MILES DE USD)
TABLA 901 MERCADO DE ARROZ EN LA PANADERIA DE COTOPAXI, POR TIPO, 2018-2032 (MILES DE USD)
TABLA 902 MERCADO DE ALIMENTOS PROCESADOS EN ARROZ DE COTOPAXI, POR TIPO, 2018-2032 (MILES DE USD)
TABLA 903 MERCADO DE CONFITERÍA DE COTOPAXI EN ARROZ, POR TIPO, 2018-2032 (MILES DE USD)
CUADRO 904 MERCADO DE ARROZ CON FÓRMULA INFANTIL COTOPAXI, POR TIPO, 2018-2032 (MILES DE USD)
TABLA 905 PRODUCTOS LÁCTEOS DE COTOPAXI EN EL MERCADO DE ARROZ, POR TIPO, 2018-2032 (MILES DE USD)
TABLA 906 BEBIDAS DE COTOPAXI EN EL MERCADO DE ARROZ, POR TIPO, 2018-2032 (MILES DE USD)
TABLA 907 BEBIDAS SALUDABLES COTOPAXI EN EL MERCADO DE ARROZ, POR TIPO, 2018-2032 (MILES DE USD)
CUADRO 908 MERCADO DE ARROZ ALIMENTARIO COTOPAXI, POR CATEGORÍA, 2018-2032 (MILES DE USD)
TABLA 909 MERCADO DE AVES DE CORRAL EN ARROZ DE COTOPAXI, POR TIPO, 2018-2032 (MILES DE USD)
CUADRO 910 RUMIANTES COTOPAXI EN EL MERCADO DE ARROZ, POR TIPO, 2018-2032 (MILES DE USD)
TABLA 911 MERCADO DE ARROZ PORCINO COTOPAXI, POR TIPO, 2018-2032 (MILES DE USD)
TABLA 912 COTOPAXI PET EN EL MERCADO DE ARROZ, POR TIPO, 2018-2032 (MILES DE USD)
TABLA 913 COTOPAXI ANIMAL ACUÁTICO EN EL MERCADO DE ARROZ, POR TIPO, 2018-2032 (MILES DE USD)
TABLA 914 CRUSTÁCEOS COTOPAXI EN EL MERCADO DE ARROZ, POR TIPO, 2018-2032 (MILES DE USD)
TABLA 915 PESCADO DEL COTOPAXI EN EL MERCADO DE ARROZ, POR TIPO, 2018-2032 (MILES DE USD)
TABLA 916 MOLUSCOS COTOPAXI EN EL MERCADO DE ARROZ, POR TIPO, 2018-2032 (MILES DE USD)
CUADRO 917 MERCADO DE ALIMENTOS DE COTOPAXI EN ARROZ, POR FUNCIÓN SANITARIA, 2018-2032 (MILES DE USD)
TABLA 918 PRODUCTOS FARMACÉUTICOS COTOPAXI EN EL MERCADO DEL ARROZ, POR APLICACIÓN, 2018-2032 (MILES DE USD)
CUADRO 919 INFECCIONES UROGENTALES POR COTOPAXI EN EL MERCADO DE ARROZ, POR TIPO, 2018-2032 (MILES DE USD)
TABLA 920 PRODUCTOS FARMACÉUTICOS DE COTOPAXI EN EL MERCADO DE ARROZ, POR FORMA DE PRODUCTO, 2018-2032 (MILES DE USD)
TABLA 921 COTOPAXI MERCADO DE COSMÉTICOS Y CUIDADO PERSONAL EN ARROZ, POR CATEGORÍA, 2018-2032 (MILES DE USD)
TABLA 922 PRODUCTOS DE CUIDADO FACIAL DE COTOPAXI EN EL MERCADO DE ARROZ, POR TIPO, 2018-2032 (MILES DE USD)
TABLA 923 PRODUCTOS PARA EL CUIDADO DEL CABELLO DE COTOPAXI EN EL MERCADO DEL ARROZ, POR TIPO, 2018-2032 (MILES DE USD)
TABLA 924 SUPLEMENTOS DIETÉTICOS DE COTOPAXI EN EL MERCADO DE ARROZ, POR TIPO, 2018-2032 (MILES DE USD)
TABLA 925 SUPLEMENTOS DIETÉTICOS DE COTOPAXI EN EL MERCADO DE ARROZ, POR FORMA DE PRODUCTO, 2018-2032 (MILES DE USD)
CUADRO 926 MERCADO DE ARROZ DE COTOPAXI, POR CANAL DE DISTRIBUCIÓN, 2018-2032 (MILES DE USD)
CUADRO 927 MERCADO DE ARROZ DE COTOPAXI, POR CANAL DE DISTRIBUCIÓN, 2018-2032 (TONELADAS)
CUADRO 928 MERCADO DE ARROZ DE COTOPAXI, POR CANAL DE DISTRIBUCIÓN, 2018-2032 (USD/KG)
TABLA 929 COTOPAXI FUERA DE LÍNEA EN EL MERCADO DE ARROZ, POR TIPO, 2018-2032 (MILES DE USD)
TABLA 930 VENTAS AL POR MENOR EN EL MERCADO DE ARROZ DE COTOPAXI, POR TIPO DE CANAL, 2018-2032 (MILES DE USD)
TABLA 931 COTOPAXI EN LÍNEA EN EL MERCADO DE ARROZ, POR TIPO, 2018-2032 (MILES DE USD)
TABLA 932 MERCADO DE ARROZ DE GALÁPAGOS, POR TIPO, 2018-2032 (MILES DE USD)
TABLA 933 MERCADO DE ARROZ DE GALÁPAGOS, POR TIPO, 2018-2032 (TONELADAS)
TABLA 934 MERCADO DE ARROZ DE GALÁPAGOS, POR TIPO, 2018-2032 (USD/KG)
TABLA 935 MERCADO DE ARROZ DE GALÁPAGOS, POR COLOR DE ARROZ, 2018-2032 (MILES DE USD)
TABLA 936 MERCADO DE ARROZ DE GALÁPAGOS, POR COLOR DEL ARROZ, 2018-2032 (TONELADAS)
TABLA 937 MERCADO DE ARROZ DE GALÁPAGOS, POR COLOR DE ARROZ, 2018-2032 (USD/KG)
TABLA 938 MERCADO DE ARROZ DE GALÁPAGOS, POR TAMAÑO DE GRANO, 2018-2032 (MILES DE USD)
TABLA 939 MERCADO DE ARROZ DE GALÁPAGOS, POR TAMAÑO DE GRANO, 2018-2032 (TONELADAS)
TABLA 940 MERCADO DE ARROZ DE GALÁPAGOS, POR TAMAÑO DE GRANO, 2018-2032 (USD/KG)
TABLA 941 MERCADO DE ARROZ DE GALÁPAGOS, POR NATURALEZA, 2018-2032 (MILES DE USD)
TABLA 942 MERCADO DE ARROZ DE GALÁPAGOS, POR NATURALEZA, 2018-2032 (TONELADAS)
TABLA 943 MERCADO DE ARROZ DE GALÁPAGOS, POR NATURALEZA, 2018-2032 (USD/KG)
TABLA 944 MERCADO DE ARROZ DE GALÁPAGOS, POR CONTENIDO DE ALMIDÓN, 2018-2032 (MILES DE USD)
TABLA 945 MERCADO DE ARROZ DE GALÁPAGOS, POR CONTENIDO DE ALMIDÓN, 2018-2032 (TONELADAS)
TABLA 946 MERCADO DE ARROZ DE GALÁPAGOS, POR CONTENIDO DE ALMIDÓN, 2018-2032 (USD/KG)
TABLA 947 MERCADO DE ARROZ DE GALÁPAGOS, POR FORMA DE PROCESAMIENTO, 2018-2032 (MILES DE USD)
TABLA 948 MERCADO DE ARROZ DE GALÁPAGOS, POR FORMA DE PROCESAMIENTO, 2018-2032 (TONELADAS)
TABLA 949 MERCADO DE ARROZ DE GALÁPAGOS, POR FORMA DE PROCESAMIENTO, 2018-2032 (USD/KG)
TABLA 950 MERCADO DE ARROZ DE GALÁPAGOS, SEGÚN GRADO DE MOLIENDA, 2018-2032 (MILES DE USD)
TABLA 951 MERCADO DE ARROZ DE GALÁPAGOS, POR GRADO DE MOLIENDA, 2018-2032 (TONELADAS)
CUADRO 952 MERCADO DE ARROZ DE GALÁPAGOS, POR GRADO DE MOLIENDA, 2018-2032 (USD/KG)
TABLA 953 MERCADO DE ARROZ DE GALÁPAGOS, POR PULIDO, 2018-2032 (MILES DE USD)
TABLA 954 MERCADO DE ARROZ DE GALÁPAGOS, POR PULIDO, 2018-2032 (TONELADAS)
TABLA 955 MERCADO DE ARROZ DE GALÁPAGOS, POR PULIDO, 2018-2032 (USD/KG)
TABLA 956 MERCADO DE ARROZ DE GALÁPAGOS, POR FORTIFICACIÓN, 2018-2032 (MILES DE USD)
TABLA 957 MERCADO DE ARROZ DE GALÁPAGOS, POR FORTIFICACIÓN, 2018-2032 (TONELADAS)
TABLA 958 MERCADO DE ARROZ DE GALÁPAGOS, POR FORTIFICACIÓN, 2018-2032 (USD/KG)
TABLA 959 MERCADO DE ARROZ FORTIFICADO DE GALÁPAGOS, POR PROCESO, 2018-2032 (MILES DE USD)
TABLA 960 MERCADO DE ARROZ DE GALÁPAGOS, POR AROMA, 2018-2032 (MILES DE USD)
TABLA 961 MERCADO DE ARROZ DE GALÁPAGOS, POR AROMA, 2018-2032 (TONELADAS)
TABLA 962 MERCADO DE ARROZ DE GALÁPAGOS, POR AROMA, 2018-2032 (USD/KG)
TABLA 963 ARROZ AROMÁTICO DE GALÁPAGOS EN EL MERCADO DE ARROZ, POR TIPO, 2018-2032 (MILES DE USD)
TABLA 964 MERCADO DE ARROZ DE GALÁPAGOS, POR DERIVADOS DEL ARROZ, 2018-2032 (MILES DE USD)
TABLA 965 MERCADO DE ARROZ DE GALÁPAGOS, POR DERIVADOS DEL ARROZ, 2018-2032 (TONELADAS)
TABLA 966 MERCADO DE ARROZ DE GALÁPAGOS, POR DERIVADOS DEL ARROZ, 2018-2032 (USD/KG)
TABLA 967 MERCADO DE ARROZ DE GALÁPAGOS, POR USUARIO FINAL, 2018-2032 (MILES DE USD)
CUADRO 968 MERCADO DE ARROZ DE GALÁPAGOS, POR USUARIO FINAL, 2018-2032 (TONELADAS)
CUADRO 969 MERCADO DE ARROZ DE GALÁPAGOS, POR USUARIO FINAL, 2018-2032 (USD/KG)
TABLA 970 MERCADO DE ALIMENTOS Y BEBIDAS EN ARROZ DE GALÁPAGOS, POR TIPO, 2018-2032 (MILES DE USD)
TABLA 971 MERCADO DE ARROZ EN GALÁPAGOS, POR TIPO, 2018-2032 (MILES DE USD)
TABLA 972 MERCADO DE ARROZ DE PANADERÍA EN GALÁPAGOS, POR TIPO, 2018-2032 (MILES DE USD)
TABLA 973 MERCADO DE ALIMENTOS PROCESADOS EN ARROZ DE GALÁPAGOS, POR TIPO, 2018-2032 (MILES DE USD)
TABLA 974 MERCADO DE CONFITERÍA DE ARROZ DE GALÁPAGOS, POR TIPO, 2018-2032 (MILES DE USD)
TABLA 975 MERCADO DE ARROZ DE FÓRMULA INFANTIL DE GALÁPAGOS, POR TIPO, 2018-2032 (MILES DE USD)
TABLA 976 PRODUCTOS LÁCTEOS EN EL MERCADO DE ARROZ DE GALÁPAGOS, POR TIPO, 2018-2032 (MILES DE USD)
TABLA 977 BEBIDAS DE GALÁPAGOS EN EL MERCADO DE ARROZ, POR TIPO, 2018-2032 (MILES DE USD)
TABLA 978 BEBIDAS SALUDABLES EN EL MERCADO DE ARROZ DE GALÁPAGOS, POR TIPO, 2018-2032 (MILES DE USD)
TABLA 979 MERCADO DE ARROZ ALIMENTARIO EN GALÁPAGOS, POR CATEGORÍA, 2018-2032 (MILES DE USD)
TABLA 980 MERCADO DE AVES DE GALÁPAGOS EN ARROZ, POR TIPO, 2018-2032 (MILES DE USD)
TABLA 981 RUMIANTES DE GALÁPAGOS EN EL MERCADO DE ARROZ, POR TIPO, 2018-2032 (MILES DE USD)
TABLA 982 MERCADO DE ARROZ PORCINO DE GALÁPAGOS, POR TIPO, 2018-2032 (MILES DE USD)
TABLA 983 MERCADO DE ARROZ DE PET DE GALÁPAGOS, POR TIPO, 2018-2032 (MILES DE USD)
TABLA 984 MERCADO DE ARROZ DE ANIMALES ACUÁTICOS DE GALÁPAGOS, POR TIPO, 2018-2032 (MILES DE USD)
TABLA 985 CRUSTÁCEOS DE GALÁPAGOS EN EL MERCADO DE ARROZ, POR TIPO, 2018-2032 (MILES DE USD)
TABLA 986 PESCADO DE GALÁPAGOS EN EL MERCADO DE ARROZ, POR TIPO, 2018-2032 (MILES DE USD)
TABLA 987 MOLUSCOS DE GALÁPAGOS EN EL MERCADO DE ARROZ, POR TIPO, 2018-2032 (MILES DE USD)
TABLA 988 MERCADO DE ARROZ ALIMENTARIO EN GALÁPAGOS, POR FUNCIÓN SANITARIA, 2018-2032 (MILES DE USD)
TABLA 989 MERCADO DE PRODUCTOS FARMACÉUTICOS EN ARROZ DE GALÁPAGOS, POR APLICACIÓN, 2018-2032 (MILES DE USD)
TABLA 990 INFECCIONES UROGENITALES EN EL MERCADO DE ARROZ DE GALÁPAGOS, POR TIPO, 2018-2032 (MILES DE USD)
TABLA 991 MERCADO DE PRODUCTOS FARMACÉUTICOS EN ARROZ DE GALÁPAGOS, POR FORMA DE PRODUCTO, 2018-2032 (MILES DE USD)
TABLA 992 MERCADO DE COSMÉTICOS Y CUIDADO PERSONAL EN ARROZ DE GALÁPAGOS, POR CATEGORÍA, 2018-2032 (MILES DE USD)
TABLA 993 PRODUCTOS DE CUIDADO FACIAL EN EL MERCADO DE ARROZ DE GALÁPAGOS, POR TIPO, 2018-2032 (MILES DE USD)
TABLA 994 PRODUCTOS PARA EL CUIDADO DEL CABELLO EN EL MERCADO DE ARROZ DE GALÁPAGOS, POR TIPO, 2018-2032 (MILES DE USD)
TABLA 995 SUPLEMENTOS DIETÉTICOS EN EL MERCADO DE ARROZ DE GALÁPAGOS, POR TIPO, 2018-2032 (MILES DE USD)
TABLA 996 SUPLEMENTOS DIETÉTICOS EN EL MERCADO DE ARROZ DE GALÁPAGOS, POR FORMA DE PRODUCTO, 2018-2032 (MILES DE USD)
TABLA 997 MERCADO DE ARROZ DE GALÁPAGOS, POR CANAL DE DISTRIBUCIÓN, 2018-2032 (MILES DE USD)
TABLA 998 MERCADO DE ARROZ DE GALÁPAGOS, POR CANAL DE DISTRIBUCIÓN, 2018-2032 (TONELADAS)
TABLA 999 MERCADO DE ARROZ DE GALÁPAGOS, POR CANAL DE DISTRIBUCIÓN, 2018-2032 (USD/KG)
TABLA 1000 GALÁPAGOS FUERA DE LÍNEA EN EL MERCADO DE ARROZ, POR TIPO, 2018-2032 (MILES DE USD)
TABLA 1001 VENTAS AL POR MENOR EN EL MERCADO DE ARROZ DE GALÁPAGOS, POR TIPO DE CANAL, 2018-2032 (MILES DE USD)
TABLA 1002 GALÁPAGOS EN LÍNEA EN EL MERCADO DE ARROZ, POR TIPO, 2018-2032 (MILES DE USD)
TABLA 1003 MERCADO DE ARROZ DE IMBABURA, POR TIPO, 2018-2032 (MILES DE USD)
TABLA 1004 MERCADO DE ARROZ DE IMBABURA, POR TIPO, 2018-2032 (TONELADAS)
TABLA 1005 MERCADO DE ARROZ DE IMBABURA, POR TIPO, 2018-2032 (USD/KG)
TABLA 1006 MERCADO DE ARROZ DE IMBABURA, POR COLOR DE ARROZ, 2018-2032 (MILES DE USD)
TABLA 1007 MERCADO DE ARROZ DE IMBABURA, POR COLOR DEL ARROZ, 2018-2032 (TONELADAS)
TABLA 1008 MERCADO DE ARROZ DE IMBABURA, POR COLOR DEL ARROZ, 2018-2032 (USD/KG)
TABLA 1009 MERCADO DE ARROZ DE IMBABURA, POR TAMAÑO DE GRANO, 2018-2032 (MILES DE USD)
TABLA 1010 MERCADO DE ARROZ DE IMBABURA, POR TAMAÑO DE GRANO, 2018-2032 (TONELADAS)
TABLA 1011 MERCADO DE ARROZ DE IMBABURA, POR TAMAÑO DE GRANO, 2018-2032 (USD/KG)
TABLA 1012 MERCADO DE ARROZ DE IMBABURA, POR NATURALEZA, 2018-2032 (MILES DE USD)
TABLA 1013 MERCADO DE ARROZ DE IMBABURA, POR NATURALEZA, 2018-2032 (TONELADAS)
TABLA 1014 MERCADO DE ARROZ DE IMBABURA, POR NATURALEZA, 2018-2032 (USD/KG)
TABLA 1015 MERCADO DE ARROZ DE IMBABURA, POR CONTENIDO DE ALMIDÓN, 2018-2032 (MILES DE USD)
TABLA 1016 MERCADO DE ARROZ DE IMBABURA, POR CONTENIDO DE ALMIDÓN, 2018-2032 (TONELADAS)
TABLA 1017 MERCADO DE ARROZ DE IMBABURA, POR CONTENIDO DE ALMIDÓN, 2018-2032 (USD/KG)
TABLA 1018 MERCADO DE ARROZ DE IMBABURA, POR FORMA DE PROCESAMIENTO, 2018-2032 (MILES DE USD)
TABLA 1019 MERCADO DE ARROZ DE IMBABURA, POR FORMA DE PROCESAMIENTO, 2018-2032 (TONELADAS)
TABLA 1020 MERCADO DE ARROZ DE IMBABURA, POR FORMA DE PROCESAMIENTO, 2018-2032 (USD/KG)
TABLA 1021 MERCADO DE ARROZ DE IMBABURA, POR GRADO DE MOLIENDA, 2018-2032 (MILES DE USD)
CUADRO 1022 MERCADO DE ARROZ DE IMBABURA, POR GRADO DE MOLIENDA, 2018-2032 (TONELADAS)
CUADRO 1023 MERCADO DE ARROZ DE IMBABURA, POR GRADO DE MOLIENDA, 2018-2032 (USD/KG)
TABLA 1024 MERCADO DE ARROZ DE IMBABURA, POR PULIDO, 2018-2032 (MILES DE USD)
TABLA 1025 MERCADO DE ARROZ DE IMBABURA, POR PULIDO, 2018-2032 (TONELADAS)
TABLA 1026 MERCADO DE ARROZ DE IMBABURA, POR PULIDO, 2018-2032 (USD/KG)
TABLA 1027 MERCADO DE ARROZ DE IMBABURA, POR FORTIFICACIÓN, 2018-2032 (MILES DE USD)
TABLA 1028 MERCADO DE ARROZ DE IMBABURA, POR FORTIFICACIÓN, 2018-2032 (TONELADAS)
CUADRO 1029 MERCADO DE ARROZ DE IMBABURA, POR FORTIFICACIÓN, 2018-2032 (USD/KG)
TABLA 1030 MERCADO DE ARROZ FORTIFICADO DE IMBABURA, POR PROCESO, 2018-2032 (MILES DE USD)
TABLA 1031 MERCADO DE ARROZ DE IMBABURA, POR AROMA, 2018-2032 (MILES DE USD)
TABLA 1032 MERCADO DE ARROZ DE IMBABURA, POR AROMA, 2018-2032 (TONELADAS)
CUADRO 1033 MERCADO DE ARROZ DE IMBABURA, POR AROMA, 2018-2032 (USD/KG)
TABLA 1034 ARROZ AROMÁTICO IMBABURA EN EL MERCADO DEL ARROZ, POR TIPO, 2018-2032 (MILES DE USD)
TABLA 1035 MERCADO DE ARROZ DE IMBABURA, POR DERIVADOS DEL ARROZ, 2018-2032 (MILES DE USD)
TABLA 1036 MERCADO DE ARROZ DE IMBABURA, POR DERIVADOS DEL ARROZ, 2018-2032 (TONELADAS)
TABLA 1037 MERCADO DE ARROZ DE IMBABURA, POR DERIVADOS DEL ARROZ, 2018-2032 (USD/KG)
TABLA 1038 MERCADO DE ARROZ DE IMBABURA, POR USUARIO FINAL, 2018-2032 (MILES DE USD)
CUADRO 1039 MERCADO DE ARROZ DE IMBABURA, POR USUARIO FINAL, 2018-2032 (TONELADAS)
CUADRO 1040 MERCADO DE ARROZ DE IMBABURA, POR USUARIO FINAL, 2018-2032 (USD/KG)
TABLA 1041 ALIMENTOS Y BEBIDAS EN EL MERCADO DE ARROZ DE IMBABURA, POR TIPO, 2018-2032 (MILES DE USD)
TABLA 1042 MERCADO DE ARROZ EN IMBABURA, POR TIPO, 2018-2032 (MILES DE USD)
TABLA 1043 PANADERÍA EN EL MERCADO DE ARROZ DE IMBABURA, POR TIPO, 2018-2032 (MILES DE USD)
TABLA 1044 MERCADO DE ARROZ PROCESADO EN IMBABURA, POR TIPO, 2018-2032 (MILES DE USD)
TABLA 1045 CONFITERÍA DE IMBABURA EN EL MERCADO DE ARROZ, POR TIPO, 2018-2032 (MILES DE USD)
TABLA 1046 FÓRMULA INFANTIL EN EL MERCADO DE ARROZ DE IMBABURA, POR TIPO, 2018-2032 (MILES DE USD)
TABLA 1047 PRODUCTOS LÁCTEOS DE IMBABURA EN EL MERCADO DE ARROZ, POR TIPO, 2018-2032 (MILES DE USD)
TABLA 1048 BEBIDAS DE IMBABURA EN EL MERCADO DE ARROZ, POR TIPO, 2018-2032 (MILES DE USD)
TABLA 1049 BEBIDAS SALUDABLES DE IMBABURA EN EL MERCADO DEL ARROZ, POR TIPO, 2018-2032 (MILES DE USD)
TABLA 1050 MERCADO DE ARROZ ALIMENTICIO DE IMBABURA, POR CATEGORÍA, 2018-2032 (MILES DE USD)
TABLA 1051 MERCADO DE AVES DE CORRAL EN ARROZ DE IMBABURA, POR TIPO, 2018-2032 (MILES DE USD)
TABLA 1052 RUMIANTES DE IMBABURA EN EL MERCADO DE ARROZ, POR TIPO, 2018-2032 (MILES DE USD)
TABLA 1053 MERCADO DE ARROZ PORCINO DE IMBABURA, POR TIPO, 2018-2032 (MILES DE USD)
TABLA 1054 PET EN EL MERCADO DE ARROZ DE IMBABURA, POR TIPO, 2018-2032 (MILES DE USD)
TABLA 1055 MERCADO DE ARROZ DE ANIMALES ACUÁTICOS DE IMBABURA, POR TIPO, 2018-2032 (MILES DE USD)
TABLA 1056 CRUSTÁCEOS DE IMBABURA EN EL MERCADO DE ARROZ, POR TIPO, 2018-2032 (MILES DE USD)
TABLA 1057 PESCADO DE IMBABURA EN EL MERCADO DE ARROZ, POR TIPO, 2018-2032 (MILES DE USD)
TABLA 1058 MOLUSCOS DE IMBABURA EN EL MERCADO DE ARROZ, POR TIPO, 2018-2032 (MILES DE USD)
TABLA 1059 MERCADO DE ARROZ ALIMENTICIO DE IMBABURA, POR FUNCIÓN DE SALUD, 2018-2032 (MILES DE USD)
TABLA 1060 PRODUCTOS FARMACÉUTICOS DE IMBABURA EN EL MERCADO DEL ARROZ, POR APLICACIÓN, 2018-2032 (MILES DE USD)
TABLA 1061 INFECCIONES UROGENTALES EN EL MERCADO DE ARROZ DE IMBABURA, POR TIPO, 2018-2032 (MILES DE USD)
TABLA 1062 PRODUCTOS FARMACÉUTICOS DE IMBABURA EN EL MERCADO DE ARROZ, POR FORMA DE PRODUCTO, 2018-2032 (MILES DE USD)
TABLA 1063 MERCADO DE COSMÉTICOS Y CUIDADO PERSONAL EN EL ARROZ DE IMBABURA, POR CATEGORÍA, 2018-2032 (MILES DE USD)
TABLA 1064 PRODUCTOS DE CUIDADO FACIAL DE IMBABURA EN EL MERCADO DEL ARROZ, POR TIPO, 2018-2032 (MILES DE USD)
TABLA 1065 PRODUCTOS PARA EL CUIDADO DEL CABELLO EN EL MERCADO DEL ARROZ DE IMBABURA, POR TIPO, 2018-2032 (MILES DE USD)
TABLA 1066 SUPLEMENTOS DIETÉTICOS DE IMBABURA EN EL MERCADO DE ARROZ, POR TIPO, 2018-2032 (MILES DE USD)
TABLA 1067 SUPLEMENTOS DIETÉTICOS EN EL MERCADO DE ARROZ DE IMBABURA, POR FORMA DE PRODUCTO, 2018-2032 (MILES DE USD)
TABLA 1068 MERCADO DE ARROZ DE IMBABURA, POR CANAL DE DISTRIBUCIÓN, 2018-2032 (MILES DE USD)
TABLA 1069 MERCADO DE ARROZ DE IMBABURA, POR CANAL DE DISTRIBUCIÓN, 2018-2032 (TONELADAS)
TABLA 1070 MERCADO DE ARROZ DE IMBABURA, POR CANAL DE DISTRIBUCIÓN, 2018-2032 (USD/KG)
TABLA 1071 IMBABURA FUERA DE LÍNEA EN EL MERCADO DE ARROZ, POR TIPO, 2018-2032 (MILES DE USD)
TABLA 1072 VENTAS MINORISTAS EN EL MERCADO DE ARROZ DE IMBABURA, POR TIPO DE CANAL, 2018-2032 (MILES DE USD)
TABLA 1073 MERCADO DE ARROZ EN LÍNEA DE IMBABURA, POR TIPO, 2018-2032 (MILES DE USD)
TABLA 1074 MERCADO DE ARROZ MORONA SANTIAGO, POR TIPO, 2018-2032 (MILES DE USD)
TABLA 1075 MERCADO DE ARROZ DE MORONA SANTIAGO, POR TIPO, 2018-2032 (TONELADAS)
TABLA 1076 MERCADO DE ARROZ MORONA SANTIAGO, POR TIPO, 2018-2032 (USD/KG)
TABLA 1077 MERCADO DE ARROZ MORONA SANTIAGO, POR COLOR DE ARROZ, 2018-2032 (MILES DE USD)
TABLA 1078 MERCADO DE ARROZ MORONA SANTIAGO, POR COLOR DEL ARROZ, 2018-2032 (TONELADAS)
TABLA 1079 MERCADO DE ARROZ MORONA SANTIAGO, POR COLOR DE ARROZ, 2018-2032 (USD/KG)
TABLA 1080 MERCADO DE ARROZ MORONA SANTIAGO, POR TAMAÑO DE GRANO, 2018-2032 (MILES DE USD)
TABLA 1081 MERCADO DE ARROZ MORONA SANTIAGO, POR TAMAÑO DE GRANO, 2018-2032 (TONELADAS)
TABLA 1082 MERCADO DE ARROZ MORONA SANTIAGO, POR TAMAÑO DE GRANO, 2018-2032 (USD/KG)
TABLA 1083 MERCADO DE ARROZ MORONA SANTIAGO, POR NATURALEZA, 2018-2032 (MILES DE USD)
TABLA 1084 MERCADO DE ARROZ MORONA SANTIAGO, POR NATURALEZA, 2018-2032 (TONELADAS)
TABLA 1085 MERCADO DEL ARROZ MORONA SANTIAGO, POR NATURALEZA, 2018-2032 (USD/KG)
TABLA 1086 MERCADO DE ARROZ MORONA SANTIAGO, POR CONTENIDO DE ALMIDÓN, 2018-2032 (MILES DE USD)
TABLA 1087 MERCADO DE ARROZ MORONA SANTIAGO, POR CONTENIDO DE ALMIDÓN, 2018-2032 (TONELADAS)
TABLA 1088 MERCADO DE ARROZ MORONA SANTIAGO, POR CONTENIDO DE ALMIDÓN, 2018-2032 (USD/KG)
TABLA 1089 MERCADO DE ARROZ MORONA SANTIAGO, POR FORMA DE PROCESAMIENTO, 2018-2032 (MILES DE USD)
TABLA 1090 MERCADO DE ARROZ MORONA SANTIAGO, POR FORMA DE PROCESAMIENTO, 2018-2032 (TONELADAS)
TABLA 1091 MERCADO DE ARROZ MORONA SANTIAGO, POR FORMA DE PROCESAMIENTO, 2018-2032 (USD/KG)
TABLA 1092 MERCADO DE ARROZ MORONA SANTIAGO, SEGÚN GRADO DE MOLIENDA, 2018-2032 (MILES DE USD)
TABLA 1093 MERCADO DE ARROZ MORONA SANTIAGO, SEGÚN GRADO DE MOLIENDA, 2018-2032 (TONELADAS)
CUADRO 1094 MERCADO DE ARROZ MORONA SANTIAGO, SEGÚN GRADO DE MOLIENDA, 2018-2032 (USD/KG)
TABLA 1095 MERCADO DE ARROZ MORONA SANTIAGO, POR PULIDO, 2018-2032 (MILES DE USD)
TABLA 1096 MERCADO DE ARROZ MORONA SANTIAGO, POR PULIDO, 2018-2032 (TONELADAS)
TABLA 1097 MERCADO DE ARROZ MORONA SANTIAGO, POR PULIDO, 2018-2032 (USD/KG)
TABLA 1098 MERCADO DE ARROZ MORONA SANTIAGO, POR FORTIFICACIÓN, 2018-2032 (MILES DE USD)
TABLA 1099 MERCADO DE ARROZ MORONA SANTIAGO, POR FORTIFICACIÓN, 2018-2032 (TONELADAS)
TABLA 1100 MERCADO DE ARROZ MORONA SANTIAGO, POR FORTIFICACIÓN, 2018-2032 (USD/KG)
CUADRO 1101 MERCADO DE ARROZ FORTIFICADO MORONA SANTIAGO, POR PROCESO, 2018-2032 (MILES DE USD)
TABLA 1102 MERCADO DEL ARROZ MORONA SANTIAGO, POR AROMA, 2018-2032 (MILES DE USD)
TABLA 1103 MERCADO DE ARROZ MORONA SANTIAGO, POR AROMA, 2018-2032 (TONELADAS)
TABLA 1104 MERCADO DEL ARROZ MORONA SANTIAGO, POR AROMA, 2018-2032 (USD/KG)
TABLA 1105 ARROZ AROMÁTICO MORONA SANTIAGO EN EL MERCADO DE ARROZ, POR TIPO, 2018-2032 (MILES DE USD)
TABLA 1106 MERCADO DE ARROZ MORONA SANTIAGO, POR DERIVADOS DEL ARROZ, 2018-2032 (MILES DE USD)
TABLA 1107 MERCADO DE ARROZ DE MORONA SANTIAGO, POR DERIVADOS DEL ARROZ, 2018-2032 (TONELADAS)
TABLA 1108 MERCADO DE ARROZ MORONA SANTIAGO, POR DERIVADOS DEL ARROZ, 2018-2032 (USD/KG)
TABLA 1109 MERCADO DE ARROZ MORONA SANTIAGO, POR USUARIO FINAL, 2018-2032 (MILES DE USD)
CUADRO 1110 MERCADO DE ARROZ DE MORONA SANTIAGO, POR USUARIO FINAL, 2018-2032 (TONELADAS)
CUADRO 1111 MERCADO DE ARROZ MORONA SANTIAGO, POR USUARIO FINAL, 2018-2032 (USD/KG)
TABLA 1112 MERCADO DE ALIMENTOS Y BEBIDAS EN ARROZ MORONA SANTIAGO, POR TIPO, 2018-2032 (MILES DE USD)
TABLA 1113 MERCADO DE ARROZ MORONA SANTIAGO, POR TIPO, 2018-2032 (MILES DE USD)
TABLA 1114 PANADERÍA MORONA SANTIAGO EN EL MERCADO DEL ARROZ, POR TIPO, 2018-2032 (MILES DE USD)
TABLA 1115 MERCADO DE ALIMENTOS PROCESADOS EN ARROZ MORONA SANTIAGO, POR TIPO, 2018-2032 (MILES DE USD)
TABLA 1116 MERCADO DE CONFITERÍA EN ARROZ MORONA SANTIAGO, POR TIPO, 2018-2032 (MILES DE USD)
TABLA 1117 MERCADO DE ARROZ DE FÓRMULA INFANTIL MORONA SANTIAGO, POR TIPO, 2018-2032 (MILES DE USD)
TABLA 1118 PRODUCTOS LÁCTEOS EN EL MERCADO DE ARROZ DE MORONA SANTIAGO, POR TIPO, 2018-2032 (MILES DE USD)
TABLA 1119 BEBIDAS EN EL MERCADO DE ARROZ DE MORONA SANTIAGO, POR TIPO, 2018-2032 (MILES DE USD)
TABLA 1120 BEBIDAS SALUDABLES EN EL MERCADO DE ARROZ MORONA SANTIAGO, POR TIPO, 2018-2032 (MILES DE USD)
TABLA 1121 MERCADO DE ARROZ ALIMENTICIO MORONA SANTIAGO, POR CATEGORÍA, 2018-2032 (MILES DE USD)
TABLA 1122 MERCADO DE AVES DE CORRAL EN ARROZ MORONA SANTIAGO, POR TIPO, 2018-2032 (MILES DE USD)
TABLA 1123 MERCADO DE ARROZ DE RUMIANTES DE MORONA SANTIAGO, POR TIPO, 2018-2032 (MILES DE USD)
TABLA 1124 MERCADO DE ARROZ PORCINO MORONA SANTIAGO, POR TIPO, 2018-2032 (MILES DE USD)
TABLA 1125 MERCADO DE ARROZ DE PET MORONA SANTIAGO, POR TIPO, 2018-2032 (MILES DE USD)
TABLA 1126 MERCADO DE ARROZ DE ANIMALES ACUÁTICOS MORONA SANTIAGO, POR TIPO, 2018-2032 (MILES DE USD)
TABLA 1127 CRUSTÁCEOS EN EL MERCADO DE ARROZ DE MORONA SANTIAGO, POR TIPO, 2018-2032 (MILES DE USD)
TABLA 1128 PESCADO EN EL MERCADO DE ARROZ DE MORONA SANTIAGO, POR TIPO, 2018-2032 (MILES DE USD)
TABLA 1129 MOLUSCOS DE MORONA SANTIAGO EN EL MERCADO DE ARROZ, POR TIPO, 2018-2032 (MILES DE USD)
TABLA 1130 MERCADO DE ARROZ ALIMENTICIO MORONA SANTIAGO, POR FUNCIÓN SANITARIA, 2018-2032 (MILES DE USD)
TABLA 1131 MERCADO DE PRODUCTOS FARMACÉUTICOS EN ARROZ DE MORONA SANTIAGO, POR APLICACIÓN, 2018-2032 (MILES DE USD)
TABLA 1132 INFECCIONES UROGENTALES EN EL MERCADO DE ARROZ DE MORONA SANTIAGO, POR TIPO, 2018-2032 (MILES DE USD)
TABLA 1133 MERCADO DE PRODUCTOS FARMACÉUTICOS EN ARROZ DE MORONA SANTIAGO, POR FORMA DE PRODUCTO, 2018-2032 (MILES DE USD)
TABLA 1134 MERCADO DE COSMÉTICOS Y CUIDADO PERSONAL EN ARROZ MORONA SANTIAGO, POR CATEGORÍA, 2018-2032 (MILES DE USD)
TABLA 1135 PRODUCTOS DE CUIDADO FACIAL EN EL MERCADO DE ARROZ DE MORONA SANTIAGO, POR TIPO, 2018-2032 (MILES DE USD)
TABLA 1136 PRODUCTOS PARA EL CUIDADO DEL CABELLO EN EL MERCADO DE ARROZ DE MORONA SANTIAGO, POR TIPO, 2018-2032 (MILES DE USD)
TABLA 1137 SUPLEMENTOS DIETÉTICOS EN EL MERCADO DE ARROZ DE MORONA SANTIAGO, POR TIPO, 2018-2032 (MILES DE USD)
TABLA 1138 SUPLEMENTOS DIETÉTICOS EN EL MERCADO DE ARROZ DE MORONA SANTIAGO, POR FORMA DE PRODUCTO, 2018-2032 (MILES DE USD)
TABLA 1139 MERCADO DE ARROZ DE MORONA SANTIAGO, POR CANAL DE DISTRIBUCIÓN, 2018-2032 (MILES DE USD)
TABLA 1140 MERCADO DE ARROZ DE MORONA SANTIAGO, POR CANAL DE DISTRIBUCIÓN, 2018-2032 (TONELADAS)
TABLA 1141 MERCADO DE ARROZ MORONA SANTIAGO, POR CANAL DE DISTRIBUCIÓN, 2018-2032 (USD/KG)
TABLA 1142 MORONA SANTIAGO FUERA DE LÍNEA EN EL MERCADO DE ARROZ, POR TIPO, 2018-2032 (MILES DE USD)
TABLA 1143 VENTAS AL POR MENOR EN EL MERCADO DE ARROZ DE MORONA SANTIAGO, POR TIPO DE CANAL, 2018-2032 (MILES DE USD)
TABLA 1144 MERCADO DE ARROZ EN LÍNEA MORONA SANTIAGO, POR TIPO, 2018-2032 (MILES DE USD)
TABLA 1145 MERCADO DE ARROZ DE NAPO, POR TIPO, 2018-2032 (MILES DE USD)
TABLA 1146 MERCADO DE ARROZ DE NAPO, POR TIPO, 2018-2032 (TONELADAS)
TABLA 1147 MERCADO DE ARROZ DE NAPO, POR TIPO, 2018-2032 (USD/KG)
TABLA 1148 MERCADO DE ARROZ DE NAPO, POR COLOR DE ARROZ, 2018-2032 (MILES DE USD)
TABLA 1149 MERCADO DE ARROZ DE NAPO, POR COLOR DE ARROZ, 2018-2032 (TONELADAS)
TABLA 1150 MERCADO DE ARROZ DE NAPO, POR COLOR DE ARROZ, 2018-2032 (USD/KG)
TABLA 1151 MERCADO DE ARROZ DE NAPO, POR TAMAÑO DE GRANO, 2018-2032 (MILES DE USD)
TABLA 1152 MERCADO DE ARROZ DE NAPO, POR TAMAÑO DE GRANO, 2018-2032 (TONELADAS)
TABLA 1153 MERCADO DE ARROZ DE NAPO, POR TAMAÑO DE GRANO, 2018-2032 (USD/KG)
TABLA 1154 MERCADO DE ARROZ DE NAPO, POR NATURALEZA, 2018-2032 (MILES DE USD)
TABLA 1155 MERCADO DE ARROZ DE NAPO, POR NATURALEZA, 2018-2032 (TONELADAS)
TABLA 1156 MERCADO DE ARROZ DE NAPO, POR NATURALEZA, 2018-2032 (USD/KG)
TABLA 1157 MERCADO DE ARROZ DE NAPO, POR CONTENIDO DE ALMIDÓN, 2018-2032 (MILES DE USD)
TABLA 1158 MERCADO DE ARROZ DE NAPO, POR CONTENIDO DE ALMIDÓN, 2018-2032 (TONELADAS)
TABLA 1159 MERCADO DE ARROZ DE NAPO, POR CONTENIDO DE ALMIDÓN, 2018-2032 (USD/KG)
TABLA 1160 MERCADO DE ARROZ DE NAPO, POR FORMA DE PROCESAMIENTO, 2018-2032 (MILES DE USD)
TABLA 1161 MERCADO DE ARROZ DE NAPO, POR FORMA DE PROCESAMIENTO, 2018-2032 (TONELADAS)
TABLA 1162 MERCADO DE ARROZ DE NAPO, POR FORMA DE PROCESAMIENTO, 2018-2032 (USD/KG)
CUADRO 1163 MERCADO DE ARROZ DE NAPO, POR GRADO DE MOLIENDA, 2018-2032 (MILES DE USD)
CUADRO 1164 MERCADO DE ARROZ DE NAPO, POR GRADO DE MOLIENDA, 2018-2032 (TONELADAS)
CUADRO 1165 MERCADO DE ARROZ DE NAPO, POR GRADO DE MOLIENDA, 2018-2032 (USD/KG)
TABLA 1166 MERCADO DE ARROZ DE NAPO, POR PULIDO, 2018-2032 (MILES DE USD)
TABLA 1167 MERCADO DE ARROZ DE NAPO, POR PULIDO, 2018-2032 (TONELADAS)
TABLA 1168 MERCADO DE ARROZ DE NAPO, POR PULIDO, 2018-2032 (USD/KG)
TABLA 1169 MERCADO DE ARROZ DE NAPO, POR FORTIFICACIÓN, 2018-2032 (MILES DE USD)
TABLA 1170 MERCADO DE ARROZ DE NAPO, POR FORTIFICACIÓN, 2018-2032 (TONELADAS)
TABLA 1171 MERCADO DE ARROZ DE NAPO, POR FORTIFICACIÓN, 2018-2032 (USD/KG)
TABLA 1172 MERCADO DE ARROZ FORTIFICADO DE NAPO, POR PROCESO, 2018-2032 (MILES DE USD)
TABLA 1173 MERCADO DE ARROZ DE NAPO, POR AROMA, 2018-2032 (MILES DE USD)
TABLA 1174 MERCADO DE ARROZ DE NAPO, POR AROMA, 2018-2032 (TONELADAS)
TABLA 1175 MERCADO DE ARROZ DE NAPO, POR AROMA, 2018-2032 (USD/KG)
TABLA 1176 ARROZ AROMÁTICO NAPO EN EL MERCADO DE ARROZ, POR TIPO, 2018-2032 (MILES DE USD)
TABLA 1177 MERCADO DE ARROZ DE NAPO, POR DERIVADOS DEL ARROZ, 2018-2032 (MILES DE USD)
TABLA 1178 MERCADO DE ARROZ DE NAPO, POR DERIVADOS DEL ARROZ, 2018-2032 (TONELADAS)
TABLA 1179 MERCADO DE ARROZ DE NAPO, POR DERIVADOS DEL ARROZ, 2018-2032 (USD/KG)
TABLA 1180 MERCADO DE ARROZ DE NAPO, POR USUARIO FINAL, 2018-2032 (MILES DE USD)
CUADRO 1181 MERCADO DE ARROZ DE NAPO, POR USUARIO FINAL, 2018-2032 (TONELADAS)
CUADRO 1182 MERCADO DE ARROZ DE NAPO, POR USUARIO FINAL, 2018-2032 (USD/KG)
TABLA 1183 ALIMENTOS Y BEBIDAS EN EL MERCADO DE ARROZ DE NAPO, POR TIPO, 2018-2032 (MILES DE USD)
TABLA 1184 MERCADO DE ALIMENTOS NAPO EN ARROZ, POR TIPO, 2018-2032 (MILES DE USD)
TABLA 1185 PANADERÍA NAPO EN EL MERCADO DEL ARROZ, POR TIPO, 2018-2032 (MILES DE USD)
TABLA 1186 MERCADO DE ALIMENTOS PROCESADOS EN ARROZ DE NAPO, POR TIPO, 2018-2032 (MILES DE USD)
TABLA 1187 CONFITERÍA NAPO EN EL MERCADO DE ARROZ, POR TIPO, 2018-2032 (MILES DE USD)
TABLA 1188 MERCADO DE ARROZ DE FÓRMULA INFANTIL NAPO, POR TIPO, 2018-2032 (MILES DE USD)
TABLA 1189 PRODUCTOS LÁCTEOS DE NAPO EN EL MERCADO DE ARROZ, POR TIPO, 2018-2032 (MILES DE USD)
TABLA 1190 BEBIDAS NAPO EN EL MERCADO DE ARROZ, POR TIPO, 2018-2032 (MILES DE USD)
TABLA 1191 BEBIDAS SALUDABLES DE NAPO EN EL MERCADO DE ARROZ, POR TIPO, 2018-2032 (MILES DE USD)
TABLA 1192 MERCADO DE ARROZ ALIMENTICIO NAPO, POR CATEGORÍA, 2018-2032 (MILES DE USD)
TABLA 1193 AVES DE CORRAL NAPO EN EL MERCADO DE ARROZ, POR TIPO, 2018-2032 (MILES DE USD)
TABLA 1194 RUMIANTES NAPO EN EL MERCADO DE ARROZ, POR TIPO, 2018-2032 (MILES DE USD)
TABLA 1195 CERDOS NAPO EN EL MERCADO DE ARROZ, POR TIPO, 2018-2032 (MILES DE USD)
TABLA 1196 NAPO PET EN EL MERCADO DE ARROZ, POR TIPO, 2018-2032 (MILES DE USD)
TABLA 1197 MERCADO DE ANIMALES ACUÁTICOS NAPO EN ARROZ, POR TIPO, 2018-2032 (MILES DE USD)
TABLA 1198 CRUSTÁCEOS NAPO EN EL MERCADO DE ARROZ, POR TIPO, 2018-2032 (MILES DE USD)
TABLA 1199 PESCADO NAPO EN EL MERCADO DE ARROZ, POR TIPO, 2018-2032 (MILES DE USD)
TABLA 1200 MOLUSCOS NAPO EN EL MERCADO DE ARROZ, POR TIPO, 2018-2032 (MILES DE USD)
TABLA 1201 MERCADO DE ARROZ ALIMENTICIO NAPO, POR FUNCIÓN SANITARIA, 2018-2032 (MILES DE USD)
TABLA 1202 PRODUCTOS FARMACÉUTICOS DE NAPO EN EL MERCADO DEL ARROZ, POR APLICACIÓN, 2018-2032 (MILES DE USD)
TABLA 1203 INFECCIONES UROGENITALES EN EL MERCADO DE ARROZ, POR TIPO, 2018-2032 (MILES DE USD)
TABLA 1204 PRODUCTOS FARMACÉUTICOS DE NAPO EN EL MERCADO DE ARROZ, POR FORMA DE PRODUCTO, 2018-2032 (MILES DE USD)
TABLA 1205 MERCADO DE COSMÉTICOS Y CUIDADO PERSONAL EN ARROZ, POR CATEGORÍA, 2018-2032 (MILES DE USD)
TABLA 1206 PRODUCTOS DE CUIDADO FACIAL DE NAPO EN EL MERCADO DEL ARROZ, POR TIPO, 2018-2032 (MILES DE USD)
TABLA 1207 PRODUCTOS PARA EL CUIDADO DEL CABELLO EN EL MERCADO DEL ARROZ, POR TIPO, 2018-2032 (MILES DE USD)
TABLA 1208 SUPLEMENTOS DIETÉTICOS DE NAPO EN EL MERCADO DE ARROZ, POR TIPO, 2018-2032 (MILES DE USD)
TABLA 1209 SUPLEMENTOS DIETÉTICOS DE NAPO EN EL MERCADO DE ARROZ, POR FORMA DE PRODUCTO, 2018-2032 (MILES DE USD)
TABLA 1210 MERCADO DE ARROZ DE NAPO, POR CANAL DE DISTRIBUCIÓN, 2018-2032 (MILES DE USD)
TABLA 1211 MERCADO DE ARROZ DE NAPO, POR CANAL DE DISTRIBUCIÓN, 2018-2032 (TONELADAS)
TABLA 1212 MERCADO DE ARROZ DE NAPO, POR CANAL DE DISTRIBUCIÓN, 2018-2032 (USD/KG)
TABLA 1213 NAPO FUERA DE LÍNEA EN EL MERCADO DE ARROZ, POR TIPO, 2018-2032 (MILES DE USD)
TABLA 1214 VENTAS MINORISTAS DE NAPO EN EL MERCADO DE ARROZ, POR TIPO DE CANAL, 2018-2032 (MILES DE USD)
TABLA 1215 NAPO EN LÍNEA EN EL MERCADO DE ARROZ, POR TIPO, 2018-2032 (MILES DE USD)
TABLA 1216 MERCADO DE ARROZ DE ORELLANA, POR TIPO, 2018-2032 (MILES DE USD)
TABLA 1217 MERCADO DE ARROZ DE ORELLANA, POR TIPO, 2018-2032 (TONELADAS)
TABLA 1218 MERCADO DE ARROZ DE ORELLANA, POR TIPO, 2018-2032 (USD/KG)
TABLA 1219 MERCADO DE ARROZ DE ORELLANA, POR COLOR DE ARROZ, 2018-2032 (MILES DE USD)
TABLA 1220 MERCADO DE ARROZ DE ORELLANA, POR COLOR DE ARROZ, 2018-2032 (TONELADAS)
TABLA 1221 MERCADO DE ARROZ DE ORELLANA, POR COLOR DE ARROZ, 2018-2032 (USD/KG)
TABLA 1222 MERCADO DE ARROZ DE ORELLANA, POR TAMAÑO DE GRANO, 2018-2032 (MILES DE USD)
TABLA 1223 MERCADO DE ARROZ DE ORELLANA, POR TAMAÑO DE GRANO, 2018-2032 (TONELADAS)
TABLA 1224 MERCADO DE ARROZ DE ORELLANA, POR TAMAÑO DE GRANO, 2018-2032 (USD/KG)
TABLA 1225 MERCADO DEL ARROZ DE ORELLANA, POR NATURALEZA, 2018-2032 (MILES DE USD)
TABLA 1226 MERCADO DE ARROZ DE ORELLANA, POR NATURALEZA, 2018-2032 (TONELADAS)
TABLA 1227 MERCADO DEL ARROZ DE ORELLANA, POR NATURALEZA, 2018-2032 (USD/KG)
TABLA 1228 MERCADO DE ARROZ DE ORELLANA, POR CONTENIDO DE ALMIDÓN, 2018-2032 (MILES DE USD)
TABLA 1229 MERCADO DE ARROZ DE ORELLANA, POR CONTENIDO DE ALMIDÓN, 2018-2032 (TONELADAS)
TABLA 1230 MERCADO DE ARROZ DE ORELLANA, POR CONTENIDO DE ALMIDÓN, 2018-2032 (USD/KG)
TABLA 1231 MERCADO DE ARROZ DE ORELLANA, POR FORMA DE PROCESAMIENTO, 2018-2032 (MILES DE USD)
TABLA 1232 MERCADO DE ARROZ DE ORELLANA, POR FORMA DE PROCESAMIENTO, 2018-2032 (TONELADAS)
TABLA 1233 MERCADO DE ARROZ DE ORELLANA, POR FORMA DE PROCESAMIENTO, 2018-2032 (USD/KG)
CUADRO 1234 MERCADO DE ARROZ DE ORELLANA, SEGÚN GRADO DE MOLIENDA, 2018-2032 (MILES DE USD)
TABLA 1235 MERCADO DE ARROZ DE ORELLANA, POR GRADO DE MOLIENDA, 2018-2032 (TONELADAS)
CUADRO 1236 MERCADO DE ARROZ DE ORELLANA, POR GRADO DE MOLIENDA, 2018-2032 (USD/KG)
TABLA 1237 MERCADO DE ARROZ DE ORELLANA, POR PULIDO, 2018-2032 (MILES DE USD)
TABLA 1238 MERCADO DE ARROZ DE ORELLANA, POR PULIDO, 2018-2032 (TONELADAS)
TABLA 1239 MERCADO DE ARROZ DE ORELLANA, POR PULIDO, 2018-2032 (USD/KG)
TABLA 1240 MERCADO DE ARROZ DE ORELLANA, POR FORTIFICACIÓN, 2018-2032 (MILES DE USD)
TABLA 1241 MERCADO DE ARROZ DE ORELLANA, POR FORTIFICACIÓN, 2018-2032 (TONELADAS)
TABLA 1242 MERCADO DE ARROZ DE ORELLANA, POR FORTIFICACIÓN, 2018-2032 (USD/KG)
TABLA 1243 MERCADO DE ARROZ FORTIFICADO DE ORELLANA, POR PROCESO, 2018-2032 (MILES DE USD)
TABLA 1244 MERCADO DEL ARROZ DE ORELLANA, POR AROMA, 2018-2032 (MILES DE USD)
TABLA 1245 MERCADO DEL ARROZ DE ORELLANA, POR AROMA, 2018-2032 (TONELADAS)
TABLA 1246 MERCADO DEL ARROZ DE ORELLANA, POR AROMA, 2018-2032 (USD/KG)
TABLA 1247 ARROZ AROMÁTICO ORELLANA EN EL MERCADO DE ARROZ, POR TIPO, 2018-2032 (MILES DE USD)
TABLA 1248 MERCADO DE ARROZ DE ORELLANA, POR DERIVADOS DEL ARROZ, 2018-2032 (MILES DE USD)
TABLA 1249 MERCADO DE ARROZ DE ORELLANA, POR DERIVADOS DEL ARROZ, 2018-2032 (TONELADAS)
TABLA 1250 MERCADO DE ARROZ DE ORELLANA, POR DERIVADOS DEL ARROZ, 2018-2032 (USD/KG)
TABLA 1251 MERCADO DE ARROZ DE ORELLANA, POR USUARIO FINAL, 2018-2032 (MILES DE USD)
TABLA 1252 MERCADO DE ARROZ DE ORELLANA, POR USUARIO FINAL, 2018-2032 (TONELADAS)
TABLA 1253 MERCADO DE ARROZ DE ORELLANA, POR USUARIO FINAL, 2018-2032 (USD/KG)
TABLA 1254 MERCADO DE ALIMENTOS Y BEBIDAS EN ARROZ DE ORELLANA, POR TIPO, 2018-2032 (MILES DE USD)
TABLA 1255 MERCADO DE ARROZ EN ORELLANA, POR TIPO, 2018-2032 (MILES DE USD)
TABLA 1256 PANADERÍA ORELLANA EN EL MERCADO DEL ARROZ, POR TIPO, 2018-2032 (MILES DE USD)
TABLA 1257 MERCADO DE ALIMENTOS PROCESADOS EN ARROZ DE ORELLANA, POR TIPO, 2018-2032 (MILES DE USD)
TABLA 1258 CONFITERÍA ORELLANA EN EL MERCADO DE ARROZ, POR TIPO, 2018-2032 (MILES DE USD)
TABLA 1259 MERCADO DE ARROZ DE FÓRMULA INFANTIL ORELLANA, POR TIPO, 2018-2032 (MILES DE USD)
TABLA 1260 PRODUCTOS LÁCTEOS EN EL MERCADO DE ARROZ DE ORELLANA, POR TIPO, 2018-2032 (MILES DE USD)
TABLA 1261 BEBIDAS DE ORELLANA EN EL MERCADO DE ARROZ, POR TIPO, 2018-2032 (MILES DE USD)
TABLA 1262 BEBIDAS SALUDABLES DE ORELLANA EN EL MERCADO DE ARROZ, POR TIPO, 2018-2032 (MILES DE USD)
TABLA 1263 MERCADO DE ARROZ ALIMENTICIO DE ORELLANA, POR CATEGORÍA, 2018-2032 (MILES DE USD)
TABLA 1264 MERCADO DE AVES DE CORRAL EN ARROZ DE ORELLANA, POR TIPO, 2018-2032 (MILES DE USD)
TABLA 1265 RUMIANTES DE ORELLANA EN EL MERCADO DE ARROZ, POR TIPO, 2018-2032 (MILES DE USD)
TABLA 1266 MERCADO DE ARROZ PORCINO ORELLANA, POR TIPO, 2018-2032 (MILES DE USD)
TABLA 1267 PET DE ORELLANA EN EL MERCADO DE ARROZ, POR TIPO, 2018-2032 (MILES DE USD)
TABLA 1268 MERCADO DE ARROZ DE ANIMALES ACUÁTICOS DE ORELLANA, POR TIPO, 2018-2032 (MILES DE USD)
TABLA 1269 CRUSTÁCEOS DE ORELLANA EN EL MERCADO DE ARROZ, POR TIPO, 2018-2032 (MILES DE USD)
TABLA 1270 PESCADO EN EL MERCADO DE ARROZ DE ORELLANA, POR TIPO, 2018-2032 (MILES DE USD)
TABLA 1271 MOLUSCOS DE ORELLANA EN EL MERCADO DE ARROZ, POR TIPO, 2018-2032 (MILES DE USD)
TABLA 1272 MERCADO DE ARROZ ALIMENTICIO DE ORELLANA, POR FUNCIÓN DE SALUD, 2018-2032 (MILES DE USD)
TABLA 1273 PRODUCTOS FARMACÉUTICOS DE ORELLANA EN EL MERCADO DE ARROZ, POR APLICACIÓN, 2018-2032 (MILES DE USD)
TABLA 1274 INFECCIONES UROGENITALES EN EL MERCADO DE ARROZ DE ORELLANA, POR TIPO, 2018-2032 (MILES DE USD)
TABLA 1275 PRODUCTOS FARMACÉUTICOS DE ORELLANA EN EL MERCADO DE ARROZ, POR FORMA DE PRODUCTO, 2018-2032 (MILES DE USD)
TABLA 1276 COSMÉTICOS Y CUIDADO PERSONAL EN EL MERCADO DE ARROZ DE ORELLANA, POR CATEGORÍA, 2018-2032 (MILES DE USD)
TABLA 1277 PRODUCTOS DE CUIDADO FACIAL DE ORELLANA EN EL MERCADO DE ARROZ, POR TIPO, 2018-2032 (MILES DE USD)
TABLA 1278 PRODUCTOS PARA EL CUIDADO DEL CABELLO DE ORELLANA EN EL MERCADO DEL ARROZ, POR TIPO, 2018-2032 (MILES DE USD)
TABLA 1279 SUPLEMENTOS DIETÉTICOS EN EL MERCADO DE ARROZ DE ORELLANA, POR TIPO, 2018-2032 (MILES DE USD)
TABLA 1280 SUPLEMENTOS DIETÉTICOS EN EL MERCADO DE ARROZ DE ORELLANA, POR FORMA DE PRODUCTO, 2018-2032 (MILES DE USD)
TABLA 1281 MERCADO DE ARROZ DE ORELLANA, POR CANAL DE DISTRIBUCIÓN, 2018-2032 (MILES DE USD)
TABLA 1282 MERCADO DE ARROZ DE ORELLANA, POR CANAL DE DISTRIBUCIÓN, 2018-2032 (TONELADAS)
TABLA 1283 MERCADO DE ARROZ DE ORELLANA, POR CANAL DE DISTRIBUCIÓN, 2018-2032 (USD/KG)
TABLA 1284 ORELLANA FUERA DE LÍNEA EN EL MERCADO DE ARROZ, POR TIPO, 2018-2032 (MILES DE USD)
TABLA 1285 VENTAS AL POR MENOR EN EL MERCADO DE ARROZ DE ORELLANA, POR TIPO DE CANAL, 2018-2032 (MILES DE USD)
TABLA 1286 MERCADO DE ARROZ EN LÍNEA DE ORELLANA, POR TIPO, 2018-2032 (MILES DE USD)
TABLA 1287 MERCADO DE ARROZ PARA PASTAZA, POR TIPO, 2018-2032 (MILES DE USD)
TABLA 1288 MERCADO DE ARROZ PARA PASTAZA, POR TIPO, 2018-2032 (TONELADAS)
TABLA 1289 MERCADO DE ARROZ PARA PASTAZA, POR TIPO, 2018-2032 (USD/KG)
TABLA 1290 MERCADO DE ARROZ PARA PASTAZA, POR COLOR DE ARROZ, 2018-2032 (MILES DE USD)
TABLA 1291 MERCADO DE ARROZ PARA PASTAZA, POR COLOR DE ARROZ, 2018-2032 (TONELADAS)
TABLA 1292 MERCADO DE ARROZ PARA PASTAZA, POR COLOR DE ARROZ, 2018-2032 (USD/KG)
TABLA 1293 MERCADO DE ARROZ PARA PASTAZA, POR TAMAÑO DE GRANO, 2018-2032 (MILES DE USD)
TABLA 1294 MERCADO DE ARROZ PARA PASTAZA, POR TAMAÑO DE GRANO, 2018-2032 (TONELADAS)
TABLA 1295 MERCADO DE ARROZ PARA PASTAZA, POR TAMAÑO DE GRANO, 2018-2032 (USD/KG)
TABLA 1296 MERCADO DE ARROZ PARA PASTAZA, POR NATURALEZA, 2018-2032 (MILES DE USD)
TABLA 1297 MERCADO DE ARROZ PARA PASTAZA, POR NATURALEZA, 2018-2032 (TONELADAS)
TABLA 1298 MERCADO DE ARROZ PARA PASTAZA, POR NATURALEZA, 2018-2032 (USD/KG)
TABLA 1299 MERCADO DE ARROZ PARA PASTAZA, POR CONTENIDO DE ALMIDÓN, 2018-2032 (MILES DE USD)
TABLA 1300 MERCADO DE ARROZ PARA PASTAZA, POR CONTENIDO DE ALMIDÓN, 2018-2032 (TONELADAS)
TABLA 1301 MERCADO DE ARROZ PARA PASTAZA, POR CONTENIDO DE ALMIDÓN, 2018-2032 (USD/KG)
TABLA 1302 MERCADO DE ARROZ PARA PASTAZA, POR FORMA DE PROCESAMIENTO, 2018-2032 (MILES DE USD)
TABLA 1303 MERCADO DE ARROZ PARA PASTAZA, POR FORMA DE PROCESAMIENTO, 2018-2032 (TONELADAS)
TABLA 1304 MERCADO DE ARROZ PARA PASTAZA, POR FORMA DE PROCESAMIENTO, 2018-2032 (USD/KG)
TABLA 1305 MERCADO DE ARROZ PARA PASTAZA, SEGÚN GRADO DE MOLIENDA, 2018-2032 (MILES DE USD)
TABLA 1306 MERCADO DE ARROZ PARA PASTAZA, SEGÚN GRADO DE MOLIENDA, 2018-2032 (TONELADAS)
TABLA 1307 MERCADO DE ARROZ PARA PASTAZA, SEGÚN GRADO DE MOLIENDA, 2018-2032 (USD/KG)
TABLA 1308 MERCADO DE ARROZ PARA PASTAZA, POR PULIDO, 2018-2032 (MILES DE USD)
TABLA 1309 MERCADO DE ARROZ PARA PASTAZA, POR PULIDO, 2018-2032 (TONELADAS)
TABLA 1310 MERCADO DE ARROZ PARA PASTAZA, POR PULIDO, 2018-2032 (USD/KG)
TABLA 1311 MERCADO DE ARROZ PARA PASTAZA, POR FORTIFICACIÓN, 2018-2032 (MILES DE USD)
TABLA 1312 MERCADO DE ARROZ PARA PASTAZA, POR FORTIFICACIÓN, 2018-2032 (TONELADAS)
TABLA 1313 MERCADO DE ARROZ PARA PASTAZA, POR FORTIFICACIÓN, 2018-2032 (USD/KG)
TABLA 1314 MERCADO DE PASTAZA FORTIFICADA CON ARROZ, POR PROCESO, 2018-2032 (MILES DE USD)
TABLA 1315 MERCADO DE ARROZ PARA PASTAZA, POR AROMA, 2018-2032 (MILES DE USD)
TABLA 1316 MERCADO DE ARROZ PARA PASTAZA, POR AROMA, 2018-2032 (TONELADAS)
TABLA 1317 MERCADO DE ARROZ PARA PASTAZA, POR AROMA, 2018-2032 (USD/KG)
TABLA 1318 PASTAZA ARROZ AROMÁTICO EN EL MERCADO DEL ARROZ, POR TIPO, 2018-2032 (MILES DE USD)
TABLA 1319 MERCADO DE ARROZ PARA PASTAZA, POR DERIVADOS DEL ARROZ, 2018-2032 (MILES DE USD)
TABLA 1320 MERCADO DE ARROZ PARA PASTAZA, POR DERIVADOS DEL ARROZ, 2018-2032 (TONELADAS)
TABLA 1321 MERCADO DE ARROZ PARA PASTAZA, POR DERIVADOS DEL ARROZ, 2018-2032 (USD/KG)
TABLA 1322 MERCADO DE ARROZ PARA PASTAZA, POR USUARIO FINAL, 2018-2032 (MILES DE USD)
TABLA 1323 MERCADO DE ARROZ PARA PASTAZA, POR USUARIO FINAL, 2018-2032 (TONELADAS)
TABLA 1324 MERCADO DE ARROZ PARA PASTAZA, POR USUARIO FINAL, 2018-2032 (USD/KG)
TABLA 1325 PASTAZA, ALIMENTOS Y BEBIDAS EN EL MERCADO DEL ARROZ, POR TIPO, 2018-2032 (MILES DE USD)
TABLA 1326 PASTAZA EN EL MERCADO DE ARROZ, POR TIPO, 2018-2032 (MILES DE USD)
TABLA 1327 PASTAZA DE PANADERIA EN EL MERCADO DE ARROZ, POR TIPO, 2018-2032 (MILES DE USD)
TABLA 1328 PASTAZA ALIMENTOS PROCESADOS EN EL MERCADO DE ARROZ, POR TIPO, 2018-2032 (MILES DE USD)
TABLA 1329 PASTAZA CONFITERÍA EN EL MERCADO DE ARROZ, POR TIPO, 2018-2032 (MILES DE USD)
TABLA 1330 PASTAZA FÓRMULA INFANTIL EN EL MERCADO DE ARROZ, POR TIPO, 2018-2032 (MILES DE USD)
TABLA 1331 PASTAZA Y PRODUCTOS LÁCTEOS EN EL MERCADO DE ARROZ, POR TIPO, 2018-2032 (MILES DE USD)
TABLA 1332 BEBIDAS DE PASTAZA EN EL MERCADO DE ARROZ, POR TIPO, 2018-2032 (MILES DE USD)
TABLA 1333 BEBIDAS SALUDABLES DE PASTAZA EN EL MERCADO DE ARROZ, POR TIPO, 2018-2032 (MILES DE USD)
TABLA 1334 PASTAZA ALIMENTARIA EN EL MERCADO DE ARROZ, POR CATEGORÍA, 2018-2032 (MILES DE USD)
TABLA 1335 PASTAZA DE AVES EN EL MERCADO DE ARROZ, POR TIPO, 2018-2032 (MILES DE USD)
TABLA 1336 PASTAZA DE RUMIANTES EN EL MERCADO DE ARROZ, POR TIPO, 2018-2032 (MILES DE USD)
TABLA 1337 PASTAZA PORCINA EN EL MERCADO DE ARROZ, POR TIPO, 2018-2032 (MILES DE USD)
TABLA 1338 PASTAZA PET EN EL MERCADO DE ARROZ, POR TIPO, 2018-2032 (MILES DE USD)
TABLA 1339 PASTAZA ANIMAL ACUÁTICO EN EL MERCADO DE ARROZ, POR TIPO, 2018-2032 (MILES DE USD)
TABLA 1340 CRUSTÁCEOS PARA PASTAZA EN EL MERCADO DE ARROZ, POR TIPO, 2018-2032 (MILES DE USD)
TABLA 1341 PASTAZA DE PESCADO EN EL MERCADO DE ARROZ, POR TIPO, 2018-2032 (MILES DE USD)
TABLA 1342 MOLUSCOS PARA PASTAZA EN EL MERCADO DE ARROZ, POR TIPO, 2018-2032 (MILES DE USD)
TABLA 1343 PASTAZA ALIMENTARIA EN EL MERCADO DE ARROZ, POR FUNCIÓN DE SALUD, 2018-2032 (MILES DE USD)
TABLA 1344 PRODUCTOS FARMACÉUTICOS PARA PASTAZA EN EL MERCADO DE ARROZ, POR APLICACIÓN, 2018-2032 (MILES DE USD)
TABLA 1345 INFECCIONES UROGENITALES DE LA PASTAZA EN EL MERCADO DEL ARROZ, POR TIPO, 2018-2032 (MILES DE USD)
TABLA 1346 PRODUCTOS FARMACÉUTICOS PARA PASTAZA EN EL MERCADO DE ARROZ, POR FORMA DE PRODUCTO, 2018-2032 (MILES DE USD)
TABLA 1347 PASTAZA, COSMÉTICOS Y CUIDADO PERSONAL EN EL MERCADO DEL ARROZ, POR CATEGORÍA, 2018-2032 (MILES DE USD)
TABLA 1348 PRODUCTOS DE CUIDADO FACIAL DE PASTAZA EN EL MERCADO DE ARROZ, POR TIPO, 2018-2032 (MILES DE USD)
TABLA 1349 PRODUCTOS PARA EL CUIDADO DEL CABELLO DE PASTAZA EN EL MERCADO DEL ARROZ, POR TIPO, 2018-2032 (MILES DE USD)
TABLA 1350 SUPLEMENTOS DIETÉTICOS DE PASTAZA EN EL MERCADO DE ARROZ, POR TIPO, 2018-2032 (MILES DE USD)
TABLA 1351 SUPLEMENTOS DIETÉTICOS DE PASTAZA EN EL MERCADO DE ARROZ, POR FORMA DE PRODUCTO, 2018-2032 (MILES DE USD)
TABLA 1352 MERCADO DE ARROZ PARA PASTAZA, POR CANAL DE DISTRIBUCIÓN, 2018-2032 (MILES DE USD)
TABLA 1353 MERCADO DE ARROZ PARA PASTAZA, POR CANAL DE DISTRIBUCIÓN, 2018-2032 (TONELADAS)
TABLA 1354 MERCADO DE ARROZ PARA PASTAZA, POR CANAL DE DISTRIBUCIÓN, 2018-2032 (USD/KG)
TABLA 1355 PASTAZA FUERA DE LÍNEA EN EL MERCADO DE ARROZ, POR TIPO, 2018-2032 (MILES DE USD)
TABLA 1356 VENTAS MINORISTAS DE PASTAZA EN EL MERCADO DE ARROZ, POR TIPO DE CANAL, 2018-2032 (MILES DE USD)
TABLA 1357 PASTAZA EN LÍNEA EN EL MERCADO DE ARROZ, POR TIPO, 2018-2032 (MILES DE USD)
TABLA 1358 MERCADO DEL ARROZ DE PICHINCHA, POR TIPO, 2018-2032 (MILES DE USD)
CUADRO 1359 MERCADO DE ARROZ DE PICHINCHA, POR TIPO, 2018-2032 (TONELADAS)
CUADRO 1360 MERCADO DE ARROZ DE PICHINCHA, POR TIPO, 2018-2032 (USD/KG)
TABLA 1361 MERCADO DEL ARROZ DE PICHINCHA, SEGÚN COLOR DEL ARROZ, 2018-2032 (MILES DE USD)
TABLA 1362 MERCADO DEL ARROZ DE PICHINCHA, SEGÚN COLOR DEL ARROZ, 2018-2032 (TONELADAS)
TABLA 1363 MERCADO DEL ARROZ DE PICHINCHA, POR COLOR DE ARROZ, 2018-2032 (USD/KG)
TABLA 1364 MERCADO DE ARROZ PICHINCHA, POR TAMAÑO DE GRANO, 2018-2032 (MILES DE USD)
TABLA 1365 MERCADO DE ARROZ PICHINCHA, POR TAMAÑO DE GRANO, 2018-2032 (TONELADAS)
TABLA 1366 MERCADO DE ARROZ PICHINCHA, POR TAMAÑO DE GRANO, 2018-2032 (USD/KG)
TABLA 1367 MERCADO DEL ARROZ DE PICHINCHA, POR NATURALEZA, 2018-2032 (MILES DE USD)
TABLA 1368 MERCADO DEL ARROZ DE PICHINCHA, POR NATURALEZA, 2018-2032 (TONELADAS)
TABLA 1369 MERCADO DEL ARROZ DE PICHINCHA, POR NATURALEZA, 2018-2032 (USD/KG)
TABLA 1370 MERCADO DE ARROZ DE PICHINCHA, POR CONTENIDO DE ALMIDÓN, 2018-2032 (MILES DE USD)
TABLA 1371 MERCADO DE ARROZ DE PICHINCHA, POR CONTENIDO DE ALMIDÓN, 2018-2032 (TONELADAS)
TABLA 1372 MERCADO DE ARROZ DE PICHINCHA, POR CONTENIDO DE ALMIDÓN, 2018-2032 (USD/KG)
TABLA 1373 MERCADO DE ARROZ DE PICHINCHA, SEGÚN FORMA DE PROCESAMIENTO, 2018-2032 (MILES DE USD)
TABLA 1374 MERCADO DE ARROZ DE PICHINCHA, SEGÚN FORMA DE PROCESAMIENTO, 2018-2032 (TONELADAS)
CUADRO 1375 MERCADO DE ARROZ DE PICHINCHA, SEGÚN FORMA DE PROCESAMIENTO, 2018-2032 (USD/KG)
CUADRO 1376 MERCADO DE ARROZ DE PICHINCHA, SEGÚN GRADO DE MOLIENDA, 2018-2032 (MILES DE USD)
CUADRO 1377 MERCADO DEL ARROZ DE PICHINCHA, SEGÚN GRADO DE MOLIENDA, 2018-2032 (TONELADAS)
CUADRO 1378 MERCADO DE ARROZ DE PICHINCHA, SEGÚN GRADO DE MOLIENDA, 2018-2032 (USD/KG)
TABLA 1379 MERCADO DE ARROZ DE PICHINCHA, POR PULIDO, 2018-2032 (MILES DE USD)
TABLA 1380 MERCADO DE ARROZ DE PICHINCHA, POR PULIDO, 2018-2032 (TONELADAS)
TABLA 1381 MERCADO DE ARROZ PICHINCHA, POR PULIDO, 2018-2032 (USD/KG)
TABLA 1382 MERCADO DE ARROZ DE PICHINCHA, POR FORTIFICACIÓN, 2018-2032 (MILES DE USD)
TABLA 1383 MERCADO DEL ARROZ DE PICHINCHA, POR FORTIFICACIÓN, 2018-2032 (TONELADAS)
TABLA 1384 MERCADO DEL ARROZ PICHINCHA, POR FORTIFICACIÓN, 2018-2032 (USD/KG)
TABLA 1385 MERCADO DE ARROZ FORTIFICADO DE PICHINCHA, POR PROCESO, 2018-2032 (MILES DE USD)
TABLA 1386 MERCADO DEL ARROZ DE PICHINCHA, POR AROMA, 2018-2032 (MILES DE USD)
TABLA 1387 MERCADO DEL ARROZ DE PICHINCHA, POR AROMA, 2018-2032 (TONELADAS)
TABLA 1388 MERCADO DEL ARROZ DE PICHINCHA, POR AROMA, 2018-2032 (USD/KG)
TABLA 1389 ARROZ AROMÁTICO DE PICHINCHA EN EL MERCADO DE ARROZ, POR TIPO, 2018-2032 (MILES DE USD)
CUADRO 1390 MERCADO DEL ARROZ DE PICHINCHA, POR DERIVADOS DEL ARROZ, 2018-2032 (MILES DE USD)
CUADRO 1391 MERCADO DEL ARROZ DE PICHINCHA, POR DERIVADOS DEL ARROZ, 2018-2032 (TONELADAS)
CUADRO 1392 MERCADO DEL ARROZ DE PICHINCHA, POR DERIVADOS DEL ARROZ, 2018-2032 (USD/KG)
CUADRO 1393 MERCADO DE ARROZ DE PICHINCHA, POR USUARIO FINAL, 2018-2032 (MILES DE USD)
CUADRO 1394 MERCADO DE ARROZ DE PICHINCHA, POR USUARIO FINAL, 2018-2032 (TONELADAS)
CUADRO 1395 MERCADO DE ARROZ DE PICHINCHA, POR USUARIO FINAL, 2018-2032 (USD/KG)
TABLA 1396 ALIMENTOS Y BEBIDAS EN EL MERCADO DE ARROZ DE PICHINCHA, POR TIPO, 2018-2032 (MILES DE USD)
TABLA 1397 MERCADO DE ARROZ DE PICHINCHA, POR TIPO, 2018-2032 (MILES DE USD)
TABLA 1398 PANADERÍA DE PICHINCHA EN EL MERCADO DEL ARROZ, POR TIPO, 2018-2032 (USD MILES)
TABLA 1399 MERCADO DE ARROZ PROCESADO DE PICHINCHA, POR TIPO, 2018-2032 (MILES DE USD)
TABLA 1400 CONFITERÍA DE PICHINCHA EN EL MERCADO DEL ARROZ, POR TIPO, 2018-2032 (MILES DE USD)
TABLA 1401 MERCADO DE ARROZ DE FÓRMULA INFANTIL DE PICHINCHA, POR TIPO, 2018-2032 (MILES DE USD)
TABLA 1402 PRODUCTOS LÁCTEOS DE PICHINCHA EN EL MERCADO DE ARROZ, POR TIPO, 2018-2032 (MILES DE USD)
TABLA 1403 BEBIDAS DE PICHINCHA EN EL MERCADO DE ARROZ, POR TIPO, 2018-2032 (MILES DE USD)
TABLA 1404 BEBIDAS SALUDABLES DE PICHINCHA EN EL MERCADO DE ARROZ, POR TIPO, 2018-2032 (MILES DE USD)
TABLA 1405 MERCADO DE ARROZ ALIMENTICIO DE PICHINCHA, POR CATEGORÍA, 2018-2032 (MILES DE USD)
TABLA 1406 MERCADO DE AVES DE PICHINCHA EN ARROZ, POR TIPO, 2018-2032 (MILES DE USD)
TABLA 1407 RUMIANTES DE PICHINCHA EN EL MERCADO DE ARROZ, POR TIPO, 2018-2032 (MILES DE USD)
TABLA 1408 MERCADO DE ARROZ PORCINO PICHINCHA, POR TIPO, 2018-2032 (MILES DE USD)
TABLA 1409 PET DE PICHINCHA EN EL MERCADO DE ARROZ, POR TIPO, 2018-2032 (MILES DE USD)
TABLA 1410 MERCADO DE ARROZ DE ANIMALES ACUÁTICOS DE PICHINCHA, POR TIPO, 2018-2032 (MILES DE USD)
TABLA 1411 CRUSTÁCEOS DE PICHINCHA EN EL MERCADO DE ARROZ, POR TIPO, 2018-2032 (MILES DE USD)
TABLA 1412 PESCADO DE PICHINCHA EN EL MERCADO DE ARROZ, POR TIPO, 2018-2032 (MILES DE USD)
TABLA 1413 MOLUSCOS DE PICHINCHA EN EL MERCADO DE ARROZ, POR TIPO, 2018-2032 (MILES DE USD)
TABLA 1414 MERCADO DE ARROZ DE ALIMENTOS DE PICHINCHA, SEGÚN FUNCIÓN SANITARIA, 2018-2032 (MILES DE USD)
TABLA 1415 MERCADO DE FARMACÉUTICOS DE PICHINCHA EN ARROZ, POR APLICACIÓN, 2018-2032 (MILES DE USD)
TABLA 1416 INFECCIONES UROGENITALES EN EL MERCADO DE ARROZ DE PICHINCHA, POR TIPO, 2018-2032 (MILES DE USD)
TABLA 1417 MERCADO DE FARMACÉUTICOS DE PICHINCHA EN ARROZ, POR FORMA DE PRODUCTO, 2018-2032 (MILES DE USD)
TABLA 1418 MERCADO DE COSMÉTICOS Y CUIDADO PERSONAL EN ARROZ DE PICHINCHA, POR CATEGORÍA, 2018-2032 (MILES DE USD)
TABLA 1419 PRODUCTOS DE CUIDADO FACIAL EN EL MERCADO DE ARROZ DE PICHINCHA, POR TIPO, 2018-2032 (MILES DE USD)
TABLA 1420 PRODUCTOS PARA EL CUIDADO DEL CABELLO EN EL MERCADO DE ARROZ DE PICHINCHA, POR TIPO, 2018-2032 (MILES DE USD)
TABLA 1421 SUPLEMENTOS DIETÉTICOS EN EL MERCADO DE ARROZ DE PICHINCHA, POR TIPO, 2018-2032 (MILES DE USD)
TABLA 1422 SUPLEMENTOS DIETÉTICOS EN EL MERCADO DE ARROZ DE PICHINCHA, POR FORMA DE PRODUCTO, 2018-2032 (MILES DE USD)
TABLA 1423 MERCADO DEL ARROZ DE PICHINCHA, POR CANAL DE DISTRIBUCIÓN, 2018-2032 (MILES DE USD)
TABLA 1424 MERCADO DE ARROZ DE PICHINCHA, POR CANAL DE DISTRIBUCIÓN, 2018-2032 (TONELADAS)
CUADRO 1425 MERCADO DE ARROZ DE PICHINCHA, POR CANAL DE DISTRIBUCIÓN, 2018-2032 (USD/KG)
TABLA 1426 PICHINCHA FUERA DE LÍNEA EN EL MERCADO DE ARROZ, POR TIPO, 2018-2032 (MILES DE USD)
TABLA 1427 VENTAS AL POR MENOR EN EL MERCADO DE ARROZ DE PICHINCHA, POR TIPO DE CANAL, 2018-2032 (MILES DE USD)
TABLA 1428 MERCADO DE ARROZ EN LÍNEA DE PICHINCHA, POR TIPO, 2018-2032 (MILES DE USD)
TABLA 1429 MERCADO DE ARROZ DE SANTA ELENA, POR TIPO, 2018-2032 (MILES DE USD)
TABLA 1430 MERCADO DE ARROZ DE SANTA ELENA, POR TIPO, 2018-2032 (TONELADAS)
TABLA 1431 MERCADO DE ARROZ DE SANTA ELENA, POR TIPO, 2018-2032 (USD/KG)
TABLA 1432 MERCADO DE ARROZ DE SANTA ELENA, POR COLOR DE ARROZ, 2018-2032 (MILES DE USD)
TABLA 1433 MERCADO DE ARROZ DE SANTA ELENA, POR COLOR DEL ARROZ, 2018-2032 (TONELADAS)
TABLA 1434 MERCADO DE ARROZ DE SANTA ELENA, POR COLOR DEL ARROZ, 2018-2032 (USD/KG)
TABLA 1435 MERCADO DE ARROZ DE SANTA ELENA, POR TAMAÑO DE GRANO, 2018-2032 (MILES DE USD)
TABLA 1436 MERCADO DE ARROZ DE SANTA ELENA, POR TAMAÑO DE GRANO, 2018-2032 (TONELADAS)
TABLA 1437 MERCADO DE ARROZ DE SANTA ELENA, POR TAMAÑO DE GRANO, 2018-2032 (USD/KG)
TABLA 1438 MERCADO DE ARROZ DE SANTA ELENA, POR NATURALEZA, 2018-2032 (MILES DE USD)
TABLA 1439 MERCADO DE ARROZ DE SANTA ELENA, POR NATURALEZA, 2018-2032 (TONELADAS)
TABLA 1440 MERCADO DE ARROZ DE SANTA ELENA, POR NATURALEZA, 2018-2032 (USD/KG)
TABLA 1441 MERCADO DE ARROZ DE SANTA ELENA, POR CONTENIDO DE ALMIDÓN, 2018-2032 (MILES DE USD)
TABLA 1442 MERCADO DE ARROZ DE SANTA ELENA, POR CONTENIDO DE ALMIDÓN, 2018-2032 (TONELADAS)
TABLA 1443 MERCADO DE ARROZ DE SANTA ELENA, POR CONTENIDO DE ALMIDÓN, 2018-2032 (USD/KG)
TABLA 1444 MERCADO DE ARROZ DE SANTA ELENA, POR FORMA DE PROCESAMIENTO, 2018-2032 (MILES DE USD)
TABLA 1445 MERCADO DE ARROZ DE SANTA ELENA, POR FORMA DE PROCESAMIENTO, 2018-2032 (TONELADAS)
TABLA 1446 MERCADO DE ARROZ DE SANTA ELENA, POR FORMA DE PROCESAMIENTO, 2018-2032 (USD/KG)
CUADRO 1447 MERCADO DE ARROZ DE SANTA ELENA, SEGÚN GRADO DE MOLIENDA, 2018-2032 (MILES DE USD)
TABLA 1448 MERCADO DE ARROZ DE SANTA ELENA, POR GRADO DE MOLIENDA, 2018-2032 (TONELADAS)
CUADRO 1449 MERCADO DE ARROZ DE SANTA ELENA, POR GRADO DE MOLIENDA, 2018-2032 (USD/KG)
TABLA 1450 MERCADO DE ARROZ DE SANTA ELENA, POR PULIDO, 2018-2032 (MILES DE USD)
TABLA 1451 MERCADO DE ARROZ DE SANTA ELENA, POR PULIDO, 2018-2032 (TONELADAS)
TABLA 1452 MERCADO DE ARROZ DE SANTA ELENA, POR PULIDO, 2018-2032 (USD/KG)
TABLA 1453 MERCADO DE ARROZ DE SANTA ELENA, POR FORTIFICACIÓN, 2018-2032 (MILES DE USD)
TABLA 1454 MERCADO DE ARROZ DE SANTA ELENA, POR FORTIFICACIÓN, 2018-2032 (TONELADAS)
TABLA 1455 MERCADO DE ARROZ DE SANTA ELENA, POR FORTIFICACIÓN, 2018-2032 (USD/KG)
TABLA 1456 MERCADO DE ARROZ FORTIFICADO DE SANTA ELENA, POR PROCESO, 2018-2032 (MILES DE USD)
TABLA 1457 MERCADO DE ARROZ DE SANTA ELENA, POR AROMA, 2018-2032 (MILES DE USD)
TABLA 1458 MERCADO DE ARROZ DE SANTA ELENA, POR AROMA, 2018-2032 (TONELADAS)
TABLA 1459 MERCADO DEL ARROZ DE SANTA ELENA, POR AROMA, 2018-2032 (USD/KG)
TABLA 1460 ARROZ AROMÁTICO SANTA ELENA EN EL MERCADO DE ARROZ, POR TIPO, 2018-2032 (MILES DE USD)
TABLA 1461 MERCADO DE ARROZ DE SANTA ELENA, POR DERIVADOS DEL ARROZ, 2018-2032 (MILES DE USD)
TABLA 1462 MERCADO DE ARROZ DE SANTA ELENA, POR DERIVADOS DEL ARROZ, 2018-2032 (TONELADAS)
TABLA 1463 MERCADO DE ARROZ DE SANTA ELENA, POR DERIVADOS DEL ARROZ, 2018-2032 (USD/KG)
TABLA 1464 MERCADO DE ARROZ DE SANTA ELENA, POR USUARIO FINAL, 2018-2032 (MILES DE USD)
TABLA 1465 MERCADO DE ARROZ DE SANTA ELENA, POR USUARIO FINAL, 2018-2032 (TONELADAS)
TABLA 1466 MERCADO DE ARROZ DE SANTA ELENA, POR USUARIO FINAL, 2018-2032 (USD/KG)
TABLA 1467 MERCADO DE ALIMENTOS Y BEBIDAS EN ARROZ DE SANTA ELENA, POR TIPO, 2018-2032 (MILES DE USD)
TABLA 1468 MERCADO DE ARROZ EN SANTA ELENA, POR TIPO, 2018-2032 (MILES DE USD)
TABLA 1469 PANADERÍA SANTA ELENA EN EL MERCADO DEL ARROZ, POR TIPO, 2018-2032 (MILES DE USD)
TABLA 1470 MERCADO DE ARROZ PROCESADO DE SANTA ELENA, POR TIPO, 2018-2032 (MILES DE USD)
TABLA 1471 CONFITERÍA SANTA ELENA EN EL MERCADO DE ARROZ, POR TIPO, 2018-2032 (MILES DE USD)
TABLA 1472 FÓRMULA INFANTIL DE SANTA ELENA EN EL MERCADO DE ARROZ, POR TIPO, 2018-2032 (MILES DE USD)
TABLA 1473 PRODUCTOS LÁCTEOS EN EL MERCADO DE ARROZ DE SANTA ELENA, POR TIPO, 2018-2032 (MILES DE USD)
TABLA 1474 BEBIDAS EN EL MERCADO DE ARROZ DE SANTA ELENA, POR TIPO, 2018-2032 (MILES DE USD)
TABLA 1475 BEBIDAS SALUDABLES EN EL MERCADO DE ARROZ DE SANTA ELENA, POR TIPO, 2018-2032 (MILES DE USD)
TABLA 1476 MERCADO DE ARROZ ALIMENTICIO DE SANTA ELENA, POR CATEGORÍA, 2018-2032 (MILES DE USD)
TABLA 1477 MERCADO DE AVES DE CORRAL EN ARROZ DE SANTA ELENA, POR TIPO, 2018-2032 (MILES DE USD)
TABLA 1478 RUMIANTES EN EL MERCADO DE ARROZ DE SANTA ELENA, POR TIPO, 2018-2032 (MILES DE USD)
TABLA 1479 MERCADO DE ARROZ PORCINO DE SANTA ELENA, POR TIPO, 2018-2032 (MILES DE USD)
TABLA 1480 PET EN EL MERCADO DE ARROZ DE SANTA ELENA, POR TIPO, 2018-2032 (MILES DE USD)
TABLA 1481 MERCADO DE ARROZ DE ANIMALES ACUÁTICOS DE SANTA ELENA, POR TIPO, 2018-2032 (MILES DE USD)
TABLA 1482 CRUSTÁCEOS DE SANTA ELENA EN EL MERCADO DE ARROZ, POR TIPO, 2018-2032 (MILES DE USD)
TABLA 1483 PESCADO EN EL MERCADO DE ARROZ DE SANTA ELENA, POR TIPO, 2018-2032 (MILES DE USD)
TABLA 1484 MOLUSCOS DE SANTA ELENA EN EL MERCADO DE ARROZ, POR TIPO, 2018-2032 (MILES DE USD)
TABLA 1485 MERCADO DE ARROZ ALIMENTICIO DE SANTA ELENA, POR FUNCIÓN DE SALUD, 2018-2032 (MILES DE USD)
TABLA 1486 PRODUCTOS FARMACÉUTICOS DE SANTA ELENA EN EL MERCADO DE ARROZ, POR APLICACIÓN, 2018-2032 (MILES DE USD)
TABLA 1487 INFECCIONES UROGENITALES EN EL MERCADO DE ARROZ DE SANTA ELENA, POR TIPO, 2018-2032 (MILES DE USD)
TABLA 1488 PRODUCTOS FARMACÉUTICOS EN EL MERCADO DE ARROZ DE SANTA ELENA, POR FORMA DE PRODUCTO, 2018-2032 (MILES DE USD)
TABLA 1489 COSMÉTICOS Y CUIDADO PERSONAL EN EL MERCADO DE ARROZ DE SANTA ELENA, POR CATEGORÍA, 2018-2032 (MILES DE USD)
TABLA 1490 PRODUCTOS DE CUIDADO FACIAL EN EL MERCADO DE ARROZ DE SANTA ELENA, POR TIPO, 2018-2032 (MILES DE USD)
TABLA 1491 PRODUCTOS PARA EL CUIDADO DEL CABELLO EN EL MERCADO DE ARROZ DE SANTA ELENA, POR TIPO, 2018-2032 (MILES DE USD)
TABLA 1492 SUPLEMENTOS DIETÉTICOS EN EL MERCADO DE ARROZ DE SANTA ELENA, POR TIPO, 2018-2032 (MILES DE USD)
TABLA 1493 SUPLEMENTOS DIETÉTICOS EN EL MERCADO DE ARROZ DE SANTA ELENA, POR FORMA DE PRODUCTO, 2018-2032 (MILES DE USD)
TABLA 1494 MERCADO DE ARROZ DE SANTA ELENA, POR CANAL DE DISTRIBUCIÓN, 2018-2032 (MILES DE USD)
TABLA 1495 MERCADO DE ARROZ DE SANTA ELENA, POR CANAL DE DISTRIBUCIÓN, 2018-2032 (TONELADAS)
TABLA 1496 MERCADO DE ARROZ DE SANTA ELENA, POR CANAL DE DISTRIBUCIÓN, 2018-2032 (USD/KG)
TABLA 1497 SANTA ELENA FUERA DE LÍNEA EN EL MERCADO DE ARROZ, POR TIPO, 2018-2032 (MILES DE USD)
TABLA 1498 VENTAS MINORISTAS EN EL MERCADO DE ARROZ DE SANTA ELENA, POR TIPO DE CANAL, 2018-2032 (MILES DE USD)
TABLA 1499 MERCADO DE ARROZ EN LÍNEA DE SANTA ELENA, POR TIPO, 2018-2032 (MILES DE USD)
TABLA 1500 MERCADO DE ARROZ DE SANTO DOMINGO DE LOS TSÁCHILAS, POR TIPO, 2018-2032 (MILES DE USD)
CUADRO 1501 MERCADO DEL ARROZ DE SANTO DOMINGO DE LOS TSÁCHILAS, POR TIPO, 2018-2032 (TONELADAS)
CUADRO 1502 MERCADO DEL ARROZ DE SANTO DOMINGO DE LOS TSÁCHILAS, POR TIPO, 2018-2032 (USD/KG)
TABLA 1503 MERCADO DE ARROZ DE SANTO DOMINGO DE LOS TSÁCHILAS, POR COLOR DE ARROZ, 2018-2032 (MILES DE USD)
CUADRO 1504 MERCADO DEL ARROZ DE SANTO DOMINGO DE LOS TSÁCHILAS, POR COLOR DE ARROZ, 2018-2032 (TONELADAS)
CUADRO 1505 MERCADO DEL ARROZ DE SANTO DOMINGO DE LOS TSÁCHILAS, POR COLOR DE ARROZ, 2018-2032 (USD/KG)
TABLA 1506 MERCADO DE ARROZ DE SANTO DOMINGO DE LOS TSÁCHILAS, POR TAMAÑO DE GRANO, 2018-2032 (MILES DE USD)
TABLA 1507 MERCADO DE ARROZ DE SANTO DOMINGO DE LOS TSÁCHILAS, POR TAMAÑO DE GRANO, 2018-2032 (TONELADAS)
TABLA 1508 MERCADO DE ARROZ DE SANTO DOMINGO DE LOS TSÁCHILAS, POR TAMAÑO DE GRANO, 2018-2032 (USD/KG)
TABLA 1509 MERCADO DE ARROZ DE SANTO DOMINGO DE LOS TSÁCHILAS, POR NATURALEZA, 2018-2032 (MILES DE USD)
CUADRO 1510 MERCADO DEL ARROZ DE SANTO DOMINGO DE LOS TSÁCHILAS, POR NATURALEZA, 2018-2032 (TONELADAS)
CUADRO 1511 MERCADO DEL ARROZ DE SANTO DOMINGO DE LOS TSÁCHILAS, POR NATURALEZA, 2018-2032 (USD/KG)
TABLA 1512 MERCADO DE ARROZ DE SANTO DOMINGO DE LOS TSÁCHILAS, POR CONTENIDO DE ALMIDÓN, 2018-2032 (MILES DE USD)
CUADRO 1513 MERCADO DE ARROZ DE SANTO DOMINGO DE LOS TSÁCHILAS, POR CONTENIDO DE ALMIDÓN, 2018-2032 (TONELADAS)
CUADRO 1514 MERCADO DE ARROZ DE SANTO DOMINGO DE LOS TSÁCHILAS, POR CONTENIDO DE ALMIDÓN, 2018-2032 (USD/KG)
TABLA 1515 MERCADO DE ARROZ DE SANTO DOMINGO DE LOS TSÁCHILAS, POR FORMA DE PROCESAMIENTO, 2018-2032 (MILES DE USD)
TABLA 1516 MERCADO DE ARROZ DE SANTO DOMINGO DE LOS TSÁCHILAS, POR FORMA DE PROCESAMIENTO, 2018-2032 (TONELADAS)
TABLA 1517 MERCADO DE ARROZ DE SANTO DOMINGO DE LOS TSÁCHILAS, POR FORMA DE PROCESAMIENTO, 2018-2032 (USD/KG)
TABLA 1518 MERCADO DE ARROZ DE SANTO DOMINGO DE LOS TSÁCHILAS, SEGÚN GRADO DE MOLIENDA, 2018-2032 (MILES DE USD)
TABLA 1519 MERCADO DE ARROZ DE SANTO DOMINGO DE LOS TSÁCHILAS, SEGÚN GRADO DE MOLIENDA, 2018-2032 (TONELADAS)
CUADRO 1520 MERCADO DEL ARROZ DE SANTO DOMINGO DE LOS TSÁCHILAS, POR GRADO DE MOLIENDA, 2018-2032 (USD/KG)
CUADRO 1521 MERCADO DEL ARROZ DE SANTO DOMINGO DE LOS TSÁCHILAS, POR PULIDO, 2018-2032 (MILES DE USD)
CUADRO 1522 MERCADO DEL ARROZ DE SANTO DOMINGO DE LOS TSÁCHILAS, POR PULIDO, 2018-2032 (TONELADAS)
CUADRO 1523 MERCADO DEL ARROZ DE SANTO DOMINGO DE LOS TSÁCHILAS, POR PULIDO, 2018-2032 (USD/KG)
TABLA 1524 MERCADO DE ARROZ DE SANTO DOMINGO DE LOS TSÁCHILAS, POR FORTIFICACIÓN, 2018-2032 (MILES DE USD)
CUADRO 1525 MERCADO DEL ARROZ DE SANTO DOMINGO DE LOS TSÁCHILAS, POR FORTIFICACIÓN, 2018-2032 (TONELADAS)
CUADRO 1526 MERCADO DEL ARROZ DE SANTO DOMINGO DE LOS TSÁCHILAS, POR FORTIFICACIÓN, 2018-2032 (USD/KG)
TABLA 1527 MERCADO DE ARROZ FORTIFICADO DE SANTO DOMINGO DE LOS TSÁCHILAS, POR PROCESO, 2018-2032 (MILES DE USD)
CUADRO 1528 MERCADO DEL ARROZ DE SANTO DOMINGO DE LOS TSÁCHILAS, POR AROMA, 2018-2032 (MILES DE USD)
CUADRO 1529 MERCADO DEL ARROZ DE SANTO DOMINGO DE LOS TSÁCHILAS, POR AROMA, 2018-2032 (TONELADAS)
CUADRO 1530 MERCADO DEL ARROZ DE SANTO DOMINGO DE LOS TSÁCHILAS, POR AROMA, 2018-2032 (USD/KG)
TABLA 1531 ARROZ AROMÁTICO DE SANTO DOMINGO DE LOS TSÁCHILAS EN EL MERCADO DE ARROZ, POR TIPO, 2018-2032 (MILES DE USD)
CUADRO 1532 MERCADO DEL ARROZ DE SANTO DOMINGO DE LOS TSÁCHILAS, POR DERIVADOS DEL ARROZ, 2018-2032 (MILES DE USD)
CUADRO 1533 MERCADO DEL ARROZ DE SANTO DOMINGO DE LOS TSÁCHILAS, POR DERIVADOS DEL ARROZ, 2018-2032 (TONELADAS)
CUADRO 1534 MERCADO DEL ARROZ DE SANTO DOMINGO DE LOS TSÁCHILAS, POR DERIVADOS DEL ARROZ, 2018-2032 (USD/KG)
TABLA 1535 MERCADO DE ARROZ DE SANTO DOMINGO DE LOS TSÁCHILAS, POR USUARIO FINAL, 2018-2032 (MILES DE USD)
CUADRO 1536 MERCADO DEL ARROZ DE SANTO DOMINGO DE LOS TSÁCHILAS, POR USUARIO FINAL, 2018-2032 (TONELADAS)
CUADRO 1537 MERCADO DEL ARROZ DE SANTO DOMINGO DE LOS TSÁCHILAS, POR USUARIO FINAL, 2018-2032 (USD/KG)
TABLA 1538 SANTO DOMINGO DE LOS TSÁCHILAS ALIMENTOS Y BEBIDAS EN EL MERCADO DE ARROZ, POR TIPO, 2018-2032 (MILES DE USD)
TABLA 1539 SANTO DOMINGO DE LOS TSÁCHILAS MERCADO DE ALIMENTOS EN ARROZ, POR TIPO, 2018-2032 (MILES DE USD)
TABLA 1540 PANADERÍA DE SANTO DOMINGO DE LOS TSÁCHILAS EN EL MERCADO DEL ARROZ, POR TIPO, 2018-2032 (MILES DE USD)
TABLA 1541 SANTO DOMINGO DE LOS TSÁCHILAS MERCADO DE ALIMENTOS PROCESADOS EN ARROZ, POR TIPO, 2018-2032 (MILES DE USD)
TABLA 1542 CONFITERÍA DE SANTO DOMINGO DE LOS TSÁCHILAS EN EL MERCADO DE ARROZ, POR TIPO, 2018-2032 (MILES DE USD)
TABLA 1543 SANTO DOMINGO DE LOS TSÁCHILAS MERCADO DE ARROZ, POR TIPO, 2018-2032 (MILES DE USD)
TABLA 1544 PRODUCTOS LÁCTEOS EN EL MERCADO DE ARROZ DE SANTO DOMINGO DE LOS TSÁCHILAS, POR TIPO, 2018-2032 (MILES DE USD)
TABLA 1545 BEBIDAS EN EL MERCADO DE ARROZ DE SANTO DOMINGO DE LOS TSÁCHILAS, POR TIPO, 2018-2032 (MILES DE USD)
TABLA 1546 BEBIDAS SALUDABLES EN EL MERCADO DE ARROZ DE SANTO DOMINGO DE LOS TSÁCHILAS, POR TIPO, 2018-2032 (MILES DE USD)
TABLA 1547 MERCADO DE ARROZ ALIMENTICIO EN SANTO DOMINGO DE LOS TSÁCHILAS, POR CATEGORÍA, 2018-2032 (MILES DE USD)
TABLA 1548 AVES DE CORRAL EN EL MERCADO DE ARROZ DE SANTO DOMINGO DE LOS TSÁCHILAS, POR TIPO, 2018-2032 (MILES DE USD)
TABLA 1549 SANTO DOMINGO DE LOS TSÁCHILAS RUMIANTES EN EL MERCADO DE ARROZ, POR TIPO, 2018-2032 (MILES DE USD)
TABLA 1550 CERDO EN EL MERCADO DE ARROZ DE SANTO DOMINGO DE LOS TSÁCHILAS, POR TIPO, 2018-2032 (MILES DE USD)
TABLA 1551 SANTO DOMINGO DE LOS TSÁCHILAS PET EN EL MERCADO DE ARROZ, POR TIPO, 2018-2032 (MILES DE USD)
TABLA 1552 SANTO DOMINGO DE LOS TSÁCHILAS MERCADO DE ARROZ ANIMAL ACUÁTICO, POR TIPO, 2018-2032 (MILES DE USD)
TABLA 1553 CRUSTÁCEOS EN EL MERCADO DE ARROZ DE SANTO DOMINGO DE LOS TSÁCHILAS, POR TIPO, 2018-2032 (MILES DE USD)
TABLA 1554 PESCADO EN EL MERCADO DE ARROZ DE SANTO DOMINGO DE LOS TSÁCHILAS, POR TIPO, 2018-2032 (MILES DE USD)
TABLA 1555 MOLUSCOS EN EL MERCADO DE ARROZ DE SANTO DOMINGO DE LOS TSÁCHILAS, POR TIPO, 2018-2032 (MILES DE USD)
TABLA 1556 MERCADO DE ARROZ ALIMENTICIO EN SANTO DOMINGO DE LOS TSÁCHILAS, POR FUNCIÓN DE SALUD, 2018-2032 (MILES DE USD)
TABLA 1557 MERCADO DE PRODUCTOS FARMACÉUTICOS EN ARROZ DE SANTO DOMINGO DE LOS TSÁCHILAS, POR APLICACIÓN, 2018-2032 (MILES DE USD)
TABLA 1558 INFECCIONES UROGENITALES EN EL MERCADO DE ARROZ DE SANTO DOMINGO DE LOS TSÁCHILAS, POR TIPO, 2018-2032 (MILES DE USD)
TABLA 1559 MERCADO DE PRODUCTOS FARMACÉUTICOS EN ARROZ DE SANTO DOMINGO DE LOS TSÁCHILAS, POR FORMA DE PRODUCTO, 2018-2032 (MILES DE USD)
TABLA 1560 MERCADO DE COSMÉTICOS Y CUIDADO PERSONAL EN ARROZ DE SANTO DOMINGO DE LOS TSÁCHILAS, POR CATEGORÍA, 2018-2032 (MILES DE USD)
TABLA 1561 PRODUCTOS DE CUIDADO FACIAL EN EL MERCADO DE ARROZ DE SANTO DOMINGO DE LOS TSÁCHILAS, POR TIPO, 2018-2032 (MILES DE USD)
TABLA 1562 PRODUCTOS PARA EL CUIDADO DEL CABELLO EN EL MERCADO DE ARROZ DE SANTO DOMINGO DE LOS TSÁCHILAS, POR TIPO, 2018-2032 (MILES DE USD)
TABLA 1563 SUPLEMENTOS DIETÉTICOS EN EL MERCADO DE ARROZ DE SANTO DOMINGO DE LOS TSÁCHILAS, POR TIPO, 2018-2032 (MILES DE USD)
TABLA 1564 SUPLEMENTOS DIETÉTICOS EN EL MERCADO DE ARROZ DE SANTO DOMINGO DE LOS TSÁCHILAS, POR FORMA DE PRODUCTO, 2018-2032 (MILES DE USD)
TABLA 1565 MERCADO DE ARROZ DE SANTO DOMINGO DE LOS TSÁCHILAS, POR CANAL DE DISTRIBUCIÓN, 2018-2032 (MILES DE USD)
CUADRO 1566 MERCADO DEL ARROZ DE SANTO DOMINGO DE LOS TSÁCHILAS, POR CANAL DE DISTRIBUCIÓN, 2018-2032 (TONELADAS)
CUADRO 1567 MERCADO DEL ARROZ DE SANTO DOMINGO DE LOS TSÁCHILAS, POR CANAL DE DISTRIBUCIÓN, 2018-2032 (USD/KG)
TABLA 1568 SANTO DOMINGO DE LOS TSÁCHILAS FUERA DE LÍNEA EN EL MERCADO DE ARROZ, POR TIPO, 2018-2032 (MILES DE USD)
TABLA 1569 VENTAS AL POR MENOR EN EL MERCADO DE ARROZ DE SANTO DOMINGO DE LOS TSÁCHILAS, POR TIPO DE CANAL, 2018-2032 (MILES DE USD)
TABLA 1570 SANTO DOMINGO DE LOS TSÁCHILAS EN LÍNEA EN EL MERCADO DE ARROZ, POR TIPO, 2018-2032 (MILES DE USD)
TABLA 1571 MERCADO DE ARROZ DE SUCUMBÍOS, POR TIPO, 2018-2032 (MILES DE USD)
TABLA 1572 MERCADO DE ARROZ DE SUCUMBÍOS, POR TIPO, 2018-2032 (TONELADAS)
TABLA 1573 MERCADO DE ARROZ DE SUCUMBÍOS, POR TIPO, 2018-2032 (USD/KG)
TABLA 1574 MERCADO DE ARROZ DE SUCUMBÍOS, POR COLOR DE ARROZ, 2018-2032 (MILES DE USD)
TABLA 1575 MERCADO DE ARROZ DE SUCUMBÍOS, POR COLOR DE ARROZ, 2018-2032 (TONELADAS)
TABLA 1576 MERCADO DE ARROZ DE SUCUMBÍOS, POR COLOR DE ARROZ, 2018-2032 (USD/KG)
TABLA 1577 MERCADO DE ARROZ SUCUMBÍOS, POR TAMAÑO DE GRANO, 2018-2032 (MILES DE USD)
TABLA 1578 MERCADO DE ARROZ SUCUMBÍOS, POR TAMAÑO DE GRANO, 2018-2032 (TONELADAS)
TABLA 1579 MERCADO DE ARROZ SUCUMBÍOS, POR TAMAÑO DE GRANO, 2018-2032 (USD/KG)
TABLA 1580 MERCADO DE ARROZ DE SUCUMBÍOS, POR NATURALEZA, 2018-2032 (MILES DE USD)
TABLA 1581 MERCADO DE ARROZ DE SUCUMBÍOS, POR NATURALEZA, 2018-2032 (TONELADAS)
TABLA 1582 MERCADO DE ARROZ DE SUCUMBÍOS, POR NATURALEZA, 2018-2032 (USD/KG)
TABLA 1583 MERCADO DE ARROZ DE SUCUMBÍOS, POR CONTENIDO DE ALMIDÓN, 2018-2032 (MILES DE USD)
TABLA 1584 MERCADO DE ARROZ DE SUCUMBÍOS, POR CONTENIDO DE ALMIDÓN, 2018-2032 (TONELADAS)
TABLA 1585 MERCADO DE ARROZ SUCUMBÍOS, POR CONTENIDO DE ALMIDÓN, 2018-2032 (USD/KG)
CUADRO 1586 MERCADO DE ARROZ DE SUCUMBÍOS, SEGÚN FORMA DE PROCESAMIENTO, 2018-2032 (MILES DE USD)
TABLA 1587 MERCADO DE ARROZ DE SUCUMBÍOS, POR FORMA DE PROCESAMIENTO, 2018-2032 (TONELADAS)
CUADRO 1588 MERCADO DE ARROZ DE SUCUMBÍOS, POR FORMA DE PROCESAMIENTO, 2018-2032 (USD/KG)
CUADRO 1589 MERCADO DE ARROZ DE SUCUMBÍOS, SEGÚN GRADO DE MOLIENDA, 2018-2032 (MILES DE USD)
CUADRO 1590 MERCADO DE ARROZ DE SUCUMBÍOS, SEGÚN GRADO DE MOLIENDA, 2018-2032 (TONELADAS)
CUADRO 1591 MERCADO DE ARROZ DE SUCUMBÍOS, SEGÚN GRADO DE MOLIENDA, 2018-2032 (USD/KG)
TABLA 1592 MERCADO DE ARROZ DE SUCUMBÍOS, POR PULIDO, 2018-2032 (MILES DE USD)
TABLA 1593 MERCADO DE ARROZ DE SUCUMBÍOS, POR PULIDO, 2018-2032 (TONELADAS)
TABLA 1594 MERCADO DE ARROZ SUCUMBÍOS, POR PULIDO, 2018-2032 (USD/KG)
TABLA 1595 MERCADO DE ARROZ DE SUCUMBÍOS, POR FORTIFICACIÓN, 2018-2032 (MILES DE USD)
TABLA 1596 MERCADO DE ARROZ DE SUCUMBÍOS, POR FORTIFICACIÓN, 2018-2032 (TONELADAS)
TABLA 1597 MERCADO DE ARROZ SUCUMBÍOS, POR FORTIFICACIÓN, 2018-2032 (USD/KG)
TABLA 1598 MERCADO DE ARROZ FORTIFICADO DE SUCUMBÍOS, POR PROCESO, 2018-2032 (MILES DE USD)
TABLA 1599 MERCADO DE ARROZ DE SUCUMBÍOS, POR AROMA, 2018-2032 (MILES DE USD)
TABLA 1600 MERCADO DE ARROZ DE SUCUMBÍOS, POR AROMA, 2018-2032 (TONELADAS)
TABLA 1601 MERCADO DE ARROZ SUCUMBÍOS, POR AROMA, 2018-2032 (USD/KG)
TABLA 1602 ARROZ SUCUMBÍOS AROMÁTICO EN EL MERCADO DE ARROZ, POR TIPO, 2018-2032 (MILES DE USD)
TABLA 1603 MERCADO DE ARROZ DE SUCUMBÍOS, POR DERIVADOS DEL ARROZ, 2018-2032 (MILES DE USD)
CUADRO 1604 MERCADO DE ARROZ DE SUCUMBÍOS, POR DERIVADOS DEL ARROZ, 2018-2032 (TONELADAS)
TABLA 1605 MERCADO DE ARROZ DE SUCUMBÍOS, POR DERIVADOS DEL ARROZ, 2018-2032 (USD/KG)
CUADRO 1606 MERCADO DE ARROZ DE SUCUMBÍOS, POR USUARIO FINAL, 2018-2032 (MILES DE USD)
CUADRO 1607 MERCADO DE ARROZ DE SUCUMBÍOS, POR USUARIO FINAL, 2018-2032 (TONELADAS)
CUADRO 1608 MERCADO DE ARROZ DE SUCUMBÍOS, POR USUARIO FINAL, 2018-2032 (USD/KG)
TABLA 1609 ALIMENTOS Y BEBIDAS EN EL MERCADO DE ARROZ DE SUCUMBÍOS, POR TIPO, 2018-2032 (MILES DE USD)
TABLA 1610 MERCADO DE ARROZ EN SUCUMBÍOS, POR TIPO, 2018-2032 (MILES DE USD)
TABLA 1611 PANADERÍA SUCUMBÍOS EN EL MERCADO DEL ARROZ, POR TIPO, 2018-2032 (MILES DE USD)
TABLA 1612 MERCADO DE ALIMENTOS PROCESADOS EN ARROZ DE SUCUMBÍOS, POR TIPO, 2018-2032 (MILES DE USD)
TABLA 1613 CONFITERÍA DE SUCUMBÍOS EN EL MERCADO DE ARROZ, POR TIPO, 2018-2032 (MILES DE USD)
TABLA 1614 FÓRMULAS INFANTILES SUCUMBÍOS EN EL MERCADO DE ARROZ, POR TIPO, 2018-2032 (MILES DE USD)
TABLA 1615 PRODUCTOS LÁCTEOS SUCUMBÍOS EN EL MERCADO DE ARROZ, POR TIPO, 2018-2032 (MILES DE USD)
TABLA 1616 BEBIDAS DE SUCUMBÍOS EN EL MERCADO DE ARROZ, POR TIPO, 2018-2032 (MILES DE USD)
TABLA 1617 BEBIDAS SALUDABLES SUCUMBÍOS EN EL MERCADO DE ARROZ, POR TIPO, 2018-2032 (MILES DE USD)
TABLA 1618 ALIMENTO DE SUCUMBÍOS EN EL MERCADO DE ARROZ, POR CATEGORÍA, 2018-2032 (MILES DE USD)
TABLA 1619 AVES DE SUCUMBÍOS EN EL MERCADO DE ARROZ, POR TIPO, 2018-2032 (MILES DE USD)
TABLA 1620 SUCUMBÍOS RUMIANTES EN EL MERCADO DE ARROZ, POR TIPO, 2018-2032 (MILES DE USD)
TABLA 1621 CERDOS SUCUMBÍOS EN EL MERCADO DE ARROZ, POR TIPO, 2018-2032 (MILES DE USD)
TABLA 1622 SUCUMBÍOS PET EN EL MERCADO DE ARROZ, POR TIPO, 2018-2032 (MILES DE USD)
TABLA 1623 SUCUMBÍOS ANIMAL ACUÁTICO EN EL MERCADO DE ARROZ, POR TIPO, 2018-2032 (MILES DE USD)
TABLA 1624 CRUSTÁCEOS SUCUMBÍOS EN EL MERCADO DE ARROZ, POR TIPO, 2018-2032 (MILES DE USD)
TABLA 1625 PESCADOS SUCUMBÍOS EN EL MERCADO DE ARROZ, POR TIPO, 2018-2032 (MILES DE USD)
TABLA 1626 MOLUSCOS SUCUMBÍOS EN EL MERCADO DE ARROZ, POR TIPO, 2018-2032 (MILES DE USD)
TABLA 1627 ALIMENTO PARA SUCUMBÍOS EN EL MERCADO DE ARROZ, POR FUNCIÓN SANITARIA, 2018-2032 (MILES DE USD)
TABLA 1628 PRODUCTOS FARMACÉUTICOS SUCUMBÍOS EN EL MERCADO DE ARROZ, POR APLICACIÓN, 2018-2032 (MILES DE USD)
TABLA 1629 INFECCIONES UROGENTALES POR SUCUMBÍOS EN EL MERCADO DE ARROZ, POR TIPO, 2018-2032 (MILES DE USD)
TABLA 1630 PRODUCTOS FARMACÉUTICOS SUCUMBÍOS EN EL MERCADO DE ARROZ, POR FORMA DE PRODUCTO, 2018-2032 (MILES DE USD)
TABLA 1631 MERCADO DE COSMÉTICOS Y CUIDADO PERSONAL EN ARROZ, POR CATEGORÍA, 2018-2032 (MILES DE USD)
TABLA 1632 PRODUCTOS DE CUIDADO FACIAL DE SUCUMBÍOS EN EL MERCADO DE ARROZ, POR TIPO, 2018-2032 (MILES DE USD)
TABLA 1633 PRODUCTOS PARA EL CUIDADO DEL CABELLO EN EL MERCADO DEL ARROZ DE SUCUMBÍOS, POR TIPO, 2018-2032 (MILES DE USD)
TABLA 1634 SUPLEMENTOS DIETÉTICOS DE SUCUMBÍOS EN EL MERCADO DE ARROZ, POR TIPO, 2018-2032 (MILES DE USD)
TABLA 1635 SUPLEMENTOS DIETÉTICOS DE SUCUMBÍOS EN EL MERCADO DE ARROZ, POR FORMA DE PRODUCTO, 2018-2032 (MILES DE USD)
TABLA 1636 MERCADO DE ARROZ DE SUCUMBÍOS, POR CANAL DE DISTRIBUCIÓN, 2018-2032 (MILES DE USD)
TABLA 1637 MERCADO DE ARROZ DE SUCUMBÍOS, POR CANAL DE DISTRIBUCIÓN, 2018-2032 (TONELADAS)
CUADRO 1638 MERCADO DE ARROZ DE SUCUMBÍOS, POR CANAL DE DISTRIBUCIÓN, 2018-2032 (USD/KG)
TABLA 1639 SUCUMBÍOS FUERA DE LÍNEA EN EL MERCADO DE ARROZ, POR TIPO, 2018-2032 (MILES DE USD)
TABLA 1640 VENTAS AL POR MENOR DE SUCUMBÍOS EN EL MERCADO DE ARROZ, POR TIPO DE CANAL, 2018-2032 (MILES DE USD)
TABLA 1641 SUCUMBÍOS EN LÍNEA EN EL MERCADO DE ARROZ, POR TIPO, 2018-2032 (MILES DE USD)
TABLA 1642 MERCADO DE ARROZ DE TUNGURAHUA, POR TIPO, 2018-2032 (MILES DE USD)
TABLA 1643 MERCADO DE ARROZ DE TUNGURAHUA, POR TIPO, 2018-2032 (TONELADAS)
TABLA 1644 MERCADO DE ARROZ DE TUNGURAHUA, POR TIPO, 2018-2032 (USD/KG)
TABLA 1645 MERCADO DE ARROZ DE TUNGURAHUA, POR COLOR DE ARROZ, 2018-2032 (MILES DE USD)
TABLA 1646 MERCADO DE ARROZ DE TUNGURAHUA, POR COLOR DE ARROZ, 2018-2032 (TONELADAS)
TABLA 1647 MERCADO DE ARROZ DE TUNGURAHUA, POR COLOR DE ARROZ, 2018-2032 (USD/KG)
TABLA 1648 MERCADO DE ARROZ DE TUNGURAHUA, POR TAMAÑO DE GRANO, 2018-2032 (MILES DE USD)
TABLA 1649 MERCADO DE ARROZ DE TUNGURAHUA, POR TAMAÑO DE GRANO, 2018-2032 (TONELADAS)
TABLA 1650 MERCADO DE ARROZ DE TUNGURAHUA, POR TAMAÑO DE GRANO, 2018-2032 (USD/KG)
TABLA 1651 MERCADO DE ARROZ DE TUNGURAHUA, POR NATURALEZA, 2018-2032 (MILES DE USD)
TABLA 1652 MERCADO DE ARROZ DE TUNGURAHUA, POR NATURALEZA, 2018-2032 (TONELADAS)
TABLA 1653 MERCADO DE ARROZ DE TUNGURAHUA, POR NATURALEZA, 2018-2032 (USD/KG)
TABLA 1654 MERCADO DE ARROZ DE TUNGURAHUA, POR CONTENIDO DE ALMIDÓN, 2018-2032 (MILES DE USD)
TABLA 1655 MERCADO DE ARROZ DE TUNGURAHUA, POR CONTENIDO DE ALMIDÓN, 2018-2032 (TONELADAS)
TABLA 1656 MERCADO DE ARROZ DE TUNGURAHUA, POR CONTENIDO DE ALMIDÓN, 2018-2032 (USD/KG)
TABLA 1657 MERCADO DE ARROZ DE TUNGURAHUA, POR FORMA DE PROCESAMIENTO, 2018-2032 (MILES DE USD)
TABLA 1658 MERCADO DE ARROZ DE TUNGURAHUA, POR FORMA DE PROCESAMIENTO, 2018-2032 (TONELADAS)
TABLA 1659 MERCADO DE ARROZ DE TUNGURAHUA, POR FORMA DE PROCESAMIENTO, 2018-2032 (USD/KG)
TABLA 1660 MERCADO DE ARROZ DE TUNGURAHUA, POR GRADO DE MOLIENDA, 2018-2032 (MILES DE USD)
TABLA 1661 MERCADO DE ARROZ DE TUNGURAHUA, POR GRADO DE MOLIENDA, 2018-2032 (TONELADAS)
TABLA 1662 MERCADO DE ARROZ DE TUNGURAHUA, POR GRADO DE MOLIENDA, 2018-2032 (USD/KG)
TABLA 1663 MERCADO DE ARROZ DE TUNGURAHUA, POR PULIDO, 2018-2032 (MILES DE USD)
TABLA 1664 MERCADO DE ARROZ DE TUNGURAHUA, POR PULIDO, 2018-2032 (TONELADAS)
TABLA 1665 MERCADO DE ARROZ DE TUNGURAHUA, POR PULIDO, 2018-2032 (USD/KG)
TABLA 1666 MERCADO DE ARROZ DE TUNGURAHUA, POR FORTIFICACIÓN, 2018-2032 (MILES DE USD)
TABLA 1667 MERCADO DE ARROZ DE TUNGURAHUA, POR FORTIFICACIÓN, 2018-2032 (TONELADAS)
TABLA 1668 MERCADO DEL ARROZ DE TUNGURAHUA, POR FORTIFICACIÓN, 2018-2032 (USD/KG)
TABLA 1669 MERCADO DE ARROZ FORTIFICADO DE TUNGURAHUA, POR PROCESO, 2018-2032 (MILES DE USD)
TABLA 1670 MERCADO DE ARROZ DE TUNGURAHUA, POR AROMA, 2018-2032 (MILES DE USD)
TABLA 1671 MERCADO DE ARROZ DE TUNGURAHUA, POR AROMA, 2018-2032 (TONELADAS)
TABLA 1672 MERCADO DE ARROZ DE TUNGURAHUA, POR AROMA, 2018-2032 (USD/KG)
TABLA 1673 ARROZ AROMÁTICO TUNGURAHUA EN EL MERCADO DE ARROZ, POR TIPO, 2018-2032 (MILES DE USD)
TABLA 1674 MERCADO DE ARROZ DE TUNGURAHUA, POR DERIVADOS DEL ARROZ, 2018-2032 (MILES DE USD)
TABLA 1675 MERCADO DE ARROZ DE TUNGURAHUA, POR DERIVADOS DEL ARROZ, 2018-2032 (TONELADAS)
TABLA 1676 MERCADO DE ARROZ DE TUNGURAHUA, POR DERIVADOS DEL ARROZ, 2018-2032 (USD/KG)
TABLA 1677 MERCADO DE ARROZ DE TUNGURAHUA, POR USUARIO FINAL, 2018-2032 (MILES DE USD)
TABLA 1678 MERCADO DE ARROZ DE TUNGURAHUA, POR USUARIO FINAL, 2018-2032 (TONELADAS)
TABLA 1679 MERCADO DE ARROZ DE TUNGURAHUA, POR USUARIO FINAL, 2018-2032 (USD/KG)
TABLA 1680 ALIMENTOS Y BEBIDAS EN EL MERCADO DE ARROZ DE TUNGURAHUA, POR TIPO, 2018-2032 (MILES DE USD)
TABLA 1681 MERCADO DE ARROZ DE TUNGURAHUA, POR TIPO, 2018-2032 (MILES DE USD)
TABLA 1682 PANADERÍA DE TUNGURAHUA EN EL MERCADO DEL ARROZ, POR TIPO, 2018-2032 (MILES DE USD)
TABLA 1683 MERCADO DE ARROZ PROCESADO DE TUNGURAHUA, POR TIPO, 2018-2032 (MILES DE USD)
TABLA 1684 CONFITERÍA DE TUNGURAHUA EN EL MERCADO DE ARROZ, POR TIPO, 2018-2032 (MILES DE USD)
TABLA 1685 FÓRMULA INFANTIL DE TUNGURAHUA EN EL MERCADO DE ARROZ, POR TIPO, 2018-2032 (MILES DE USD)
TABLA 1686 PRODUCTOS LÁCTEOS DE TUNGURAHUA EN EL MERCADO DE ARROZ, POR TIPO, 2018-2032 (MILES DE USD)
TABLA 1687 BEBIDAS DE TUNGURAHUA EN EL MERCADO DE ARROZ, POR TIPO, 2018-2032 (MILES DE USD)
TABLA 1688 BEBIDAS SALUDABLES DE TUNGURAHUA EN EL MERCADO DE ARROZ, POR TIPO, 2018-2032 (MILES DE USD)
TABLA 1689 MERCADO DE ARROZ ALIMENTICIO DE TUNGURAHUA, POR CATEGORÍA, 2018-2032 (MILES DE USD)
TABLA 1690 MERCADO DE AVES DE TUNGURAHUA EN ARROZ, POR TIPO, 2018-2032 (MILES DE USD)
TABLA 1691 RUMIANTES DE TUNGURAHUA EN EL MERCADO DE ARROZ, POR TIPO, 2018-2032 (MILES DE USD)
TABLA 1692 CERDO TUNGURAHUA EN EL MERCADO DE ARROZ, POR TIPO, 2018-2032 (MILES DE USD)
TABLA 1693 PET DE TUNGURAHUA EN EL MERCADO DE ARROZ, POR TIPO, 2018-2032 (MILES DE USD)
TABLA 1694 ANIMALES ACUÁTICOS TUNGURAHUA EN EL MERCADO DE ARROZ, POR TIPO, 2018-2032 (MILES DE USD)
TABLA 1695 CRUSTÁCEOS DE TUNGURAHUA EN EL MERCADO DE ARROZ, POR TIPO, 2018-2032 (MILES DE USD)
TABLA 1696 PESCADO TUNGURAHUA EN EL MERCADO DE ARROZ, POR TIPO, 2018-2032 (MILES DE USD)
TABLA 1697 MOLUSCOS DE TUNGURAHUA EN EL MERCADO DE ARROZ, POR TIPO, 2018-2032 (MILES DE USD)
TABLA 1698 MERCADO DE ARROZ ALIMENTICIO DE TUNGURAHUA, POR FUNCIÓN DE SALUD, 2018-2032 (MILES DE USD)
TABLA 1699 PRODUCTOS FARMACÉUTICOS DE TUNGURAHUA EN EL MERCADO DEL ARROZ, POR APLICACIÓN, 2018-2032 (MILES DE USD)
TABLA 1700 INFECCIONES UROGENITALES DE TUNGURAHUA EN EL MERCADO DE ARROZ, POR TIPO, 2018-2032 (MILES DE USD)
TABLA 1701 PRODUCTOS FARMACÉUTICOS DE TUNGURAHUA EN EL MERCADO DE ARROZ, POR FORMA DE PRODUCTO, 2018-2032 (MILES DE USD)
TABLA 1702 MERCADO DE COSMÉTICOS Y CUIDADO PERSONAL DE TUNGURAHUA EN ARROZ, POR CATEGORÍA, 2018-2032 (MILES DE USD)
TABLA 1703 PRODUCTOS DE CUIDADO FACIAL DE TUNGURAHUA EN EL MERCADO DE ARROZ, POR TIPO, 2018-2032 (MILES DE USD)
TABLA 1704 PRODUCTOS PARA EL CUIDADO DEL CABELLO DE TUNGURAHUA EN EL MERCADO DEL ARROZ, POR TIPO, 2018-2032 (MILES DE USD)
TABLA 1705 SUPLEMENTOS DIETÉTICOS DE TUNGURAHUA EN EL MERCADO DE ARROZ, POR TIPO, 2018-2032 (MILES DE USD)
TABLA 1706 SUPLEMENTOS DIETÉTICOS DE TUNGURAHUA EN EL MERCADO DE ARROZ, POR FORMA DE PRODUCTO, 2018-2032 (MILES DE USD)
TABLA 1707 MERCADO DE ARROZ DE TUNGURAHUA, POR CANAL DE DISTRIBUCIÓN, 2018-2032 (MILES DE USD)
TABLA 1708 MERCADO DE ARROZ DE TUNGURAHUA, POR CANAL DE DISTRIBUCIÓN, 2018-2032 (TONELADAS)
TABLA 1709 MERCADO DE ARROZ DE TUNGURAHUA, POR CANAL DE DISTRIBUCIÓN, 2018-2032 (USD/KG)
TABLA 1710 TUNGURAHUA FUERA DE LÍNEA EN EL MERCADO DE ARROZ, POR TIPO, 2018-2032 (MILES DE USD)
TABLA 1711 VENTAS MINORISTAS EN EL MERCADO DE ARROZ DE TUNGURAHUA, POR TIPO DE CANAL, 2018-2032 (MILES DE USD)
TABLA 1712 MERCADO DE ARROZ EN LÍNEA DE TUNGURAHUA, POR TIPO, 2018-2032 (MILES DE USD)
TABLA 1713 MERCADO DE ARROZ ZAMORA-CHINCHIPE, POR TIPO, 2018-2032 (MILES DE USD)
CUADRO 1714 MERCADO DE ARROZ ZAMORA-CHINCHIPE, POR TIPO, 2018-2032 (TONELADAS)
CUADRO 1715 MERCADO DE ARROZ ZAMORA-CHINCHIPE, POR TIPO, 2018-2032 (USD/KG)
TABLA 1716 MERCADO DE ARROZ ZAMORA-CHINCHIPE, POR COLOR DE ARROZ, 2018-2032 (MILES DE USD)
TABLA 1717 MERCADO DE ARROZ ZAMORA-CHINCHIPE, POR COLOR DE ARROZ, 2018-2032 (TONELADAS)
TABLA 1718 MERCADO DE ARROZ ZAMORA-CHINCHIPE, POR COLOR DE ARROZ, 2018-2032 (USD/KG)
TABLA 1719 MERCADO DE ARROZ ZAMORA-CHINCHIPE, POR TAMAÑO DE GRANO, 2018-2032 (MILES DE USD)
CUADRO 1720 MERCADO DE ARROZ ZAMORA-CHINCHIPE, POR TAMAÑO DE GRANO, 2018-2032 (TONELADAS)
TABLA 1721 MERCADO DE ARROZ ZAMORA-CHINCHIPE, POR TAMAÑO DE GRANO, 2018-2032 (USD/KG)
TABLA 1722 MERCADO DE ARROZ ZAMORA-CHINCHIPE, POR NATURALEZA, 2018-2032 (MILES DE USD)
TABLA 1723 MERCADO DE ARROZ ZAMORA-CHINCHIPE, POR NATURALEZA, 2018-2032 (TONELADAS)
TABLA 1724 MERCADO DE ARROZ ZAMORA-CHINCHIPE, POR NATURALEZA, 2018-2032 (USD/KG)
TABLA 1725 MERCADO DE ARROZ ZAMORA-CHINCHIPE, POR CONTENIDO DE ALMIDÓN, 2018-2032 (MILES DE USD)
TABLA 1726 MERCADO DE ARROZ ZAMORA-CHINCHIPE, POR CONTENIDO DE ALMIDÓN, 2018-2032 (TONELADAS)
TABLA 1727 MERCADO DE ARROZ ZAMORA-CHINCHIPE, POR CONTENIDO DE ALMIDÓN, 2018-2032 (USD/KG)
CUADRO 1728 MERCADO DE ARROZ ZAMORA-CHINCHIPE, SEGÚN FORMA DE PROCESAMIENTO, 2018-2032 (MILES DE USD)
TABLA 1729 MERCADO DE ARROZ ZAMORA-CHINCHIPE, POR FORMA DE PROCESAMIENTO, 2018-2032 (TONELADAS)
CUADRO 1730 MERCADO DE ARROZ ZAMORA-CHINCHIPE, POR FORMA DE PROCESAMIENTO, 2018-2032 (USD/KG)
CUADRO 1731 MERCADO DE ARROZ ZAMORA-CHINCHIPE, SEGÚN GRADO DE MOLIENDA, 2018-2032 (MILES DE USD)
CUADRO 1732 MERCADO DE ARROZ ZAMORA-CHINCHIPE, SEGÚN GRADO DE MOLIENDA, 2018-2032 (TONELADAS)
CUADRO 1733 MERCADO DE ARROZ ZAMORA-CHINCHIPE, SEGÚN GRADO DE MOLIENDA, 2018-2032 (USD/KG)
TABLA 1734 MERCADO DE ARROZ ZAMORA-CHINCHIPE, POR PULIDO, 2018-2032 (MILES DE USD)
TABLA 1735 MERCADO DE ARROZ ZAMORA-CHINCHIPE, POR PULIDO, 2018-2032 (TONELADAS)
TABLA 1736 MERCADO DE ARROZ ZAMORA-CHINCHIPE, POR PULIDO, 2018-2032 (USD/KG)
TABLA 1737 MERCADO DE ARROZ ZAMORA-CHINCHIPE, POR FORTIFICACIÓN, 2018-2032 (MILES DE USD)
TABLA 1738 MERCADO DE ARROZ ZAMORA-CHINCHIPE, POR FORTIFICACIÓN, 2018-2032 (TONELADAS)
CUADRO 1739 MERCADO DE ARROZ ZAMORA-CHINCHIPE, POR FORTIFICACIÓN, 2018-2032 (USD/KG)
CUADRO 1740 MERCADO DE ARROZ FORTIFICADO ZAMORA-CHINCHIPE, POR PROCESO, 2018-2032 (MILES DE USD)
TABLA 1741 MERCADO DE ARROZ ZAMORA-CHINCHIPE, POR AROMA, 2018-2032 (MILES DE USD)
TABLA 1742 MERCADO DE ARROZ ZAMORA-CHINCHIPE, POR AROMA, 2018-2032 (TONELADAS)
TABLA 1743 MERCADO DE ARROZ ZAMORA-CHINCHIPE, POR AROMA, 2018-2032 (USD/KG)
TABLA 1744 ARROZ AROMÁTICO ZAMORA-CHINCHIPE EN EL MERCADO DE ARROZ, POR TIPO, 2018-2032 (MILES DE USD)
TABLA 1745 MERCADO DE ARROZ ZAMORA-CHINCHIPE, POR DERIVADOS DEL ARROZ, 2018-2032 (MILES DE USD)
CUADRO 1746 MERCADO DE ARROZ ZAMORA-CHINCHIPE, POR DERIVADOS DEL ARROZ, 2018-2032 (TONELADAS)
CUADRO 1747 MERCADO DE ARROZ ZAMORA-CHINCHIPE, POR DERIVADOS DEL ARROZ, 2018-2032 (USD/KG)
TABLA 1748 MERCADO DE ARROZ ZAMORA-CHINCHIPE, POR USUARIO FINAL, 2018-2032 (MILES DE USD)
CUADRO 1749 MERCADO DE ARROZ ZAMORA-CHINCHIPE, POR USUARIO FINAL, 2018-2032 (TONELADAS)
CUADRO 1750 MERCADO DE ARROZ ZAMORA-CHINCHIPE, POR USUARIO FINAL, 2018-2032 (USD/KG)
TABLA 1751 ALIMENTOS Y BEBIDAS EN EL MERCADO DE ARROZ DE ZAMORA-CHINCHIPE, POR TIPO, 2018-2032 (MILES DE USD)
TABLA 1752 ALIMENTOS EN EL MERCADO DE ARROZ DE ZAMORA-CHINCHIPE, POR TIPO, 2018-2032 (MILES DE USD)
TABLA 1753 PANADERÍA ZAMORA-CHINCHIPE EN EL MERCADO DE ARROZ, POR TIPO, 2018-2032 (USD MILES)
TABLA 1754 MERCADO DE ARROZ PROCESADO DE ZAMORA-CHINCHIPE, POR TIPO, 2018-2032 (MILES DE USD)
TABLA 1755 CONFITERÍA ZAMORA-CHINCHIPE EN EL MERCADO DE ARROZ, POR TIPO, 2018-2032 (MILES DE USD)
TABLA 1756 FÓRMULA INFANTIL ZAMORA-CHINCHIPE EN EL MERCADO DE ARROZ, POR TIPO, 2018-2032 (MILES DE USD)
TABLA 1757 PRODUCTOS LÁCTEOS EN EL MERCADO DE ARROZ DE ZAMORA-CHINCHIPE, POR TIPO, 2018-2032 (MILES DE USD)
TABLA 1758 BEBIDAS EN EL MERCADO DE ARROZ DE ZAMORA-CHINCHIPE, POR TIPO, 2018-2032 (MILES DE USD)
TABLA 1759 BEBIDAS SALUDABLES ZAMORA-CHINCHIPE EN EL MERCADO DE ARROZ, POR TIPO, 2018-2032 (MILES DE USD)
TABLA 1760 ALIMENTOS DE ARROZ ZAMORA-CHINCHIPE, POR CATEGORÍA, 2018-2032 (MILES DE USD)
TABLA 1761 MERCADO DE AVES DE CORRAL ZAMORA-CHINCHIPE EN ARROZ, POR TIPO, 2018-2032 (MILES DE USD)
TABLA 1762 RUMIANTES ZAMORA-CHINCHIPE EN EL MERCADO DE ARROZ, POR TIPO, 2018-2032 (MILES DE USD)
TABLA 1763 MERCADO DE ARROZ PORCINO ZAMORA-CHINCHIPE, POR TIPO, 2018-2032 (MILES DE USD)
TABLA 1764 MERCADO DE ARROZ DE MASCOTA ZAMORA-CHINCHIPE, POR TIPO, 2018-2032 (MILES DE USD)
TABLA 1765 ZAMORA-CHINCHIPE ANIMAL ACUÁTICO EN EL MERCADO DE ARROZ, POR TIPO, 2018-2032 (MILES DE USD)
TABLA 1766 CRUSTÁCEOS ZAMORA-CHINCHIPE EN EL MERCADO DE ARROZ, POR TIPO, 2018-2032 (MILES DE USD)
TABLA 1767 PESCADO ZAMORA-CHINCHIPE EN EL MERCADO DE ARROZ, POR TIPO, 2018-2032 (MILES DE USD)
TABLA 1768 MOLUSCOS ZAMORA-CHINCHIPE EN EL MERCADO DE ARROZ, POR TIPO, 2018-2032 (MILES DE USD)
TABLA 1769 MERCADO DE ALIMENTOS DE ARROZ ZAMORA-CHINCHIPE, POR FUNCIÓN SANITARIA, 2018-2032 (MILES DE USD)
TABLA 1770 PRODUCTOS FARMACÉUTICOS EN EL MERCADO DE ARROZ DE ZAMORA-CHINCHIPE, POR APLICACIÓN, 2018-2032 (MILES DE USD)
TABLA 1771 INFECCIONES UROGENITALES DE ZAMORA-CHINCHIPE EN EL MERCADO DE ARROZ, POR TIPO, 2018-2032 (MILES DE USD)
TABLA 1772 PRODUCTOS FARMACÉUTICOS EN EL MERCADO DE ARROZ DE ZAMORA-CHINCHIPE, POR FORMA DE PRODUCTO, 2018-2032 (MILES DE USD)
TABLA 1773 MERCADO DE COSMÉTICOS Y CUIDADO PERSONAL EN ARROZ DE ZAMORA-CHINCHIPE, POR CATEGORÍA, 2018-2032 (MILES DE USD)
TABLA 1774 PRODUCTOS DE CUIDADO FACIAL EN EL MERCADO DE ARROZ DE ZAMORA-CHINCHIPE, POR TIPO, 2018-2032 (MILES DE USD)
TABLA 1775 PRODUCTOS PARA EL CUIDADO DEL CABELLO EN EL MERCADO DE ARROZ DE ZAMORA-CHINCHIPE, POR TIPO, 2018-2032 (MILES DE USD)
TABLA 1776 SUPLEMENTOS DIETÉTICOS DE ZAMORA-CHINCHIPE EN EL MERCADO DE ARROZ, POR TIPO, 2018-2032 (MILES DE USD)
TABLA 1777 SUPLEMENTOS DIETÉTICOS DE ZAMORA-CHINCHIPE EN EL MERCADO DE ARROZ, POR FORMA DE PRODUCTO, 2018-2032 (MILES DE USD)
TABLA 1778 MERCADO DE ARROZ ZAMORA-CHINCHIPE, POR CANAL DE DISTRIBUCIÓN, 2018-2032 (MILES DE USD)
TABLE 1779 ZAMORA-CHINCHIPE RICE MARKET, BY DISTRIBUTION CHANNEL, 2018-2032 (TONS)
TABLE 1780 ZAMORA-CHINCHIPE RICE MARKET, BY DISTRIBUTION CHANNEL, 2018-2032 (USD/KG)
TABLE 1781 ZAMORA-CHINCHIPE OFFLINE IN RICE MARKET, BY TYPE, 2018-2032 (USD THOUSAND)
TABLE 1782 ZAMORA-CHINCHIPE RETAIL SALES IN RICE MARKET, BY CHANNEL TYPE, 2018-2032 (USD THOUSAND)
TABLE 1783 ZAMORA-CHINCHIPE ONLINE IN RICE MARKET, BY TYPE, 2018-2032 (USD THOUSAND)
Lista de figuras
FIGURE 1 ECUADOR RICE MARKET
FIGURE 2 ECUADOR RICE MARKET: DATA TRIANGULATION
FIGURE 3 ECUADOR RICE MARKET: DROC ANALYSIS
FIGURE 4 ECUADOR RICE MARKET: GLOBAL VS REGIONAL MARKET ANALYSIS
FIGURE 5 ECUADOR RICE MARKET: COMPANY RESEARCH ANALYSIS
FIGURE 6 ECUADOR RICE MARKET: MULTIVARIATE MODELLING
FIGURE 7 ECUADOR RICE MARKET: INTERVIEW DEMOGRAPHICS
FIGURE 8 ECUADOR RICE MARKET: DBMR MARKET POSITION GRID
FIGURE 9 ECUADOR RICE MARKET: VENDOR SHARE ANALYSIS
FIGURE 10 ECUADOR RICE MARKET: SEGMENTATION
FIGURE 11 TWENTY EIGHT SEGMENTS COMPRISE THE ECUADOR RICE MARKET, BY TYPE
FIGURE 12 EXECUTIVE SUMMARY
FIGURE 13 STRATEGIC DECISIONS
FIGURE 14 RISING CONSUMPTION OF RICE IN ECUADOR IS EXPECTED TO DRIVE THE ECUADOR RICE MARKET IN THE FORECAST PERIOD (2025-2032)
FIGURE 15 THE ARROZ LARGO RICE IS EXPECTED TO ACCOUNT FOR THE LARGEST SHARE OF THE ECUADOR RICE MARKET IN 2025 AND 2032
FIGURE 16 PORTER’S FIVE FORCES
FIGURE 17 ECUADOR RICE MARKET, 2024-2032, AVERAGE SELLING PRICE (USD/KG)
FIGURE 18 VALUE CHAIN ANALYSIS FOR ECUADOR RICE MARKET
FIGURE 19 DRIVERS, RESTRAINTS, OPPORTUNITIES AND CHALLENGES OF ECUADOR RICE MARKET
FIGURE 20 ECUADOR RICE MARKET: BY TYPE, 2024
FIGURE 21 ECUADOR RICE MARKET: BY RICE COLOR, 2024
FIGURE 22 ECUADOR RICE MARKET: BY GRAIN SIZE/KERNEL SIZE, 2024
FIGURE 23 ECUADOR RICE MARKET: BY NATURE, 2024
FIGURE 24 ECUADOR RICE MARKET: BY STARCH CONTENT, 2024
FIGURE 25 ECUADOR RICE MARKET, BY PROCESSING FORM, 2024
FIGURE 26 ECUADOR RICE MARKET: BY DEGREE OF MILLING, 2024
FIGURE 27 ECUADOR RICE MARKET, BY POLISHING, 2024
FIGURE 28 ECUADOR RICE MARKET, BY FORTIFICATION, 2024
FIGURE 29 ECUADOR RICE MARKET, BY AROMA, 2024
FIGURE 30 ECUADOR RICE MARKET: BY RICE DERIVATIVES, 2024
FIGURE 31 ECUADOR RICE MARKET: BY END-USER, 2024
FIGURE 32 ECUADOR RICE MARKET: BY DISTRIBUTION CHANNEL, 2024
FIGURE 33 ECUADOR RICE MARKET: SNAPSHOT (2024)
FIGURE 34 ECUADOR RICE MARKET: COMPANY SHARE 2024 (%)
Metodología de investigación
La recopilación de datos y el análisis del año base se realizan utilizando módulos de recopilación de datos con muestras de gran tamaño. La etapa incluye la obtención de información de mercado o datos relacionados a través de varias fuentes y estrategias. Incluye el examen y la planificación de todos los datos adquiridos del pasado con antelación. Asimismo, abarca el examen de las inconsistencias de información observadas en diferentes fuentes de información. Los datos de mercado se analizan y estiman utilizando modelos estadísticos y coherentes de mercado. Además, el análisis de la participación de mercado y el análisis de tendencias clave son los principales factores de éxito en el informe de mercado. Para obtener más información, solicite una llamada de un analista o envíe su consulta.
La metodología de investigación clave utilizada por el equipo de investigación de DBMR es la triangulación de datos, que implica la extracción de datos, el análisis del impacto de las variables de datos en el mercado y la validación primaria (experto en la industria). Los modelos de datos incluyen cuadrícula de posicionamiento de proveedores, análisis de línea de tiempo de mercado, descripción general y guía del mercado, cuadrícula de posicionamiento de la empresa, análisis de patentes, análisis de precios, análisis de participación de mercado de la empresa, estándares de medición, análisis global versus regional y de participación de proveedores. Para obtener más información sobre la metodología de investigación, envíe una consulta para hablar con nuestros expertos de la industria.
Personalización disponible
Data Bridge Market Research es líder en investigación formativa avanzada. Nos enorgullecemos de brindar servicios a nuestros clientes existentes y nuevos con datos y análisis que coinciden y se adaptan a sus objetivos. El informe se puede personalizar para incluir análisis de tendencias de precios de marcas objetivo, comprensión del mercado de países adicionales (solicite la lista de países), datos de resultados de ensayos clínicos, revisión de literatura, análisis de mercado renovado y base de productos. El análisis de mercado de competidores objetivo se puede analizar desde análisis basados en tecnología hasta estrategias de cartera de mercado. Podemos agregar tantos competidores sobre los que necesite datos en el formato y estilo de datos que esté buscando. Nuestro equipo de analistas también puede proporcionarle datos en archivos de Excel sin procesar, tablas dinámicas (libro de datos) o puede ayudarlo a crear presentaciones a partir de los conjuntos de datos disponibles en el informe.

