Asia Pacific Stroke Market
Taille du marché en milliards USD
TCAC :
% 
 USD
7.01 Billion
USD
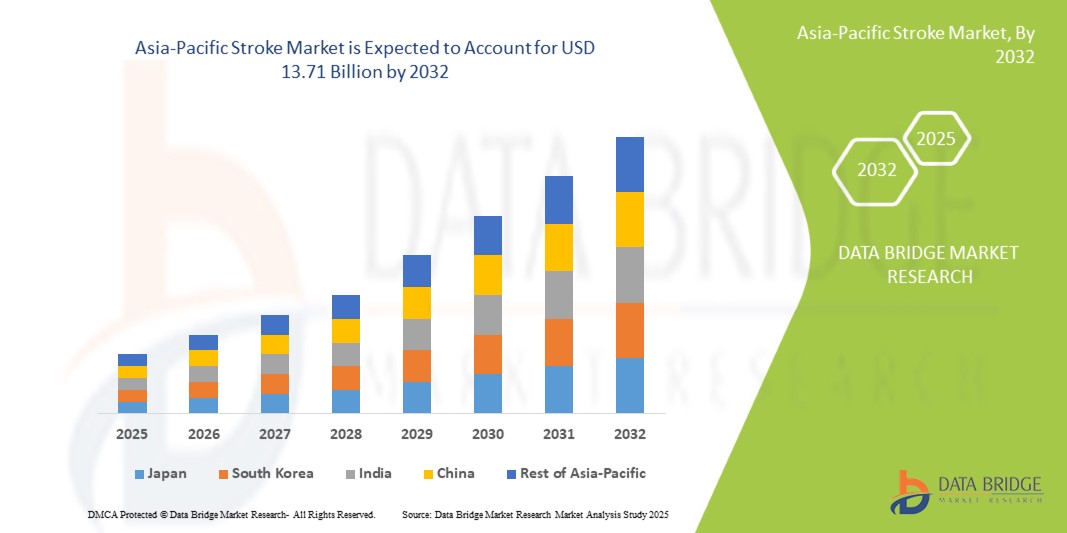
13.71 Billion
2024
2032
USD
7.01 Billion
USD
13.71 Billion
2024
2032
| 2025 –2032 | |
| USD 7.01 Billion | |
| USD 13.71 Billion | |
| % | |
|
Segmentation du marché des accidents vasculaires cérébraux (AVC) en Asie-Pacifique, type (AVC ischémique, accident ischémique transitoire (AIT) et AVC hémorragique ), diagnostic et traitement (diagnostic et traitement), sexe (femme et homme), utilisateur final (hôpitaux et cliniques, cliniques spécialisées, centres de chirurgie ambulatoire, soins à domicile, laboratoires et autres), canal de distribution (direct, vente au détail et en ligne) – Tendances et prévisions du secteur jusqu'en 2032
Analyse du marché des accidents vasculaires cérébraux
Le marché de l'AVC en Asie-Pacifique est un secteur de la santé en pleine croissance, axé sur les produits et services visant à prévenir, diagnostiquer, traiter et rééduquer les patients victimes d'AVC. Les principaux composants de ce marché comprennent les produits pharmaceutiques (tels que les thrombolytiques, les antiplaquettaires et les anticoagulants), les dispositifs médicaux (tels que les stents vasculaires et les dispositifs neuroprotecteurs) et les équipements de rééducation (notamment les outils de physiothérapie et les aides orthophoniques). Cette croissance est tirée par des facteurs tels que la sensibilisation croissante à la prévention des AVC, les avancées technologiques médicales et l'augmentation de la population âgée, plus vulnérable aux AVC. La prévalence croissante des maladies non transmissibles, notamment l'hypertension et le diabète, contribue également à la demande de soins efficaces pour les AVC.
Taille du marché des accidents vasculaires cérébraux
Le marché des accidents vasculaires cérébraux en Asie-Pacifique devrait atteindre 13,71 milliards USD d'ici 2032, contre 7,01 milliards USD en 2024, avec un TCAC de 9,1 % au cours de la période de prévision de 2025 à 2032. Outre les informations sur les scénarios de marché tels que la valeur marchande, le taux de croissance, la segmentation, la couverture géographique et les principaux acteurs, les rapports de marché organisés par Data Bridge Market Research comprennent également une analyse approfondie par des experts, une épidémiologie des patients, une analyse du pipeline, une analyse des prix et un cadre réglementaire.
Tendances du marché des accidents vasculaires cérébraux
« Adoption croissante de technologies avancées de neuroimagerie et de solutions de télémédecine pour le diagnostic et la prise en charge des accidents vasculaires cérébraux »
Une tendance notable sur le marché de l'AVC en Asie-Pacifique est l'adoption croissante de technologies avancées de neuroimagerie et de solutions de télémédecine pour le diagnostic et la prise en charge de l'AVC. La prise de conscience croissante de l'importance cruciale d'une intervention rapide dans le traitement de l'AVC entraîne une évolution significative vers l'utilisation de techniques d'imagerie sophistiquées, telles que l'IRM et le scanner, qui permettent un diagnostic plus rapide et plus précis des différents types d'AVC. De plus, la télémédecine devient essentielle pour fournir des consultations et un suivi à distance rapides, notamment dans les zones rurales ou mal desservies, permettant aux professionnels de santé d'évaluer les patients et de mettre en place rapidement les traitements. Cette tendance améliore non seulement les résultats pour les patients, mais stimule également l'innovation et l'investissement dans le continuum de soins de l'AVC.
Portée du rapport et segmentation du marché des accidents vasculaires cérébraux
|
Attributs |
Informations clés sur le marché des accidents vasculaires cérébraux |
|
Segments couverts |
|
|
Pays couverts |
Chine, Japon, Inde, Corée du Sud, Singapour, Malaisie, Australie, Thaïlande, Indonésie, Philippines, Vietnam, Taïwan et reste de l'Asie-Pacifique |
|
Principaux acteurs du marché |
Bristol-Myers Squibb Company (États-Unis), Boehringer Ingelheim International GmbH (Allemagne), F. Hoffmann-La Roche Ltd (Suisse), DAIICHI SANKYO COMPANY, LIMITED (Japon), Sanofi (France), Johnson & Johnson Services, Inc. (États-Unis), Bayer AG (Allemagne), Sandoz AG (Suisse), Pfizer Inc. (États-Unis), Medtronic (Irlande), Abbott (États-Unis), Viatris Inc. (États-Unis), AstraZeneca (Royaume-Uni), Penumbra, Inc. (États-Unis), GLENMARK PHARMACEUTICALS LTD (Inde), Fresenius SE & Co. KGaA (Allemagne), Teva Pharmaceuticals USA, Inc. (Israël), Lupin (Inde) et Amneal Pharmaceuticals LLC (États-Unis), entre autres |
|
Opportunités de marché |
|
|
Ensembles d'informations de données à valeur ajoutée |
Outre les informations sur les scénarios de marché tels que la valeur marchande, le taux de croissance, la segmentation, la couverture géographique et les principaux acteurs, les rapports de marché organisés par Data Bridge Market Research incluent également une analyse approfondie des experts, une épidémiologie des patients, une analyse du pipeline, une analyse des prix et un cadre réglementaire. |
Définition du marché des accidents vasculaires cérébraux
Le marché de l'AVC en Asie-Pacifique englobe les différents produits, services et technologies impliqués dans la prévention, le diagnostic, le traitement et la réadaptation des patients victimes d'AVC dans le monde entier. Il comprend une gamme de dispositifs médicaux, de produits pharmaceutiques, d'équipements d'imagerie et de solutions thérapeutiques visant à répondre aux complexités de la prise en charge de l'AVC. Ce marché est stimulé par l'incidence croissante des AVC due au vieillissement de la population, aux facteurs liés au mode de vie et à une meilleure connaissance des symptômes et des options thérapeutiques. De plus, les progrès des technologies de santé et de la télémédecine façonnent le paysage, facilitant une meilleure prise en charge des patients et améliorant les résultats de la prise en charge de l'AVC dans divers groupes démographiques et contextes de soins.
Dynamique du marché des accidents vasculaires cérébraux
Conducteurs
- L'augmentation de l'incidence des accidents vasculaires cérébraux (AVC) entraîne une demande accrue de traitements.
L'incidence croissante des accidents vasculaires cérébraux (AVC) est un facteur déterminant pour le marché de l'AVC, influençant à la fois la demande de traitement et les infrastructures de santé. L'AVC, principale cause d'invalidité et de décès dans le monde, est de plus en plus fréquent en raison de divers facteurs de risque, notamment le vieillissement de la population, la sédentarité, l'hypertension artérielle, le diabète, le tabagisme et une mauvaise alimentation. Avec l'allongement de l'espérance de vie et le vieillissement de la population, la prévalence des pathologies contribuant aux AVC, telles que l'hypertension et la fibrillation auriculaire, a également augmenté, ce qui entraîne une augmentation du nombre de personnes victimes d'AVC nécessitant une prise en charge médicale immédiate et une rééducation à long terme.
Par exemple,
En mai 2023, selon un article publié dans eClinicalMedicine, l'AVC était la deuxième cause de décès et la troisième cause d'invalidité dans le monde. Au cours des 30 dernières années, on a constaté une augmentation du nombre absolu d'AVC incidents (70 %) et de prévalence (85 %), ainsi que des décès (43 %) dus à un AVC.
- Augmentation du nombre de patients souffrant d'hypertension et de maladies coronariennes
L'hypertension artérielle, communément appelée hypertension artérielle, est une affection caractérisée par une force accrue du sang contre les parois des artères. Elle se définit généralement par une pression artérielle de 130/80 mm Hg ou plus et peut être qualifiée d'essentielle (primaire) ou secondaire, selon sa cause sous-jacente. Une hypertension prolongée peut entraîner divers problèmes de santé graves, dont l'un des plus importants est la maladie coronarienne. Cette maladie résulte de l'accumulation progressive de dépôts graisseux (athérosclérose) dans les artères coronaires, qui alimentent le muscle cardiaque en oxygène et en nutriments. Lorsque ces artères se rétrécissent ou se bouchent, le flux sanguin vers le cœur est réduit, ce qui entraîne des douleurs thoraciques (angine de poitrine) et, dans les cas graves, des crises cardiaques.
Par exemple,
En septembre 2023, selon un article publié dans le Journal de l'Organisation panaméricaine de la santé, l'hypertension, souvent asymptomatique, contribue significativement aux maladies cardiovasculaires, première cause de décès. Des facteurs tels que le vieillissement, l'obésité et de mauvaises habitudes de vie alimentent cette prévalence croissante, exigeant des traitements efficaces.
Opportunités
- Développement de thérapies avancées pour les accidents vasculaires cérébraux
The development of advanced therapeutics presents a significant opportunity for the stroke market by addressing the substantial unmet needs in stroke care. Current treatments, primarily focused on restoring blood flow through thrombolysis or thrombectomy, are effective only within a narrow time window and do not address the underlying neuronal damage. Advanced therapeutics, such as neuroprotective agents, cell-based therapies, and targeted drug delivery systems, promise to mitigate this damage, promote neuronal repair, and improve long-term functional outcomes for stroke patients. This will lead to a decrease in disability, reduced healthcare costs associated with long-term care, and improved quality of life for survivors, thus expanding the market potential by attracting investment and driving demand for more effective treatments.
For instance,
In April 2022, according to an article published by the American Heart Association Journals, the treatment of acute ischemic stroke continues to advance. Tenecteplase has been evaluated as an alternative thrombolytic drug and evidence suggests that it is as least as effective as alteplase and may lyse large vessel clots more effectively. Endovascular therapy with mechanical thrombectomy has now been shown to be beneficial up to 24 hours after stroke onset in carefully selected patients with proximal, large vessel occlusions.
- Expansion in Stroke Rehabilitation Services
The expansion of stroke rehabilitation services presents a substantial opportunity for the stroke market by addressing the growing need for more effective recovery and rehabilitation programs. Currently, stroke survivors often face significant challenges in regaining lost motor and cognitive functions, leading to prolonged hospital stays, increased medical costs, and reduced quality of life. As the global population ages and stroke incidence rates rise, there is a pressing need for enhanced rehabilitation services that cater to the individual needs of stroke survivors. By expanding stroke rehabilitation services, healthcare providers and payers can address the unmet demand for comprehensive and personalized care, leading to better patient outcomes, reduced healthcare costs, and increased patient satisfaction.
For instance,
In April 2023, according to an article published by the MDPI, developed countries make efforts to provide rehabilitation for stroke patients. Physical rehabilitation can reduce or prevent known complications in stroke patients while also improving their quality of life. Therapists choose interventions based on impairments, activity limitations, and goals of recovery.
Restraints/Challenges
- High Cost of Diagnosis
Heart disease and stroke are one of the major factors of increasing mortality rate globally over the years. Stroke can be ranked among the most costly chronic diseases. More than 868,000 Americans die due to heart disease or stroke every year—that’s one-third of all deaths. With the increasing incidence of stroke, the cost of diagnosis and treatment has increased over the years which is the major restraining factor.
The majority of patients not only endure life-long disabilities that affect their livelihood but also have an enormous societal economic impact. The cost of diagnosis has also increased with the rise in technological advancement.
For instance,
According to the Agency for Healthcare Research and Quality, the average hospital admission for ischemic stroke (which includes diagnosis & stay) is 5.6 days at USD 9,100 per stay, and for hemorrhagic stroke, it is 8.4 days at USD 19,500 per stay.
- Increase in Product Recall
A wide range of diagnostic devices for stroke are used by professionals for performing different procedures on various patients of different age groups. Thus, side effects and complications associated with the use of these devices can cause serious harm to the patients.
Also these diagnostic devices and products are very expensive and highly risky for which a potential failure may cause serious consequences to the patient. Therefore, they are strictly regulated and recalled for the safety of patients.
For instance,
Neusoft Medical Systems Co., Ltd. Company’s product NeuViz 64 Multi-slice CT Scanner System Product which is a Multi-Slice CT Scanner System used as a whole body computed tomography x-ray system featuring a continuously rotating x-ray tube and detector array have been recalled by FDA due to the software error into the system.
This market report provides details of new recent developments, trade regulations, import-export analysis, production analysis, value chain optimization, market share, impact of domestic and localized market players, analyses opportunities in terms of emerging revenue pockets, changes in market regulations, strategic market growth analysis, market size, category market growths, application niches and dominance, product approvals, product launches, geographic expansions, technological innovations in the market. To gain more info on the market contact Data Bridge Market Research for an Analyst Brief, our team will help you take an informed market decision to achieve market growth.
Stroke Market Scope
The market is categorized into five notable segments based on type, diagnosis & treatment, gender, end user, and distribution channel. The growth amongst these segments will help you analyze meagre growth segments in the industries and provide the users with a valuable market overview and market insights to help them make strategic decisions for identifying core market applications.
Type
- Ischemic Stroke
- Thrombotic (Cerebral Thrombosis)
- Embolic (Cerebral Embolism)
- Hemorrhagic Stroke
- Subarachnoid Hemorrhage
- Hémorragie intracérébrale
- Accident ischémique transitoire (AIT)
Diagnostic et traitement
- Traitement
- Médicament
- Par classe
- Médicaments contre la tension artérielle
- Inhibiteurs de l'enzyme de conversion de l'angiotensine (ECA)
- Ramipril
- Lisinopril
- Énalapril
- Périndopril
- Autre
- diurétiques thiazidiques
- Indapamide
- Bendrofluméthiazide
- Spironolactone
- Amiloride
- Autre
- Inhibiteurs des canaux calciques
- Amlodipine
- Nifédipine
- Vérapamil
- Nicardipine
- Félodipine
- Nimodipine
- Autre
- Bêta-bloquants
- Aténolol
- Bisoprolol
- Labétolol
- Autres
- Alpha-bloquants
- Doxazosine
- Autres
- Autres
- Inhibiteurs de l'enzyme de conversion de l'angiotensine (ECA)
- médicaments antiplaquettaires
- Aspirine
- Clopidogrel
- Dipyridamole
- Ticlopidine
- Autres
- Anticoagulants
- Warfarine
- Apixaban
- Dabigatran
- Héparine
- Rivaroxaban
- Autre
- Activateur tissulaire du plasminogène (TPA)
- Alteplase
- Ténéctéplase
- Rétéplase
- Anistréplase
- Autre
- Statines
- Atorvastatine
- Simvastatine
- Lovastatine
- Rosuvastatine
- Fluvastatine
- Pravastatine
- Pitavastatine
- Autres
- Vitamine K
- Médicaments de soutien
- Compléments alimentaires
- Antipyrétiques
- Autres
- Médicaments contre la tension artérielle
- Par type de médicament
- De marque
- Activase
- Édobaxan
- Coumadin
- Héparine Léo
- Duoplavine
- Aggrenox
- Rétavase
- Jantoven
- Cathflo
- Autre
- De marque
- Générique
- Par voie d'administration
- Oral
- Comprimé
- Capsules
- Autres
- Parentérale
- Intraveineux
- Sous-cutané
- Autres
- Oral
- Par mode d'achat
- Ordonnance
- En vente libre (OTC)
- Par type de thérapie
- Thérapie combinée
- Monothérapie
- Par voie d'administration
- Chirurgie
- Bobines emboliques
- Cathéters d'aspiration
- Récupérateur de stent
- Coupe chirurgicale
- Autres
- Thérapie des autres
- physiothérapie
- Ergothérapie
- orthophonie
- Autres
- Par classe
- Diagnostic
- Test d'imagerie
- Tomodensitométrie (TDM)
- Imagerie par résonance magnétique (IRM)
- Échographie carotidienne
- Angiographie cérébrale
- Analyse de sang
- Échocardiogramme
- Ponction lombaire
- Autres
- Test d'imagerie
- Médicament
Genre
- Femelle
- Mâle
Utilisateur final
- Hôpitaux et cliniques
- Cliniques spécialisées
- Centre de chirurgie ambulatoire
- Soins à domicile
- Laboratoires
- Autres
Canal de distribution
- Direct
- Vente au détail
- En ligne
Analyse régionale du marché des accidents vasculaires cérébraux
Le marché est analysé et des informations sur la taille du marché et les tendances sont fournies par type, diagnostic et traitement, sexe, utilisateur final et canal de distribution comme référencé ci-dessus.
Les pays couverts par le marché sont la Chine, le Japon, l'Inde, la Corée du Sud, Singapour, la Malaisie, l'Australie, la Thaïlande, l'Indonésie, les Philippines, le Vietnam, Taïwan et le reste de l'Asie-Pacifique.
La Chine devrait dominer et connaître la croissance la plus rapide sur le marché des accidents vasculaires cérébraux en Asie-Pacifique en raison de ses dépenses de santé élevées, de son infrastructure médicale avancée et de ses programmes complets de soins des accidents vasculaires cérébraux.
La section pays du rapport présente également les facteurs d'impact sur les marchés individuels et les évolutions réglementaires nationales qui influencent les tendances actuelles et futures du marché. Des données telles que l'analyse des chaînes de valeur en aval et en amont, les tendances techniques, l'analyse des cinq forces de Porter et les études de cas sont quelques-uns des indicateurs utilisés pour prévoir le scénario de marché pour chaque pays. De plus, la présence et la disponibilité des marques d'Asie-Pacifique et les difficultés auxquelles elles sont confrontées en raison de la forte ou de la faible concurrence des marques locales et nationales, de l'impact des tarifs douaniers nationaux et des routes commerciales sont prises en compte lors de l'analyse prévisionnelle des données nationales.
Part de marché des accidents vasculaires cérébraux
The market competitive landscape provides details by competitor. Details included are company overview, company financials, revenue generated, market potential, investment in research and development, new market initiatives, Asia-Pacific presence, production sites and facilities, production capacities, company strengths and weaknesses, product launch, product width and breadth, application dominance. The above data points provided are only related to the companies' focus related to market.
Stroke Market Leaders Operating in the Market Are:
- Bristol-Myers Squibb Company (U.S.)
- Boehringer Ingelheim International GmbH (Germany)
- F. Hoffmann-La Roche Ltd (Switzerland)
- DAIICHI SANKYO COMPANY, LIMITED (Japan)
- Sanofi (France)
- Johnson & Johnson Services, Inc. (U.S.)
- Bayer AG (Germany)
- Sandoz AG (Switzerland)
- Pfizer Inc. (U.S.)
- Medtronic (Ireland)
- Abbott (U.S.)
- Viatris Inc. (U.S.)
- AstraZeneca (U.K.)
- Penumbra, Inc. (U.S.)
- GLENMARK PHARMACEUTICALS LTD (India)
- Fresenius SE & Co. KGaA (Germany)
- Teva Pharmaceuticals USA, Inc. (Israel)
- Lupin (India)
- Amneal Pharmaceuticals LLC (U.S.)
Latest Developments in Stroke Market
- In July 2023, Roche announced a new partnership with Alnylam to develop and commercialize zilebesir, an investigational RNAi therapy currently in Phase 2 for the treatment of high blood pressure. This collaboration combines Alnylam's proven experience in RNAi therapy with Roche's global commercial reach, commitment to innovation and desire to change the landscape for patients with serious cardiovascular disease
- In September 2020, Daiichi Sankyo Company Limited announced that it has submitted a supplemental application in Japan for the extended approval of the anticoagulant edoxaban (edoxaban benzoate hydrate) in elderly patients with nonvalvular regurgitation and severe bleeding. Risk. This application is based on the results of a Japanese Phase 3 clinical trial (ELDERCARE-AF trial) in 984 patients with non-valvular atrial fibrillation who are at least 80 years old and have a high risk of bleeding and are not suitable for other available anticoagulant therapies. Daiichi Sankyo plans to contribute to the treatment of elderly patients with non-valvular atrial fibrillation by offering a new treatment option
- In July 2022, Sandoz, the world's leading manufacturer of generics and biosimilars, announced an investment of approximately USD 90 million in its facility in Ljubljana, Slovenia, to establish its Sandoz Biopharma Development Center by 2026. With this investment, the Ljubljana site will become one of Sandoz's most important biosimilar product development sites. The new office will result in the creation of approximately 200 new full-time jobs and will further strengthen the company's capabilities in the development of biosimilars and pharmaceutical products
- In January 2023, Penumbra, Inc., a global healthcare company focused on innovative therapies, announced the US Food and Drug Administration (FDA) approval and launch of Lightning Flash™, the most advanced and powerful mechanical thrombectomy system on the market. Lightning Flash features Penumbra's new Lightning Intelligent Aspiration technology, which now has two clot detection algorithms. Combined with innovative catheter technology, the Lightning Flash is designed to quickly remove large blood clots from the body, including venous embolism and pulmonary embolism (PE). This launch will help the company expand its product portfolio because the advanced results of this new technology are exceptionally traceable and its unique ability to differentiate flowing blood from clots
- In August 2023, Lupin has announced the launch of Jeet, a patient support program dedicated to heart health. The launch of the initiative coincides with India's 77th Independence Day, which symbolizes freedom from disease-related stress and the journey to a happier and healthier life. Jeet becomes a trusted partner in cardiovascular care by offering various benefits such as cost savings, medical assistance, medication reminders and lifestyle support. Jeet offers a holistic approach to improving the physician and patient experience by increasing awareness of cardiovascular disease and its comorbidities. The app includes features designed to encourage a healthier lifestyle and support a healthy heart
SKU-
Accédez en ligne au rapport sur le premier cloud mondial de veille économique

- Tableau de bord d'analyse de données interactif
- Tableau de bord d'analyse d'entreprise pour les opportunités à fort potentiel de croissance
- Accès d'analyste de recherche pour la personnalisation et les requêtes
- Analyse de la concurrence avec tableau de bord interactif
- Dernières actualités, mises à jour et analyse des tendances
- Exploitez la puissance de l'analyse comparative pour un suivi complet de la concurrence
Table des matières
1 INTRODUCTION
1.1 OBJECTIFS DE L'ÉTUDE
1.2 DÉFINITION DU MARCHÉ
1.3 LIMITATIONS
1.4 MARCHÉS COUVERTS
2 SEGMENTATION DU MARCHÉ
2.1 MARCHÉS COUVERTS
2.2 PORTÉE GÉOGRAPHIQUE
2,3 ANS CONSIDÉRÉS POUR L'ÉTUDE
2.4 MONNAIE ET TARIFS
2.5 MODÈLE DE VALIDATION DES DONNÉES DU TRÉPIED DBMR
2.6 MODÉLISATION MULTIVARIÉE
2.7 TYPE COURBE DE LIGNE DE VIE
2.8 ENTRETIENS PRIMAIRES AVEC DES LEADERS D'OPINION CLÉS
2.9 GRILLE DE POSITIONNEMENT DU MARCHÉ DBMR
2.1 GRILLE DE COUVERTURE DES UTILISATEURS FINAUX DU MARCHÉ
2.11 ANALYSE DES PARTS DES FOURNISSEURS
2.12 SOURCES SECONDAIRES
2.13 HYPOTHÈSES
3 RÉSUMÉ EXÉCUTIF
4 INFORMATIONS PREMIUM
4.1 ANALYSE PESTEL
4.2 LES CINQ FORCES DE PORTER
5 MARCHÉ ASIE-PACIFIQUE DES AVC, CADRE RÉGLEMENTAIRE
5.1 RÉGLEMENTATION AUX ÉTATS-UNIS
5.2 RÉGLEMENTATION EN EUROPE
5.3 RÉGLEMENTATION EN CHINE
5.4 RÉGLEMENTATION AU JAPON
5.5 RÉGLEMENTATION EN AFRIQUE DU SUD
6 APERÇU DU MARCHÉ
6.1 PILOTES
6.1.1 L'AUGMENTATION DE L'INCIDENCE DES AVC ENTRAÎNE UNE DEMANDE DE TRAITEMENTS
6.1.2 AUGMENTATION DU NOMBRE DE PATIENTS SOUFFRANT D'HYPERTENSION ET DE MALADIES CORONARIENNES
6.1.3 L'AUGMENTATION DES POPULATIONS DIABÉTIQUES ET OBÈSES AUGMENTE LES RISQUES D'AVC
6.1.4 LES PROGRÈS DE LA TECHNOLOGIE MÉDICALE AMÉLIORENT LES RÉSULTATS DES SOINS CONTRE LES AVC
6.2 RESTRICTIONS
6.2.1 COÛT ÉLEVÉ DU DIAGNOSTIC
6.2.2 AUGMENTATION DU RAPPEL DE PRODUITS
6.3 OPPORTUNITÉS
6.3.1 DÉVELOPPEMENT DE THÉRAPEUTIQUES AVANCÉES POUR LES AVC
6.3.2 EXPANSION DES SERVICES DE RÉADAPTATION APRÈS AVC
6.3.3 TRAITEMENTS INNOVANTS EN COURS DE DÉVELOPPEMENT POUR LE TRAITEMENT DES AVC
6.4 DÉFIS
6.4.1 FAUX DIAGNOSTIC DANS LES AVC
6.4.2 COMPLICATIONS ASSOCIÉES À LA PRISE EN CHARGE DE L'AVC
7 MARCHÉ DES AVC EN ASIE-PACIFIQUE, PAR TYPE
7.1 APERÇU
7.2 Accident vasculaire cérébral ischémique
7.2.1 THROMBOTIQUE (THROMBOSE CÉRÉBRALE)
7.2.2 EMBOLIQUE (EMBOLIE CÉRÉBRALE)
7.3 Accident vasculaire cérébral hémorragique
7.3.1 HÉMORRAGIE SOUS-ARACHNOÏDIENNE
7.3.2 HÉMORRAGIE INTRACÉRÉBRALE
7.4 ATTAQUE ISCHÉMIQUE TRANSITOIRE (AIT)
8 MARCHÉ DES AVC EN ASIE-PACIFIQUE, PAR SEXE
8.1 APERÇU
8.2 FEMME
8,3 HOMME
9 MARCHÉ DES AVC EN ASIE-PACIFIQUE, PAR DIAGNOSTIC ET TRAITEMENT
9.1 APERÇU
9.2 TRAITEMENT
9.2.1 PAR TYPE DE TRAITEMENT
9.2.1.1 MÉDICAMENTS
9.2.1.1.1 MÉDICAMENTS, PAR CLASSE
9.2.1.1.1.1 MÉDICAMENTS CONTRE LA TENSION ARTÉRIELLE
9.2.1.1.1.1.1 INHIBITEURS DE L'ENZYME DE CONVERSION DE L'ANGIOTENSINE (ECA)
9.2.1.1.1.1.2 RAMIPRIL
9.2.1.1.1.1.3 LISINOPRIL
9.2.1.1.1.1.4 ÉNALAPRIL
9.2.1.1.1.1.5 PÉRINDOPRIL
9.2.1.1.1.1.6 AUTRE
9.2.1.1.1.2 DIURÉTIQUES THIAZIDIQUES
9.2.1.1.1.2.1 INDAPAMIDE
9.2.1.1.1.2.2 BENDROFLUMÉTHIAZIDE
9.2.1.1.1.2.3 SPIRONOLACTONE
9.2.1.1.1.2.4 AMILORIDE
9.2.1.1.1.2.5 AUTRE
9.2.1.1.1.3 BLOQUEURS DES CANAUX CALCIQUES
9.2.1.1.1.3.1 AMLODIPINE
9.2.1.1.1.3.2 NIFÉDIPINE
9.2.1.1.1.3.3 VÉRAPAMIL
9.2.1.1.1.3.4 NICARDIPINE
9.2.1.1.1.3.5 FÉLODIPINE
9.2.1.1.1.3.6 NIMODIPINE
9.2.1.1.1.3.7 AUTRES
9.2.1.1.1.4 BÊTA-BLOQUANTS
9.2.1.1.1.4.1 ATÉNOLOL
9.2.1.1.1.4.2 BISOPROLOL
9.2.1.1.1.4.3 LABÉTOLOL
9.2.1.1.1.4.4 AUTRES
9.2.1.1.1.5 ALPHA-BLOQUANTS
9.2.1.1.1.5.1 DOXAZOSINE
9.2.1.1.1.5.2 AUTRES
9.2.1.1.1.6 AUTRES
9.2.1.1.1.7 MÉDICAMENTS ANTIPLAQUETTAIRES
9.2.1.1.1.7.1 ASPIRINE
9.2.1.1.1.7.2 CLOPIDOGREL
9.2.1.1.1.7.3 DIPYRIDAMOLE
9.2.1.1.1.7.4 TICLOPIDINE
9.2.1.1.1.7.5 AUTRES
9.2.1.1.1.8 ANTICOAGULANTS
9.2.1.1.1.8.1 WARFARINE
9.2.1.1.1.8.2 APIXABAN
9.2.1.1.1.8.3 DABIGATRAN
9.2.1.1.1.8.4 HÉPARINE
9.2.1.1.1.8.5 RIVAROXABAN
9.2.1.1.1.8.6 AUTRES
9.2.1.1.1.9 ACTIVATEUR TISSULAIRE DU PLASMINOGÈNE (TPA)
9.2.1.1.1.9.1 ALTEPLASE
9.2.1.1.1.9.2 TÉNECTÉPLASE
9.2.1.1.1.9.3 RÉTÉPLASE
9.2.1.1.1.9.4 ANISTREPLASE
9.2.1.1.1.9.5 AUTRES
9.2.1.1.1.10 STATINES
9.2.1.1.1.10.1.1 ATORVASTATINE
9.2.1.1.1.10.1.2 SIMVASTATINE
9.2.1.1.1.10.1.3 LOVASTATINE
9.2.1.1.1.10.1.4 ROSUVASTATINE
9.2.1.1.1.10.1.5 FLUVASTATINE
9.2.1.1.1.10.1.6 PRAVASTATINE
9.2.1.1.1.10.1.7 PITAVASTATINE
9.2.1.1.1.10.1.8 AUTRES
9.2.1.1.1.11 VITAMINE K
9.2.1.1.1.12 MÉDICAMENTS DE SOUTIEN
9.2.1.1.1.12.1 COMPLÉMENTS NUTRITIONNELS
9.2.1.1.1.12.2 ANTIPYRÉTIQUES
9.2.1.1.1.12.3 AUTRES
9.2.1.1.2 MÉDICAMENTS, PAR TYPE DE MÉDICAMENT
9.2.1.1.2.1 MARQUE
9.2.1.1.2.1.1 ACTIVASE
9.2.1.1.2.1.2 EDOBAXAN
9.2.1.1.2.1.3 COUMADINE
9.2.1.1.2.1.4 HÉPARINE LEO
9.2.1.1.2.1.5 DUOPLAVIN
9.2.1.1.2.1.6 AGGRENOX
9.2.1.1.2.1.7 RETAVASE
9.2.1.1.2.1.8 JANTOVEN
9.2.1.1.2.1.9 CATHFLO
9.2.1.1.2.1.10 AUTRE
9.2.1.1.2.2 GÉNÉRIQUE
9.2.1.1.3 MÉDICAMENT, PAR VOIE D'ADMINISTRATION
9.2.1.1.3.1 ORALE
9.2.1.1.3.1.1 COMPRIMÉ
9.2.1.1.3.1.2 CAPSULES
9.2.1.1.3.1.3 AUTRES
9.2.1.1.3.2 PARENTÉRALE
9.2.1.1.3.2.1 INTRAVEINEUSE
9.2.1.1.3.2.2 SOUS-CUTANÉ
9.2.1.1.3.3 AUTRES
9.2.1.1.4 MÉDICAMENTS, PAR MODE D'ACHAT
9.2.1.1.4.1 ORDONNANCE
9.2.1.1.4.2 VENTE LIBRE (OTC)
9.2.1.1.5 MÉDICAMENTS, PAR TYPE DE THÉRAPIE
9.2.1.1.5.1 THÉRAPIE COMBINÉE
9.2.1.1.5.2 MONOTHÉRAPIE
9.2.1.2 CHIRURGIE
9.2.1.2.1 BOBINES EMBOLIQUES
9.2.1.2.2 CATHÉTERS D'ASPIRATION
9.2.1.2.3 DISPOSITIF DE RÉCUPÉRATION DE STENT
9.2.1.2.4 CLIPPING CHIRURGICAL
9.2.1.2.5 AUTRES
9.2.1.3 AUTRES THÉRAPIES
9.2.1.3.1 PHYSIOTHÉRAPIE
9.2.1.3.2 ERGOTHÉRAPIE
9.2.1.3.3 Orthophonie
9.2.1.3.4 AUTRES
9.3 DIAGNOSTIC
9.3.1 TEST D'IMAGERIE
9.3.1.1 TOMODENSITOMÉTRIE (TDM)
9.3.1.2 IMAGERIE PAR RÉSONANCE MAGNÉTIQUE (IRM)
9.3.1.3 ÉCHOGRAPHIE CAROTIDIENNE
9.3.1.4 ANGIOGRAMME CÉRÉBRAL
9.3.2 TEST SANGUIN
9.3.3 ÉCHOCARDIOGRAMME
9.3.4 PONCTION LOMBAIRE
9.3.5 AUTRES
10 MARCHÉ ASIE-PACIFIQUE DES AVC, PAR CANAL DE DISTRIBUTION
10.1 APERÇU
10.2 DIRECT
10.3 VENTE AU DÉTAIL
10.4 EN LIGNE
11 MARCHÉ DES AVC EN ASIE-PACIFIQUE, PAR UTILISATEUR FINAL
11.1 APERÇU
11.2 HÔPITAUX ET CLINIQUES
11.3 CLINIQUES SPÉCIALISÉES
11.4 CENTRE CHIRURGICAL AMBULATOIRE
11.5 SOINS À DOMICILE
11.6 LABORATOIRES
11.7 AUTRES
12 MARCHÉ DES AVC EN ASIE-PACIFIQUE, PAR RÉGION
12.1 ASIE-PACIFIQUE
12.1.1 CHINE
12.1.2 JAPON
12.1.3 INDE
12.1.4 AUSTRALIE
12.1.5 CORÉE DU SUD
12.1.6 SINGAPOUR
12.1.7 THAÏLANDE
12.1.8 PHILIPPINES
12.1.9 MALAISIE
12.1.10 INDONÉSIE
12.1.11 VIETNAM
12.1.12 TAÏWAN
12.1.13 RESTE DE L'ASIE-PACIFIQUE
13 MARCHÉ DES AVC EN ASIE-PACIFIQUE, PAYSAGE DES ENTREPRISES
13.1 ANALYSE DES ACTIONS DE L'ENTREPRISE : ASIE-PACIFIQUE
14 ANALYSE SWOT
15 PROFILS D'ENTREPRISE
15.1 SOCIÉTÉ BRISTOL-MYERS SQUIBB
15.1.1 INSTANTANÉ DE L'ENTREPRISE
15.1.2 ANALYSE DES REVENUS
15.1.3 ANALYSE DES ACTIONS DE LA SOCIÉTÉ
15.1.4 PORTEFEUILLE DE PRODUITS
15.2 F. HOFFMANN-LA ROCHE LTD
15.2.1 INSTANTANÉ DE L'ENTREPRISE
15.2.2 ANALYSE DES REVENUS
15.2.3 ANALYSE DES ACTIONS DE L'ENTREPRISE
15.2.4 PORTEFEUILLE DE PRODUITS
15.2.5 ÉVOLUTION RÉCENTE
15.3 BOEHRINGER INGELHEIM INTERNATIONAL GMBH
15.3.1 INSTANTANÉ DE L'ENTREPRISE
15.3.2 ANALYSE DES ACTIONS DE L'ENTREPRISE
15.3.3 PORTEFEUILLE DE PRODUITS
15.3.4 ÉVOLUTION RÉCENTE
15.4 DAIICHI SANKYO COMPANY, LIMITÉE
15.4.1 INSTANTANÉ DE L'ENTREPRISE
15.4.2 ANALYSE DES REVENUS
15.4.3 ANALYSE DES ACTIONS DE L'ENTREPRISE
15.4.4 PORTEFEUILLE DE PRODUITS
15.4.5 ÉVOLUTION RÉCENTE
15,5 SANOFI
15.5.1 INSTANTANÉ DE L'ENTREPRISE
15.5.2 ANALYSE DES REVENUS
15.5.3 ANALYSE DES ACTIONS DE L'ENTREPRISE
15.5.4 PORTEFEUILLE DE PRODUITS
15.6 ABBOTT
15.6.1 INSTANTANÉ DE L'ENTREPRISE
15.6.2 ANALYSE DES REVENUS
15.6.3 PORTEFEUILLE DE PRODUITS
15.6.4 ÉVOLUTION RÉCENTE
15.7 AMNEAL PHARMACEUTICALS LLC
15.7.1 INSTANTANÉ DE L'ENTREPRISE
15.7.2 ANALYSE DES REVENUS
15.7.3 PORTEFEUILLE DE PRODUITS
15.7.4 ÉVOLUTION RÉCENTE
15.8 ASTRAZENECA
15.8.1 INSTANTANÉ DE L'ENTREPRISE
15.8.2 ANALYSE DES REVENUS
15.8.3 PORTEFEUILLE DE PRODUITS
15.8.4 ÉVOLUTION RÉCENTE
15,9 BAYER AG
15.9.1 INSTANTANÉ DE L'ENTREPRISE
15.9.2 ANALYSE DES REVENUS
15.9.3 PORTEFEUILLE DE PRODUITS
15.9.4 ÉVOLUTION RÉCENTE
15.1 FRESENIUS SE & CO. KGAA
15.10.1 INSTANTANÉ DE L'ENTREPRISE
15.10.2 ANALYSE DES REVENUS
15.10.3 PORTEFEUILLE DE PRODUITS
15.10.4 ÉVOLUTION RÉCENTE
15.11 GLENMARK PHARMACEUTICALS LTD.
15.11.1 INSTANTANÉ DE L'ENTREPRISE
15.11.2 ANALYSE DES REVENUS
15.11.3 PORTEFEUILLE DE PRODUITS
15.11.4 ÉVOLUTION RÉCENTE
15.12 JOHNSON & JOHNSON SERVICES, INC.
15.12.1 COMPANY SNAPSHOT
15.12.2 REVENUE ANALYSIS
15.12.3 PRODUCT PORTFOLIO
15.12.4 RECENT DEVELOPMENT
15.13 LUPIN
15.13.1 COMPANY SNAPSHOT
15.13.2 REVENUE ANALYSIS
15.13.3 PRODUCT PORTFOLIO
15.13.4 RECENT DEVELOPMENT
15.14 MEDTRONIC
15.14.1 COMPANY SNAPSHOT
15.14.2 REVENUE ANALYSIS
15.14.3 PRODUCT PORTFOLIO
15.14.4 RECENT DEVELOPMENT
15.15 PENUMBRA, INC.
15.15.1 COMPANY SNAPSHOT
15.15.2 REVENUE ANALYSIS
15.15.3 PRODUCT PORTFOLIO
15.15.4 RECENT DEVELOPMENT
15.16 PFIZER INC.
15.16.1 COMPANY SNAPSHOT
15.16.2 REVENUE ANALYSIS
15.16.3 PRODUCT PORTFOLIO
15.16.4 RECENT DEVELOPMENT
15.17 SANDOZ AG
15.17.1 COMPANY SNAPSHOT
15.17.2 REVENUE ANALYSIS
15.17.3 PRODUCT PORTFOLIO
15.17.4 RECENT DEVELOPMENT
15.18 TEVA PHARMACEUTICALS USA, INC.
15.18.1 COMPANY SNAPSHOT
15.18.2 REVENUE ANALYSIS
15.18.3 PRODUCT PORTFOLIO
15.18.4 RECENT DEVELOPMENT
15.19 VIATRIS INC.
15.19.1 COMPANY SNAPSHOT
15.19.2 REVENUE ANALYSIS
15.19.3 PRODUCT PORTFOLIO
15.19.4 RECENT DEVELOPMENT
16 QUESTIONNAIRE
17 RELATED REPORTS
Liste des tableaux
TABLE 1 ASIA-PACIFIC STROKE MARKET, BY TYPE, 2018-2032 (USD THOUSAND)
TABLE 2 ASIA-PACIFIC ISCHEMIC STROKE IN STROKE MARKET, BY REGION, 2018-2032 (USD THOUSAND)
TABLE 3 ASIA-PACIFIC ISCHEMIC STROKE IN STROKE MARKET, BY TYPE, 2018-2032 (USD THOUSAND)
TABLE 4 ASIA-PACIFIC HEMORRHAGIC STROKE IN STROKE MARKET, BY REGION, 2018-2032 (USD THOUSAND)
TABLE 5 ASIA-PACIFIC HEMORRHAGIC STROKE IN STROKE MARKET, BY TYPE, 2018-2032 (USD THOUSAND)
TABLE 6 ASIA-PACIFIC TRANSIENT ISCHEMIC ATTACT (TIA) IN STROKE MARKET, BY REGION, 2018-2032 (USD THOUSAND)
TABLE 7 ASIA-PACIFIC STROKE MARKET, BY GENDER, 2018-2032 (USD THOUSAND)
TABLE 8 ASIA-PACIFIC FEMALE IN STROKE MARKET, BY REGION, 2018-2032 (USD THOUSAND)
TABLE 9 ASIA-PACIFIC MALE IN STROKE MARKET, BY REGION, 2018-2032 (USD THOUSAND)
TABLE 10 ASIA-PACIFIC STROKE MARKET, BY DIAGNOSIS AND TREATMENT, 2018-2032 (USD THOUSAND)
TABLE 11 ASIA-PACIFIC TREATMENT IN STROKE MARKET, BY REGION, 2018-2032 (USD THOUSAND)
TABLE 12 ASIA-PACIFIC TREATMENT IN STROKE MARKET, BY TREATMENT TYPE, 2018-2032 (USD THOUSAND)
TABLE 13 ASIA-PACIFIC MEDICATION IN STROKE MARKET, BY CLASS, 2018-2032 (USD THOUSAND)
TABLE 14 ASIA-PACIFIC BLOOD PRESSURE MEDICINES IN STROKE MARKET, BY CLASS, 2018-2032 (USD THOUSAND)
TABLE 15 ASIA-PACIFIC ANGIOTENSIN-CONVERTING ENZYME (ACE) INHIBITORS IN STROKE MARKET, BY CLASS, 2018-2032 (USD THOUSAND)
TABLE 16 ASIA-PACIFIC THIAZIDE DIURETICS IN STROKE MARKET, BY CLASS, 2018-2032 (USD THOUSAND)
TABLE 17 ASIA-PACIFIC CALCIUM CHANNEL BLOCKERS IN STROKE MARKET, BY CLASS, 2018-2032 (USD THOUSAND)
TABLE 18 ASIA-PACIFIC BETA BLOCKERS IN STROKE MARKET, BY CLASS, 2018-2032 (USD THOUSAND)
TABLE 19 ASIA-PACIFIC ALPHA-BLOCKERS IN STROKE MARKET, BY CLASS, 2018-2032 (USD THOUSAND)
TABLE 20 ASIA-PACIFIC ANTIPLATELET DRUGS IN STROKE MARKET, BY CLASS, 2018-2032 (USD THOUSAND)
TABLE 21 ASIA-PACIFIC ANTICOAGULANTS IN STROKE MARKET, BY CLASS, 2018-2032 (USD THOUSAND)
TABLE 22 ASIA-PACIFIC TISSUE PLASMINOGEN ACTIVATOR (TPA) IN STROKE MARKET, BY CLASS, 2018-2032 (USD THOUSAND)
TABLE 23 ASIA-PACIFIC STATINS IN STROKE MARKET, BY CLASS, 2018-2032 (USD THOUSAND)
TABLE 24 ASIA-PACIFIC SUPPORTIVE MEDICATION IN STROKE MARKET, BY CLASS, 2018-2032 (USD THOUSAND)
TABLE 25 ASIA-PACIFIC MEDICATION IN STROKE MARKET, BY DRUG TYPE, 2018-2032 (USD THOUSAND)
TABLE 26 ASIA-PACIFIC BRANDED IN STROKE MARKET, BY DRUG TYPE, 2018-2032 (USD THOUSAND)
TABLE 27 ASIA-PACIFIC MEDICATION IN STROKE MARKET, BY ROUTE OF ADMINISTRATION, 2018-2032 (USD THOUSAND)
TABLE 28 ASIA-PACIFIC ORAL IN STROKE MARKET, BY TYPE, 2018-2032 (USD THOUSAND)
TABLE 29 ASIA-PACIFIC PARENTERAL IN STROKE MARKET, BY TYPE, 2018-2032 (USD THOUSAND)
TABLE 30 ASIA-PACIFIC MEDICATION IN STROKE MARKET, BY MODE OF PURCHASE, 2018-2032 (USD THOUSAND)
TABLE 31 ASIA-PACIFIC MEDICATION IN STROKE MARKET, BY THERAPY TYPE, 2018-2032 (USD THOUSAND)
TABLE 32 ASIA-PACIFIC SURGERY IN STROKE MARKET, BY INSTRUMENT TYPE, 2018-2032 (USD THOUSAND)
TABLE 33 ASIA-PACIFIC OTHER THERAPY IN STROKE MARKET, BY TYPE, 2018-2032 (USD THOUSAND)
TABLE 34 ASIA-PACIFIC DIAGNOSIS IN STROKE MARKET, BY REGION, 2018-2032 (USD THOUSAND)
TABLE 35 ASIA-PACIFIC DIAGNOSIS IN STROKE MARKET, BY DIAGNOSIS TYPE, 2018-2032 (USD THOUSAND)
TABLE 36 ASIA-PACIFIC IMAGING TEST IN STROKE MARKET, BY TYPE, 2018-2032 (USD THOUSAND)
TABLE 37 ASIA-PACIFIC STROKE MARKET, BY DISTRIBUTION CHANNEL, 2018-2032 (USD THOUSAND)
TABLE 38 ASIA-PACIFIC DIRECT IN STROKE MARKET, BY REGION, 2018-2032 (USD THOUSAND)
TABLE 39 ASIA-PACIFIC RETAIL IN STROKE MARKET, BY REGION, 2018-2032 (USD THOUSAND)
TABLE 40 ASIA-PACIFIC ONLINE IN STROKE MARKET, BY REGION, 2018-2032 (USD THOUSAND)
TABLE 41 ASIA-PACIFIC STROKE MARKET, BY END USER, 2018-2032 (USD THOUSAND)
TABLE 42 ASIA-PACIFIC HOSPITALS & CLINICS IN STROKE MARKET, BY REGION, 2018-2032 (USD THOUSAND)
TABLE 43 ASIA-PACIFIC SPECIALTY CLINICS IN STROKE MARKET, BY REGION, 2018-2032 (USD THOUSAND)
TABLE 44 ASIA-PACIFIC AMBULATORY SURGICAL CENTER IN STROKE MARKET, BY REGION, 2018-2032 (USD THOUSAND)
TABLE 45 ASIA-PACIFIC HOMECARE IN STROKE MARKET, BY REGION, 2018-2032 (USD THOUSAND)
TABLE 46 ASIA-PACIFIC LABORATORIES IN STROKE MARKET, BY REGION, 2018-2032 (USD THOUSAND)
TABLE 47 ASIA-PACIFIC OTHERS IN STROKE MARKET, BY REGION, 2018-2032 (USD THOUSAND)
TABLE 48 ASIA-PACIFIC STROKE MARKET, BY COUNTRY, 2018-2032 (USD THOUSAND)
TABLE 49 ASIA-PACIFIC STROKE MARKET, BY TYPE, 2018-2032 (USD THOUSAND)
TABLEAU 50 ACCIDENT VASCULAIRE CYCLIQUE ISCHÉMIQUE SUR LE MARCHÉ DE L'AVC EN ASIE-PACIFIQUE, PAR TYPE, 2018-2032 (EN MILLIERS USD)
TABLEAU 51 ACCIDENT VASCULAIRE CÉRÉBRAL HÉMORRAGIQUE EN ASIE-PACIFIQUE, PAR TYPE, 2018-2032 (EN MILLIERS USD)
TABLEAU 52 MARCHÉ DES AVC EN ASIE-PACIFIQUE, PAR DIAGNOSTIC ET TRAITEMENT, 2018-2032 (EN MILLIERS USD)
TABLEAU 53 TRAITEMENT DES AVC EN ASIE-PACIFIQUE, PAR TYPE DE TRAITEMENT, 2018-2032 (EN MILLIERS USD)
TABLEAU 54 MÉDICAMENTS SUR LE MARCHÉ DES AVC EN ASIE-PACIFIQUE, PAR CLASSE, 2018-2032 (EN MILLIERS USD)
TABLEAU 55 MÉDICAMENTS CONTRE LA TENSION ARTÉRIELLE SUR LE MARCHÉ DES AVC EN ASIE-PACIFIQUE, PAR CATÉGORIE, 2018-2032 (EN MILLIERS USD)
TABLEAU 56 INHIBITEURS DE L'ENZYME DE CONVERSION DE L'ANGIOTENSINE (ECA) SUR LE MARCHÉ DES AVC EN ASIE-PACIFIQUE, PAR CLASSE, 2018-2032 (EN MILLIERS USD)
TABLEAU 57 DIURÉTIQUES THIAZIDES SUR LE MARCHÉ DES AVC EN ASIE-PACIFIQUE, PAR CLASSE, 2018-2032 (EN MILLIERS USD)
TABLEAU 58 BLOQUEURS DES CANAUX CALCIQUES SUR LE MARCHÉ DES AVC EN ASIE-PACIFIQUE, PAR CLASSE, 2018-2032 (EN MILLIERS USD)
TABLEAU 59 BÊTA-BLOQUANTS SUR LE MARCHÉ DES AVC EN ASIE-PACIFIQUE, PAR CLASSE, 2018-2032 (EN MILLIERS USD)
TABLEAU 60 ALPHA-BLOQUANTS SUR LE MARCHÉ DES AVC EN ASIE-PACIFIQUE, PAR CLASSE, 2018-2032 (EN MILLIERS USD)
TABLEAU 61 MÉDICAMENTS ANTIPLAQUETTAIRES SUR LE MARCHÉ DE L'AVC EN ASIE-PACIFIQUE, PAR CLASSE, 2018-2032 (EN MILLIERS USD)
TABLEAU 62 ANTICOAGULANTS SUR LE MARCHÉ DES AVC EN ASIE-PACIFIQUE, PAR CLASSE, 2018-2032 (EN MILLIERS USD)
TABLEAU 63 ACTIVATEUR TISSULAIRE DU PLASMINOGÈNE (TPA) SUR LE MARCHÉ DE L'AVC EN ASIE-PACIFIQUE, PAR CLASSE, 2018-2032 (EN MILLIERS USD)
TABLEAU 64 STATINES SUR LE MARCHÉ DES AVC EN ASIE-PACIFIQUE, PAR CLASSE, 2018-2032 (EN MILLIERS USD)
TABLEAU 65 MÉDICAMENTS DE SOUTIEN SUR LE MARCHÉ DES AVC EN ASIE-PACIFIQUE, PAR CATÉGORIE, 2018-2032 (EN MILLIERS USD)
TABLEAU 66 MÉDICAMENTS SUR LE MARCHÉ DES AVC EN ASIE-PACIFIQUE, PAR TYPE DE MÉDICAMENT, 2018-2032 (EN MILLIERS USD)
TABLEAU 67 MARQUES ASIE-PACIFIQUE SUR LE MARCHÉ DES AVC, PAR TYPE DE MÉDICAMENT, 2018-2032 (EN MILLIERS USD)
TABLEAU 68 MÉDICAMENTS SUR LE MARCHÉ DES AVC EN ASIE-PACIFIQUE, PAR VOIE D'ADMINISTRATION, 2018-2032 (EN MILLIERS USD)
TABLEAU 69 MARCHÉ DES SOINS ORAUX EN CAS D'AVC EN ASIE-PACIFIQUE, PAR TYPE, 2018-2032 (EN MILLIERS USD)
TABLEAU 70 MARCHÉ DES TRAITEMENTS PARENTÉRAUX EN CAS D'AVC EN ASIE-PACIFIQUE, PAR TYPE, 2018-2032 (EN MILLIERS USD)
TABLEAU 71 MÉDICAMENTS SUR LE MARCHÉ DES AVC EN ASIE-PACIFIQUE, PAR MODE D'ACHAT, 2018-2032 (EN MILLIERS USD)
TABLEAU 72 MÉDICAMENTS SUR LE MARCHÉ DES AVC EN ASIE-PACIFIQUE, PAR TYPE DE THÉRAPIE, 2018-2032 (EN MILLIERS USD)
TABLEAU 73 CHIRURGIE SUR LE MARCHÉ DE L'AVC EN ASIE-PACIFIQUE, PAR TYPE D'INSTRUMENT, 2018-2032 (EN MILLIERS USD)
TABLEAU 74 AUTRES THÉRAPIES SUR LE MARCHÉ DE L'AVC EN ASIE-PACIFIQUE, PAR TYPE, 2018-2032 (EN MILLIERS USD)
TABLEAU 75 DIAGNOSTIC DES AVC EN ASIE-PACIFIQUE, PAR TYPE DE DIAGNOSTIC, 2018-2032 (EN MILLIERS USD)
TABLEAU 76 TESTS D'IMAGERIE SUR LE MARCHÉ DE L'AVC EN ASIE-PACIFIQUE, PAR TYPE, 2018-2032 (EN MILLIERS USD)
TABLEAU 77 MARCHÉ DES AVC EN ASIE-PACIFIQUE, PAR SEXE, 2018-2032 (EN MILLIERS USD)
TABLEAU 78 MARCHÉ ASIE-PACIFIQUE DES AVC, PAR UTILISATEUR FINAL, 2018-2032 (MILLIERS USD)
TABLEAU 79 MARCHÉ DES AVC EN ASIE-PACIFIQUE, PAR CANAL DE DISTRIBUTION, 2018-2032 (EN MILLIERS USD)
TABLEAU 80 MARCHÉ DES AVC EN CHINE, PAR TYPE, 2018-2032 (EN MILLIERS USD)
TABLEAU 81 ACCIDENT VASCULAIRE CÉRÉBRAL ISCHÉMIQUE EN CHINE, PAR TYPE, 2018-2032 (MILLIERS USD)
TABLEAU 82 ACCIDENT VASCULAIRE CÉRÉBRAL HÉMORRAGIQUE EN CHINE, PAR TYPE, 2018-2032 (EN MILLIERS USD)
TABLEAU 83 MARCHÉ DES AVC EN CHINE, PAR DIAGNOSTIC ET TRAITEMENT, 2018-2032 (EN MILLIERS USD)
TABLEAU 84 TRAITEMENT DES AVC EN CHINE, PAR TYPE DE TRAITEMENT, 2018-2032 (EN MILLIERS USD)
TABLEAU 85 MÉDICAMENTS CHINOIS SUR LE MARCHÉ DES AVC, PAR CATÉGORIE, 2018-2032 (EN MILLIERS USD)
TABLEAU 86 MÉDICAMENTS CONTRE LA TENSION ARTÉRIELLE SUR LE MARCHÉ DES AVC EN CHINE, PAR CATÉGORIE, 2018-2032 (EN MILLIERS USD)
TABLEAU 87 INHIBITEURS DE L'ENZYME DE CONVERSION DE L'ANGIOTENSINE (ECA) SUR LE MARCHÉ CHINOIS DES AVC, PAR CLASSE, 2018-2032 (EN MILLIERS USD)
TABLEAU 88 DIURÉTIQUES THIAZIDIQUES SUR LE MARCHÉ CHINOIS DES AVC, PAR CLASSE, 2018-2032 (EN MILLIERS USD)
TABLEAU 89 BLOQUEURS DES CANAUX CALCIQUES SUR LE MARCHÉ DE L'AVC EN CHINE, PAR CLASSE, 2018-2032 (EN MILLIERS USD)
TABLEAU 90 BÊTA-BLOQUANTS SUR LE MARCHÉ CHINOIS DE L'AVC, PAR CLASSE, 2018-2032 (EN MILLIERS USD)
TABLEAU 91 ALPHA-BLOQUANTS SUR LE MARCHÉ CHINOIS DE L'AVC, PAR CLASSE, 2018-2032 (EN MILLIERS USD)
TABLEAU 92 MÉDICAMENTS ANTIPLAQUETTAIRES CHINOIS SUR LE MARCHÉ DE L'AVC, PAR CLASSE, 2018-2032 (EN MILLIERS USD)
TABLEAU 93 ANTICOAGULANTS CHINOIS SUR LE MARCHÉ DES AVC, PAR CATÉGORIE, 2018-2032 (EN MILLIERS USD)
TABLEAU 94 ACTIVATEUR DE PLASMINOGÈNE TISSULAIRE (TPA) SUR LE MARCHÉ DE L'AVC EN CHINE, PAR CLASSE, 2018-2032 (EN MILLIERS USD)
TABLEAU 95 STATINES CHINOISES SUR LE MARCHÉ DES AVC, PAR CLASSE, 2018-2032 (EN MILLIERS USD)
TABLEAU 96 MÉDICAMENTS DE SOUTIEN SUR LE MARCHÉ DES AVC EN CHINE, PAR CATÉGORIE, 2018-2032 (EN MILLIERS USD)
TABLEAU 97 MÉDICAMENTS CHINOIS SUR LE MARCHÉ DES AVC, PAR TYPE DE MÉDICAMENT, 2018-2032 (EN MILLIERS USD)
TABLEAU 98 MARQUES CHINOISES SUR LE MARCHÉ DES AVC, PAR TYPE DE MÉDICAMENT, 2018-2032 (EN MILLIERS USD)
TABLEAU 99 MÉDICAMENTS CHINOIS SUR LE MARCHÉ DES AVC, PAR VOIE D'ADMINISTRATION, 2018-2032 (EN MILLIERS USD)
TABLEAU 100 MARCHÉ CHINOIS DES SOINS ORAUX POUR LES AVC, PAR TYPE, 2018-2032 (EN MILLIERS USD)
TABLEAU 101 MARCHÉ CHINOIS DES TRAITEMENTS PARENTÉRAUX EN CAS D'AVC, PAR TYPE, 2018-2032 (EN MILLIERS USD)
TABLEAU 102 MÉDICAMENTS CHINOIS SUR LE MARCHÉ DES AVC, PAR MODE D'ACHAT, 2018-2032 (EN MILLIERS USD)
TABLEAU 103 MÉDICAMENTS CHINOIS SUR LE MARCHÉ DES AVC, PAR TYPE DE THÉRAPIE, 2018-2032 (EN MILLIERS USD)
TABLEAU 104 CHIRURGIE CHIRURGIE SUR LE MARCHÉ DE L'AVC EN CHINE, PAR TYPE D'INSTRUMENT, 2018-2032 (EN MILLIERS USD)
TABLEAU 105 AUTRES THÉRAPIES SUR LE MARCHÉ DE L'AVC EN CHINE, PAR TYPE, 2018-2032 (EN MILLIERS USD)
TABLEAU 106 MARCHÉ DU DIAGNOSTIC DES AVC EN CHINE, PAR TYPE DE DIAGNOSTIC, 2018-2032 (EN MILLIERS USD)
TABLEAU 107 MARCHÉ DES TESTS D'IMAGERIE EN CHINE POUR LES AVC, PAR TYPE, 2018-2032 (EN MILLIERS USD)
TABLEAU 108 MARCHÉ DES AVC EN CHINE, PAR SEXE, 2018-2032 (EN MILLIERS USD)
TABLEAU 109 MARCHÉ DES AVC EN CHINE, PAR UTILISATEUR FINAL, 2018-2032 (EN MILLIERS USD)
TABLEAU 110 MARCHÉ DES AVC EN CHINE, PAR CANAL DE DISTRIBUTION, 2018-2032 (EN MILLIERS USD)
TABLEAU 111 MARCHÉ JAPONAIS DES AVC, PAR TYPE, 2018-2032 (EN MILLIERS USD)
TABLEAU 112 ACCIDENT VASCULAIRE CÉRÉBRAL ISCHÉMIQUE AU JAPON, PAR TYPE, 2018-2032 (MILLIERS USD)
TABLEAU 113 ACCIDENT VASCULAIRE CÉRÉBRAL HÉMORRAGIQUE AU JAPON, PAR TYPE, 2018-2032 (EN MILLIERS USD)
TABLEAU 114 MARCHÉ JAPONAIS DES AVC, PAR DIAGNOSTIC ET TRAITEMENT, 2018-2032 (EN MILLIERS USD)
TABLEAU 115 TRAITEMENT DES AVC AU JAPON, PAR TYPE DE TRAITEMENT, 2018-2032 (EN MILLIERS USD)
TABLEAU 116 MÉDICAMENTS SUR LE MARCHÉ JAPONAIS CONTRE LES AVC, PAR CATÉGORIE, 2018-2032 (EN MILLIERS USD)
TABLEAU 117 MÉDICAMENTS CONTRE LA TENSION ARTÉRIELLE SUR LE MARCHÉ JAPONAIS DE L'AVC, PAR CATÉGORIE, 2018-2032 (EN MILLIERS USD)
TABLE 118 JAPAN ANGIOTENSIN-CONVERTING ENZYME (ACE) INHIBITORS IN STROKE MARKET, BY CLASS, 2018-2032 (USD THOUSAND)
TABLE 119 JAPAN THIAZIDE DIURETICS IN STROKE MARKET, BY CLASS, 2018-2032 (USD THOUSAND)
TABLE 120 JAPAN CALCIUM CHANNEL BLOCKERS IN STROKE MARKET, BY CLASS, 2018-2032 (USD THOUSAND)
TABLE 121 JAPAN BETA BLOCKERS IN STROKE MARKET, BY CLASS, 2018-2032 (USD THOUSAND)
TABLE 122 JAPAN ALPHA-BLOCKERS IN STROKE MARKET, BY CLASS, 2018-2032 (USD THOUSAND)
TABLE 123 JAPAN ANTIPLATELET DRUGS IN STROKE MARKET, BY CLASS, 2018-2032 (USD THOUSAND)
TABLE 124 JAPAN ANTICOAGULANTS IN STROKE MARKET, BY CLASS, 2018-2032 (USD THOUSAND)
TABLE 125 JAPAN TISSUE PLASMINOGEN ACTIVATOR (TPA) IN STROKE MARKET, BY CLASS, 2018-2032 (USD THOUSAND)
TABLE 126 JAPAN STATINS IN STROKE MARKET, BY CLASS, 2018-2032 (USD THOUSAND)
TABLE 127 JAPAN SUPPORTIVE MEDICATION IN STROKE MARKET, BY CLASS, 2018-2032 (USD THOUSAND)
TABLE 128 JAPAN MEDICATION IN STROKE MARKET, BY DRUG TYPE, 2018-2032 (USD THOUSAND)
TABLE 129 JAPAN BRANDED IN STROKE MARKET, BY DRUG TYPE, 2018-2032 (USD THOUSAND)
TABLE 130 JAPAN MEDICATION IN STROKE MARKET, BY ROUTE OF ADMINISTRATION, 2018-2032 (USD THOUSAND)
TABLE 131 JAPAN ORAL IN STROKE MARKET, BY TYPE, 2018-2032 (USD THOUSAND)
TABLE 132 JAPAN PARENTERAL IN STROKE MARKET, BY TYPE, 2018-2032 (USD THOUSAND)
TABLE 133 JAPAN MEDICATION IN STROKE MARKET, BY MODE OF PURCHASE, 2018-2032 (USD THOUSAND)
TABLE 134 JAPAN MEDICATION IN STROKE MARKET, BY THERAPY TYPE, 2018-2032 (USD THOUSAND)
TABLE 135 JAPAN SURGERY IN STROKE MARKET, BY INSTRUMENT TYPE, 2018-2032 (USD THOUSAND)
TABLE 136 JAPAN OTHER THERAPY IN STROKE MARKET, BY TYPE, 2018-2032 (USD THOUSAND)
TABLE 137 JAPAN DIAGNOSIS IN STROKE MARKET, BY DIAGNOSIS TYPE, 2018-2032 (USD THOUSAND)
TABLE 138 JAPAN IMAGING TEST IN STROKE MARKET, BY TYPE, 2018-2032 (USD THOUSAND)
TABLE 139 JAPAN STROKE MARKET, BY GENDER, 2018-2032 (USD THOUSAND)
TABLE 140 JAPAN STROKE MARKET, BY END USER, 2018-2032 (USD THOUSAND)
TABLE 141 JAPAN STROKE MARKET, BY DISTRIBUTION CHANNEL, 2018-2032 (USD THOUSAND)
TABLE 142 INDIA STROKE MARKET, BY TYPE, 2018-2032 (USD THOUSAND)
TABLE 143 INDIA ISCHEMIC STROKE IN STROKE MARKET, BY TYPE, 2018-2032 (USD THOUSAND)
TABLE 144 INDIA HEMORRHAGIC STROKE IN STROKE MARKET, BY TYPE, 2018-2032 (USD THOUSAND)
TABLE 145 INDIA STROKE MARKET, BY DIAGNOSIS AND TREATMENT, 2018-2032 (USD THOUSAND)
TABLE 146 INDIA TREATMENT IN STROKE MARKET, BY TREATMENT TYPE, 2018-2032 (USD THOUSAND)
TABLE 147 INDIA MEDICATION IN STROKE MARKET, BY CLASS, 2018-2032 (USD THOUSAND)
TABLE 148 INDIA BLOOD PRESSURE MEDICINE IN STROKE MARKET, BY CLASS, 2018-2032 (USD THOUSAND)
TABLE 149 INDIA ANGIOTENSIN-CONVERTING ENZYME (ACE) INHIBITORS IN STROKE MARKET, BY CLASS, 2018-2032 (USD THOUSAND)
TABLE 150 INDIA THIAZIDE DIURETICS IN STROKE MARKET, BY CLASS, 2018-2032 (USD THOUSAND)
TABLE 151 INDIA CALCIUM CHANNEL BLOCKERS IN STROKE MARKET, BY CLASS, 2018-2032 (USD THOUSAND)
TABLE 152 INDIA BETA BLOCKERS IN STROKE MARKET, BY CLASS, 2018-2032 (USD THOUSAND)
TABLEAU 153 ALPHA-BLOQUANTS SUR LE MARCHÉ INDIEN DE L'AVC, PAR CLASSE, 2018-2032 (EN MILLIERS USD)
TABLEAU 154 MÉDICAMENTS ANTIPLAQUETTAIRES SUR LE MARCHÉ INDIEN DE L'AVC, PAR CATÉGORIE, 2018-2032 (EN MILLIERS USD)
TABLEAU 155 ANTICOAGULANTS INDIENS SUR LE MARCHÉ DES AVC, PAR CATÉGORIE, 2018-2032 (EN MILLIERS USD)
TABLEAU 156 ACTIVATEUR DE PLASMINOGÈNE TISSULAIRE (TPA) SUR LE MARCHÉ INDIEN DE L'AVC, PAR CLASSE, 2018-2032 (EN MILLIERS USD)
TABLEAU 157 STATINES INDIENNES SUR LE MARCHÉ DES AVC, PAR CATÉGORIE, 2018-2032 (EN MILLIERS USD)
TABLEAU 158 MÉDICAMENTS DE SOUTIEN SUR LE MARCHÉ INDIEN DES AVC, PAR CATÉGORIE, 2018-2032 (EN MILLIERS USD)
TABLEAU 159 MÉDICAMENTS SUR LE MARCHÉ INDIEN DES AVC, PAR TYPE DE MÉDICAMENT, 2018-2032 (EN MILLIERS USD)
TABLEAU 160 MARQUE INDIENNE SUR LE MARCHÉ DES AVC, PAR TYPE DE MÉDICAMENT, 2018-2032 (EN MILLIERS USD)
TABLEAU 161 MÉDICAMENTS INDIENS SUR LE MARCHÉ DES AVC, PAR VOIE D'ADMINISTRATION, 2018-2032 (EN MILLIERS USD)
TABLEAU 162 MARCHÉ INDIEN DES SOINS ORAUX POUR LES AVC, PAR TYPE, 2018-2032 (EN MILLIERS USD)
TABLEAU 163 MARCHÉ INDIEN DES TRAITEMENTS PARENTÉRAUX EN CAS D'AVC, PAR TYPE, 2018-2032 (EN MILLIERS USD)
TABLEAU 164 MÉDICAMENTS INDIENS SUR LE MARCHÉ DES AVC, PAR MODE D'ACHAT, 2018-2032 (EN MILLIERS USD)
TABLEAU 165 MÉDICAMENTS INDIENS SUR LE MARCHÉ DES AVC, PAR TYPE DE THÉRAPIE, 2018-2032 (EN MILLIERS USD)
TABLEAU 166 MARCHÉ INDIEN DE LA CHIRURGIE CONTRE LES AVC, PAR TYPE D'INSTRUMENT, 2018-2032 (EN MILLIERS USD)
TABLEAU 167 AUTRES THÉRAPIES SUR LE MARCHÉ INDIEN DE L'AVC, PAR TYPE, 2018-2032 (EN MILLIERS USD)
TABLEAU 168 DIAGNOSTIC DES AVC EN INDE, PAR TYPE DE DIAGNOSTIC, 2018-2032 (EN MILLIERS USD)
TABLEAU 169 MARCHÉ INDIEN DES TESTS D'IMAGERIE POUR LES AVC, PAR TYPE, 2018-2032 (EN MILLIERS USD)
TABLEAU 170 MARCHÉ INDIEN DES AVC, PAR SEXE, 2018-2032 (EN MILLIERS USD)
TABLEAU 171 MARCHÉ INDIEN DES AVC, PAR UTILISATEUR FINAL, 2018-2032 (EN MILLIERS USD)
TABLEAU 172 MARCHÉ INDIEN DES AVC, PAR CANAL DE DISTRIBUTION, 2018-2032 (EN MILLIERS USD)
TABLEAU 173 MARCHÉ AUSTRALIEN DES AVC, PAR TYPE, 2018-2032 (EN MILLIERS USD)
TABLEAU 174 AVC ISCHÉMIQUE SUR LE MARCHÉ DES AVC EN AUSTRALIE, PAR TYPE, 2018-2032 (EN MILLIERS USD)
TABLEAU 175 AVC HÉMORRAGIQUE SUR LE MARCHÉ DES AVC EN AUSTRALIE, PAR TYPE, 2018-2032 (EN MILLIERS USD)
TABLEAU 176 MARCHÉ AUSTRALIEN DES AVC, PAR DIAGNOSTIC ET TRAITEMENT, 2018-2032 (EN MILLIERS USD)
TABLEAU 177 TRAITEMENT DES AVC EN AUSTRALIE, PAR TYPE DE TRAITEMENT, 2018-2032 (EN MILLIERS USD)
TABLEAU 178 MÉDICAMENTS SUR LE MARCHÉ AUSTRALIEN DES AVC, PAR CATÉGORIE, 2018-2032 (EN MILLIERS USD)
TABLEAU 179 MÉDICAMENTS CONTRE LA TENSION ARTÉRIELLE SUR LE MARCHÉ AUSTRALIEN DES AVC, PAR CATÉGORIE, 2018-2032 (EN MILLIERS USD)
TABLEAU 180 INHIBITEURS DE L'ENZYME DE CONVERSION DE L'ANGIOTENSINE (ECA) SUR LE MARCHÉ AUSTRALIEN DES AVC, PAR CLASSE, 2018-2032 (EN MILLIERS USD)
TABLEAU 181 DIURÉTIQUES THIAZIDES SUR LE MARCHÉ AUSTRALIEN DES AVC, PAR CLASSE, 2018-2032 (EN MILLIERS USD)
TABLEAU 182 BLOQUEURS DES CANAUX CALCIQUES SUR LE MARCHÉ AUSTRALIEN DE L'AVC, PAR CLASSE, 2018-2032 (EN MILLIERS USD)
TABLEAU 183 BÊTA-BLOQUANTS SUR LE MARCHÉ AUSTRALIEN DES AVC, PAR CLASSE, 2018-2032 (EN MILLIERS USD)
TABLEAU 184 ALPHA-BLOQUANTS SUR LE MARCHÉ AUSTRALIEN DES ALPHA-BLOQUANTS, PAR CLASSE, 2018-2032 (EN MILLIERS USD)
TABLEAU 185 MÉDICAMENTS ANTIPLAQUETTAIRES SUR LE MARCHÉ AUSTRALIEN DES AVC, PAR CATÉGORIE, 2018-2032 (EN MILLIERS USD)
TABLEAU 186 ANTICOAGULANTS AUSTRALIENS SUR LE MARCHÉ DES AVC, PAR CLASSE, 2018-2032 (EN MILLIERS USD)
TABLEAU 187 ACTIVATEUR TISSULAIRE DU PLASMINOGÈNE (TPA) SUR LE MARCHÉ AUSTRALIEN DE L'AVC, PAR CLASSE, 2018-2032 (EN MILLIERS USD)
TABLEAU 188 STATINES SUR LE MARCHÉ AUSTRALIEN DES TRAITEMENTS CONTRE LES AVC, PAR CLASSE, 2018-2032 (EN MILLIERS USD)
TABLEAU 189 MÉDICAMENTS DE SOUTIEN SUR LE MARCHÉ AUSTRALIEN DES AVC, PAR CATÉGORIE, 2018-2032 (EN MILLIERS USD)
TABLEAU 190 MÉDICAMENTS SUR LE MARCHÉ AUSTRALIEN DES AVC, PAR TYPE DE MÉDICAMENT, 2018-2032 (EN MILLIERS USD)
TABLEAU 191 MARQUE AUSTRALIENNE SUR LE MARCHÉ DES AVC, PAR TYPE DE MÉDICAMENT, 2018-2032 (EN MILLIERS USD)
TABLEAU 192 MÉDICAMENTS SUR LE MARCHÉ AUSTRALIEN DES AVC, PAR VOIE D'ADMINISTRATION, 2018-2032 (EN MILLIERS USD)
TABLEAU 193 MARCHÉ AUSTRALIEN DES SOINS ORAUX POUR LES AVC, PAR TYPE, 2018-2032 (EN MILLIERS USD)
TABLEAU 194 MARCHÉ AUSTRALIEN DES TRAITEMENTS PARENTÉRAUX EN CAS D'AVC, PAR TYPE, 2018-2032 (EN MILLIERS USD)
TABLEAU 195 MÉDICAMENTS SUR LE MARCHÉ AUSTRALIEN DES AVC, PAR MODE D'ACHAT, 2018-2032 (EN MILLIERS USD)
TABLEAU 196 MÉDICAMENTS SUR LE MARCHÉ AUSTRALIEN DES TRAITEMENTS CONTRE LES AVC, PAR TYPE DE THÉRAPIE, 2018-2032 (EN MILLIERS USD)
TABLEAU 197 CHIRURGIE SUR LE MARCHÉ AUSTRALIEN DE L'AVC, PAR TYPE D'INSTRUMENT, 2018-2032 (EN MILLIERS USD)
TABLEAU 198 AUTRES THÉRAPIES SUR LE MARCHÉ AUSTRALIEN DE L'AVC, PAR TYPE, 2018-2032 (EN MILLIERS USD)
TABLEAU 199 MARCHÉ AUSTRALIEN DU DIAGNOSTIC DES AVC, PAR TYPE DE DIAGNOSTIC, 2018-2032 (EN MILLIERS USD)
TABLEAU 200 MARCHÉ AUSTRALIEN DES TESTS D'IMAGERIE SUR LES AVC, PAR TYPE, 2018-2032 (EN MILLIERS USD)
TABLEAU 201 MARCHÉ AUSTRALIEN DES AVC, PAR SEXE, 2018-2032 (EN MILLIERS USD)
TABLEAU 202 MARCHÉ AUSTRALIEN DES AVC, PAR UTILISATEUR FINAL, 2018-2032 (MILLIERS USD)
TABLEAU 203 MARCHÉ AUSTRALIEN DES AVC, PAR CANAL DE DISTRIBUTION, 2018-2032 (EN MILLIERS USD)
TABLEAU 204 MARCHÉ DES AVC EN CORÉE DU SUD, PAR TYPE, 2018-2032 (EN MILLIERS USD)
TABLEAU 205 AVC ISCHÉMIQUE SUR LE MARCHÉ DES AVC EN CORÉE DU SUD, PAR TYPE, 2018-2032 (EN MILLIERS USD)
TABLEAU 206 AVC HÉMORRAGIQUE SUR LE MARCHÉ DES AVC EN CORÉE DU SUD, PAR TYPE, 2018-2032 (EN MILLIERS USD)
TABLEAU 207 MARCHÉ DES AVC EN CORÉE DU SUD, PAR DIAGNOSTIC ET TRAITEMENT, 2018-2032 (EN MILLIERS USD)
TABLEAU 208 TRAITEMENT DES AVC EN CORÉE DU SUD, PAR TYPE DE TRAITEMENT, 2018-2032 (EN MILLIERS USD)
TABLEAU 209 MÉDICAMENTS SUR LE MARCHÉ DES AVC EN CORÉE DU SUD, PAR CATÉGORIE, 2018-2032 (EN MILLIERS USD)
TABLEAU 210 MÉDICAMENTS CONTRE LA TENSION ARTÉRIELLE SUR LE MARCHÉ DES AVC EN CORÉE DU SUD, PAR CATÉGORIE, 2018-2032 (EN MILLIERS USD)
TABLEAU 211 INHIBITEURS DE L'ENZYME DE CONVERSION DE L'ANGIOTENSINE (ECA) SUR LE MARCHÉ DES AVC EN CORÉE DU SUD, PAR CLASSE, 2018-2032 (EN MILLIERS USD)
TABLEAU 212 DIURÉTIQUES THIAZIDES SUR LE MARCHÉ DES AVC EN CORÉE DU SUD, PAR CLASSE, 2018-2032 (EN MILLIERS USD)
TABLEAU 213 INHIBITEURS CALCIQUES SUR LE MARCHÉ DES AVC EN CORÉE DU SUD, PAR CLASSE, 2018-2032 (EN MILLIERS USD)
TABLEAU 214 BÊTA-BLOQUANTS SUR LE MARCHÉ DES AVC EN CORÉE DU SUD, PAR CLASSE, 2018-2032 (EN MILLIERS USD)
TABLEAU 215 ALPHA-BLOQUANTS SUR LE MARCHÉ DES AVC EN CORÉE DU SUD, PAR CLASSE, 2018-2032 (EN MILLIERS USD)
TABLEAU 216 MÉDICAMENTS ANTIPLAQUETTAIRES SUR LE MARCHÉ DES AVC EN CORÉE DU SUD, PAR CLASSE, 2018-2032 (EN MILLIERS USD)
TABLEAU 217 ANTICOAGULANTS SUR LE MARCHÉ DES AVC EN CORÉE DU SUD, PAR CLASSE, 2018-2032 (EN MILLIERS USD)
TABLEAU 218 ACTIVATEUR DE PLASMINOGÈNE TISSULAIRE (TPA) SUR LE MARCHÉ DES AVC EN CORÉE DU SUD, PAR CLASSE, 2018-2032 (EN MILLIERS USD)
TABLEAU 219 STATINES SUR LE MARCHÉ DES AVC EN CORÉE DU SUD, PAR CLASSE, 2018-2032 (EN MILLIERS USD)
TABLE 220 SOUTH KOREA SUPPORTIVE MEDICATION IN STROKE MARKET, BY CLASS, 2018-2032 (USD THOUSAND)
TABLE 221 SOUTH KOREA MEDICATION IN STROKE MARKET, BY DRUG TYPE, 2018-2032 (USD THOUSAND)
TABLE 222 SOUTH KOREA BRANDED IN STROKE MARKET, BY DRUG TYPE, 2018-2032 (USD THOUSAND)
TABLE 223 SOUTH KOREA MEDICATION IN STROKE MARKET, BY ROUTE OF ADMINISTRATION, 2018-2032 (USD THOUSAND)
TABLE 224 SOUTH KOREA ORAL IN STROKE MARKET, BY TYPE, 2018-2032 (USD THOUSAND)
TABLE 225 SOUTH KOREA PARENTERAL IN STROKE MARKET, BY TYPE, 2018-2032 (USD THOUSAND)
TABLE 226 SOUTH KOREA MEDICATION IN STROKE MARKET, BY MODE OF PURCHASE, 2018-2032 (USD THOUSAND)
TABLE 227 SOUTH KOREA MEDICATION IN STROKE MARKET, BY THERAPY TYPE, 2018-2032 (USD THOUSAND)
TABLE 228 SOUTH KOREA SURGERY IN STROKE MARKET, BY INSTRUMENT TYPE, 2018-2032 (USD THOUSAND)
TABLE 229 SOUTH KOREA OTHER THERAPY IN STROKE MARKET, BY TYPE, 2018-2032 (USD THOUSAND)
TABLE 230 SOUTH KOREA DIAGNOSIS IN STROKE MARKET, BY DIAGNOSIS TYPE, 2018-2032 (USD THOUSAND)
TABLE 231 SOUTH KOREA IMAGING TEST IN STROKE MARKET, BY TYPE, 2018-2032 (USD THOUSAND)
TABLE 232 SOUTH KOREA STROKE MARKET, BY GENDER, 2018-2032 (USD THOUSAND)
TABLE 233 SOUTH KOREA STROKE MARKET, BY END USER, 2018-2032 (USD THOUSAND)
TABLE 234 SOUTH KOREA STROKE MARKET, BY DISTRIBUTION CHANNEL, 2018-2032 (USD THOUSAND)
TABLE 235 SINGAPORE STROKE MARKET, BY TYPE, 2018-2032 (USD THOUSAND)
TABLE 236 SINGAPORE ISCHEMIC STROKE IN STROKE MARKET, BY TYPE, 2018-2032 (USD THOUSAND)
TABLE 237 SINGAPORE HEMORRHAGIC STROKE IN STROKE MARKET, BY TYPE, 2018-2032 (USD THOUSAND)
TABLE 238 SINGAPORE STROKE MARKET, BY DIAGNOSIS AND TREATMENT, 2018-2032 (USD THOUSAND)
TABLE 239 SINGAPORE TREATMENT IN STROKE MARKET, BY TREATMENT TYPE, 2018-2032 (USD THOUSAND)
TABLE 240 SINGAPORE MEDICATION IN STROKE MARKET, BY CLASS, 2018-2032 (USD THOUSAND)
TABLE 241 SINGAPORE BLOOD PRESSURE MEDICINE IN STROKE MARKET, BY CLASS, 2018-2032 (USD THOUSAND)
TABLE 242 SINGAPORE ANGIOTENSIN-CONVERTING ENZYME (ACE) INHIBITORS IN STROKE MARKET, BY CLASS, 2018-2032 (USD THOUSAND)
TABLE 243 SINGAPORE THIAZIDE DIURETICS IN STROKE MARKET, BY CLASS, 2018-2032 (USD THOUSAND)
TABLE 244 SINGAPORE CALCIUM CHANNEL BLOCKERS IN STROKE MARKET, BY CLASS, 2018-2032 (USD THOUSAND)
TABLE 245 SINGAPORE BETA BLOCKERS IN STROKE MARKET, BY CLASS, 2018-2032 (USD THOUSAND)
TABLE 246 SINGAPORE ALPHA-BLOCKERS IN STROKE MARKET, BY CLASS, 2018-2032 (USD THOUSAND)
TABLE 247 SINGAPORE ANTIPLATELET DRUGS IN STROKE MARKET, BY CLASS, 2018-2032 (USD THOUSAND)
TABLE 248 SINGAPORE ANTICOAGULANTS IN STROKE MARKET, BY CLASS, 2018-2032 (USD THOUSAND)
TABLE 249 SINGAPORE TISSUE PLASMINOGEN ACTIVATOR (TPA) IN STROKE MARKET, BY CLASS, 2018-2032 (USD THOUSAND)
TABLE 250 SINGAPORE STATINS IN STROKE MARKET, BY CLASS, 2018-2032 (USD THOUSAND)
TABLE 251 SINGAPORE SUPPORTIVE MEDICATION IN STROKE MARKET, BY CLASS, 2018-2032 (USD THOUSAND)
TABLE 252 SINGAPORE MEDICATION IN STROKE MARKET, BY DRUG TYPE, 2018-2032 (USD THOUSAND)
TABLEAU 253 MARQUES DE SINGAPOUR SUR LE MARCHÉ DES AVC, PAR TYPE DE MÉDICAMENT, 2018-2032 (EN MILLIERS USD)
TABLEAU 254 MÉDICAMENTS SUR LE MARCHÉ DES AVC À SINGAPOUR, PAR VOIE D'ADMINISTRATION, 2018-2032 (EN MILLIERS USD)
TABLEAU 255 MARCHÉ DES SOINS ORAUX POUR AVC À SINGAPOUR, PAR TYPE, 2018-2032 (EN MILLIERS USD)
TABLEAU 256 MARCHÉ DE LA MÉDECINE PARENTÉRALE EN CAS D'AVC À SINGAPOUR, PAR TYPE, 2018-2032 (EN MILLIERS USD)
TABLEAU 257 MÉDICAMENTS SUR LE MARCHÉ DES AVC À SINGAPOUR, PAR MODE D'ACHAT, 2018-2032 (EN MILLIERS USD)
TABLEAU 258 MÉDICAMENTS SUR LE MARCHÉ DES AVC À SINGAPOUR, PAR TYPE DE THÉRAPIE, 2018-2032 (EN MILLIERS USD)
TABLEAU 259 CHIRURGIE À SINGAPOUR SUR LE MARCHÉ DE L'AVC, PAR TYPE D'INSTRUMENT, 2018-2032 (EN MILLIERS USD)
TABLEAU 260 AUTRES THÉRAPIES SUR LE MARCHÉ DE L'AVC À SINGAPOUR, PAR TYPE, 2018-2032 (EN MILLIERS USD)
TABLEAU 261 DIAGNOSTIC DES AVC À SINGAPOUR, PAR TYPE DE DIAGNOSTIC, 2018-2032 (EN MILLIERS USD)
TABLEAU 262 TEST D'IMAGERIE SUR LE MARCHÉ DE L'AVC À SINGAPOUR, PAR TYPE, 2018-2032 (EN MILLIERS USD)
TABLEAU 263 MARCHÉ DES AVC À SINGAPOUR, PAR SEXE, 2018-2032 (EN MILLIERS USD)
TABLEAU 264 MARCHÉ DES AVC À SINGAPOUR, PAR UTILISATEUR FINAL, 2018-2032 (EN MILLIERS USD)
TABLEAU 265 MARCHÉ DES AVC À SINGAPOUR, PAR CANAL DE DISTRIBUTION, 2018-2032 (EN MILLIERS USD)
TABLEAU 266 MARCHÉ DES AVC EN THAÏLANDE, PAR TYPE, 2018-2032 (EN MILLIERS USD)
TABLEAU 267 AVC ischémique en Thaïlande sur le marché de l'AVC, par type, 2018-2032 (en milliers de dollars américains)
TABLEAU 268 AVC HÉMORRAGIQUE EN THAÏLANDE SUR LE MARCHÉ DES AVC, PAR TYPE, 2018-2032 (MILLIERS USD)
TABLEAU 269 MARCHÉ DES AVC EN THAÏLANDE, PAR DIAGNOSTIC ET TRAITEMENT, 2018-2032 (EN MILLIERS USD)
TABLEAU 270 TRAITEMENT DES AVC EN THAÏLANDE, PAR TYPE DE TRAITEMENT, 2018-2032 (EN MILLIERS USD)
TABLEAU 271 MÉDICAMENTS SUR LE MARCHÉ DES AVC EN THAÏLANDE, PAR CATÉGORIE, 2018-2032 (EN MILLIERS USD)
TABLEAU 272 MÉDICAMENTS CONTRE LA TENSION ARTÉRIELLE SUR LE MARCHÉ THAÏLANDAIS DE L'AVC, PAR CATÉGORIE, 2018-2032 (EN MILLIERS USD)
TABLEAU 273 INHIBITEURS DE L'ENZYME DE CONVERSION DE L'ANGIOTENSINE (ECA) SUR LE MARCHÉ THAÏLANDAIS DES AVC, PAR CLASSE, 2018-2032 (EN MILLIERS USD)
TABLEAU 274 DIURÉTIQUES THIAZIDIQUES SUR LE MARCHÉ THAÏLANDAIS DES AVC, PAR CLASSE, 2018-2032 (EN MILLIERS USD)
TABLEAU 275 BLOQUEURS DES CANAUX CALCIQUES SUR LE MARCHÉ THAÏLANDAIS DE L'AVC, PAR CLASSE, 2018-2032 (EN MILLIERS USD)
TABLEAU 276 BÊTA-BLOQUANTS SUR LE MARCHÉ THAÏLANDAIS DE L'AVC, PAR CLASSE, 2018-2032 (EN MILLIERS USD)
TABLEAU 277 ALPHA-BLOQUANTS SUR LE MARCHÉ THAÏLANDAIS DE L'AVC, PAR CLASSE, 2018-2032 (EN MILLIERS USD)
TABLEAU 278 MÉDICAMENTS ANTIPLAQUETTAIRES SUR LE MARCHÉ THAÏLANDAIS DE L'AVC, PAR CATÉGORIE, 2018-2032 (EN MILLIERS USD)
TABLEAU 279 ANTICOAGULANTS SUR LE MARCHÉ DES AVC EN THAÏLANDE, PAR CLASSE, 2018-2032 (EN MILLIERS USD)
TABLEAU 280 ACTIVATEUR TISSULAIRE DU PLASMINOGÈNE (TPA) SUR LE MARCHÉ DES AVC EN THAÏLANDE, PAR CLASSE, 2018-2032 (EN MILLIERS USD)
TABLEAU 281 STATINES SUR LE MARCHÉ DES AVC EN THAÏLANDE, PAR CLASSE, 2018-2032 (EN MILLIERS USD)
TABLEAU 282 MÉDICAMENTS DE SOUTIEN SUR LE MARCHÉ DES AVC EN THAÏLANDE, PAR CATÉGORIE, 2018-2032 (EN MILLIERS USD)
TABLEAU 283 MÉDICAMENTS SUR LE MARCHÉ DES AVC EN THAÏLANDE, PAR TYPE DE MÉDICAMENT, 2018-2032 (EN MILLIERS USD)
TABLEAU 284 MARQUE THAÏLANDAISE SUR LE MARCHÉ DES AVC, PAR TYPE DE MÉDICAMENT, 2018-2032 (EN MILLIERS USD)
TABLEAU 285 MÉDICAMENTS SUR LE MARCHÉ DES AVC EN THAÏLANDE, PAR VOIE D'ADMINISTRATION, 2018-2032 (EN MILLIERS USD)
TABLEAU 286 MARCHÉ THAÏLANDAIS DES SOINS ORAUX POUR LES AVC, PAR TYPE, 2018-2032 (EN MILLIERS USD)
TABLEAU 287 MARCHÉ THAÏLANDAIS DES TRAITEMENTS PARENTÉRAUX POUR LES AVC, PAR TYPE, 2018-2032 (EN MILLIERS USD)
TABLEAU 288 MÉDICAMENTS SUR LE MARCHÉ DES AVC EN THAÏLANDE, PAR MODE D'ACHAT, 2018-2032 (EN MILLIERS USD)
TABLEAU 289 MÉDICAMENTS SUR LE MARCHÉ DES AVC EN THAÏLANDE, PAR TYPE DE THÉRAPIE, 2018-2032 (EN MILLIERS USD)
TABLEAU 290 CHIRURGIE THAÏLANDAISE SUR LE MARCHÉ DE L'AVC, PAR TYPE D'INSTRUMENT, 2018-2032 (EN MILLIERS USD)
TABLEAU 291 AUTRES THÉRAPIES SUR LE MARCHÉ DE L'AVC EN THAÏLANDE, PAR TYPE, 2018-2032 (EN MILLIERS USD)
TABLEAU 292 DIAGNOSTIC DES AVC EN THAÏLANDE, PAR TYPE DE DIAGNOSTIC, 2018-2032 (EN MILLIERS USD)
TABLEAU 293 TEST D'IMAGERIE SUR LE MARCHÉ DES AVC EN THAÏLANDE, PAR TYPE, 2018-2032 (EN MILLIERS USD)
TABLEAU 294 MARCHÉ DES AVC EN THAÏLANDE, PAR SEXE, 2018-2032 (EN MILLIERS USD)
TABLEAU 295 MARCHÉ DES AVC EN THAÏLANDE, PAR UTILISATEUR FINAL, 2018-2032 (EN MILLIERS USD)
TABLEAU 296 MARCHÉ DES AVC EN THAÏLANDE, PAR CANAL DE DISTRIBUTION, 2018-2032 (EN MILLIERS USD)
TABLEAU 297 MARCHÉ PHILIPPINIEN DES AVC, PAR TYPE, 2018-2032 (MILLIERS USD)
TABLEAU 298 PHILIPPINES : AVC ISCHÉMIQUE SUR LE MARCHÉ DE L'AVC, PAR TYPE, 2018-2032 (MILLIERS USD)
TABLEAU 299 PHILIPPINES : ACCIDENT VASCULAIRE CÉRÉBRAL HÉMORRAGIQUE SUR LE MARCHÉ DES AVC, PAR TYPE, 2018-2032 (MILLIERS USD)
TABLEAU 300 MARCHÉ PHILIPPINIEN DES AVC, PAR DIAGNOSTIC ET TRAITEMENT, 2018-2032 (EN MILLIERS USD)
TABLEAU 301 TRAITEMENT DES AVC AUX PHILIPPINES, PAR TYPE DE TRAITEMENT, 2018-2032 (EN MILLIERS USD)
TABLEAU 302 PHILIPPINES MÉDICAMENTS SUR LE MARCHÉ DES AVC, PAR CATÉGORIE, 2018-2032 (EN MILLIERS USD)
TABLEAU 303 PHILIPPINES : MÉDICAMENTS CONTRE LA TENSION ARTÉRIELLE SUR LE MARCHÉ DES AVC, PAR CATÉGORIE, 2018-2032 (EN MILLIERS USD)
TABLEAU 304 INHIBITEURS DE L'ENZYME DE CONVERSION DE L'ANGIOTENSINE (ECA) SUR LE MARCHÉ PHILIPPINIEN DE L'AVC, PAR CLASSE, 2018-2032 (EN MILLIERS USD)
TABLEAU 305 PHILIPPINES DIURÉTIQUES THIAZIDES SUR LE MARCHÉ DES AVC, PAR CLASSE, 2018-2032 (EN MILLIERS USD)
TABLEAU 306 BLOQUEURS DES CANAUX CALCIQUES SUR LE MARCHÉ PHILIPPINIEN DES AVC, PAR CLASSE, 2018-2032 (EN MILLIERS USD)
TABLEAU 307 PHILIPPINES BÊTA-BLOQUANTS SUR LE MARCHÉ DES AVC, PAR CLASSE, 2018-2032 (EN MILLIERS USD)
TABLEAU 308 PHILIPPINES ALPHA-BLOQUANTS SUR LE MARCHÉ DES AVC, PAR CLASSE, 2018-2032 (EN MILLIERS USD)
TABLEAU 309 MÉDICAMENTS ANTIPLAQUETTAIRES PHILIPPINS SUR LE MARCHÉ DES AVC, PAR CATÉGORIE, 2018-2032 (EN MILLIERS USD)
TABLEAU 310 PHILIPPINES ANTICOAGULANTS SUR LE MARCHÉ DES AVC, PAR CLASSE, 2018-2032 (EN MILLIERS USD)
TABLEAU 311 ACTIVATEUR DE PLASMINOGÈNE TISSULAIRE (TPA) SUR LE MARCHÉ PHILIPPINIEN DES AVC, PAR CLASSE, 2018-2032 (EN MILLIERS USD)
TABLEAU 312 PHILIPPINES STATINES SUR LE MARCHÉ DES AVC, PAR CLASSE, 2018-2032 (MILLIERS USD)
TABLEAU 313 PHILIPPINES : MÉDICAMENTS DE SOUTIEN SUR LE MARCHÉ DES AVC, PAR CATÉGORIE, 2018-2032 (EN MILLIERS USD)
TABLEAU 314 PHILIPPINES MÉDICAMENTS SUR LE MARCHÉ DES AVC, PAR TYPE DE MÉDICAMENT, 2018-2032 (EN MILLIERS USD)
TABLEAU 315 PHILIPPINES MARQUÉES SUR LE MARCHÉ DES AVC, PAR TYPE DE MÉDICAMENT, 2018-2032 (EN MILLIERS USD)
TABLEAU 316 MÉDICAMENTS PHILIPPINS SUR LE MARCHÉ DES AVC, PAR VOIE D'ADMINISTRATION, 2018-2032 (EN MILLIERS USD)
TABLEAU 317 PHILIPPINES MARCHÉ DES SOINS ORAUX EN CAS D'AVC, PAR TYPE, 2018-2032 (EN MILLIERS USD)
TABLEAU 318 PHILIPPINES PARENTÉRALES SUR LE MARCHÉ DES AVC, PAR TYPE, 2018-2032 (MILLIERS USD)
TABLEAU 319 MÉDICAMENTS PHILIPPINS SUR LE MARCHÉ DES AVC, PAR MODE D'ACHAT, 2018-2032 (EN MILLIERS USD)
TABLEAU 320 PHILIPPINES MÉDICAMENTS SUR LE MARCHÉ DES AVC, PAR TYPE DE THÉRAPIE, 2018-2032 (EN MILLIERS USD)
TABLEAU 321 PHILIPPINES : CHIRURGIE SUR LE MARCHÉ DE L'AVC, PAR TYPE D'INSTRUMENT, 2018-2032 (EN MILLIERS USD)
TABLEAU 322 PHILIPPINES AUTRES THÉRAPIES SUR LE MARCHÉ DES AVC, PAR TYPE, 2018-2032 (EN MILLIERS USD)
TABLEAU 323 PHILIPPINES DIAGNOSTIC SUR LE MARCHÉ DES AVC, PAR TYPE DE DIAGNOSTIC, 2018-2032 (MILLIERS USD)
TABLEAU 324 PHILIPPINES : TESTS D'IMAGERIE SUR LE MARCHÉ DES AVC, PAR TYPE, 2018-2032 (MILLIERS USD)
TABLEAU 325 MARCHÉ PHILIPPINIEN DES AVC, PAR SEXE, 2018-2032 (EN MILLIERS USD)
TABLEAU 326 MARCHÉ PHILIPPINIEN DES AVC, PAR UTILISATEUR FINAL, 2018-2032 (MILLIERS USD)
TABLEAU 327 MARCHÉ PHILIPPINIEN DES AVC, PAR CANAL DE DISTRIBUTION, 2018-2032 (EN MILLIERS USD)
TABLEAU 328 MARCHÉ DES AVC EN MALAISIE, PAR TYPE, 2018-2032 (EN MILLIERS USD)
TABLEAU 329 MALAISIE ACCIDENT VASCULAIRE MÉDICAL ISCHÉMIQUE SUR LE MARCHÉ DE L'AVC, PAR TYPE, 2018-2032 (MILLIERS USD)
TABLEAU 330 MALAISIE ACCIDENT VASCULAIRE CÉRÉBRAL HÉMORRAGIQUE SUR LE MARCHÉ DES AVC, PAR TYPE, 2018-2032 (EN MILLIERS USD)
TABLEAU 331 MARCHÉ DES AVC EN MALAISIE, PAR DIAGNOSTIC ET TRAITEMENT, 2018-2032 (EN MILLIERS USD)
TABLEAU 332 TRAITEMENT DES AVC EN MALAISIE, PAR TYPE DE TRAITEMENT, 2018-2032 (EN MILLIERS USD)
TABLEAU 333 MÉDICAMENTS MALAISIENS SUR LE MARCHÉ DES AVC, PAR CATÉGORIE, 2018-2032 (EN MILLIERS USD)
TABLEAU 334 MÉDICAMENTS CONTRE LA TENSION ARTÉRIELLE SUR LE MARCHÉ DES AVC EN MALAISIE, PAR CATÉGORIE, 2018-2032 (EN MILLIERS USD)
TABLEAU 335 INHIBITEURS DE L'ENZYME DE CONVERSION DE L'ANGIOTENSINE (ECA) SUR LE MARCHÉ DES AVC EN MALAISIE, PAR CLASSE, 2018-2032 (EN MILLIERS USD)
TABLEAU 336 DIURÉTIQUES THIAZIDIQUES SUR LE MARCHÉ MALAISIEN DES AVC, PAR CLASSE, 2018-2032 (EN MILLIERS USD)
TABLEAU 337 BLOQUEURS DES CANAUX CALCIQUES SUR LE MARCHÉ DES AVC EN MALAISIE, PAR CLASSE, 2018-2032 (EN MILLIERS USD)
TABLEAU 338 BÊTA-BLOQUANTS SUR LE MARCHÉ DES AVC EN MALAISIE, PAR CLASSE, 2018-2032 (EN MILLIERS USD)
TABLEAU 339 ALPHA-BLOQUANTS SUR LE MARCHÉ DES AVC EN MALAISIE, PAR CLASSE, 2018-2032 (EN MILLIERS USD)
TABLEAU 340 MÉDICAMENTS ANTIPLAQUETTAIRES SUR LE MARCHÉ MALAISIEN DE L'AVC, PAR CLASSE, 2018-2032 (EN MILLIERS USD)
TABLEAU 341 ANTICOAGULANTS MALAISIENS SUR LE MARCHÉ DES AVC, PAR CLASSE, 2018-2032 (EN MILLIERS USD)
TABLEAU 342 ACTIVATEUR DE PLASMINOGÈNE TISSULAIRE (TPA) SUR LE MARCHÉ DES AVC EN MALAISIE, PAR CLASSE, 2018-2032 (EN MILLIERS USD)
TABLEAU 343 STATINES SUR LE MARCHÉ DES AVC EN MALAISIE, PAR CLASSE, 2018-2032 (EN MILLIERS USD)
TABLEAU 344 MALAISIE MÉDICAMENTS DE SOUTIEN SUR LE MARCHÉ DES AVC, PAR CATÉGORIE, 2018-2032 (EN MILLIERS USD)
TABLEAU 345 MÉDICAMENTS MALAISIENS SUR LE MARCHÉ DES AVC, PAR TYPE DE MÉDICAMENT, 2018-2032 (EN MILLIERS USD)
TABLEAU 346 MARQUE MALAISIENNE SUR LE MARCHÉ DES AVC, PAR TYPE DE MÉDICAMENT, 2018-2032 (EN MILLIERS USD)
TABLEAU 347 MÉDICAMENTS MALAISIENS SUR LE MARCHÉ DES AVC, PAR VOIE D'ADMINISTRATION, 2018-2032 (EN MILLIERS USD)
TABLEAU 348 MARCHÉ MALAISIEN DES SOINS ORAUX POUR LES AVC, PAR TYPE, 2018-2032 (EN MILLIERS USD)
TABLEAU 349 MARCHÉ MALAISIEN DES TRAITEMENTS PARENTÉRAUX EN CAS D'AVC, PAR TYPE, 2018-2032 (EN MILLIERS USD)
TABLEAU 350 MÉDICAMENTS SUR LE MARCHÉ DES AVC EN MALAISIE, PAR MODE D'ACHAT, 2018-2032 (EN MILLIERS USD)
TABLEAU 351 MÉDICAMENTS MALAISIENS SUR LE MARCHÉ DES AVC, PAR TYPE DE THÉRAPIE, 2018-2032 (EN MILLIERS USD)
TABLEAU 352 CHIRURGIE MALAISIENNE SUR LE MARCHÉ DE L'AVC, PAR TYPE D'INSTRUMENT, 2018-2032 (EN MILLIERS USD)
TABLEAU 353 AUTRES THÉRAPIES SUR LE MARCHÉ DES AVC EN MALAISIE, PAR TYPE, 2018-2032 (EN MILLIERS USD)
TABLEAU 354 MALAISIE DIAGNOSTIC SUR LE MARCHÉ DES AVC, PAR TYPE DE DIAGNOSTIC, 2018-2032 (EN MILLIERS USD)
TABLEAU 355 MALAISIE TESTS D'IMAGERIE SUR LE MARCHÉ DES AVC, PAR TYPE, 2018-2032 (MILLIERS USD)
TABLEAU 356 MARCHÉ DES AVC EN MALAISIE, PAR SEXE, 2018-2032 (EN MILLIERS USD)
TABLEAU 357 MARCHÉ DES AVC EN MALAISIE, PAR UTILISATEUR FINAL, 2018-2032 (EN MILLIERS USD)
TABLEAU 358 MARCHÉ DES AVC EN MALAISIE, PAR CANAL DE DISTRIBUTION, 2018-2032 (EN MILLIERS USD)
TABLEAU 359 MARCHÉ DES AVC EN INDONÉSIE, PAR TYPE, 2018-2032 (EN MILLIERS USD)
TABLEAU 360 INDONÉSIE ACCIDENT VASCULAIRE MÉDICAL ISCHÉMIQUE SUR LE MARCHÉ DES AVC, PAR TYPE, 2018-2032 (MILLIERS USD)
TABLEAU 361 INDONÉSIE : AVC HÉMORRAGIQUE SUR LE MARCHÉ DES AVC, PAR TYPE, 2018-2032 (MILLIERS USD)
TABLEAU 362 MARCHÉ INDONÉSIEN DES AVC, PAR DIAGNOSTIC ET TRAITEMENT, 2018-2032 (EN MILLIERS USD)
TABLEAU 363 TRAITEMENT DES AVC EN INDONÉSIE, PAR TYPE DE TRAITEMENT, 2018-2032 (EN MILLIERS USD)
TABLEAU 364 MÉDICAMENTS INDONÉSIENS SUR LE MARCHÉ DES AVC, PAR CATÉGORIE, 2018-2032 (EN MILLIERS USD)
TABLEAU 365 MÉDICAMENTS CONTRE LA TENSION ARTÉRIELLE SUR LE MARCHÉ INDONÉSIEN DE L'AVC, PAR CLASSE, 2018-2032 (EN MILLIERS USD)
TABLEAU 366 INHIBITEURS DE L'ENZYME DE CONVERSION DE L'ANGIOTENSINE (ECA) SUR LE MARCHÉ INDONÉSIEN DES AVC, PAR CLASSE, 2018-2032 (EN MILLIERS USD)
TABLEAU 367 DIURÉTIQUES THIAZIDIQUES INDONÉSIENS SUR LE MARCHÉ DES AVC, PAR CLASSE, 2018-2032 (EN MILLIERS USD)
TABLEAU 368 INHIBITEURS DES CANAUX CALCIQUES SUR LE MARCHÉ DES AVC EN INDONÉSIE, PAR CLASSE, 2018-2032 (EN MILLIERS USD)
TABLEAU 369 BÊTA-BLOQUANTS SUR LE MARCHÉ INDONÉSIEN DE L'AVC, PAR CLASSE, 2018-2032 (EN MILLIERS USD)
TABLEAU 370 ALPHA-BLOQUANTS SUR LE MARCHÉ INDONÉSIEN DE L'AVC, PAR CLASSE, 2018-2032 (EN MILLIERS USD)
TABLEAU 371 MÉDICAMENTS ANTIPLAQUETTAIRES INDONÉSIENS SUR LE MARCHÉ DES AVC, PAR CLASSE, 2018-2032 (EN MILLIERS USD)
TABLEAU 372 ANTICOAGULANTS INDONÉSIENS SUR LE MARCHÉ DES AVC, PAR CLASSE, 2018-2032 (EN MILLIERS USD)
TABLEAU 373 ACTIVATEUR TISSULAIRE DU PLASMINOGÈNE (TPA) INDONÉSIEN SUR LE MARCHÉ DES AVC, PAR CLASSE, 2018-2032 (EN MILLIERS USD)
TABLEAU 374 STATINES SUR LE MARCHÉ INDONÉSIEN DES TRAITEMENTS CONTRE LES AVC, PAR CLASSE, 2018-2032 (EN MILLIERS USD)
TABLEAU 375 INDONÉSIE MÉDICAMENTS DE SOUTIEN SUR LE MARCHÉ DES AVC, PAR CATÉGORIE, 2018-2032 (EN MILLIERS USD)
TABLEAU 376 MÉDICAMENTS INDONÉSIENS SUR LE MARCHÉ DES AVC, PAR TYPE DE MÉDICAMENT, 2018-2032 (EN MILLIERS USD)
TABLEAU 377 MARQUES DE L'INDONÉSIE SUR LE MARCHÉ DES AVC, PAR TYPE DE MÉDICAMENT, 2018-2032 (EN MILLIERS USD)
TABLEAU 378 MÉDICAMENTS INDONÉSIENS SUR LE MARCHÉ DES AVC, PAR VOIE D'ADMINISTRATION, 2018-2032 (EN MILLIERS USD)
TABLEAU 379 MARCHÉ INDONÉSIEN DES SOINS ORAUX POUR LES AVC, PAR TYPE, 2018-2032 (EN MILLIERS USD)
TABLEAU 380 MARCHÉ INDONÉSIEN DES TRAITEMENTS PARENTÉRAUX EN CAS D'AVC, PAR TYPE, 2018-2032 (EN MILLIERS USD)
TABLEAU 381 MÉDICAMENTS INDONÉSIENS SUR LE MARCHÉ DES AVC, PAR MODE D'ACHAT, 2018-2032 (EN MILLIERS USD)
TABLEAU 382 MÉDICAMENTS INDONÉSIENS SUR LE MARCHÉ DES AVC, PAR TYPE DE THÉRAPIE, 2018-2032 (EN MILLIERS USD)
TABLEAU 383 CHIRURGIE INDONÉSIENNE SUR LE MARCHÉ DE L'AVC, PAR TYPE D'INSTRUMENT, 2018-2032 (EN MILLIERS USD)
TABLEAU 384 AUTRES THÉRAPIES SUR LE MARCHÉ DES AVC EN INDONÉSIE, PAR TYPE, 2018-2032 (EN MILLIERS USD)
TABLEAU 385 INDONÉSIE DIAGNOSTIC SUR LE MARCHÉ DES AVC, PAR TYPE DE DIAGNOSTIC, 2018-2032 (EN MILLIERS USD)
TABLEAU 386 MARCHÉ INDONÉSIEN DES TESTS D'IMAGERIE SUR L'AVC, PAR TYPE, 2018-2032 (EN MILLIERS USD)
TABLEAU 387 MARCHÉ DES AVC EN INDONÉSIE, PAR SEXE, 2018-2032 (EN MILLIERS USD)
TABLE 388 INDONESIA STROKE MARKET, BY END USER, 2018-2032 (USD THOUSAND)
TABLE 389 INDONESIA STROKE MARKET, BY DISTRIBUTION CHANNEL, 2018-2032 (USD THOUSAND)
TABLE 390 VIETNAM STROKE MARKET, BY TYPE, 2018-2032 (USD THOUSAND)
TABLE 391 VIETNAM ISCHEMIC STROKE IN STROKE MARKET, BY TYPE, 2018-2032 (USD THOUSAND)
TABLE 392 VIETNAM HEMORRHAGIC STROKE IN STROKE MARKET, BY TYPE, 2018-2032 (USD THOUSAND)
TABLE 393 VIETNAM STROKE MARKET, BY DIAGNOSIS AND TREATMENT, 2018-2032 (USD THOUSAND)
TABLE 394 VIETNAM TREATMENT IN STROKE MARKET, BY TREATMENT TYPE, 2018-2032 (USD THOUSAND)
TABLE 395 VIETNAM MEDICATION IN STROKE MARKET, BY CLASS, 2018-2032 (USD THOUSAND)
TABLE 396 VIETNAM BLOOD PRESSURE MEDICINE IN STROKE MARKET, BY CLASS, 2018-2032 (USD THOUSAND)
TABLE 397 VIETNAM ANGIOTENSIN-CONVERTING ENZYME (ACE) INHIBITORS IN STROKE MARKET, BY CLASS, 2018-2032 (USD THOUSAND)
TABLE 398 VIETNAM THIAZIDE DIURETICS IN STROKE MARKET, BY CLASS, 2018-2032 (USD THOUSAND)
TABLE 399 VIETNAM CALCIUM CHANNEL BLOCKERS IN STROKE MARKET, BY CLASS, 2018-2032 (USD THOUSAND)
TABLE 400 VIETNAM BETA BLOCKERS IN STROKE MARKET, BY CLASS, 2018-2032 (USD THOUSAND)
TABLE 401 VIETNAM ALPHA-BLOCKERS IN STROKE MARKET, BY CLASS, 2018-2032 (USD THOUSAND)
TABLE 402 VIETNAM ANTIPLATELET DRUGS IN STROKE MARKET, BY CLASS, 2018-2032 (USD THOUSAND)
TABLE 403 VIETNAM ANTICOAGULANTS IN STROKE MARKET, BY CLASS, 2018-2032 (USD THOUSAND)
TABLE 404 VIETNAM TISSUE PLASMINOGEN ACTIVATOR (TPA) IN STROKE MARKET, BY CLASS, 2018-2032 (USD THOUSAND)
TABLE 405 VIETNAM STATINS IN STROKE MARKET, BY CLASS, 2018-2032 (USD THOUSAND)
TABLE 406 VIETNAM SUPPORTIVE MEDICATION IN STROKE MARKET, BY CLASS, 2018-2032 (USD THOUSAND)
TABLE 407 VIETNAM MEDICATION IN STROKE MARKET, BY DRUG TYPE, 2018-2032 (USD THOUSAND)
TABLE 408 VIETNAM BRANDED IN STROKE MARKET, BY DRUG TYPE, 2018-2032 (USD THOUSAND)
TABLE 409 VIETNAM MEDICATION IN STROKE MARKET, BY ROUTE OF ADMINISTRATION, 2018-2032 (USD THOUSAND)
TABLE 410 VIETNAM ORAL IN STROKE MARKET, BY TYPE, 2018-2032 (USD THOUSAND)
TABLE 411 VIETNAM PARENTERAL IN STROKE MARKET, BY TYPE, 2018-2032 (USD THOUSAND)
TABLE 412 VIETNAM MEDICATION IN STROKE MARKET, BY MODE OF PURCHASE, 2018-2032 (USD THOUSAND)
TABLE 413 VIETNAM MEDICATION IN STROKE MARKET, BY THERAPY TYPE, 2018-2032 (USD THOUSAND)
TABLE 414 VIETNAM SURGERY IN STROKE MARKET, BY INSTRUMENT TYPE, 2018-2032 (USD THOUSAND)
TABLE 415 VIETNAM OTHER THERAPY IN STROKE MARKET, BY TYPE, 2018-2032 (USD THOUSAND)
TABLE 416 VIETNAM DIAGNOSIS IN STROKE MARKET, BY DIAGNOSIS TYPE, 2018-2032 (USD THOUSAND)
TABLE 417 VIETNAM IMAGING TEST IN STROKE MARKET, BY TYPE, 2018-2032 (USD THOUSAND)
TABLE 418 VIETNAM STROKE MARKET, BY GENDER, 2018-2032 (USD THOUSAND)
TABLE 419 VIETNAM STROKE MARKET, BY END USER, 2018-2032 (USD THOUSAND)
TABLE 420 VIETNAM STROKE MARKET, BY DISTRIBUTION CHANNEL, 2018-2032 (USD THOUSAND)
TABLE 421 TAIWAN STROKE MARKET, BY TYPE, 2018-2032 (USD THOUSAND)
TABLE 422 TAIWAN ISCHEMIC STROKE IN STROKE MARKET, BY TYPE, 2018-2032 (USD THOUSAND)
TABLEAU 423 ACCIDENT VASCULAIRE CÉRÉBRAL HÉMORRAGIQUE À TAÏWAN SUR LE MARCHÉ DE L'AVC, PAR TYPE, 2018-2032 (EN MILLIERS USD)
TABLEAU 424 MARCHÉ DES AVC À TAÏWAN, PAR DIAGNOSTIC ET TRAITEMENT, 2018-2032 (EN MILLIERS USD)
TABLEAU 425 TRAITEMENT DES AVC À TAÏWAN, PAR TYPE DE TRAITEMENT, 2018-2032 (EN MILLIERS USD)
TABLEAU 426 MÉDICAMENTS POUR LE TRAITEMENT DES AVC À TAÏWAN, PAR CATÉGORIE, 2018-2032 (EN MILLIERS USD)
TABLEAU 427 MÉDICAMENTS CONTRE LA TENSION ARTÉRIELLE SUR LE MARCHÉ DES AVC À TAÏWAN, PAR CATÉGORIE, 2018-2032 (EN MILLIERS USD)
TABLEAU 428 INHIBITEURS DE L'ENZYME DE CONVERSION DE L'ANGIOTENSINE (ECA) SUR LE MARCHÉ DES AVC À TAÏWAN, PAR CLASSE, 2018-2032 (EN MILLIERS USD)
TABLEAU 429 DIURÉTIQUES THIAZIDIQUES SUR LE MARCHÉ DES AVC À TAÏWAN, PAR CLASSE, 2018-2032 (EN MILLIERS USD)
TABLEAU 430 BLOQUEURS DES CANAUX CALCIQUES SUR LE MARCHÉ DE L'AVC À TAÏWAN, PAR CLASSE, 2018-2032 (EN MILLIERS USD)
TABLEAU 431 BÊTA-BLOQUANTS SUR LE MARCHÉ DES AVC À TAÏWAN, PAR CLASSE, 2018-2032 (EN MILLIERS USD)
TABLEAU 432 ALPHA-BLOQUANTS SUR LE MARCHÉ DES AVC À TAÏWAN, PAR CLASSE, 2018-2032 (EN MILLIERS USD)
TABLEAU 433 MÉDICAMENTS ANTIPLAQUETTAIRES SUR LE MARCHÉ DE L'AVC À TAÏWAN, PAR CATÉGORIE, 2018-2032 (EN MILLIERS USD)
TABLEAU 434 ANTICOAGULANTS SUR LE MARCHÉ DES AVC À TAÏWAN, PAR CLASSE, 2018-2032 (EN MILLIERS USD)
TABLEAU 435 ACTIVATEUR DE PLASMINOGÈNE TISSULAIRE (TPA) SUR LE MARCHÉ DES AVC À TAÏWAN, PAR CLASSE, 2018-2032 (EN MILLIERS USD)
TABLEAU 436 STATINES DE TAÏWAN SUR LE MARCHÉ DES AVC, PAR CLASSE, 2018-2032 (EN MILLIERS USD)
TABLEAU 437 MÉDICAMENTS DE SOUTIEN SUR LE MARCHÉ DES AVC À TAÏWAN, PAR CATÉGORIE, 2018-2032 (EN MILLIERS USD)
TABLEAU 438 MÉDICAMENTS SUR LE MARCHÉ DES AVC À TAÏWAN, PAR TYPE DE MÉDICAMENT, 2018-2032 (EN MILLIERS USD)
TABLEAU 439 MARQUES DE MÉDICAMENTS DE TAÏWAN SUR LE MARCHÉ DES AVC, PAR TYPE DE MÉDICAMENT, 2018-2032 (EN MILLIERS USD)
TABLEAU 440 MÉDICAMENTS POUR LE TRAITEMENT DES AVC À TAÏWAN, PAR VOIE D'ADMINISTRATION, 2018-2032 (EN MILLIERS USD)
TABLEAU 441 MARCHÉ DES SOINS ORAUX POUR LES AVC À TAÏWAN, PAR TYPE, 2018-2032 (EN MILLIERS USD)
TABLEAU 442 MARCHÉ DES TRAITEMENTS PARENTÉRAUX POUR LES AVC À TAÏWAN, PAR TYPE, 2018-2032 (EN MILLIERS USD)
TABLEAU 443 MÉDICAMENTS SUR LE MARCHÉ DES AVC À TAÏWAN, PAR MODE D'ACHAT, 2018-2032 (EN MILLIERS USD)
TABLEAU 444 MÉDICAMENTS SUR LE MARCHÉ DES AVC À TAÏWAN, PAR TYPE DE THÉRAPIE, 2018-2032 (EN MILLIERS USD)
TABLEAU 445 CHIRURGIE SUR LE MARCHÉ DE L'AVC À TAÏWAN, PAR TYPE D'INSTRUMENT, 2018-2032 (EN MILLIERS USD)
TABLEAU 446 AUTRES THÉRAPIES SUR LE MARCHÉ DE L'AVC À TAÏWAN, PAR TYPE, 2018-2032 (EN MILLIERS USD)
TABLEAU 447 DIAGNOSTIC DES AVC À TAÏWAN, PAR TYPE DE DIAGNOSTIC, 2018-2032 (EN MILLIERS USD)
TABLEAU 448 TEST D'IMAGERIE SUR LE MARCHÉ DES AVC À TAÏWAN, PAR TYPE, 2018-2032 (EN MILLIERS USD)
TABLEAU 449 MARCHÉ DES AVC À TAÏWAN, PAR SEXE, 2018-2032 (EN MILLIERS USD)
TABLEAU 450 MARCHÉ DES AVC À TAÏWAN, PAR UTILISATEUR FINAL, 2018-2032 (EN MILLIERS USD)
TABLEAU 451 MARCHÉ DES AVC À TAÏWAN, PAR CANAL DE DISTRIBUTION, 2018-2032 (EN MILLIERS USD)
TABLEAU 452 RESTE DU MARCHÉ DES AVC EN ASIE-PACIFIQUE, PAR TYPE, 2018-2032 (EN MILLIERS USD)
Liste des figures
FIGURE 1 MARCHÉ DES AVC EN ASIE-PACIFIQUE : SEGMENTATION
FIGURE 2 MARCHÉ DES AVC EN ASIE-PACIFIQUE : TRIANGULATION DES DONNÉES
FIGURE 3 MARCHÉ DES AVC EN ASIE-PACIFIQUE : ANALYSE DROC
FIGURE 4 MARCHÉ ASIE-PACIFIQUE DES AVC : ANALYSE DU MARCHÉ ASIE-PACIFIQUE PAR RAPPORT AU MARCHÉ RÉGIONAL
FIGURE 5 MARCHÉ DES AVC EN ASIE-PACIFIQUE : ANALYSE DE LA RECHERCHE DES ENTREPRISES
FIGURE 6 MARCHÉ DES AVC EN ASIE-PACIFIQUE : DONNÉES DÉMOGRAPHIQUES DES ENTRETIENS
FIGURE 7 MARCHÉ ASIE-PACIFIQUE DES AVC : GRILLE DE POSITIONNEMENT DU MARCHÉ DBMR
FIGURE 8 MARCHÉ ASIE-PACIFIQUE DES AVC : GRILLE DE COUVERTURE DES UTILISATEURS FINAUX DU MARCHÉ
FIGURE 9 MARCHÉ ASIE-PACIFIQUE DES AVC : ANALYSE DES PARTS DES FOURNISSEURS
FIGURE 10 MARCHÉ DES AVC EN ASIE-PACIFIQUE : SEGMENTATION
FIGURE 11 L'AUGMENTATION DE L'INCIDENCE DES AVC FAVORISE LA DEMANDE DE TRAITEMENTS ET DEVRAIT STIMULER LA CROISSANCE DU MARCHÉ DES AVC EN ASIE-PACIFIQUE AU COURS DE LA PÉRIODE DE PRÉVISION DE 2025 À 2032
FIGURE 12 LE SEGMENT DES AVC ISCHÉMIQUES DEVRAIT REPRÉSENTER LA PLUS GRANDE PART DU MARCHÉ DES AVC EN ASIE-PACIFIQUE AU COURS DE LA PÉRIODE DE PRÉVISION DE 2025 ET 2032
FIGURE 13 RÉSUMÉ DU MARCHÉ DES AVC EN ASIE-PACIFIQUE
FIGURE 14 DÉCISIONS STRATÉGIQUES
FIGURE 15 MOTEURS, CONTRAINTES, OPPORTUNITÉS ET DÉFIS DU MARCHÉ DES AVC EN ASIE-PACIFIQUE
FIGURE 16 MARCHÉ DES AVC EN ASIE-PACIFIQUE : PAR TYPE, 2024
FIGURE 17 MARCHÉ DES AVC EN ASIE-PACIFIQUE : PAR TYPE, 2025-2032 (EN MILLIERS USD)
FIGURE 18 MARCHÉ DES AVC EN ASIE-PACIFIQUE : PAR TYPE, TCAC (2025-2032)
FIGURE 19 MARCHÉ DES AVC EN ASIE-PACIFIQUE : PAR TYPE, COURBE DE LIGNE DE VIE
FIGURE 20 MARCHÉ DES AVC EN ASIE-PACIFIQUE : PAR SEXE, 2024
FIGURE 21 MARCHÉ DES AVC EN ASIE-PACIFIQUE : PAR SEXE, 2025 À 2032 (EN MILLIERS USD)
FIGURE 22 MARCHÉ DES AVC EN ASIE-PACIFIQUE : PAR SEXE, TCAC (2025-2032)
FIGURE 23 MARCHÉ DES AVC EN ASIE-PACIFIQUE : PAR SEXE, COURBE DE VIE
FIGURE 24 MARCHÉ DES AVC EN ASIE-PACIFIQUE : PAR DIAGNOSTIC ET TRAITEMENT, 2024
FIGURE 25 MARCHÉ DES AVC EN ASIE-PACIFIQUE : PAR DIAGNOSTIC ET TRAITEMENT, 2025-2032 (EN MILLIERS USD)
FIGURE 26 MARCHÉ DES AVC EN ASIE-PACIFIQUE : PAR DIAGNOSTIC ET TRAITEMENT, TCAC (2025-2032)
FIGURE 27 MARCHÉ DES AVC EN ASIE-PACIFIQUE : PAR DIAGNOSTIC ET TRAITEMENT, COURBE DE LIGNE DE VIE
FIGURE 28 MARCHÉ DES AVC EN ASIE-PACIFIQUE : PAR CANAL DE DISTRIBUTION, 2024
FIGURE 29 MARCHÉ DES AVC EN ASIE-PACIFIQUE : PAR CANAL DE DISTRIBUTION, 2018-2032 (EN MILLIERS USD)
FIGURE 30 MARCHÉ DES AVC EN ASIE-PACIFIQUE : PAR CANAL DE DISTRIBUTION, TCAC (2025-2032)
FIGURE 31 MARCHÉ DES AVC EN ASIE-PACIFIQUE : PAR CANAL DE DISTRIBUTION, COURBE DE LIGNE DE VIE
FIGURE 32 MARCHÉ DES AVC EN ASIE-PACIFIQUE : PAR UTILISATEUR FINAL, 2024
FIGURE 33 MARCHÉ DES AVC EN ASIE-PACIFIQUE : PAR UTILISATEUR FINAL, 2025-2032 (EN MILLIERS USD)
FIGURE 34 MARCHÉ ASIE-PACIFIQUE DES AVC : PAR UTILISATEUR FINAL, TCAC (2025-2032)
FIGURE 35 MARCHÉ DE L'AVC EN ASIE-PACIFIQUE : PAR UTILISATEUR FINAL, COURBE DE LIGNE DE VIE
FIGURE 36 MARCHÉ DES AVC EN ASIE-PACIFIQUE : APERÇU (2024)
FIGURE 37 MARCHÉ DES AVC EN ASIE-PACIFIQUE : PART DES ENTREPRISES EN 2024 (%)
Méthodologie de recherche
La collecte de données et l'analyse de l'année de base sont effectuées à l'aide de modules de collecte de données avec des échantillons de grande taille. L'étape consiste à obtenir des informations sur le marché ou des données connexes via diverses sources et stratégies. Elle comprend l'examen et la planification à l'avance de toutes les données acquises dans le passé. Elle englobe également l'examen des incohérences d'informations observées dans différentes sources d'informations. Les données de marché sont analysées et estimées à l'aide de modèles statistiques et cohérents de marché. De plus, l'analyse des parts de marché et l'analyse des tendances clés sont les principaux facteurs de succès du rapport de marché. Pour en savoir plus, veuillez demander un appel d'analyste ou déposer votre demande.
La méthodologie de recherche clé utilisée par l'équipe de recherche DBMR est la triangulation des données qui implique l'exploration de données, l'analyse de l'impact des variables de données sur le marché et la validation primaire (expert du secteur). Les modèles de données incluent la grille de positionnement des fournisseurs, l'analyse de la chronologie du marché, l'aperçu et le guide du marché, la grille de positionnement des entreprises, l'analyse des brevets, l'analyse des prix, l'analyse des parts de marché des entreprises, les normes de mesure, l'analyse globale par rapport à l'analyse régionale et des parts des fournisseurs. Pour en savoir plus sur la méthodologie de recherche, envoyez une demande pour parler à nos experts du secteur.
Personnalisation disponible
Data Bridge Market Research est un leader de la recherche formative avancée. Nous sommes fiers de fournir à nos clients existants et nouveaux des données et des analyses qui correspondent à leurs objectifs. Le rapport peut être personnalisé pour inclure une analyse des tendances des prix des marques cibles, une compréhension du marché pour d'autres pays (demandez la liste des pays), des données sur les résultats des essais cliniques, une revue de la littérature, une analyse du marché des produits remis à neuf et de la base de produits. L'analyse du marché des concurrents cibles peut être analysée à partir d'une analyse basée sur la technologie jusqu'à des stratégies de portefeuille de marché. Nous pouvons ajouter autant de concurrents que vous le souhaitez, dans le format et le style de données que vous recherchez. Notre équipe d'analystes peut également vous fournir des données sous forme de fichiers Excel bruts, de tableaux croisés dynamiques (Fact book) ou peut vous aider à créer des présentations à partir des ensembles de données disponibles dans le rapport.

