Global Diet Meals Market
Taille du marché en milliards USD
TCAC :
% 
 USD
143.22 Billion
USD
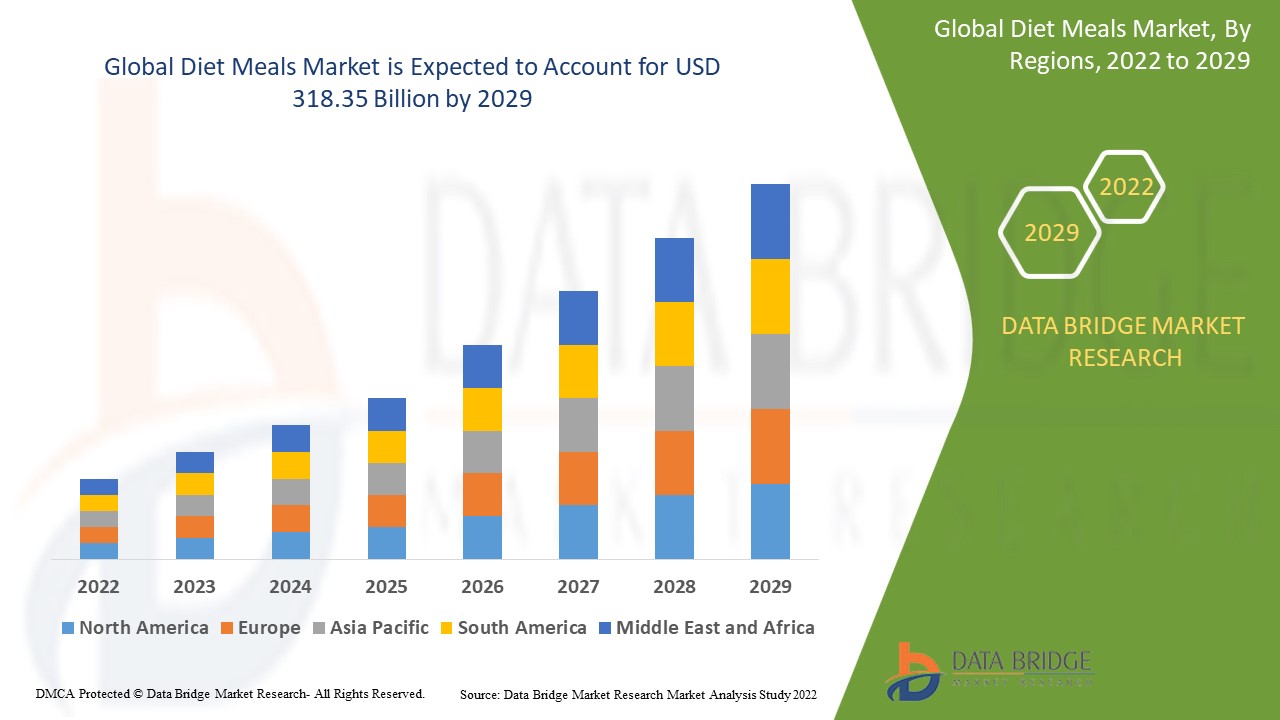
318.35 Billion
2021
2029
USD
143.22 Billion
USD
318.35 Billion
2021
2029
| 2022 –2029 | |
| USD 143.22 Billion | |
| USD 318.35 Billion | |
| % | |
|
Global Diet Meals Market, By Product (Supplements, Beverages, Snacks, Dairy, Others), Distribution Channel (Hypermarket and Supermarket, Specialty Stores, Convenience Stores, Online), Type (Functional Food, Naturally Health Food, Better-For-You (BFY) Food, Food Intolerance Products, Organic Food) – Industry Trends and Forecast to 2029.
Diet Meals Market Analysis and Size
Various types of "diet food" products are available in the retail market to make it easier and less painful for consumers to lose weight and make healthier, more responsible eating choices. The diet meals market has expanded across a wide range of food and beverage categories, including many not traditionally associated with weight loss, as a result of a steady influx of new product introductions.
Data Bridge Market Research analyses that the diet meals market was valued at USD 143.22 billion in 2021 and is expected to reach the value of USD 318.35 billion by 2029, at a CAGR of 10.50% during the forecast period of 2022-2029. In addition to the insights on market scenarios such as market value, growth rate, segmentation, geographical coverage, and major players, the market reports curated by the Data Bridge Market Research also include in-depth expert analysis, geographically represented company-wise production and capacity, network layouts of distributors and partners, detailed and updated price trend analysis and deficit analysis of supply chain and demand.
Diet Meals Market Scope and Segmentation
|
Report Metric |
Details |
|
Forecast Period |
2022 to 2029 |
|
Base Year |
2021 |
|
Historic Years |
2020 (Customizable to 2014 - 2019) |
|
Quantitative Units |
Revenue in USD Million, Volumes in Units, Pricing in USD |
|
Segments Covered |
Product (Supplements, Beverages, Snacks, Dairy, Others), Distribution Channel (Hypermarket and Supermarket, Specialty Stores, Convenience Stores, Online), Type (Functional Food, Naturally Health Food, Better-For-You (BFY) Food, Food Intolerance Products, Organic Food) |
|
Countries Covered |
U.S., Canada, Mexico in North America, Germany, Sweden, Poland, Denmark, Italy, U.K., France, Spain, Netherland, Belgium, Switzerland, Turkey, Russia, Rest of Europe in Europe, Japan, China, India, South Korea, New Zealand, Vietnam, Australia, Singapore, Malaysia, Thailand, Indonesia, Philippines, Rest of Asia-Pacific (APAC) in Asia-Pacific (APAC), Brazil, Argentina, Rest of South America as a part of South America, UAE, Saudi Arabia, Oman, Qatar, Kuwait, South Africa, Rest of Middle East and Africa (MEA) as a part of Middle East and Africa (MEA) |
|
Market Players Covered |
Atkins Nutritionals, Inc. (U.S.), Herbalife Ltd. (U.S.), Nutrisystem Ltd. (U.S.), Kellogg Company (U.S.), Ethicon, Inc. (U.S.), Covidien, plc. (U.S.), Apollo Endosurgery (U.S.), and Olympus Corporation (Olympus) (Japan), Weight Watchers International (U.S.), Jenny Craig (U.S.), eDiets.com, Inc. (U.S.), The Gold’s Gym International (U.S.), Brunswick Corporation (U.S.), Amer Sports (Finland), Johnson Health Tech (Taiwan), Technogym SpA (Italy) |
|
Opportunities |
|
Market Definition
Diet meals (or dietetic food) is any food or beverage whose recipe has been altered to reduce fat, carbohydrates, and/or sugar as part of a weight loss programme or diet. Bodybuilding supplements are designed to increase weight, whereas such foods are usually intended to aid in weight loss or a change in body type.
Global Diet Meals Market Dynamics
Drivers
- Growing obese population worldwide is creating an essential need for proper nutrition
One of the primary factors driving market growth is the rising prevalence of obesity. Rising bariatric surgeries, a growing obese population worldwide, and rising disposable income in emerging economies are all driving the diet meals market forward. Growing Obesity and overweight people are associated with a high prevalence of chronic diseases such as diabetes, hypertension, heart attacks, and orthopaedic diseases all over the world. As a result, the demand for healthy food and a balanced diet is positively driving the diet meals market growth.
- Growing adoption of diet plans and increase participants in fitness centres
Some of the factors expected to drive the growth of the diet meals market in the forecast period include rising preference for junk food, increased awareness of available substitutes for weight loss and management, and rising popularity of diet plans and fitness centres.
Opportunity
A growing number of innovations and technological advancements, as well as brand endorsement and marketing, will create new and abundant opportunities for the growth of the diet meals market during the forecast period.
Restraints
High costs associated with product consumption, as well as a lack of consumer awareness about the benefits of the products in developing economies, will likely impede the growth of the diet meals market during the forecast period. The limited role of branded companies will be the most significant and immediate challenge to market growth.
This diet meals market report provides details of new recent developments, trade regulations, import-export analysis, production analysis, value chain optimization, market share, impact of domestic and localized market players, analyses opportunities in terms of emerging revenue pockets, changes in market regulations, strategic market growth analysis, market size, category market growths, application niches and dominance, product approvals, product launches, geographic expansions, technological innovations in the market. To gain more info on the diet meals market contact Data Bridge Market Research for an Analyst Brief, our team will help you take an informed market decision to achieve market growth.
Impact and Current Market Scenario of Raw Material Shortage and Shipping Delays
Data Bridge Market Research offers a high-level analysis of the market and delivers information by keeping in account the impact and current market environment of raw material shortage and shipping delays. This translates into assessing strategic possibilities, creating effective action plans, and assisting businesses in making important decisions.
Apart from the standard report, we also offer in-depth analysis of the procurement level from forecasted shipping delays, distributor mapping by region, commodity analysis, production analysis, price mapping trends, sourcing, category performance analysis, supply chain risk management solutions, advanced benchmarking, and other services for procurement and strategic support.
COVID-19 Impact on Diet Meals Market
COVID-19 had a marginally positive market impact. This is due to increased health awareness among people during the pandemic era. Individuals began to focus on consumption patterns, resolved to curb unhealthy habits, and developed the habit of exercising and focusing on physical health. Individuals found a lot of inspiration and motivation from online videos and social medical channels. However, supply chain disruptions made transportation and distribution of weight management equipment difficult. Furthermore, movement restrictions added to the difficulties.
Expected Impact of Economic Slowdown on the Pricing and Availability of Products
When economic activity slows, industries begin to suffer. The forecasted effects of the economic downturn on the pricing and accessibility of the products are taken into account in the market insight reports and intelligence services provided by DBMR. With this, our clients can typically keep one step ahead of their competitors, project their sales and revenue, and estimate their profit and loss expenditures.
Recent Development
- In September 2020, Apple unveiled the Fitness+, which intelligently incorporates metrics from Apple Watch for users to visualize right on their iPhone, iPad, or Apple T.V., offering a first-of-its-kind personalized workout experience.
- In March 2020, CoreX Fit Life created the CoreX, the only fitness machine that has the capability of over 100 exercises, as well as sports simulation in a compact design. The CoreX allows for over 100 exercises for cardio, HIIT, strength training, Pilates, and toning.
Global Diet Meals Market Scope
The diet meals market is segmented on the basis of product, distribution channel, and type. The growth amongst these segments will help you analyse meagre growth segments in the industries and provide the users with a valuable market overview and market insights to help them make strategic decisions for identifying core market applications.
Product
- Beverages
- Supplements
- Snacks
- Dairy
- Others
Type
- Functional Food
- Naturally Health Food
- Better-For-You (BFY) Food
- Food Intolerance Products
- Organic Food
Distribution channel
- Hypermarket and Supermarket
- Specialty Stores
- Convenience Stores
- Online
Diet Meals Market Regional Analysis/Insights
The diet meals market is analysed and market size insights and trends are provided by country, product, distribution channel, and type as referenced above.
The countries covered in the diet meals market report are U.S., Canada, Mexico in North America, Germany, Sweden, Poland, Denmark, Italy, U.K., France, Spain, Netherland, Belgium, Switzerland, Turkey, Russia, Rest of Europe in Europe, Japan, China, India, South Korea, New Zealand, Vietnam, Australia, Singapore, Malaysia, Thailand, Indonesia, Philippines, Rest of Asia-Pacific (APAC) in Asia-Pacific (APAC), Brazil, Argentina, Rest of South America as a part of South America, UAE, Saudi Arabia, Oman, Qatar, Kuwait, South Africa, Rest of Middle East and Africa (MEA) as a part of Middle East and Africa (MEA).
Europe dominates the diet meals market due to the prevalence of a large consumer base consuming healthy products, whereas North America is expected to grow at the fastest rate from 2022 to 2029 due to the region's easy availability of diet products.
The country section of the report also provides individual market impacting factors and changes in market regulation that impact the current and future trends of the market. Data points like down-stream and upstream value chain analysis, technical trends and porter's five forces analysis, case studies are some of the pointers used to forecast the market scenario for individual countries. Also, the presence and availability of Global brands and their challenges faced due to large or scarce competition from local and domestic brands, impact of domestic tariffs and trade routes are considered while providing forecast analysis of the country data.
Competitive Landscape and Diet Meals Market Share Analysis
The diet meals market competitive landscape provides details by competitor. details included are company overview, company financials, revenue generated, market potential, investment in research and development, new market initiatives, Global presence, production sites and facilities, production capacities, company strengths and weaknesses, product launch, product width and breadth, application dominance. The above data points provided are only related to the companies' focus related to diet meals market.
Some of the major players operating in the diet meals market are:
- Atkins Nutritionals, Inc. (U.S.)
- Herbalife Ltd. (U.S.)
- Nutrisystem Ltd. (U.S.)
- Kellogg Company (U.S.)
- Ethicon, Inc. (U.S.)
- Covidien, plc. (U.S.)
- Apollo Endosurgery (U.S.)
- Olympus Corporation (Olympus) (Japan)
- Weight Watchers International (U.S.)
- Jenny Craig (U.S.)
- eDiets.com, Inc. (U.S.)
- The Gold’s Gym International (U.S.)
- Brunswick Corporation (U.S.)
- Amer Sports (Finland)
- Johnson Health Tech (Taiwan)
- Technogym SpA (Italy)
SKU-
Accédez en ligne au rapport sur le premier cloud mondial de veille économique

- Tableau de bord d'analyse de données interactif
- Tableau de bord d'analyse d'entreprise pour les opportunités à fort potentiel de croissance
- Accès d'analyste de recherche pour la personnalisation et les requêtes
- Analyse de la concurrence avec tableau de bord interactif
- Dernières actualités, mises à jour et analyse des tendances
- Exploitez la puissance de l'analyse comparative pour un suivi complet de la concurrence
Table des matières
1 INTRODUCTION
1.1 OBJECTIVES OF THE STUDY
1.2 MARKET DEFINITION
1.3 OVERVIEW OF GLOBAL DIET MEALS MARKET
1.4 CURRENCY AND PRICING
1.5 LIMITATION
1.6 MARKETS COVERED
2 MARKET SEGMENTATION
2.1 KEY TAKEAWAYS
2.2 ARRIVING AT THE GLOBAL DIET MEALS MARKET SIZE
2.3 VENDOR POSITIONING GRID
2.4 MARKETS COVERED
2.5 GEOGRAPHIC SCOPE
2.6 YEARS CONSIDERED FOR THE STUDY
2.7 RESEARCH METHODOLOGY
2.8 TECHNOLOGY LIFE LINE CURVE
2.9 MULTIVARIATE MODELLING
2.1 PRIMARY INTERVIEWS WITH KEY OPINION LEADERS
2.11 DBMR MARKET POSITION GRID
2.12 MARKET APPLICATION COVERAGE GRID
2.13 DBMR MARKET CHALLENGE MATRIX
2.14 IMPORT AND EXPORT DATA
2.15 SECONDARY SOURCES
2.16 GLOBAL DIET MEALS MARKET : RESEARCH SNAPSHOT
2.17 ASSUMPTIONS
3 MARKET OVERVIEW
3.1 DRIVERS
3.2 RESTRAINTS
3.3 OPPORTUNITIES
3.4 CHALLENGES
4 EXECUTIVE SUMMARY
5 PREMIUM INSIGHTS
5.1 SUPPLY CHAIN ANALYSIS
5.2 IMPORT-EXPORT ANALYSIS
5.3 FACTORS INFLUENCING PURCHASING DECISION
5.4 INDUTRY TRENDS AND FUTURE PERSPECTIVES
5.5 SHOPPING BEHAVIOUR AND DYNAMICS
5.5.1 RECOMMENDATION FROM FAMILY & FRIENDS
5.5.2 RESEARCH
5.5.3 IMPULSIVE
5.5.4 ADVERTISEMENT
5.6 PRIVATE LABEL VS BRAND ANALYSIS
5.7 PROMOTIONAL ACTIVITIES
5.8 CONSUMER DISPOSABLE INCOME DYNAMICS/SPEND DYNAMICS
5.9 NEW PRODUCT LAUNCH STRATEGY
5.9.1 NUMBER OF NEW PRODUCT LAUNCH
5.9.1.1. LLINE EXTENSTION
5.9.1.2. NNEW PACKAGING
5.9.1.3. RRE-LAUNCHED
5.9.1.4. NNEW FORMULATION
5.1 CONSUMER LEVEL TRENDS
5.11 MEETING CONSUMER REQUIREMENT
6 IMPACT OF ECONOMIC SLOW DOWN ON MARKET
6.1 IMPACT ON PRICE
6.2 IMPACT ON SUPPLY CHAIN
6.3 IMPACT ON SHIPMENT
6.4 IMPACT ON COMPANY’S STRATEGIC DECISIONS
7 REGULATORY FRAMEWORK AND GUIDELINES
8 PRICING ANALYSIS
9 BRAND OUTLOOK
9.1 COMPARATIVE BRAND ANALYSIS
9.2 PRODUCT VS BRAND OVERVIEW
10 GLOBAL DIET MEALS MARKET, BY TYPE, 2021-2030, (USD MILLION)
10.1 OVERVIEW
10.2 GENERAL WELLNESS MEALS
10.2.1 GENERAL WELLNESS MEALS, BY TYPE
10.2.1.1. PASTA & SPHAGETTI MEALS
10.2.1.1.1. PASTA & SPHAGETTI MEALS, BY SAUCE TYPE
10.2.1.1.1.1 RED SAUCE PAST
10.2.1.1.1.2 WHITE SAUCE PASTA
10.2.1.1.2. PASTA & SPHAGETTI MEALS, BY MEAT INCLUDED
10.2.1.1.2.1 CHICKEN AND PASTA MEALS
10.2.1.1.2.2 BEEF AND PASTA MEALS
10.2.1.1.2.3 PORK AND PASTA MEALS
10.2.1.1.2.4 SEAFOOD AND PASTA MEALS
10.2.1.1.2.5 OTHERS
10.2.1.2. RICE MEALS
10.2.1.2.1. RICE MEALS, BY RICE TYPE
10.2.1.2.1.1 BROWN RICE
10.2.1.2.1.2 BLACK RICE
10.2.1.2.1.3 WHITE RICE
10.2.1.2.1.4 WILD RICE
10.2.1.2.1.5 OTHERS (IF ANY)
10.2.1.2.2. RICE MEALS, BY MEAT INCLUDED
10.2.1.2.2.1 CHICKEN AND RICE MEALS
10.2.1.2.2.2 BEEF AND RICE MEALS
10.2.1.2.2.3 PORK AND RICE MEALS
10.2.1.2.2.4 SEAFOOD AND RICE MEALS
10.2.1.2.2.5 OTHERS
10.2.1.3. MEAT MEALS
10.2.1.4. VEGETABLE MEAL
10.2.1.5. VEGETABLE AND MEAT MIX MEALS
10.2.1.6. CURRY MEALS
10.2.1.7. SEAFOOD MEALS
10.2.1.8. SALAD MEALS
10.2.1.9. LASAGNE MEAL
10.2.1.10. ONLY POTATO MEALS
10.2.1.11. VEGAN MEALS
10.2.1.12. OTHERS
10.3 MEDICAL TAILORED MEALS
10.3.1 MEDICAL TAILORED MEALS, BY TYPE
10.3.1.1. DIABETIC MEALS
10.3.1.2. CARDIAC (HEART-HEALTHY) MEALS
10.3.1.3. RENAL (KIDNEY-FRIENDLY) MEALS
10.3.1.4. CANCER-FIGHTING MEALS
10.3.1.5. SOFT OR PUREED MEALS
10.3.1.6. WEIGHT MANAGEMENT DIET MEALS
10.3.1.7. OTHERS
11 GLOBAL DIET MEALS MARKET, BY MEAL CATEGORY, 2021-2030, (USD MILLION)
11.1 OVERVIEW
11.2 REGULAR MEAL
11.3 LOW-CHOLESTEROL MEALS
11.4 HIGH-PROTEIN MEALS
11.5 NUTRIENT-DENSE MEALS
11.6 LOW-CALORIE MEALS
11.7 HIGH-CALORIE MEALS
11.8 LACTOSE-FREE MEALS
11.9 GLUTEN-FREE MEALS
11.1 LOW-SODIUM MEALS
11.11 KETOGENIC MEALS
11.12 OTHERS
12 GLOBAL DIET MEALS MARKET, BY MEAL FORM, 2021-2030, (USD MILLION)
12.1 OVERVIEW
12.2 FRESH
12.2.1 FRESH, BY MEAL TYPE
12.2.1.1. GENERAL WELLNESS MEALS
12.2.1.2. MEDICAL TAILORED MEALS
12.3 FROZEN
12.3.1 FROZEN, BY MEAL TYPE
12.3.1.1. GENERAL WELLNESS MEALS
12.3.1.2. MEDICAL TAILORED MEALS
13 GLOBAL DIET MEALS MARKET, BY NATURE, 2021-2030, (USD MILLION)
13.1 OVERVIEW
13.2 ORGANIC
13.2.1 ORGANIC, BY MEAL TYPE
13.2.1.1. GENERAL WELLNESS MEALS
13.2.1.2. MEDICAL TAILORED MEALS
13.3 CONVENTIONAL
13.3.1 CONVENTIONAL, BY MEAL TYPE
13.3.1.1. GENERAL WELLNESS MEALS
13.3.1.2. MEDICAL TAILORED MEALS
14 GLOBAL DIET MEALS MARKET, BY MEAL TYPE, 2021-2030, (USD MILLION)
14.1 OVERVIEW
14.2 REGULAR / STANDARD MEALS
14.3 PERSONALIZED MEALS
15 GLOBAL DIET MEALS MARKET, BY FOOD CATEGORY, 2021-2030, (USD MILLION)
15.1 OVERVIEW
15.2 BREAKFAST
15.3 MID-DAY MEALS
15.4 LUNCH MEALS
15.5 DINNER MEALS
15.6 PARTY MEALS
15.7 OTHERS (IF ANY)
16 GLOBAL DIET MEALS MARKET, BY PACKAGING, 2021-2030, (USD MILLION)
16.1 OVERVIEW
16.2 TRAY
16.3 BOWLS
16.4 POUCHES
16.5 OTHERS
17 GLOBAL DIET MEALS MARKET, BY DEMOGRAPHIC, 2021-2030, (USD MILLION)
17.1 OVERVIEW
17.2 ADULTS
17.3 KIDS
18 GLOBAL DIET MEALS MARKET, BY END USE, 2021-2030, (USD MILLION)
18.1 OVERVIEW
18.2 HOUSEHOLD / RETAIL
18.2.1 HOUSEHOLD / RETAIL, BY MEAL TYPE
18.2.1.1. GENERAL WELLNESS MEALS
18.2.1.2. MEDICAL TAILORED MEALS
18.2.2 HOUSEHOLD / RETAIL, BY MEAL CATEGORY
18.2.2.1. REGULAR MEAL
18.2.2.2. LOW-CHOLESTEROL MEALS
18.2.2.3. HIGH-PROTEIN MEALS
18.2.2.4. NUTRIENT-DENSE MEALS
18.2.2.5. LOW-CALORIE MEALS
18.2.2.6. HIGH-CALORIE MEALS
18.2.2.7. LACTOSE-FREE MEALS
18.2.2.8. GLUTEN-FREE MEALS
18.2.2.9. LOW-SODIUM MEALS
18.2.2.10. KETOGENIC MEALS
18.2.2.11. OTHERS
18.3 FOOD SERVICE SECTOR
18.3.1 FOOD SERVICE SECTOR, BY TYPE
18.3.1.1. HOTELS
18.3.1.2. RESTAURANTS
18.3.1.3. CAFE
18.3.1.4. BARS / CLUBS
18.3.1.5. CATERING
18.3.1.6. OTHERS
18.3.2 FOOD SERVICE SECTOR, BY MEAL TYPE
18.3.2.1. GENERAL WELLNESS MEALS
18.3.2.2. MEDICAL TAILORED MEALS
18.3.3 FOOD SERVICE SECTOR, BY MEAL CATEGORY
18.3.3.1. REGULAR MEAL
18.3.3.2. LOW-CHOLESTEROL MEALS
18.3.3.3. HIGH-PROTEIN MEALS
18.3.3.4. NUTRIENT-DENSE MEALS
18.3.3.5. LOW-CALORIE MEALS
18.3.3.6. HIGH-CALORIE MEALS
18.3.3.7. LACTOSE-FREE MEALS
18.3.3.8. GLUTEN-FREE MEALS
18.3.3.9. LOW-SODIUM MEALS
18.3.3.10. KETOGENIC MEALS
18.3.3.11. OTHERS
18.4 MEDICAL
18.4.1 MEDICAL, BY CATEGORY
18.4.1.1. HOSPITALS
18.4.1.2. RECREATIONAL CENTRES
18.4.1.3. NURSING HOMES
18.4.1.4. OTHERS
18.4.2 MEDICAL, BY MEAL TYPE
18.4.2.1. GENERAL WELLNESS MEALS
18.4.2.2. MEDICAL TAILORED MEALS
18.4.3 MEDICAL, BY MEAL CATEGORY
18.4.3.1. REGULAR MEAL
18.4.3.2. LOW-CHOLESTEROL MEALS
18.4.3.3. HIGH-PROTEIN MEALS
18.4.3.4. NUTRIENT-DENSE MEALS
18.4.3.5. LOW-CALORIE MEALS
18.4.3.6. HIGH-CALORIE MEALS
18.4.3.7. LACTOSE-FREE MEALS
18.4.3.8. GLUTEN-FREE MEALS
18.4.3.9. LOW-SODIUM MEALS
18.4.3.10. KETOGENIC MEALS
18.4.3.11. OTHERS
19 GLOBAL DIET MEALS MARKET, BY DISTRIBUTION CHANNEL, 2021-2030, (USD MILLION)
19.1 OVERVIEW
19.2 STORE BASED RETAILER
19.2.1 SUPERMARKETS / HYPERMARKETS
19.2.2 CONVENIENCE STORES
19.2.3 SPECIALTY STORES
19.2.4 HEALTH & BEAUTY STORES
19.2.5 GROCERY STORES
19.2.6 MEDICAL STORES
19.2.7 WHOLESALERS / DISTRIBUTORS
19.2.8 OTHERS
19.3 NON-STORE RETAILER
19.3.1 COMPANY OWNED WEBSITES
19.3.2 THIRD PARTY WEBSITES
19.3.3 VENDING
20 GLOBAL DIET MEALS MARKET, BY GEOGRAPHY, 2021-2030 (USD MILLION)
GLOBAL DIET MEALS MARKET, (ALL SEGMENTATION PROVIDED ABOVE IS REPRESENTED IN THIS CHAPTER BY COUNTRY)
20.1 NORTH AMERICA
20.1.1 U.S.
20.1.2 CANADA
20.1.3 MEXICO
20.2 EUROPE
20.2.1 GERMANY
20.2.2 U.K.
20.2.3 ITALY
20.2.4 FRANCE
20.2.5 SPAIN
20.2.6 SWITZERLAND
20.2.7 RUSSIA
20.2.8 TURKEY
20.2.9 BELGIUM
20.2.10 NETHERLANDS
20.2.11 SWITZERLAND
20.2.12 DENMARK
20.2.13 NORWAY
20.2.14 FINLAND
20.2.15 SWEDEN
20.2.16 REST OF EUROPE
20.3 ASIA-PACIFIC
20.3.1 JAPAN
20.3.2 CHINA
20.3.3 SOUTH KOREA
20.3.4 INDIA
20.3.5 SINGAPORE
20.3.6 THAILAND
20.3.7 INDONESIA
20.3.8 MALAYSIA
20.3.9 PHILIPPINES
20.3.10 AUSTRALIA
20.3.11 NEW ZEALAND
20.3.12 REST OF ASIA-PACIFIC
20.4 SOUTH AMERICA
20.4.1 BRAZIL
20.4.2 ARGENTINA
20.4.3 REST OF SOUTH AMERICA
20.5 MIDDLE EAST AND AFRICA
20.5.1 SOUTH AFRICA
20.5.2 EGYPT
20.5.3 SAUDI ARABIA
20.5.4 UNITED ARAB EMIRATES
20.5.5 ISRAEL
20.5.6 REST OF MIDDLE EAST AND AFRICA
21 GLOBAL DIET MEALS MARKET, COMPANY LANDSCAPE
21.1 COMPANY SHARE ANALYSIS: GLOBAL
21.2 COMPANY SHARE ANALYSIS: NORTH AMERICA
21.3 COMPANY SHARE ANALYSIS: EUROPE
21.4 COMPANY SHARE ANALYSIS: ASIA-PACIFIC
21.5 MERGERS & ACQUISITIONS
21.6 NEW PRODUCT DEVELOPMENT & APPROVALS
21.7 EXPANSIONS
21.8 PARTNERSHIP AND OTHER STRATEGIC DEVELOPMENTS
22 GLOBAL DIET MEALS MARKET – COMPANY PROFILE
22.1 CONAGRA FOODS, INC
22.1.1 COMPANY SNAPSHOT
22.1.2 PRODUCT PORTFOLIO
22.1.3 PRODUCTION CAPACITY OVERVIEW
22.1.4 SWOT ANALYSIS
22.1.5 REVENUE ANALYSIS
22.1.6 RECENT UPDATES
22.2 AMERICAN HALAL COMPANY, INC.
22.2.1 COMPANY SNAPSHOT
22.2.2 PRODUCT PORTFOLIO
22.2.3 PRODUCTION CAPACITY OVERVIEW
22.2.4 SWOT ANALYSIS
22.2.5 REVENUE ANALYSIS
22.2.6 RECENT UPDATES
22.3 NESTLE
22.3.1 COMPANY SNAPSHOT
22.3.2 PRODUCT PORTFOLIO
22.3.3 PRODUCTION CAPACITY OVERVIEW
22.3.4 SWOT ANALYSIS
22.3.5 REVENUE ANALYSIS
22.3.6 RECENT UPDATES
22.4 REAL GOOD FOODS
22.4.1 COMPANY SNAPSHOT
22.4.2 PRODUCT PORTFOLIO
22.4.3 PRODUCTION CAPACITY OVERVIEW
22.4.4 SWOT ANALYSIS
22.4.5 REVENUE ANALYSIS
22.4.6 RECENT UPDATES
22.5 DON LEE FARMS
22.5.1 COMPANY SNAPSHOT
22.5.2 PRODUCT PORTFOLIO
22.5.3 PRODUCTION CAPACITY OVERVIEW
22.5.4 SWOT ANALYSIS
22.5.5 REVENUE ANALYSIS
22.5.6 RECENT UPDATES
22.6 MIKEY’S LLC.
22.6.1 COMPANY SNAPSHOT
22.6.2 PRODUCT PORTFOLIO
22.6.3 PRODUCTION CAPACITY OVERVIEW
22.6.4 SWOT ANALYSIS
22.6.5 REVENUE ANALYSIS
22.6.6 RECENT UPDATES
22.7 CAPPELLO’S
22.7.1 COMPANY SNAPSHOT
22.7.2 PRODUCT PORTFOLIO
22.7.3 PRODUCTION CAPACITY OVERVIEW
22.7.4 SWOT ANALYSIS
22.7.5 REVENUE ANALYSIS
22.7.6 RECENT UPDATES
22.8 SMART FLOUR FOODS
22.8.1 COMPANY SNAPSHOT
22.8.2 PRODUCT PORTFOLIO
22.8.3 PRODUCTION CAPACITY OVERVIEW
22.8.4 SWOT ANALYSIS
22.8.5 REVENUE ANALYSIS
22.8.6 RECENT UPDATES
22.9 URBAN PIE PIZZA CO.
22.9.1 COMPANY SNAPSHOT
22.9.2 PRODUCT PORTFOLIO
22.9.3 PRODUCTION CAPACITY OVERVIEW
22.9.4 SWOT ANALYSIS
22.9.5 REVENUE ANALYSIS
22.9.6 RECENT UPDATES
22.1 HORMEL FOODS
22.10.1 COMPANY SNAPSHOT
22.10.2 PRODUCT PORTFOLIO
22.10.3 PRODUCTION CAPACITY OVERVIEW
22.10.4 SWOT ANALYSIS
22.10.5 REVENUE ANALYSIS
22.10.6 RECENT UPDATES
22.11 KIDFRESH
22.11.1 COMPANY SNAPSHOT
22.11.2 PRODUCT PORTFOLIO
22.11.3 PRODUCTION CAPACITY OVERVIEW
22.11.4 SWOT ANALYSIS
22.11.5 REVENUE ANALYSIS
22.11.6 RECENT UPDATES
22.12 PRAEGER'S SENSIBLE FOODS (ACQUIRED BY VESTAR CAPITAL PARTNERS)
22.12.1 COMPANY SNAPSHOT
22.12.2 PRODUCT PORTFOLIO
22.12.3 PRODUCTION CAPACITY OVERVIEW
22.12.4 SWOT ANALYSIS
22.12.5 REVENUE ANALYSIS
22.12.6 RECENT UPDATES
22.13 HILARY’S
22.13.1 COMPANY SNAPSHOT
22.13.2 PRODUCT PORTFOLIO
22.13.3 PRODUCTION CAPACITY OVERVIEW
22.13.4 SWOT ANALYSIS
22.13.5 REVENUE ANALYSIS
22.13.6 RECENT UPDATES
22.14 FEEL GOOD FOODS
22.14.1 COMPANY SNAPSHOT
22.14.2 PRODUCT PORTFOLIO
22.14.3 PRODUCTION CAPACITY OVERVIEW
22.14.4 SWOT ANALYSIS
22.14.5 REVENUE ANALYSIS
22.14.6 RECENT UPDATES
22.15 TYSON FOODS
22.15.1 COMPANY SNAPSHOT
22.15.2 PRODUCT PORTFOLIO
22.15.3 PRODUCTION CAPACITY OVERVIEW
22.15.4 SWOT ANALYSIS
22.15.5 REVENUE ANALYSIS
22.15.6 RECENT UPDATES
22.16 STAR RIGHT
22.16.1 COMPANY SNAPSHOT
22.16.2 PRODUCT PORTFOLIO
22.16.3 PRODUCTION CAPACITY OVERVIEW
22.16.4 SWOT ANALYSIS
22.16.5 REVENUE ANALYSIS
22.16.6 RECENT UPDATES
22.17 KELLANOVA
22.17.1 COMPANY SNAPSHOT
22.17.2 PRODUCT PORTFOLIO
22.17.3 PRODUCTION CAPACITY OVERVIEW
22.17.4 SWOT ANALYSIS
22.17.5 REVENUE ANALYSIS
22.17.6 RECENT UPDATES
22.18 RED'S ALL NATURAL (ACQUIRED BY BANSK GROUP)
22.18.1 COMPANY SNAPSHOT
22.18.2 PRODUCT PORTFOLIO
22.18.3 PRODUCTION CAPACITY OVERVIEW
22.18.4 SWOT ANALYSIS
22.18.5 REVENUE ANALYSIS
22.18.6 RECENT UPDATES
22.19 AMY’S KITCHEN
22.19.1 COMPANY SNAPSHOT
22.19.2 PRODUCT PORTFOLIO
22.19.3 PRODUCTION CAPACITY OVERVIEW
22.19.4 SWOT ANALYSIS
22.19.5 REVENUE ANALYSIS
22.19.6 RECENT UPDATES
22.2 SOOZY’S GRAIN FREE
22.20.1 COMPANY SNAPSHOT
22.20.2 PRODUCT PORTFOLIO
22.20.3 PRODUCTION CAPACITY OVERVIEW
22.20.4 SWOT ANALYSIS
22.20.5 REVENUE ANALYSIS
22.20.6 RECENT UPDATES
23 CONCLUSION
24 QUESTIONNAIRE
25 RELATED REPORTS
26 ABOUT DATA BRIDGE MARKET RESEARCH
Méthodologie de recherche
La collecte de données et l'analyse de l'année de base sont effectuées à l'aide de modules de collecte de données avec des échantillons de grande taille. L'étape consiste à obtenir des informations sur le marché ou des données connexes via diverses sources et stratégies. Elle comprend l'examen et la planification à l'avance de toutes les données acquises dans le passé. Elle englobe également l'examen des incohérences d'informations observées dans différentes sources d'informations. Les données de marché sont analysées et estimées à l'aide de modèles statistiques et cohérents de marché. De plus, l'analyse des parts de marché et l'analyse des tendances clés sont les principaux facteurs de succès du rapport de marché. Pour en savoir plus, veuillez demander un appel d'analyste ou déposer votre demande.
La méthodologie de recherche clé utilisée par l'équipe de recherche DBMR est la triangulation des données qui implique l'exploration de données, l'analyse de l'impact des variables de données sur le marché et la validation primaire (expert du secteur). Les modèles de données incluent la grille de positionnement des fournisseurs, l'analyse de la chronologie du marché, l'aperçu et le guide du marché, la grille de positionnement des entreprises, l'analyse des brevets, l'analyse des prix, l'analyse des parts de marché des entreprises, les normes de mesure, l'analyse globale par rapport à l'analyse régionale et des parts des fournisseurs. Pour en savoir plus sur la méthodologie de recherche, envoyez une demande pour parler à nos experts du secteur.
Personnalisation disponible
Data Bridge Market Research est un leader de la recherche formative avancée. Nous sommes fiers de fournir à nos clients existants et nouveaux des données et des analyses qui correspondent à leurs objectifs. Le rapport peut être personnalisé pour inclure une analyse des tendances des prix des marques cibles, une compréhension du marché pour d'autres pays (demandez la liste des pays), des données sur les résultats des essais cliniques, une revue de la littérature, une analyse du marché des produits remis à neuf et de la base de produits. L'analyse du marché des concurrents cibles peut être analysée à partir d'une analyse basée sur la technologie jusqu'à des stratégies de portefeuille de marché. Nous pouvons ajouter autant de concurrents que vous le souhaitez, dans le format et le style de données que vous recherchez. Notre équipe d'analystes peut également vous fournir des données sous forme de fichiers Excel bruts, de tableaux croisés dynamiques (Fact book) ou peut vous aider à créer des présentations à partir des ensembles de données disponibles dans le rapport.

