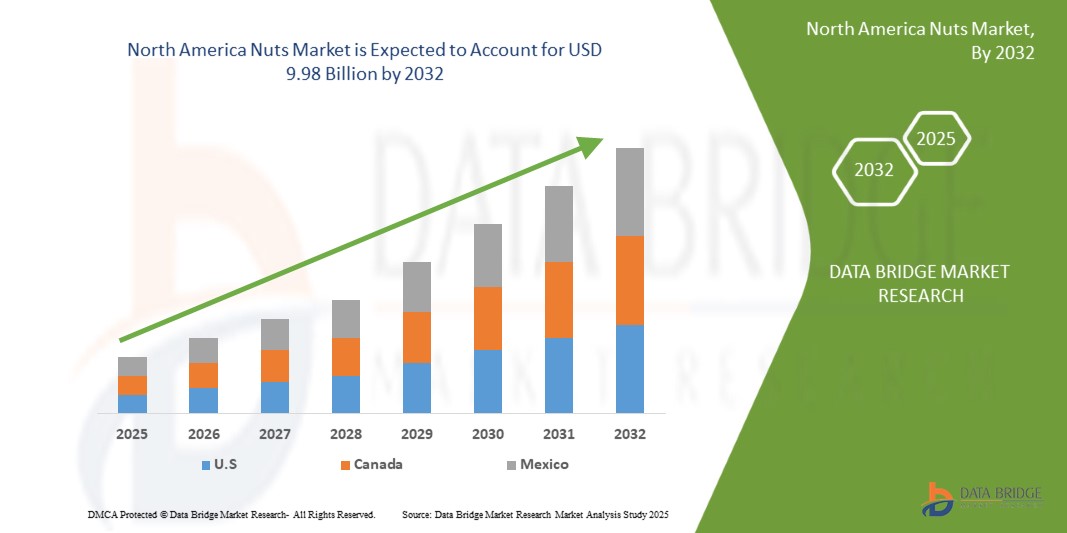
North America Nuts Market
Taille du marché en milliards USD
TCAC :
% 
 USD
6.44 Billion
USD
9.98 Billion
2024
2032
USD
6.44 Billion
USD
9.98 Billion
2024
2032
| 2025 –2032 | |
| USD 6.44 Billion | |
| USD 9.98 Billion | |
| % | |
|
North America Nuts Market Segmentation, By Product Type (Tree Nuts, Ground Nuts, Hybrid/Other Nuts, and Others), Form (Whole, Butter, Ground, Halves, Pieces, Oil, Milk, Paste, Cream, Roasted Pieces, Coated, Flour, Powder, Chopped, Sliced, Diced, Crushed, Blanched Whole, Frozen, Spray-Dried, Encapsulated, and Others), Nature (Conventional and Organic), Processing Method (Raw, Roasted, Salted, Blanched, Flavored, Unsalted, Glazed, Candied, Caramelized, Smoked Sprouted, Fermented, Freeze-Dried, Pickled, Vacuum-Fried, Dehydrated, and Others), Grade (A Grade (Premium Export Quality), B Grade (Mid-Quality Domestic Use), Broken Grade (Bakery & Confectionery Use), Oil-Grade, Industrial Grade, Rejected Grade (Animal Feed)), Shelf Life (
Nuts Market Size
- The North America nuts market size was valued at USD 6.44 billion in 2024 and is expected to reach USD 9.98 billion by 2032, at a CAGR of 5.7% during the forecast period
- The nuts market is mainly driven by growing awareness of health benefits of nuts as they are rich source of fiber, protein, minerals & vitamins and several other antioxidants. They are good source of saturated fats and helps in maintaining a healthy heart and brain. Consumers are often aware about the preferences of vegan snacks worldwide.
Nuts Market Analysis
- A nut is a fruit composed of inedible hard shell and a seed which is edible. They are good source of good fats, fiber and other rich beneficial nutrients. Each type of nut offers other benefits. Nuts are among the best source of plant based proteins. A diet rich in nuts help to prevent risk factors such as inflammation or some chronic diseases.
- In many ways, eating nuts on a regular basis will improve health, such as lowering the risk of diabetes and heart disease as well as decreasing the amount of cholesterol and triglycerides. Despite its high calorie content, this nutritious high fiber treatment may also help weight loss.
- The United States is expected to lead the North American market with the market share of 82.38%,. This is attributed to the widespread popularity of nut-based snacks, increased demand for organic and non-GMO varieties, and growing applications in bakery, dairy alternatives, and functional foods.
- The tree nut segment is expected to dominate the market due to its wide availability, affordability, and extensive product variety.
Report Scope and Nuts Market Segmentation
|
Attributes |
Nuts Key Market Insights |
|
Segments Covered |
|
|
Countries Covered |
North America
|
|
Key Market Players |
|
|
Market Opportunities |
|
|
Value Added Data Infosets |
In addition to the insights on market scenarios such as market value, growth rate, segmentation, geographical coverage, and major players, the market reports curated by the Data Bridge Market Research also include in-depth expert analysis, pricing analysis, brand share analysis, consumer survey, demography analysis, supply chain analysis, value chain analysis, raw material/consumables overview, vendor selection criteria, PESTLE Analysis, Porter Analysis, and regulatory framework. |
Nuts Market Trends
“Growing Trend Toward Healthier Snacking and Nutritious Choices”
- The nuts market is rapidly growing, driven by increasing health-conscious snacking trends. Consumers are seeking nutritious, convenient snacks, and nuts perfectly fit this demand due to their rich protein, fiber, and healthy fats. As awareness of wellness rises, nuts are becoming a preferred choice for guilt-free snacking, boosting market growth and encouraging innovation in product offerings.
- A key driver behind the popularity of nuts as snacks is the increasing health awareness among consumers. Valued for their nutritional content, nuts are seen as a wholesome alternative to traditional snack foods. They are rich in essential vitamins, minerals, fiber, and protein and contain heart-healthy monounsaturated and polyunsaturated fats. Their natural portability and convenience make them ideal for busy lifestyles, offering a quick and nutritious snack solution throughout the day.
- For instance, in June 2024, according to Business Standard Private Ltd., Nutraj announced the launch of its new product, the “NutrajSnackrite Daily Nutrition Pack.” This thoughtfully designed pack contains convenient pouches filled with a delicious and nutritious trail mix, combining a variety of premium nuts and dried fruits. Aimed at health-conscious consumers, it provides a perfect on-the-go snack option that delivers essential nutrients and energy throughout the day, catering to the rising demand for wholesome and tasty snack choices
Nuts Market Dynamics
Driver
“Rise in Daily Consumption of Various Nut Products”
- The North America nuts market is experiencing significant growth, primarily driven by the increased consumption of nuts worldwide. One of the key factors driving this rise is the growing awareness among consumers about the health benefits of nuts.
- In addition, the shift towards plant-based and clean eating lifestyles has made nuts a popular choice as a natural and wholesome snack. Convenience also plays a crucial role, as nuts are easy to carry and consume on the go, fitting well into busy modern lifestyles. Furthermore, product innovation, including new flavors, packaging, and ready-to-eat options, has broadened the appeal, encouraging more consumers to incorporate nuts into their daily diets and driving North America market expansion.
- For instance, in September 2024, according to Forbes Media LLC., Daily Crunch raised USD 4 million in Series A funding to support its expansion in the growing nut-based snack market. The investment is focused on enhancing its range of sprouted nut snacks such as almonds, walnuts, and cashews scaling up production, and increasing retail availability to meet rising North America demand for nutritious, on-the-go nut products
Restraint/Challenge
“Price Volatility Restraining Growth in the Nuts Market”
- Price volatility is a major factor restraining growth in the North America nuts market. Fluctuating prices, driven by unpredictable weather events such as droughts, floods, and frost, disrupt supply chains and create uncertainty for both producers and buyers. For instance, adverse conditions in key growing regions, and have led to reduced yields and sharp price increases, making it difficult for manufacturers to maintain stable product costs
- In addition, trade tensions and shifting tariffs further exacerbate price instability, limiting market expansion. This unpredictability discourages investment and challenges long-term planning within the industry. As a result, consumers may face higher prices or reduced availability, which can dampen demand. Addressing price volatility is crucial for ensuring steady growth and sustainability in the North America nuts market
- For instance, in June 2024, according to SGGP, the Vietnam Cashew Association (VINACAS) established a dedicated task force to tackle price fluctuations in raw cashew nuts. This group collaborates with the government and ministries to stabilize prices, aiming to reduce supply chain disruptions and support sustainable growth within Vietnam’s cashew industry
Nuts Market Scope
The North America nuts market is segmented into twelve notable segments based on product type, form, nature, processing method, grade, shelf life, certification, packaging, packaging size, price range, end-use, and distribution channel.
- By Product Type
On the basis of product type, the nuts market is segmented into tree nuts, ground nuts, hybrid/other nuts, and others. The tree nuts segment is projected to dominate the market with the market share of share of 52.41% in 2025, driven by the widespread popularity and availability of almonds, cashews, walnuts, pistachios, and other varieties. Their established role in global diets, coupled with high nutritional value and increasing use in health-centric snacks, makes tree nuts the preferred category.
- By Form
On the basis of form, the market is segmented into whole, butter, ground, halves, pieces, oil, milk, paste, cream, roasted pieces, coated, flour, powder, chopped, sliced, diced, crushed, blanched whole, frozen, spray-dried, encapsulated, and others. In 2025, the whole segment is expected to lead the form segment with the market share of 11.69%, fueled by rising health awareness and consumer preference for unprocessed, clean-label foods. Whole nuts offer convenience, visual appeal, and perceived freshness, making them a top choice for both direct consumption and culinary applications.
- By Nature
On the basis of nature, the nuts market is segmented into conventional and organic. The conventional segment is expected to dominate the market with the market share of 61.77% in 2025 due to its affordability, ease of sourcing, and strong presence across mainstream retail channels. In price-sensitive and developing regions, conventional nuts continue to hold a major share due to familiarity, consistent quality, and higher availability compared to premium organic alternatives.
- By Processing Method
The market is segmented by processing method into raw, roasted, salted, blanched, flavored, unsalted, glazed, candied, caramelized, smoked, sprouted, fermented, freeze-dried, pickled, vacuum-fried, dehydrated, and others. The raw segment is anticipated to dominate the market with the market share of 12.65% in 2025 as consumer trends shift towards minimally processed, nutrient-rich foods. Raw nuts retain natural enzymes and nutrients, appealing strongly to health-conscious, vegan, and clean-eating communities.
- By Grade
On the basis of grade, the market is categorized into A grade (premium export quality), B grade (mid-quality domestic use), broken grade (bakery & confectionery use), oil-grade, industrial grade, and rejected grade (animal feed). The A grade segment is projected to dominate the market with the market share of 34.01% in 2025, primarily due to increasing international demand for high-quality, visually consistent nuts.
- By Shelf Life
The market is segmented by shelf life into <6 months, 6–12 months, 13–18 months, 18 months, and more than 18 months. The <6 months segment is anticipated to dominate the market with the market share of 36.82% in 2025, reflecting a growing demand for fresher, recently harvested nuts. Premium consumers, especially in the retail and health sectors, associate short shelf life with better taste, texture, and nutritional value.
- By Certification
On the basis of certification, the market includes ISO 22000/HACCP, USDA Organic, EU Organic, Non-GMO Verified, Gluten-Free Certified, Kosher, Halal, Vegan Certified, Fair Trade, Rainforest Alliance, Carbon Neutral Certified, and others. The ISO 22000/HACCP segment is projected to lead the market with the market share of 20.82% in 2025 due to rising global food safety regulations and consumer demand for traceable, hygienic, and quality-assured nut products.
- By Packaging
Packaging types include plastic pouches, vacuum-sealed packs, PET jars, paper bags, composite cans, bulk woven sacks, glass jars, sachets/single-serve, gift boxes, bio-based/compostable, metal tins, resealable eco-tubs, foil-wrapped bars, refill packs, and others. In 2025, plastic pouches segment is expected to dominate the market with the market share of 19.28%, driven by their convenience, portability, cost-effectiveness, and shelf-life benefits. Sub-segments like stand-up zipper packs also cater well to modern retail displays and consumer use.
- By Packaging Size
The market is segmented into 101g–250g, 251g–500g, 51g–100g, 25g–50g, 501g–1kg, 1.1kg–2.5kg, 2.6kg–5kg, 5.1kg–10kg, 10.1kg–25kg, 25.1kg–50kg, 50kg, and <25g. In 2025, the 101g–250g segment is expected to dominate the market with the market share of 15.49%, catering to on-the-go consumption, trial purchases, and health-conscious snacking. This range balances convenience and value, making it attractive in both modern retail and online channels.
- By Price Range
Price ranges include economy/budget (USD 1.00–6.00 per kg), mid-range (USD 6.01–12.00 per kg), premium (USD 12.01–20.00 per kg), and super-premium/gourmet (above USD 20.00 per kg). The economy/budget segment is projected to dominate the market with the market share of 39.22% in 2025 due to affordability-driven demand in emerging markets, institutional buyers, and mass-market retail channels.
- By End Use
The market is segmented into direct consumption, snacks, nut butters & spreads, bakery industry, confectionery industry, cereal & granola manufacturing, functional nutrition, dairy alternatives, beverage industry, plant-based meats, culinary, industrial oil extraction, flour & gluten-free baking, personal care products, bio-based & agro-industrial uses, pet food additives, animal feed, and others. In 2025, the direct consumption segment is anticipated to dominate the market with the market share of 12.87% due to increasing demand for convenient, nutritious snacks. The rise of healthy lifestyles and protein-rich diets further propels this segment across retail, online, and travel-friendly channels.
- By Distribution Channel
On the basis of distribution channel, the market is segmented into B2B and B2C. B2C is further divided into offline and online channels. Offline includes supermarkets/hypermarkets, convenience stores, health food stores, bakeries, specialty stores, HoReCa, duty-free stores, and airlines. Online includes e-commerce marketplaces and brand-owned websites. The B2B segment is expected to dominate the market with the market share of 53.42% in 2025, supported by wide product availability, trust in physical retail, and impulse buying behavior, particularly in traditional and emerging markets.
Nuts Market Regional Analysis
The United States is expected to leads the North American market with the market share of 52.41%. This is attributed to the widespread popularity of nut-based snacks, increased demand for organic and non-GMO varieties, and growing applications in bakery, dairy alternatives, and functional foods. California plays a central role, being one of the world’s largest producers of almonds and walnuts. The U.S. also shows strong demand for value-added nut products such as flavored roasted nuts, trail mixes, nut butters, and protein bars, reflecting a mature and health-focused consumer base.
Nuts Market Share
The nuts industry is primarily led by well-established companies, including:
- Olam Group (Singapore)
- ADM (US)
- Mariani Nut Company (US)
- BORGES AGRICULTURAL & INDUSTRIAL NUTS, S.A. (Spain)
- SELECT HARVESTS (Australia)
- Blue Diamond Growers (US)
- Wonderful Pistachios LLC (US)
- Treehouse California Almonds, LLC (US
- Sahale Snacks (US)
- Santé Nuts (US)
- JOHN B. SANFILIPPO & SON, INC. (US)
- SETTON PISTACHIO OF TERRA BELLA, INC. (US)
- TERRA NUTS (Brazil)
- HINES NUT COMPANY (US)
- Golden Peanut Company, LLC (US)
- Barry Callebaut. (Switzerland)
- INTERSNACK GROUP (Germany)
- Gourmet Nut (US)
- Diamond Foods (US)
- Hormel Foods Corporation (US)
- Poindexter Nut Company (US)
- Mount Franklin Foods (US)
- Western Nut Company Inc. (US)
Latest Developments in North America Nuts Market
- In April 2024, Olam Group announced a major expansion of its nut processing capabilities in Nigeria, aimed at boosting cashew nut processing volumes for both domestic consumption and export. This investment aligns with Olam’s strategy to strengthen its presence in value-added agri-products and support local economies through job creation and capacity-building in emerging markets
- In March 2024, Blue Diamond Growers introduced a new line of almond-based protein snacks under its “Nut-Thins” brand, focusing on high-protein, gluten-free snack options. This product launch caters to rising consumer demand for healthy, on-the-go snacking options and reinforces Blue Diamond’s position in the functional snacking segment of the nuts industry
- In February 2024, Select Harvests announced the acquisition of additional almond orchards in Victoria to enhance its production capacity. This strategic move is expected to improve vertical integration and ensure a stable supply of high-quality almonds, strengthening the company’s North America competitiveness amidst increasing demand from Asia-Pacific markets.
- In January 2024, Wonderful Pistachios LLC launched a North America marketing campaign titled “The Power of Pistachios,” highlighting the health benefits of pistachio consumption. The campaign targets major international markets, including India, China, and the Middle East, and is supported by influencer marketing and nutritional awareness partnerships.
- In December 2023, John B. Sanfilippo & Son, Inc. invested in automation and digitalization at its Illinois-based processing facility to increase efficiency and ensure consistent quality across its peanut and tree nut product lines. The upgrade includes AI-powered sorting systems and improved sustainability measures in packaging and water usage.
- In November 2023, Borges Agricultural & Industrial Nuts, S.A. announced a partnership with a blockchain platform to implement full traceability for its almond and walnut supply chains. This initiative is aimed at ensuring transparency, fair-trade certification, and consumer trust in North American markets.
SKU-
Accédez en ligne au rapport sur le premier cloud mondial de veille économique

- Tableau de bord d'analyse de données interactif
- Tableau de bord d'analyse d'entreprise pour les opportunités à fort potentiel de croissance
- Accès d'analyste de recherche pour la personnalisation et les requêtes
- Analyse de la concurrence avec tableau de bord interactif
- Dernières actualités, mises à jour et analyse des tendances
- Exploitez la puissance de l'analyse comparative pour un suivi complet de la concurrence
Table des matières
1 INTRODUCTION
1.1 OBJECTIVES OF THE STUDY
1.2 MARKET DEFINITION
1.3 OVERVIEW
1.4 LIMITATIONS
1.5 MARKETS COVERED
2 MARKET SEGMENTATION
2.1 MARKETS COVERED
2.2 GEOGRAPHICAL SCOPE
2.3 YEARS CONSIDERED FOR THE STUDY
2.4 CURRENCY AND PRICING
2.5 DBMR TRIPOD DATA VALIDATION MODEL
2.6 MULTIVARIATE MODELING
2.7 PRIMARY INTERVIEWS WITH KEY OPINION LEADERS
2.8 DBMR MARKET POSITION GRID
2.9 MARKET END-USE COVERAGE GRID
2.1 DBMR VENDOR SHARE ANALYSIS
2.11 SECONDARY SOURCES
2.12 ASSUMPTIONS
3 EXECUTIVE SUMMARY
4 PREMIUM INSIGHTS
4.1 VALUE CHAIN
4.1.1 PRODUCTION:
4.1.2 PROCESSING:
4.1.3 MARKETING/DISTRIBUTION:
4.1.4 BUYERS:
4.2 SUPPLY CHAIN ANALYSIS
4.3 PORTER’S FIVE FORCES ANALYSIS
4.4 RAW MATERIAL SOURCING ANALYSIS
4.5 OVERVIEW OF TECHNOLOGICAL INNOVATIONS
4.6 GROWTH STRATEGIES ADOPTED BY KEY MARKET PLAYERS
4.7 FACTORS INFLUENCING PURCHASING DECISION OF END-USERS
4.8 IMPACT OF ECONOMIC SLOW DOWN ON MARKET
4.8.1 IMPACT ON PRICE
4.8.2 IMPACT ON SUPPLY CHAIN
4.8.3 IMPACT ON SHIPMENT
4.8.4 IMPACT ON COMPANY’S STRATEGIC DECISIONS
4.9 REGULATORY FRAMEWORK AND GUIDELINES
4.9.1 COST ANALYSIS BREAKDOWN
4.1 INNOVATION TRACKER AND STRATEGIC ANALYSIS
4.10.1 MAJOR DEALS AND STRATEGIC ALLIANCES ANALYSIS
4.10.1.1 JOINT VENTURES
4.10.1.2 MERGERS AND ACQUISITIONS
4.10.1.3 LICENSING AND PARTNERSHIP
4.10.1.4 TECHNOLOGY COLLABORATIONS
4.10.1.5 STRATEGIC DIVESTMENTS
4.10.2 NUMBER OF PRODUCTS IN DEVELOPMENT
4.10.3 STAGE OF DEVELOPMENT
4.10.4 TIMELINES AND MILESTONES
4.10.5 INNOVATION STRATEGIES AND METHODOLOGIES
4.10.6 RISK ASSESSMENT AND MITIGATION
4.10.7 FUTURE OUTLOOK
4.11 TARIFFS & IMPACT ON THE MARKET
4.11.1 CURRENT TARIFF RATE (S) IN TOP-5 COUNTRY MARKETS
4.11.2 OUTLOOK: LOCAL PRODUCTION V/S IMPORT RELIANCE
4.11.3 VENDOR SELECTION CRITERIA DYNAMICS
4.11.4 IMPACT ON SUPPLY CHAIN
4.11.4.1 RAW MATERIAL PROCUREMENT
4.11.4.2 MANUFACTURING AND PRODUCTION
4.11.4.3 LOGISTICS AND DISTRIBUTION
4.11.4.4 PRICE PITCHING AND POSITION OF MARKET
4.11.5 INDUSTRY PARTICIPANTS: PROACTIVE MOVES
4.11.5.1 SUPPLY CHAIN OPTIMIZATION
4.11.5.2 JOINT VENTURE ESTABLISHMENTS
4.11.6 IMPACT ON PRICES
4.11.7 REGULATORY INCLINATION
4.11.7.1 GEOPOLITICAL SITUATION
4.11.7.2 TRADE PARTNERSHIPS BETWEEN THE COUNTRIES
4.11.7.2.1 FREE TRADE AGREEMENTS
4.11.7.2.2 ALLIANCES ESTABLISHMENTS
4.11.7.3 STATUS ACCREDITION (INCLUDING MFTN)
4.11.7.4 DOMESTIC COURSE OF CORRECTION
4.11.7.4.1 INCENTIVE SCHEMES TO BOOST PRODUCTION OUTPUTS
4.11.7.4.2 ESTABLISHMENT OF SPECIAL ECONOMIC ZONES/INDUSTRIAL PARKS
4.12 BRAND OUTLOOK
4.12.1 COMPARATIVE BRAND ANALYSIS
4.12.2 PRODUCT AND BRAND OVERVIEW
4.13 SUPPLY CHAIN ANALYSIS
4.13.1 OVERVIEW
4.13.2 LOGISTIC COST SCENARIO
4.13.3 IMPORTANCE OF LOGISTICS SERVICE PROVIDERS
4.14 PRODUCTION CONSUMPTION ANALYSIS
4.15 IMPORT-EXPORT ANALYSIS
4.16 PATENT ANALYSIS
4.16.1 PATENT QUALITY AND STRENGTH
4.16.2 PATENT FAMILIES
4.16.3 NUMBER OF INTERNATIONAL PATENT FAMILIES BY PUBLICATION YEAR
4.17 LICENSING AND COLLABORATIONS
4.17.1 COMPANY PATENT LANDSCAPE
4.18 REGION PATENT LANDSCAPE
4.19 IP STRATEGY AND MANAGEMENT
4.2 PATENT ANALYSIS
4.21 PROFIT MARGINS SCENARIO
4.22 PRICING ANALYSIS
4.23 INDUSTRY ECOSYSTEM ANALYSIS
4.23.1 PROMINENT COMPANIES
4.23.2 SMALL & MEDIUM SIZE COMPANIES
4.23.3 END USERS
4.24 IMPACT OF ECONOMIC SLOWDOWN ON NORTH AMERICA NUTS MARKET
4.24.1 IMPACT ON PRICES
4.24.2 IMPACT ON SUPPLY CHAIN
4.24.3 IMPACT ON SHIPMENT
4.24.4 IMPACT ON DEMAND
4.24.5 IMPACT ON STRATEGIC DECISIONS
5 MARKET OVERVIEW
5.1 DRIVERS
5.1.1 GROWING NORTH AMERICA TREND TOWARD HEALTHIER SNACKING AND NUTRITIOUS CHOICES
5.1.2 RISE IN DAILY CONSUMPTION OF VARIOUS NUT PRODUCTS
5.1.3 INCREASING NORTH AMERICA DEMAND TOWARD PLANT-BASED DIETS
5.1.4 E-COMMERCE GROWTH BOOSTING NUT PRODUCT ACCESSIBILITY
5.2 RESTRAINTS
5.2.1 PRICE VOLATILITY RESTRAINING GROWTH IN THE NUTS MARKET
5.2.2 SUPPLY CHAIN DISRUPTIONS
5.2.3 IMPACT OF CLIMATE CHANGE ON MARKET STABILITY
5.3 OPPORTUNITIES
5.3.1 INNOVATION IN FLAVORED AND READY-TO-EAT NUT PRODUCTS
5.3.2 MODIFICATION IN THE NUT PRODUCTION
5.3.3 INCREASING USE OF NUTS IN BAKERY AND CONFECTIONERY PRODUCTS
5.4 CHALLENGES
5.4.1 RISING DROUGHTS, HEATWAVES, AND UNPREDICTABLE RAINFALL THREATEN CROP YIELDS AND QUALITY
5.4.2 LABOR SHORTAGES IN HARVESTING SEASONS AND RELIANCE ON MANUAL LABOR RAISE BOTH COST AND COMPLIANCE CHALLENGES
6 NORTH AMERICA NUTS MARKET, BY PRODUCT TYPE
6.1 OVERVIEW
6.2 TREE NUTS
6.2.1 TREE NUTS, BY TYPE
6.2.1.1 Almonds
6.2.1.2 Cashews
6.2.1.3 Walnuts
6.2.1.4 Pistachios
6.2.1.5 Hazelnuts
6.2.1.6 Pecans
6.2.1.7 Macadamias
6.2.1.8 Pine Nuts
6.2.1.9 Brazil Nuts
6.2.1.10 Chestnuts
6.2.1.11 Pili Nuts
6.2.1.12 Barukas Nuts
6.2.1.13 Others
6.3 GROUND NUTS
6.3.1 GROUND NUTS, BY PEANUTS
6.3.1.1 Runner
6.3.1.2 Virginia
6.3.1.3 Spanish
6.3.1.4 Valencia
6.3.1.5 Others
6.4 HYBRID/OTHER NUTS
6.4.1 HYBRID/OTHER NUTS, BY TYPE
6.4.1.1 Coconuts
6.4.1.2 Betel Nuts
6.4.1.3 Tiger Nuts
6.4.1.4 Ginkgo Nuts
6.4.1.5 Others
6.5 OTHERS
7 NORTH AMERICA NUTS MARKET, FORM
7.1 OVERVIEW
7.2 WHOLE
7.3 BUTTER
7.4 GROUND
7.5 HALVES
7.6 PIECES
7.7 OIL
7.8 MILK
7.9 PASTE
7.1 CREAM
7.11 ROASTED PIECES
7.12 COATED
7.13 FLOUR
7.14 POWDER
7.15 CHOPPED
7.16 SLICED
7.17 DICED
7.18 CRUSHED
7.19 BLANCHED WHOLE
7.2 FROZEN
7.21 SPRAY-DRIED
7.22 ENCAPSULATED
7.23 OTHERS
8 NORTH AMERICA NUTS MARKET, BY NATURE
8.1 OVERVIEW
8.2 CONVENTIONAL
8.3 ORGANIC
9 NORTH AMERICA NUTS MARKET, BY PROCESSING METHOD
9.1 OVERVIEW
9.2 RAW
9.3 ROASTED
9.3.1 ROASTED, BY TYPE
9.3.1.1 DRY ROASTED
9.3.1.2 OIL ROASTED
9.4 SALTED
9.5 BLANCHED
9.6 FLAVORED
9.6.1 FLAVORED, BY TYPE
9.6.1.1 Sweetened
9.6.1.2 Spiced
9.6.1.3 Chocolate-Coated
9.6.1.4 Herb-Infused
9.6.1.5 Yogurt-Coated
9.6.1.6 Others
9.7 UNSALTED
9.8 GLAZED
9.9 CANDIED
9.1 CARAMELIZED
9.11 SMOKED
9.12 SPROUTED
9.13 FERMENTED
9.14 FREEZE-DRIED
9.15 PICKLED
9.16 VACUUM-FRIED
9.17 DEHYDRATED
9.18 OTHERS
10 NORTH AMERICA NUTS MARKET, BY GRADE
10.1 OVERVIEW
10.2 A GRADE (PREMIUM EXPORT QUALITY)
10.3 B GRADE (MID-QUALITY DOMESTIC USE)
10.4 BROKEN GRADE (BAKERY & CONFECTIONERY USE)
10.5 OIL-GRADE
10.6 INDUSTRIAL GRADE
10.7 REJECTED GRADE (ANIMAL FEED)
11 NORTH AMERICA NUTS MARKET, BY SHELF LIFE
11.1 OVERVIEW
11.2 <6 MONTHS
11.3 6–12 MONTHS
11.4 13–18 MONTHS
11.5 18 MONTHS
11.6 MORE THAN 18 MONTHS
12 NORTH AMERICA NUTS MARKET, BY CERTIFICATION
12.1 OVERVIEW
12.2 ISO 22000/HACCP
12.3 USDA ORGANIC
12.4 EU ORGANIC
12.5 NON-GMO VERIFIED
12.6 GLUTEN-FREE CERTIFIED
12.7 KOSHER
12.8 HALAL
12.9 VEGAN CERTIFIED
12.1 FAIR TRADE
12.11 RAINFOREST ALLIANCE
12.12 CARBON NEUTRAL CERTIFIED
12.13 OTHERS
13 NORTH AMERICA NUTS MARKET, PACKAGING
13.1 OVERVIEW
13.2 PLASTIC POUCHES
13.2.1 PLASTIC POUCHES, BY TYPE
13.2.1.1 Stand-Up Zipper Packs
13.2.1.2 Pillow Packs
13.3 VACUUM-SEALED PACKS
13.4 PET JARS
13.5 PAPER BAGS
13.6 COMPOSITE CANS
13.7 BULK WOVEN SACKS
13.8 GLASS JARS
13.9 SACHETS/SINGLE-SERVE
13.1 GIFT BOXES
13.11 BIO-BASED/COMPOSTABLE
13.12 METAL TINS
13.13 RESEALABLE ECO-TUBS
13.14 FOIL-WRAPPED BARS
13.15 REFILL PACKS
13.16 OTHERS
14 NORTH AMERICA NUTS MARKET, BY PACKAGING SIZE
14.1 OVERVIEW
14.2 101G–250G
14.3 251G–500G
14.4 51G–100G
14.5 25G–50G
14.6 501G–1KG
14.7 1.1KG–2.5KG
14.8 2.6KG–5KG
14.9 5.1KG–10KG
14.1 10.1KG–25KG
14.11 25.1KG–50KG
14.12 50KG
14.13 <25G
15 NORTH AMERICA NUTS MARKET, BY PRICE RANGE
15.1 OVERVIEW
15.2 ECONOMY/BUDGET (USD 1.00-6.00 PER KG)
15.3 MID-RANGE (USD 6.01-12.00 PER KG)
15.4 PREMIUM (USD 12.01-20.00 PER KG)
15.5 SUPER-PREMIUM/GOURMET (ABOVE USD 20.00 PER KG)
16 NORTH AMERICA NUTS MARKET, BY END-USE
16.1 OVERVIEW
16.2 DIRECT CONSUMPTION
16.3 SNACKS
16.4 NUT BUTTERS & SPREADS
16.5 BAKERY INDUSTRY
16.6 CONFECTIONERY INDUSTRY
16.7 CEREAL & GRANOLA MANUFACTURING
16.8 FUNCTIONAL NUTRITION
16.8.1 FUNCTIONAL NUTRITION, BY TYPE
16.8.1.1 Protein Bars
16.8.1.2 Meal Replacements
16.8.1.3 Supplements
16.8.1.4 Others
16.9 DAIRY ALTERNATIVES
16.1 BEVERAGE INDUSTRY
16.10.1 BEVERAGE INDUSTRY, BY TYPE
16.10.1.1 Nut Milk
16.10.1.2 Nut-Based Protein Drinks
16.10.1.3 Fermented Nut Beverages
16.10.1.4 Others
16.11 PLANT-BASED MEATS
16.12 CULINARY
16.12.1 CULINARY, BY TYPE
16.12.1.1 Garnishing
16.12.1.2 Sauces
16.12.1.3 Condiments
16.12.1.4 Others
16.13 INDUSTRIAL OIL EXTRACTION
16.14 FLOUR & GLUTEN-FREE BAKING
16.15 PERSONAL CARE PRODUCTS
16.15.1 PERSONAL CARE PRODUCTS, BY TYPE
16.15.1.1 Skin Care
16.15.1.2 Hair Oil
16.15.1.3 Exfoliants
16.15.1.4 Others
16.16 BIO-BASED & AGRO-INDUSTRIAL USES
16.16.1 BIO-BASED & AGRO-INDUSTRIAL USES, BY TYPE
16.16.1.1 Activated Carbon
16.16.1.2 Abrasives
16.16.1.3 Biofuel Additives
16.16.1.4 Others
16.17 PET FOOD ADDITIVES
16.18 ANIMAL FEED
16.18.1 ANIMAL FEED, BY TYPE
16.18.1.1 Meal Residue
16.18.1.2 Shells
16.18.1.3 Others
16.19 OTHERS
17 NORTH AMERICA NUTS MARKET, BY DISTRIBUTION CHANNEL
17.1 OVERVIEW
17.2 B2B
17.3 B2C
17.3.1 B2C, BY TYPE
17.3.1.1 Offline
17.3.1.1.1 Supermarkets/Hypermarkets
17.3.1.1.2 Convenience Stores
17.3.1.1.3 Health Food Stores
17.3.1.1.4 Bakeries
17.3.1.1.5 Specialty Stores
17.3.1.1.6 HoReCa
17.3.1.1.7 Duty-Free Stores
17.3.1.1.8 Airlines
17.3.1.1.9 Others
17.3.1.2 Online
17.3.1.2.1 E-Commerce Marketplaces
17.3.1.2.2 Brand-Owned Websites
18 NORTH AMERICA NUTS MARKET, BY REGION
18.1 NORTH AMERICA
18.1.1 U.S.
18.1.2 CANADA
18.1.3 MEXICO
19 NORTH AMERICA NUTS MARKET COMPANY LANDSCAPE
19.1 COMPANY SHARE ANALYSIS: GLOBAL
20 SWOT ANALYSIS
21 COMPANY PROFILES
21.1 ADM
21.1.1 COMPANY SNAPSHOT
21.1.2 REVENUE ANALYSIS
21.1.3 COMPANY SHARE ANALYSIS
21.1.4 PRODUCT PORTFOLIO
21.1.5 RECENT DEVELOPMENT
21.2 OLAM GROUP
21.2.1 COMPANY SNAPSHOT
21.2.2 REVENUE ANALYSIS
21.2.3 COMPANY SHARE ANALYSIS
21.2.4 PRODUCT PORTFOLIO
21.2.5 RECENT DEVELOPMENT
21.3 BARRY CALLEBAUT
21.3.1 COMPANY SNAPSHOT
21.3.2 REVENUE ANALYSIS
21.3.3 COMPANY SHARE ANALYSIS
21.3.4 PRODUCT PORTFOLIO
21.3.5 RECENT DEVELOPMENT
21.4 BLUE DIAMOND GROWERS.
21.4.1 COMPANY SNAPSHOT
21.4.2 COMPANY SHARE ANALYSIS
21.4.3 PRODUCT PORTFOLIO
21.4.4 RECENT DEVELOPMENTS/NEWS
21.5 JOHN B. SANFILIPPO & SON, INC.
21.5.1 COMPANY SNAPSHOT
21.5.2 REVENUE ANALYSIS
21.5.3 COMPANY SHARE ANALYSIS
21.5.4 PRODUCT PORTFOLIO
21.5.5 RECENT DEVELOPMENTS
21.6 BORGES AGRICULTURAL & INDUSTRIAL NUTS, S.A.
21.6.1 COMPANY SNAPSHOT
21.6.2 REVENUE ANALYSIS
21.6.3 PRODUCT PORTFOLIO
21.6.4 RECENT DEVELOPMENTS/NEWS
21.7 DEL ALBA.
21.7.1 COMPANY SNAPSHOT
21.7.2 PRODUCT PORTFOLIO
21.7.3 RECENT DEVELOPMENT/NEWS
21.8 DIAMOND FOODS
21.8.1 COMPANY SNAPSHOT
21.8.2 PRODUCT PORTFOLIO
21.8.3 RECENT DEVELOPMENTS/NEWS
21.9 GOLDEN PEANUT COMPANY, LLC
21.9.1 COMPANY SNAPSHOT
21.9.2 PRODUCT PORTFOLIO
21.9.3 RECENT DEVELOPMENTS
21.1 GOURMET NUT
21.10.1 COMPANY SNAPSHOT
21.10.2 PRODUCT PORTFOLIO
21.10.3 RECENT DEVELOPMENTS/NEWS
21.11 HINES NUT COMPANY
21.11.1 COMPANY SNAPSHOT
21.11.2 PRODUCT PORTFOLIO
21.12 HORMEL FOODS CORPORATION
21.12.1 COMPANY SNAPSHOT
21.12.2 REVENUE ANALYSIS
21.12.3 PRODUCT PORTFOLIO
21.12.4 RECENT DEVELOPMENTS/NEWS
21.13 INTERSNACK GROUP GMBH & CO. KG
21.13.1 COMPANY SNAPSHOT
21.13.2 PRODUCT PORTFOLIO
21.13.3 RECENT DEVELOPMENTS
21.14 JINDAL COCOA
21.14.1 COMPANY SNAPSHOT
21.14.2 PRODUCT PORTFOLIO
21.14.3 RECENT DEVELOPMENTS
21.15 MARIANI NUT COMPANY
21.15.1 COMPANY SNAPSHOT
21.15.2 PRODUCT PORTFOLIO
21.15.3 RECENT DEVELOPMENTS
21.16 MOUNT FRANKLIN FOODS
21.16.1 COMPANY SNAPSHOT
21.16.2 PRODUCT PORTFOLIO
21.16.3 RECENT DEVELOPMENTS
21.17 NOW FOODS
21.17.1 COMPANY SNAPSHOT
21.17.2 PRODUCT PORTFOLIO
21.17.3 RECENT DEVELOPMENTS/NEWS
21.18 NUTLAND
21.18.1 COMPANY SNAPSHOT
21.18.2 PRODUCT PORTFOLIO
21.18.3 RECENT DEVELOPMENTS
21.19 NUTWORK HANDELSGESELLSCHAFT MBH
21.19.1 COMPANY SNAPSHOT
21.19.2 PRODUCT PORTFOLIO
21.19.3 RECENT DEVELOPMENTS/NEWS
21.2 POINDEXTER NUT COMPANY
21.20.1 COMPANY SNAPSHOT
21.20.2 PRODUCT PORTFOLIO
21.20.3 RECENT DEVELOPMENTS
21.21 ROYAL NUT COMPANY
21.21.1 COMPANY SNAPSHOT
21.21.2 PRODUCT PORTFOLIO
21.21.3 RECENT DEVELOPMENTS
21.22 SAHALE SNACKS
21.22.1 COMPANY SNAPSHOT
21.22.2 PRODUCT PORTFOLIO
21.22.3 RECENT DEVELOPMENTS
21.23 SANTÉ NUTS
21.23.1 COMPANY SNAPSHOT
21.23.2 PRODUCT PORTFOLIO
21.23.3 RECENT DEVELOPMENTS/NEWS
21.24 SELECT HARVESTS LIMITED
21.24.1 COMPANY SNAPSHOT
21.24.2 REVENUE ANALYSIS
21.24.3 PRODUCT PORTFOLIO
21.24.4 RECENT DEVELOPMENTS/NEWS
21.25 SETTON PISTACHIO OF TERRA BELLA, INC.
21.25.1 COMPANY SNAPSHOT
21.25.2 PRODUCT PORTFOLIO
21.25.3 RECENT DEVELOPMENTS
21.26 TERRANUT
21.26.1 COMPANY SNAPSHOT
21.26.2 PRODUCT PORTFOLIO
21.26.3 RECENT DEVELOPMENTS/NEW
21.27 TREEHOUSE CALIFORNIA ALMONDS, LLC
21.27.1 COMPANY SNAPSHOT
21.27.2 PRODUCT PORTFOLIO
21.27.3 RECENT DEVELOPMENT
21.28 THE DAILY NUT CO.
21.28.1 COMPANY SNAPSHOT
21.28.2 PRODUCT PORTFOLIO
21.28.3 RECENT DEVELOPMENTS/NEWS
21.29 WONDERFUL PISTACHIOS LLC
21.29.1 COMPANY SNAPSHOT
21.29.2 PRODUCT PORTFOLIO
21.29.3 RECENT DEVELOPMENTS/NEWS
21.3 WESTERN NUT COMPANY INC.
21.30.1 COMPANY SNAPSHOT
21.30.2 PRODUCT PORTFOLIO
21.30.3 RECENT DEVELOPMENTS/NEWS
22 QUESTIONNAIRE
23 RELATED REPORTS
Liste des tableaux
TABLE 1 REGULATORY FRAMEWORK AND GUIDELINES
TABLE 2 COST FOR KEY EQUIPMENT AND THE OVERALL CASHEW NUTS PROCESSING PLANTS
TABLE 3 RECENT DEVELOPMENTS IN THE NUT, HIGHLIGHTING NEW PRODUCT LAUNCHES, INNOVATIONS, AND TRENDS
TABLE 4 TIMELINES AND MILESTONES IN THE NUTS INDUSTRY
TABLE 5 NUT IMPORT TARIFF RATES IN TOP 5 MARKETS (2024)
TABLE 6 LOCAL PRODUCTION V/S IMPORT RELIANCE
TABLE 7 REGULATORY INCLINATION
TABLE 8 TRADE PARTNERSHIPS BETWEEN THE COUNTRIES
TABLE 9 ALLIANCES ESTABLISHMENTS
TABLE 10 ESTABLISHMENT OF SPECIAL ECONOMIC ZONES (SEZS) AND INDUSTRIAL PARKS
TABLE 11 COMPARATIVE BRAND ANALYSIS
TABLE 12 PRODUCTION
TABLE 13 CONSUMPTION
TABLE 14 CONSUMER BUYING BEHAVIOUR
TABLE 15 EXPORT DATA SETS
TABLE 16 IMPORT DATA SETS
TABLE 17 CONSUMER BUYING BEHAVIOUR
TABLE 18 NORTH AMERICA NUTS MARKET, BY PRODUCT TYPE, 2018-2032 (USD THOUSAND)
TABLE 19 NORTH AMERICA NUTS MARKET, BY PRODUCT TYPE, 2018-2032 (THOUSAND TONS)
TABLE 20 NORTH AMERICA TREE NUTS IN NUTS MARKET, BY REGION, 2018-2032 (USD THOUSAND)
TABLE 21 NORTH AMERICA TREE NUTS IN NUTS MARKET, BY TYPE, 2018-2032 (USD THOUSAND)
TABLE 22 NORTH AMERICA GROUND NUTS IN NUTS MARKET, BY REGION, 2018-2032 (USD THOUSAND)
TABLE 23 NORTH AMERICA GROUND NUTS IN NUTS MARKET, BY TYPE, 2018-2032 (USD THOUSAND)
TABLE 24 NORTH AMERICA HYBRID/OTHER NUTS IN NUTS MARKET, BY REGION, 2018-2032 (USD THOUSAND)
TABLE 25 NORTH AMERICA HYBRID/OTHER NUTS IN NUTS MARKET, BY TYPE, 2018-2032 (USD THOUSAND)
TABLE 26 NORTH AMERICA OTHERS IN NUTS MARKET, BY REGION, 2018-2032 (USD THOUSAND)
TABLE 27 NORTH AMERICA NUTS MARKET, BY FORM, 2018-2032 (USD THOUSAND)
TABLE 28 NORTH AMERICA WHOLE IN NUTS MARKET, BY REGION, 2018-2032 (USD THOUSAND)
TABLE 29 NORTH AMERICA BUTTER IN NUTS MARKET, BY REGION, 2018-2032 (USD THOUSAND)
TABLE 30 NORTH AMERICA GROUND IN NUTS MARKET, BY REGION, 2018-2032 (USD THOUSAND)
TABLE 31 NORTH AMERICA HALVES IN NUTS MARKET, BY REGION, 2018-2032 (USD THOUSAND)
TABLE 32 NORTH AMERICA PIECES IN NUTS MARKET, BY REGION, 2018-2032 (USD THOUSAND)
TABLE 33 NORTH AMERICA OIL IN NUTS MARKET, BY REGION, 2018-2032 (USD THOUSAND)
TABLE 34 NORTH AMERICA MILK IN NUTS MARKET, BY REGION, 2018-2032 (USD THOUSAND)
TABLE 35 NORTH AMERICA PASTE IN NUTS MARKET, BY REGION, 2018-2032 (USD THOUSAND)
TABLE 36 NORTH AMERICA CREAM IN NUTS MARKET, BY REGION, 2018-2032 (USD THOUSAND)
TABLE 37 NORTH AMERICA ROASTED PIECES IN NUTS MARKET, BY REGION, 2018-2032 (USD THOUSAND)
TABLE 38 NORTH AMERICA COATED IN NUTS MARKET, BY REGION, 2018-2032 (USD THOUSAND)
TABLE 39 NORTH AMERICA FLOUR IN NUTS MARKET, BY REGION, 2018-2032 (USD THOUSAND)
TABLE 40 NORTH AMERICA POWDER IN NUTS MARKET, BY REGION, 2018-2032 (USD THOUSAND)
TABLE 41 NORTH AMERICA CHOPPED IN NUTS MARKET, BY REGION, 2018-2032 (USD THOUSAND)
TABLE 42 NORTH AMERICA SLICED IN NUTS MARKET, BY REGION, 2018-2032 (USD THOUSAND)
TABLE 43 NORTH AMERICA DICED IN NUTS MARKET, BY REGION, 2018-2032 (USD THOUSAND)
TABLE 44 NORTH AMERICA CRUSHED IN NUTS MARKET, BY REGION, 2018-2032 (USD THOUSAND)
TABLE 45 NORTH AMERICA BLANCHED WHOLE IN NUTS MARKET, BY REGION, 2018-2032 (USD THOUSAND)
TABLE 46 NORTH AMERICA FROZEN IN NUTS MARKET, BY REGION, 2018-2032 (USD THOUSAND)
TABLE 47 NORTH AMERICA SPRAY-DRIED IN NUTS MARKET, BY REGION, 2018-2032 (USD THOUSAND)
TABLE 48 NORTH AMERICA ENCAPSULATED IN NUTS MARKET, BY REGION, 2018-2032 (USD THOUSAND)
TABLE 49 NORTH AMERICA OTHERS IN NUTS MARKET, BY REGION, 2018-2032 (USD THOUSAND)
TABLE 50 NORTH AMERICA NUTS MARKET, BY NATURE, 2018-2032 (USD THOUSAND)
TABLE 51 NORTH AMERICA CONVENTIONAL IN NUTS MARKET, BY REGION, 2018-2032 (USD THOUSAND)
TABLE 52 NORTH AMERICA ORGANIC IN NUTS MARKET, BY REGION, 2018-2032 (USD THOUSAND)
TABLE 53 NORTH AMERICA NUTS MARKET, BY PROCESSING METHOD, 2018-2032 (USD THOUSAND)
TABLE 54 NORTH AMERICA RAW IN NUTS MARKET, BY REGION, 2018-2032 (USD THOUSAND)
TABLE 55 NORTH AMERICA ROASTED IN NUTS MARKET, BY REGION, 2018-2032 (USD THOUSAND)
TABLE 56 NORTH AMERICA ROASTED IN NUTS MARKET, BY TYPE, 2018-2032 (USD THOUSAND)
TABLE 57 NORTH AMERICA SALTED IN NUTS MARKET, BY REGION, 2018-2032 (USD THOUSAND)
TABLE 58 NORTH AMERICA BLANCHED IN NUTS MARKET, BY REGION, 2018-2032 (USD THOUSAND)
TABLE 59 NORTH AMERICA FLAVORED IN NUTS MARKET, BY REGION, 2018-2032 (USD THOUSAND)
TABLE 60 NORTH AMERICA FLAVORED IN NUTS MARKET, BY TYPE, 2018-2032 (USD THOUSAND)
TABLE 61 NORTH AMERICA UNSALTED IN NUTS MARKET, BY REGION, 2018-2032 (USD THOUSAND)
TABLE 62 NORTH AMERICA GLAZED IN NUTS MARKET, BY REGION, 2018-2032 (USD THOUSAND)
TABLE 63 NORTH AMERICA CANDIED IN NUTS MARKET, BY REGION, 2018-2032 (USD THOUSAND)
TABLE 64 NORTH AMERICA CARAMELIZED IN NUTS MARKET, BY REGION, 2018-2032 (USD THOUSAND)
TABLE 65 NORTH AMERICA SMOKED IN NUTS MARKET, BY REGION, 2018-2032 (USD THOUSAND)
TABLE 66 NORTH AMERICA SPROUTED IN NUTS MARKET, BY REGION, 2018-2032 (USD THOUSAND)
TABLE 67 NORTH AMERICA FERMENTED IN NUTS MARKET, BY REGION, 2018-2032 (USD THOUSAND)
TABLE 68 NORTH AMERICA FREEZE-DRIED IN NUTS MARKET, BY REGION, 2018-2032 (USD THOUSAND)
TABLE 69 NORTH AMERICA PICKLED IN NUTS MARKET, BY REGION, 2018-2032 (USD THOUSAND)
TABLE 70 NORTH AMERICA VACUUM-FRIED IN NUTS MARKET, BY REGION, 2018-2032 (USD THOUSAND)
TABLE 71 NORTH AMERICA DEHYDRATED IN NUTS MARKET, BY REGION, 2018-2032 (USD THOUSAND)
TABLE 72 NORTH AMERICA OTHERS IN NUTS MARKET, BY REGION, 2018-2032 (USD THOUSAND)
TABLE 73 NORTH AMERICA NUTS MARKET, BY GRADE, 2018-2032 (USD THOUSAND)
TABLE 74 NORTH AMERICA A GRADE (PREMIUM EXPORT QUALITY) IN NUTS MARKET, BY REGION, 2018-2032 (USD THOUSAND)
TABLE 75 NORTH AMERICA B GRADE (MID-QUALITY DOMESTIC USE) IN NUTS MARKET, BY REGION, 2018-2032 (USD THOUSAND)
TABLE 76 NORTH AMERICA BROKEN GRADE (BAKERY & CONFECTIONERY USE) IN NUTS MARKET, BY REGION, 2018-2032 (USD THOUSAND)
TABLE 77 NORTH AMERICA OIL-GRADE IN NUTS MARKET, BY REGION, 2018-2032 (USD THOUSAND)
TABLE 78 NORTH AMERICA INDUSTRIAL GRADE IN NUTS MARKET, BY REGION, 2018-2032 (USD THOUSAND)
TABLE 79 NORTH AMERICA REJECTED GRADE (ANIMAL FEED) IN NUTS MARKET, BY REGION, 2018-2032 (USD THOUSAND)
TABLE 80 NORTH AMERICA NUTS MARKET, BY SHELF LIFE, 2018-2032 (USD THOUSAND)
TABLE 81 NORTH AMERICA <6 MONTHS IN NUTS MARKET, BY REGION, 2018-2032 (USD THOUSAND)
TABLE 82 NORTH AMERICA 6–12 MONTHS IN NUTS MARKET, BY REGION, 2018-2032 (USD THOUSAND)
TABLE 83 NORTH AMERICA I13–18 MONTHS N NUTS MARKET, BY REGION, 2018-2032 (USD THOUSAND)
TABLE 84 NORTH AMERICA 18 MONTHS IN NUTS MARKET, BY REGION, 2018-2032 (USD THOUSAND)
TABLE 85 NORTH AMERICA MORE THAN 18 MONTHS IN NUTS MARKET, BY REGION, 2018-2032 (USD THOUSAND)
TABLE 86 NORTH AMERICA NUTS MARKET, BY CERTIFICATION, 2018-2032 (USD THOUSAND)
TABLE 87 NORTH AMERICA ISO 22000/HACCP IN NUTS MARKET, BY REGION, 2018-2032 (USD THOUSAND)
TABLE 88 NORTH AMERICA USDA ORGANIC IN NUTS MARKET, BY REGION, 2018-2032 (USD THOUSAND)
TABLE 89 NORTH AMERICA EU ORGANIC IN NUTS MARKET, BY REGION, 2018-2032 (USD THOUSAND)
TABLE 90 NORTH AMERICA NON-GMO VERIFIED IN NUTS MARKET, BY REGION, 2018-2032 (USD THOUSAND)
TABLE 91 NORTH AMERICA GLUTEN-FREE CERTIFIED IN NUTS MARKET, BY REGION, 2018-2032 (USD THOUSAND)
TABLE 92 NORTH AMERICA KOSHER IN NUTS MARKET, BY REGION, 2018-2032 (USD THOUSAND)
TABLE 93 NORTH AMERICA HALAL IN NUTS MARKET, BY REGION, 2018-2032 (USD THOUSAND)
TABLE 94 NORTH AMERICA VEGAN CERTIFIED IN NUTS MARKET, BY REGION, 2018-2032 (USD THOUSAND)
TABLE 95 NORTH AMERICA FAIR TRADE IN NUTS MARKET, BY REGION, 2018-2032 (USD THOUSAND)
TABLE 96 NORTH AMERICA RAINFOREST ALLIANCE IN NUTS MARKET, BY REGION, 2018-2032 (USD THOUSAND)
TABLE 97 NORTH AMERICA CARBON NEUTRAL CERTIFIED IN NUTS MARKET, BY REGION, 2018-2032 (USD THOUSAND)
TABLE 98 NORTH AMERICA OTHERS IN NUTS MARKET, BY REGION, 2018-2032 (USD THOUSAND)
TABLE 99 NORTH AMERICA NUTS MARKET, BY PACKAGING, 2018-2032 (USD THOUSAND)
TABLE 100 NORTH AMERICA PLASTIC POUCHES IN NUTS MARKET, BY REGION, 2018-2032 (USD THOUSAND)
TABLE 101 TABLE 14 NORTH AMERICA PLASTIC POUCHES IN NUTS MARKET, BY TYPE, 2018-2032 (USD THOUSAND)
TABLE 102 NORTH AMERICA VACUUM-SEALED PACKS IN NUTS MARKET, BY REGION, 2018-2032 (USD THOUSAND)
TABLE 103 NORTH AMERICA PET JARS IN NUTS MARKET, BY REGION, 2018-2032 (USD THOUSAND)
TABLE 104 NORTH AMERICA PAPER BAGS IN NUTS MARKET, BY REGION, 2018-2032 (USD THOUSAND)
TABLE 105 NORTH AMERICA COMPOSITE CANS IN NUTS MARKET, BY REGION, 2018-2032 (USD THOUSAND)
TABLE 106 NORTH AMERICA BULK WOVEN SACKS IN NUTS MARKET, BY REGION, 2018-2032 (USD THOUSAND)
TABLE 107 NORTH AMERICA GLASS JARS IN NUTS MARKET, BY REGION, 2018-2032 (USD THOUSAND)
TABLE 108 NORTH AMERICA SACHETS/SINGLE-SERVE IN NUTS MARKET, BY REGION, 2018-2032 (USD THOUSAND)
TABLE 109 NORTH AMERICA GIFT BOXES IN NUTS MARKET, BY REGION, 2018-2032 (USD THOUSAND)
TABLE 110 NORTH AMERICA BIO-BASED/COMPOSTABLE IN NUTS MARKET, BY REGION, 2018-2032 (USD THOUSAND)
TABLE 111 NORTH AMERICA METAL TINS IN NUTS MARKET, BY REGION, 2018-2032 (USD THOUSAND)
TABLE 112 NORTH AMERICA RESEALABLE ECO-TUBS IN NUTS MARKET, BY REGION, 2018-2032 (USD THOUSAND)
TABLE 113 NORTH AMERICA FOIL-WRAPPED BARS IN NUTS MARKET, BY REGION, 2018-2032 (USD THOUSAND)
TABLE 114 NORTH AMERICA REFILL PACKS IN NUTS MARKET, BY REGION, 2018-2032 (USD THOUSAND)
TABLE 115 NORTH AMERICA OTHERS IN NUTS MARKET, BY REGION, 2018-2032 (USD THOUSAND)
TABLE 116 NORTH AMERICA NUTS MARKET, BY PACKAGING SIZE, 2018-2032 (USD THOUSAND)
TABLE 117 NORTH AMERICA 101G–250G IN NUTS MARKET, BY REGION, 2018-2032 (USD THOUSAND)
TABLE 118 NORTH AMERICA 251G–500G IN NUTS MARKET, BY REGION, 2018-2032 (USD THOUSAND)
TABLE 119 NORTH AMERICA 51G–100G IN NUTS MARKET, BY REGION, 2018-2032 (USD THOUSAND)
TABLE 120 NORTH AMERICA 25G–50G IN NUTS MARKET, BY REGION, 2018-2032 (USD THOUSAND)
TABLE 121 NORTH AMERICA 501G–1KG IN NUTS MARKET, BY REGION, 2018-2032 (USD THOUSAND)
TABLE 122 NORTH AMERICA 1.1KG–2.5KG IN NUTS MARKET, BY REGION, 2018-2032 (USD THOUSAND)
TABLE 123 NORTH AMERICA 2.6KG–5KG IN NUTS MARKET, BY REGION, 2018-2032 (USD THOUSAND)
TABLE 124 NORTH AMERICA 5.1KG–10KG IN NUTS MARKET, BY REGION, 2018-2032 (USD THOUSAND)
TABLE 125 NORTH AMERICA 10.1KG–25KG IN NUTS MARKET, BY REGION, 2018-2032 (USD THOUSAND)
TABLE 126 NORTH AMERICA 25.1KG–50KG IN NUTS MARKET, BY REGION, 2018-2032 (USD THOUSAND)
TABLE 127 NORTH AMERICA 50KG IN NUTS MARKET, BY REGION, 2018-2032 (USD THOUSAND)
TABLE 128 NORTH AMERICA <25G IN NUTS MARKET, BY REGION, 2018-2032 (USD THOUSAND)
TABLE 129 NORTH AMERICA NUTS MARKET, BY PRICE RANGE, 2018-2032 (USD THOUSAND)
TABLE 130 NORTH AMERICA ECONOMY/BUDGET (USD 1.00-6.00 PER KG) IN NUTS MARKET, BY REGION, 2018-2032 (USD THOUSAND)
TABLE 131 NORTH AMERICA MID-RANGE (USD 6.01-12.00 PER KG) IN NUTS MARKET, BY REGION, 2018-2032 (USD THOUSAND)
TABLE 132 NORTH AMERICA PREMIUM (USD 12.01-20.00 PER KG) IN NUTS MARKET, BY REGION, 2018-2032 (USD THOUSAND)
TABLE 133 NORTH AMERICA SUPER-PREMIUM/GOURMET (ABOVE USD 20.00 PER KG) IN NUTS MARKET, BY REGION, 2018-2032 (USD THOUSAND)
TABLE 134 NORTH AMERICA NUTS MARKET, BY END-USE, 2018-2032 (USD THOUSAND)
TABLE 135 NORTH AMERICA DIRECT CONSUMPTION IN NUTS MARKET, BY REGION, 2018-2032 (USD THOUSAND)
TABLE 136 NORTH AMERICA SNACKS IN NUTS MARKET, BY REGION, 2018-2032 (USD THOUSAND)
TABLE 137 NORTH AMERICA NUT BUTTERS & SPREADS IN NUTS MARKET, BY REGION, 2018-2032 (USD THOUSAND)
TABLE 138 NORTH AMERICA BAKERY INDUSTRY IN NUTS MARKET, BY REGION, 2018-2032 (USD THOUSAND)
TABLE 139 NORTH AMERICA CONFECTIONERY INDUSTRY IN NUTS MARKET, BY REGION, 2018-2032 (USD THOUSAND)
TABLE 140 NORTH AMERICA CEREAL & GRANOLA MANUFACTURING IN NUTS MARKET, BY REGION, 2018-2032 (USD THOUSAND)
TABLE 141 NORTH AMERICA FUNCTIONAL NUTRITION IN NUTS MARKET, BY REGION, 2018-2032 (USD THOUSAND)
TABLE 142 NORTH AMERICA FUNCTIONAL NUTRITION IN NUTS MARKET, BY TYPE, 2018-2032 (USD THOUSAND)
TABLE 143 NORTH AMERICA DAIRY ALTERNATIVES IN NUTS MARKET, BY REGION, 2018-2032 (USD THOUSAND)
TABLE 144 NORTH AMERICA BEVERAGE INDUSTRY IN NUTS MARKET, BY REGION, 2018-2032 (USD THOUSAND)
TABLE 145 NORTH AMERICA BEVERAGE INDUSTRY IN NUTS MARKET, BY TYPE, 2018-2032 (USD THOUSAND)
TABLE 146 NORTH AMERICA PLANT-BASED MEATS IN NUTS MARKET, BY REGION, 2018-2032 (USD THOUSAND)
TABLE 147 NORTH AMERICA CULINARY IN NUTS MARKET, BY REGION, 2018-2032 (USD THOUSAND)
TABLE 148 NORTH AMERICA CULINARY IN NUTS MARKET, BY TYPE, 2018-2032 (USD THOUSAND)
TABLE 149 NORTH AMERICA INDUSTRIAL OIL EXTRACTION IN NUTS MARKET, BY REGION, 2018-2032 (USD THOUSAND)
TABLE 150 NORTH AMERICA FLOUR & GLUTEN-FREE BAKING IN NUTS MARKET, BY REGION, 2018-2032 (USD THOUSAND)
TABLE 151 NORTH AMERICA PERSONAL CARE PRODUCTS IN NUTS MARKET, BY REGION, 2018-2032 (USD THOUSAND)
TABLE 152 NORTH AMERICA PERSONAL CARE PRODUCTS IN NUTS MARKET, BY TYPE, 2018-2032 (USD THOUSAND)
TABLE 153 NORTH AMERICA BIO-BASED & AGRO-INDUSTRIAL USES IN NUTS MARKET, BY REGION, 2018-2032 (USD THOUSAND)
TABLE 154 NORTH AMERICA BIO-BASED & AGRO-INDUSTRIAL USES IN NUTS MARKET, BY TYPE, 2018-2032 (USD THOUSAND)
TABLE 155 NORTH AMERICA PET FOOD ADDITIVES IN NUTS MARKET, BY REGION, 2018-2032 (USD THOUSAND)
TABLE 156 NORTH AMERICA ANIMAL FEED IN NUTS MARKET, BY REGION, 2018-2032 (USD THOUSAND)
TABLE 157 NORTH AMERICA ANIMAL FEED IN NUTS MARKET, BY TYPE, 2018-2032 (USD THOUSAND)
TABLE 158 NORTH AMERICA OTHERS IN NUTS MARKET, BY REGION, 2018-2032 (USD THOUSAND)
TABLE 159 NORTH AMERICA NUTS MARKET, BY DISTRIBUTION CHANNEL, 2018-2032 (USD THOUSAND)
TABLE 160 NORTH AMERICA B2B IN NUTS MARKET, BY REGION, 2018-2032 (USD THOUSAND)
TABLE 161 NORTH AMERICA B2C IN NUTS MARKET, BY REGION, 2018-2032 (USD THOUSAND)
TABLE 162 NORTH AMERICA B2C IN NUTS MARKET, BY TYPE, 2018-2032 (USD THOUSAND)
TABLE 163 NORTH AMERICA OFFLINE IN NUTS MARKET, BY TYPE, 2018-2032 (USD THOUSAND)
TABLE 164 NORTH AMERICA ONLINE IN NUTS MARKET, BY TYPE, 2018-2032 (USD THOUSAND)
TABLE 165 NORTH AMERICA NUTS MARKET, BY COUNTRY, 2018-2032 (USD THOUSAND)
TABLE 166 NORTH AMERICA NUTS MARKET, BY PRODUCT TYPE, 2018-2032 (USD THOUSAND)
TABLE 167 NORTH AMERICA NUTS MARKET, BY PRODUCT TYPE, 2018-2032 (THOUSAND TONS)
TABLE 168 NORTH AMERICA TREE NUTS IN NUTS MARKET, BY TYPE, 2018-2032 (USD THOUSAND)
TABLE 169 NORTH AMERICA GROUND NUTS IN NUTS MARKET, BY PEANUTS, 2018-2032 (USD THOUSAND)
TABLE 170 NORTH AMERICA HYBRID/OTHER NUTS IN NUTS MARKET, BY TYPE, 2018-2032 (USD THOUSAND)
TABLE 171 NORTH AMERICA NUTS MARKET, BY FORM, 2018-2032 (USD THOUSAND)
TABLE 172 NORTH AMERICA NUTS MARKET, BY NATURE, 2018-2032 (USD THOUSAND)
TABLE 173 NORTH AMERICA NUTS MARKET, BY PROCESSING METHOD, 2018-2032 (USD THOUSAND)
TABLE 174 NORTH AMERICA ROASTED IN NUTS MARKET, BY TYPE, 2018-2032 (USD THOUSAND)
TABLE 175 NORTH AMERICA FLAVORED IN NUTS MARKET, BY TYPE, 2018-2032 (USD THOUSAND)
TABLE 176 NORTH AMERICA NUTS MARKET, BY GRADE, 2018-2032 (USD THOUSAND)
TABLE 177 NORTH AMERICA NUTS MARKET, BY SHELF LIFE, 2018-2032 (USD THOUSAND)
TABLE 178 NORTH AMERICA NUTS MARKET, BY CERTIFICATION, 2018-2032 (USD THOUSAND)
TABLE 179 NORTH AMERICA NUTS MARKET, BY PACKAGING, 2018-2032 (USD THOUSAND)
TABLE 180 NORTH AMERICA PLASTIC POUCHES IN NUTS MARKET, BY TYPE, 2018-2032 (USD THOUSAND)
TABLE 181 NORTH AMERICA NUTS MARKET, BY PACKAGING SIZE, 2018-2032 (USD THOUSAND)
TABLE 182 NORTH AMERICA NUTS MARKET, BY PRICE RANGE, 2018-2032 (USD THOUSAND)
TABLE 183 NORTH AMERICA NUTS MARKET, BY END-USE, 2018-2032 (USD THOUSAND)
TABLE 184 NORTH AMERICA FUNCTIONAL NUTRITION IN NUTS MARKET, BY TYPE, 2018-2032 (USD THOUSAND)
TABLE 185 NORTH AMERICA BEVERAGE INDUSTRY IN NUTS MARKET, BY TYPE, 2018-2032 (USD THOUSAND)
TABLE 186 NORTH AMERICA CULINARY IN NUTS MARKET, BY TYPE, 2018-2032 (USD THOUSAND)
TABLE 187 NORTH AMERICA PERSONAL CARE PRODUCTS IN NUTS MARKET, BY TYPE, 2018-2032 (USD THOUSAND)
TABLE 188 NORTH AMERICA BIO-BASED & AGRO-INDUSTRIAL USES IN NUTS MARKET, BY TYPE, 2018-2032 (USD THOUSAND)
TABLE 189 NORTH AMERICA ANIMAL FEED IN NUTS MARKET, BY TYPE, 2018-2032 (USD THOUSAND)
TABLE 190 NORTH AMERICA NUTS MARKET, BY DISTRIBUTION CHANNEL, 2018-2032 (USD THOUSAND)
TABLE 191 NORTH AMERICA B2C IN NUTS MARKET, BY TYPE, 2018-2032 (USD THOUSAND)
TABLE 192 NORTH AMERICA OFFLINE IN NUTS MARKET, BY TYPE, 2018-2032 (USD THOUSAND)
TABLE 193 NORTH AMERICA ONLINE IN NUTS MARKET, BY TYPE, 2018-2032 (USD THOUSAND)
TABLE 194 U.S. NUTS MARKET, BY PRODUCT TYPE, 2018-2032 (USD THOUSAND)
TABLE 195 U.S. NUTS MARKET, BY PRODUCT TYPE, 2018-2032 (THOUSAND TONS)
TABLE 196 U.S. TREE NUTS IN NUTS MARKET, BY TYPE, 2018-2032 (USD THOUSAND)
TABLE 197 U.S. GROUND NUTS IN NUTS MARKET, BY PEANUTS, 2018-2032 (USD THOUSAND)
TABLE 198 U.S. HYBRID/OTHER NUTS IN NUTS MARKET, BY TYPE, 2018-2032 (USD THOUSAND)
TABLE 199 U.S. NUTS MARKET, BY FORM, 2018-2032 (USD THOUSAND)
TABLE 200 U.S. NUTS MARKET, BY NATURE, 2018-2032 (USD THOUSAND)
TABLE 201 U.S. NUTS MARKET, BY PROCESSING METHOD, 2018-2032 (USD THOUSAND)
TABLE 202 U.S. ROASTED IN NUTS MARKET, BY TYPE, 2018-2032 (USD THOUSAND)
TABLE 203 U.S. FLAVORED IN NUTS MARKET, BY TYPE, 2018-2032 (USD THOUSAND)
TABLE 204 U.S. NUTS MARKET, BY GRADE, 2018-2032 (USD THOUSAND)
TABLE 205 U.S. NUTS MARKET, BY SHELF LIFE, 2018-2032 (USD THOUSAND)
TABLE 206 U.S. NUTS MARKET, BY CERTIFICATION, 2018-2032 (USD THOUSAND)
TABLE 207 U.S. NUTS MARKET, BY PACKAGING, 2018-2032 (USD THOUSAND)
TABLE 208 U.S. PLASTIC POUCHES IN NUTS MARKET, BY TYPE, 2018-2032 (USD THOUSAND)
TABLE 209 U.S. NUTS MARKET, BY PACKAGING SIZE, 2018-2032 (USD THOUSAND)
TABLE 210 U.S. NUTS MARKET, BY PRICE RANGE, 2018-2032 (USD THOUSAND)
TABLE 211 U.S. NUTS MARKET, BY END-USE, 2018-2032 (USD THOUSAND)
TABLE 212 U.S. FUNCTIONAL NUTRITION IN NUTS MARKET, BY TYPE, 2018-2032 (USD THOUSAND)
TABLE 213 U.S. BEVERAGE INDUSTRY IN NUTS MARKET, BY TYPE, 2018-2032 (USD THOUSAND)
TABLE 214 U.S. CULINARY IN NUTS MARKET, BY TYPE, 2018-2032 (USD THOUSAND)
TABLE 215 U.S. PERSONAL CARE PRODUCTS IN NUTS MARKET, BY TYPE, 2018-2032 (USD THOUSAND)
TABLE 216 U.S. BIO-BASED & AGRO-INDUSTRIAL USES IN NUTS MARKET, BY TYPE, 2018-2032 (USD THOUSAND)
TABLE 217 U.S. ANIMAL FEED IN NUTS MARKET, BY TYPE, 2018-2032 (USD THOUSAND)
TABLE 218 U.S. NUTS MARKET, BY DISTRIBUTION CHANNEL, 2018-2032 (USD THOUSAND)
TABLE 219 U.S. B2C IN NUTS MARKET, BY TYPE, 2018-2032 (USD THOUSAND)
TABLE 220 U.S. OFFLINE IN NUTS MARKET, BY TYPE, 2018-2032 (USD THOUSAND)
TABLE 221 U.S. ONLINE IN NUTS MARKET, BY TYPE, 2018-2032 (USD THOUSAND)
TABLE 222 CANADA NUTS MARKET, BY PRODUCT TYPE, 2018-2032 (USD THOUSAND)
TABLE 223 CANADA NUTS MARKET, BY PRODUCT TYPE, 2018-2032 (THOUSAND TONS)
TABLE 224 CANADA TREE NUTS IN NUTS MARKET, BY TYPE, 2018-2032 (USD THOUSAND)
TABLE 225 CANADA GROUND NUTS IN NUTS MARKET, BY PEANUTS, 2018-2032 (USD THOUSAND)
TABLE 226 CANADA HYBRID/OTHER NUTS IN NUTS MARKET, BY TYPE, 2018-2032 (USD THOUSAND)
TABLE 227 CANADA NUTS MARKET, BY FORM, 2018-2032 (USD THOUSAND)
TABLE 228 CANADA NUTS MARKET, BY NATURE, 2018-2032 (USD THOUSAND)
TABLE 229 CANADA NUTS MARKET, BY PROCESSING METHOD, 2018-2032 (USD THOUSAND)
TABLE 230 CANADA ROASTED IN NUTS MARKET, BY TYPE, 2018-2032 (USD THOUSAND)
TABLE 231 CANADA FLAVORED IN NUTS MARKET, BY TYPE, 2018-2032 (USD THOUSAND)
TABLE 232 CANADA NUTS MARKET, BY GRADE, 2018-2032 (USD THOUSAND)
TABLE 233 CANADA NUTS MARKET, BY SHELF LIFE, 2018-2032 (USD THOUSAND)
TABLE 234 CANADA NUTS MARKET, BY CERTIFICATION, 2018-2032 (USD THOUSAND)
TABLE 235 CANADA NUTS MARKET, BY PACKAGING, 2018-2032 (USD THOUSAND)
TABLE 236 CANADA PLASTIC POUCHES IN NUTS MARKET, BY TYPE, 2018-2032 (USD THOUSAND)
TABLE 237 CANADA NUTS MARKET, BY PACKAGING SIZE, 2018-2032 (USD THOUSAND)
TABLE 238 CANADA NUTS MARKET, BY PRICE RANGE, 2018-2032 (USD THOUSAND)
TABLE 239 CANADA NUTS MARKET, BY END-USE, 2018-2032 (USD THOUSAND)
TABLE 240 CANADA FUNCTIONAL NUTRITION IN NUTS MARKET, BY TYPE, 2018-2032 (USD THOUSAND)
TABLE 241 CANADA BEVERAGE INDUSTRY IN NUTS MARKET, BY TYPE, 2018-2032 (USD THOUSAND)
TABLE 242 CANADA CULINARY IN NUTS MARKET, BY TYPE, 2018-2032 (USD THOUSAND)
TABLE 243 CANADA PERSONAL CARE PRODUCTS IN NUTS MARKET, BY TYPE, 2018-2032 (USD THOUSAND)
TABLE 244 CANADA BIO-BASED & AGRO-INDUSTRIAL USES IN NUTS MARKET, BY TYPE, 2018-2032 (USD THOUSAND)
TABLE 245 CANADA ANIMAL FEED IN NUTS MARKET, BY TYPE, 2018-2032 (USD THOUSAND)
TABLE 246 CANADA NUTS MARKET, BY DISTRIBUTION CHANNEL, 2018-2032 (USD THOUSAND)
TABLE 247 CANADA B2C IN NUTS MARKET, BY TYPE, 2018-2032 (USD THOUSAND)
TABLE 248 CANADA OFFLINE IN NUTS MARKET, BY TYPE, 2018-2032 (USD THOUSAND)
TABLE 249 CANADA ONLINE IN NUTS MARKET, BY TYPE, 2018-2032 (USD THOUSAND)
TABLE 250 MEXICO NUTS MARKET, BY PRODUCT TYPE, 2018-2032 (USD THOUSAND)
TABLE 251 MEXICO NUTS MARKET, BY PRODUCT TYPE, 2018-2032 (THOUSAND TONS)
TABLE 252 MEXICO TREE NUTS IN NUTS MARKET, BY TYPE, 2018-2032 (USD THOUSAND)
TABLE 253 MEXICO GROUND NUTS IN NUTS MARKET, BY PEANUTS, 2018-2032 (USD THOUSAND)
TABLE 254 MEXICO HYBRID/OTHER NUTS IN NUTS MARKET, BY TYPE, 2018-2032 (USD THOUSAND)
TABLE 255 MEXICO NUTS MARKET, BY FORM, 2018-2032 (USD THOUSAND)
TABLE 256 MEXICO NUTS MARKET, BY NATURE, 2018-2032 (USD THOUSAND)
TABLE 257 MEXICO NUTS MARKET, BY PROCESSING METHOD, 2018-2032 (USD THOUSAND)
TABLE 258 MEXICO ROASTED IN NUTS MARKET, BY TYPE, 2018-2032 (USD THOUSAND)
TABLE 259 MEXICO FLAVORED IN NUTS MARKET, BY TYPE, 2018-2032 (USD THOUSAND)
TABLE 260 MEXICO NUTS MARKET, BY GRADE, 2018-2032 (USD THOUSAND)
TABLE 261 MEXICO NUTS MARKET, BY SHELF LIFE, 2018-2032 (USD THOUSAND)
TABLE 262 MEXICO NUTS MARKET, BY CERTIFICATION, 2018-2032 (USD THOUSAND)
TABLE 263 MEXICO NUTS MARKET, BY PACKAGING, 2018-2032 (USD THOUSAND)
TABLE 264 MEXICO PLASTIC POUCHES IN NUTS MARKET, BY TYPE, 2018-2032 (USD THOUSAND)
TABLE 265 MEXICO NUTS MARKET, BY PACKAGING SIZE, 2018-2032 (USD THOUSAND)
TABLE 266 MEXICO NUTS MARKET, BY PRICE RANGE, 2018-2032 (USD THOUSAND)
TABLE 267 MEXICO NUTS MARKET, BY END-USE, 2018-2032 (USD THOUSAND)
TABLE 268 MEXICO FUNCTIONAL NUTRITION IN NUTS MARKET, BY TYPE, 2018-2032 (USD THOUSAND)
TABLE 269 MEXICO BEVERAGE INDUSTRY IN NUTS MARKET, BY TYPE, 2018-2032 (USD THOUSAND)
TABLE 270 MEXICO CULINARY IN NUTS MARKET, BY TYPE, 2018-2032 (USD THOUSAND)
TABLE 271 MEXICO PERSONAL CARE PRODUCTS IN NUTS MARKET, BY TYPE, 2018-2032 (USD THOUSAND)
TABLE 272 MEXICO BIO-BASED & AGRO-INDUSTRIAL USES IN NUTS MARKET, BY TYPE, 2018-2032 (USD THOUSAND)
TABLE 273 MEXICO ANIMAL FEED IN NUTS MARKET, BY TYPE, 2018-2032 (USD THOUSAND)
TABLE 274 MEXICO NUTS MARKET, BY DISTRIBUTION CHANNEL, 2018-2032 (USD THOUSAND)
TABLE 275 MEXICO B2C IN NUTS MARKET, BY TYPE, 2018-2032 (USD THOUSAND)
TABLE 276 MEXICO OFFLINE IN NUTS MARKET, BY TYPE, 2018-2032 (USD THOUSAND)
TABLE 277 MEXICO ONLINE IN NUTS MARKET, BY TYPE, 2018-2032 (USD THOUSAND)
Liste des figures
FIGURE 1 NORTH AMERICA NUTS MARKET
FIGURE 2 NORTH AMERICA NUTS MARKET: DATA TRIANGULATION
FIGURE 3 NORTH AMERICA NUTS MARKET: DROC ANALYSIS
FIGURE 4 NORTH AMERICA NUTS MARKET: NORTH AMERICA VS REGIONAL MARKET ANALYSIS
FIGURE 5 NORTH AMERICA NUTS MARKET: COMPANY RESEARCH ANALYSIS
FIGURE 6 NORTH AMERICA NUTS MARKET: MULTIVARIATE MODELLING
FIGURE 7 NORTH AMERICA NUTS MARKET TIME LINE CURVE
FIGURE 8 NORTH AMERICA NUTS MARKET: INTERVIEW DEMOGRAPHICS
FIGURE 9 NORTH AMERICA NUTS MARKET: DBMR MARKET POSITION GRID
FIGURE 10 NORTH AMERICA NUTS MARKET: MARKET END-USE COVERAGE GRID
FIGURE 11 NORTH AMERICA NUTS MARKET: VENDOR SHARE ANALYSIS
FIGURE 12 NORTH AMERICA NUTS MARKET: SEGMENTATION
FIGURE 13 EXECUTIVE SUMMARY
FIGURE 14 NORTH AMERICA NUTS MARKET STRATEGIC DEVELOPMENT
FIGURE 15 FOUR SEGMENTS COMPRISE THE NORTH AMERICA NUTS MARKET, BY PRODUCT TYPE
FIGURE 16 GROWING NORTH AMERICA TREND TOWARD HEALTHIER SNACKING AND NUTRITIOUS CHOICES IS EXPECTED TO DRIVE THE NORTH AMERICA NUTS MARKET IN THE FORECAST PERIOD
FIGURE 17 TREE NUT SEGMENT IS EXPECTED TO ACCOUNT FOR THE LARGEST SHARE OF THE NORTH AMERICA NUTS MARKET IN 2025 AND 2032
FIGURE 18 NUTS MARKET VALUE CHAIN
FIGURE 19 NUTS MARKET SUPPLY CHAIN ANALAYSIS
FIGURE 20 TOTAL NUMBER OF DEALS
FIGURE 21 DEALS BY TYPE
FIGURE 22 DEALS BY SEGMENT
FIGURE 23 PRODUCTION CAPACITY OUTLOOK
FIGURE 24 PRODUCT AND BRAND OVERVIEW
FIGURE 25 PATENT FAMILIES
FIGURE 26 PATENT FAMILIES
FIGURE 27 COMPANY EVALUATION QUADRANT
FIGURE 28 PRICE TREND ANALYSIS, 2018-2032 (USD/KG)
FIGURE 29 PROJECT THREE NUT EXPORT INDEX (2021-2025)
FIGURE 30 DROC ANALYSIS
FIGURE 31 FREQUENCY OF NUT CONSUMPTION
FIGURE 32 NORTH AMERICA NUTS MARKET: BY PRODUCT TYPE, 2024
FIGURE 33 NORTH AMERICA NUTS MARKET: FORM, 2024
FIGURE 34 NORTH AMERICA NUTS MARKET: BY NATURE, 2024
FIGURE 35 NORTH AMERICA NUTS MARKET: BY PROCESSING METHOD, 2024
FIGURE 36 NORTH AMERICA NUTS MARKET: BY GRADE, 2024
FIGURE 37 NORTH AMERICA NUTS MARKET: BY SHELF LIFE, 2024
FIGURE 38 NORTH AMERICA NUTS MARKET: BY CERTIFICATION, 2024
FIGURE 39 NORTH AMERICA NUTS MARKET: PACKAGING, 2024
FIGURE 40 NORTH AMERICA NUTS MARKET: BY PACKAGING SIZE, 2024
FIGURE 41 NORTH AMERICA NUTS MARKET: BY PRICE RANGE, 2024
FIGURE 42 NORTH AMERICA NUTS MARKET: BY END-USE, 2024
FIGURE 43 NORTH AMERICA NUTS MARKET: BY DISTRIBUTION CHANNEL, 2024
FIGURE 44 NORTH AMERICA NUT MARKET: BY SNAPSHOT
FIGURE 45 NORTH AMERICA NUTS MARKET: COMPANY SHARE 2024 (%)
Méthodologie de recherche
La collecte de données et l'analyse de l'année de base sont effectuées à l'aide de modules de collecte de données avec des échantillons de grande taille. L'étape consiste à obtenir des informations sur le marché ou des données connexes via diverses sources et stratégies. Elle comprend l'examen et la planification à l'avance de toutes les données acquises dans le passé. Elle englobe également l'examen des incohérences d'informations observées dans différentes sources d'informations. Les données de marché sont analysées et estimées à l'aide de modèles statistiques et cohérents de marché. De plus, l'analyse des parts de marché et l'analyse des tendances clés sont les principaux facteurs de succès du rapport de marché. Pour en savoir plus, veuillez demander un appel d'analyste ou déposer votre demande.
La méthodologie de recherche clé utilisée par l'équipe de recherche DBMR est la triangulation des données qui implique l'exploration de données, l'analyse de l'impact des variables de données sur le marché et la validation primaire (expert du secteur). Les modèles de données incluent la grille de positionnement des fournisseurs, l'analyse de la chronologie du marché, l'aperçu et le guide du marché, la grille de positionnement des entreprises, l'analyse des brevets, l'analyse des prix, l'analyse des parts de marché des entreprises, les normes de mesure, l'analyse globale par rapport à l'analyse régionale et des parts des fournisseurs. Pour en savoir plus sur la méthodologie de recherche, envoyez une demande pour parler à nos experts du secteur.
Personnalisation disponible
Data Bridge Market Research est un leader de la recherche formative avancée. Nous sommes fiers de fournir à nos clients existants et nouveaux des données et des analyses qui correspondent à leurs objectifs. Le rapport peut être personnalisé pour inclure une analyse des tendances des prix des marques cibles, une compréhension du marché pour d'autres pays (demandez la liste des pays), des données sur les résultats des essais cliniques, une revue de la littérature, une analyse du marché des produits remis à neuf et de la base de produits. L'analyse du marché des concurrents cibles peut être analysée à partir d'une analyse basée sur la technologie jusqu'à des stratégies de portefeuille de marché. Nous pouvons ajouter autant de concurrents que vous le souhaitez, dans le format et le style de données que vous recherchez. Notre équipe d'analystes peut également vous fournir des données sous forme de fichiers Excel bruts, de tableaux croisés dynamiques (Fact book) ou peut vous aider à créer des présentations à partir des ensembles de données disponibles dans le rapport.

