Asia Pacific Edible Oils Market
Tamanho do mercado em biliões de dólares
CAGR :
% 
 USD
40,292.54 Million
USD
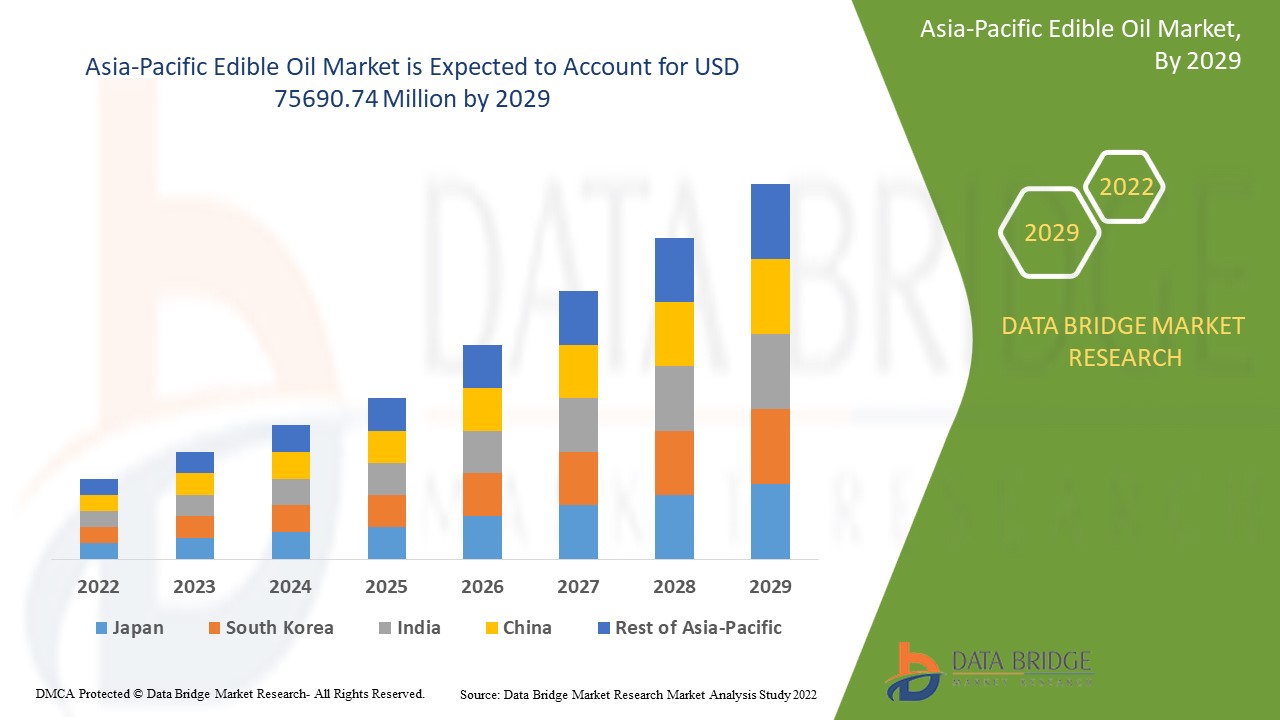
75,690.74 Million
2021
2029
USD
40,292.54 Million
USD
75,690.74 Million
2021
2029
| 2022 –2029 | |
| USD 40,292.54 Million | |
| USD 75,690.74 Million | |
| % | |
Asia-Pacific Edible Oil Market, By Type (Palm Oil, Soybean Oil, Rapeseed Oil, Sunflower Oil, Peanut Oil, Specialty Blended Oil, Olive Oil, Corn Oil, Flaxseed Oil, Avocado Oil, Walnut Oil, Pumpkin Seed Oil, Grapeseed Oil, Others), Package Type (Tinplate Containers, HDPE (High Density Polyethylene) Containers, PVC (Poly Vinyl Chloride) Bottles, PET (Polyethylene Terephthalate) Bottles, Glass Bottles, Semi – Rigid Containers, Flexible Plastic Pouches, Others), Distribution Channel (Direct, Indirect), End User (Domestics, Industrial, Food Service, Others) – Industry Trends and Forecast to 2029
Market Analysis and Size
Edible oil has made a significant place in the food and beverage sector around the world. It is being consumed everyday by millions of people in restaurants, cafeterias, and hotels, among others. Manufacturers are working on developing these oils to offer healthier options to the consumers.
Asia-Pacific Edible Oil Market was valued at USD 40,292.54 million in 2021 and is expected to reach USD 75690.74 million by 2029, registering a CAGR of 8.20% during the forecast period of 2022-2029. Domestics accounts for the largest end user segment owing to the high consumption for household purposes. In addition to the market insights such as market value, growth rate, market segments, geographical coverage, market players, and market scenario, the market report curated by the Data Bridge Market Research team also includes in-depth expert analysis, import/export analysis, pricing analysis, production consumption analysis, patent analysis and consumer behaviour.
Market Definition
Edible oil refers to a liquid that is extracted from plants, vegetables and seeds. These type of oils possess fatty acid, anti-antioxidants and phospholipids, among others. The edible oil is widely consumed among humans and food processing industry. This oil is known to have low fats, calories and cholesterol.
Report Scope and Market Segmentation
|
Report Metric |
Details |
|
Forecast Period |
2022 to 2029 |
|
Base Year |
2021 |
|
Historic Years |
2020 (Customizable to 2014 - 2019) |
|
Quantitative Units |
Revenue in USD Million, Volumes in Units, Pricing in USD |
|
Segments Covered |
Type (Palm Oil, Soybean Oil, Rapeseed Oil, Sunflower Oil, Peanut Oil, Specialty Blended Oil, Olive Oil, Corn Oil, Flaxseed Oil, Avocado Oil, Walnut Oil, Pumpkin Seed Oil, Grapeseed Oil, Others), Package Type (Tinplate Containers, HDPE (High Density Polyethylene) Containers, PVC (Poly Vinyl Chloride) Bottles, PET (Polyethylene Terephthalate) Bottles, Glass Bottles, Semi – Rigid Containers, Flexible Plastic Pouches, Others), Distribution Channel (Direct, Indirect), End User (Domestics, Industrial, Food Service, Others) |
|
Countries Covered |
Japan, China, India, South Korea, New Zealand, Vietnam, Australia, Singapore, Malaysia, Thailand, Indonesia, Philippines, Rest of Asia-Pacific (APAC) in Asia-Pacific (APAC) |
|
Market Players Covered |
Bunge Limited (US), ADM (US), Cargill, Incorporated (US), ACH Food Companies, Inc. (US), Adani Group (India), SALAD OILS INTERNATIONAL CORPORATION (US), American Vegetable Oils, Inc. (US), BORGES INTERNATIONAL GROUP, S.L. (Spain), Hebany Group (UAE), NGO CHEW HONG EDIBLE OIL PTE LTD (Singapore), TITAN OILS Inc., (Canada) Ragasa - Derechos Reservados (Mexico), SOVENA (Thailand), and Sunora Foods (Canada), among others |
|
Market Opportunities |
|
Asia-Pacific Edible Oil Market Dynamics
This section deals with understanding the market drivers, advantages, opportunities, restraints and challenges. All of this is discussed in detail as below:
Drivers
- Inclination towards Healthy Lifestyle
The increase in the consumer preference for dietary improvements acts as one of the major factors driving the growth of edible oil market. The rise in trend of leading a healthy lifestyle among all age groups shifting to healthy and innovative approach have a positive impact on the industry.
- Prevalence of Obesity
The increase in the prevalence of obesity among population further influences the market. People reaching out to dieticians and nutritionists providing customized diet plans with the aim of losing weight helps in the market growth.
- Awareness Regarding Healthy Lifestyle
The rise in the awareness regarding the importance of leading a healthy lifestyle, accelerate the market growth. The prevalence of various chronic diseases, such as diabetes, and cardiovascular diseases, among others is encouraging people to adopt edible oil.
- Increase in Demand for Functional Foods
The increase in the functional food products further influence the market growth. Also, increase in consumers seeking healthy and sustainable food options along with growing number of sports and gym enthusiasts assist in the expansion of the market.
Additionally, change in lifestyle, increase in the disposable income and rise in awareness regarding the benefits of the nutrition plan positively affect the edible oil market.
Opportunities
Furthermore, rise in demand for clean edible oil products extend profitable opportunities to the market players in the forecast period of 2022 to 2029. Also, research and development activities will further expand the market.
Restraints/Challenges
On the other hand, high cost associated with the products and limited availability of raw materials are expected to obstruct market growth. Also, use of artificial/synthetic ingredients in various applications resulting in health hazards and lack of consistency in regulations are projected to challenge the edible oil market in the forecast period of 2022-2029.
This edible oil market report provides details of new recent developments, trade regulations, import-export analysis, production analysis, value chain optimization, market share, impact of domestic and localized market players, analyses opportunities in terms of emerging revenue pockets, changes in market regulations, strategic market growth analysis, market size, category market growths, application niches and dominance, product approvals, product launches, geographic expansions, technological innovations in the market. To gain more info on edible oil market contact Data Bridge Market Research for an Analyst Brief, our team will help you take an informed market decision to achieve market growth.
COVID-19 Impact on Asia-Pacific Edible Oil Market
COVID-19 had a negative impact on several industries. However, edible oil market witnessed a significant growth during this period. During the lockdown imposed by the government for restricting the spread of the coronavirus disease, most of the population took keen interest in adopting health diets. People are adopting health supplements to increase their immunity with the increasing health complications. The rise in the emphasis on good health is going to keep increasing the growth of the market in the post pandemic scenario.
Recent Developments
- In April 2020, Adani Group’s subsidiary Adani Wilmar partnered with Swiggy based in India for delivery of food products including oil products to customers due to the national lockdown because of COVID-19 pandemic. This partnership has helped the company to reach its customer base to offer its products and earn revenue.
Asia-Pacific Edible Oil Market Scope and Market Size
The edible oil market is segmented on the basis of type, package type, distribution channel and end user. The growth amongst these segments will help you analyze meager growth segments in the industries and provide the users with a valuable market overview and market insights to help them make strategic decisions for identifying core market applications.
Type
- Palm Oil
- Soybean Oil
- Rapeseed Oil
- Sunflower Oil
- Peanut Oil
- Specialty Blended Oil
- Olive Oil
- Corn Oil
- Flaxseed Oil
- Avocado Oil
- Walnut Oil
- Pumpkin Seed Oil
- Grapeseed Oil
- Others
Package Type
- Tinplate Containers
- HDPE (High Density Polyethylene) Containers
- PVC (Poly Vinyl Chloride) Bottles
- PET (Polyethylene Terephthalate) Bottles
- Glass Bottles, Semi – Rigid Containers
- Flexible Plastic Pouches
- Others
Distribution Channel
- Direct
- Indirect
End User
- Domestics
- Industrial
- Food Services
- Others
Asia-Pacific Edible Oil Market Regional Analysis/Insights
The edible oil market is analysed and market size insights and trends are provided by country, type, package type, distribution channel and end user as referenced above.
The countries covered in the edible oil market report are Japan, China, India, South Korea, New Zealand, Vietnam, Australia, Singapore, Malaysia, Thailand, Indonesia, Philippines, and Rest of Asia-Pacific (APAC) in Asia-Pacific (APAC).
In Asia-Pacific edible oil market, China has dominated the market with highest market due to growth in the agriculture industry particularly the production of oilseeds. India and Indonesia are also expected to dominate the market and grow with substantial growth rate as these countries are known as popular hub for oilseeds production owing to their favourable atmosphere. The spread of the COVID-19 may affect the market owing to the government’s restrictions such as lockdown and restrictions on transportation.
The country section of the report also provides individual market impacting factors and changes in regulation in the market domestically that impacts the current and future trends of the market. Data points like down-stream and upstream value chain analysis, technical trends and porter's five forces analysis, case studies are some of the pointers used to forecast the market scenario for individual countries. Also, the presence and availability of global brands and their challenges faced due to large or scarce competition from local and domestic brands, impact of domestic tariffs and trade routes are considered while providing forecast analysis of the country data.
Competitive Landscape and Asia-Pacific Edible Oil Market Share Analysis
The edible oil market competitive landscape provides details by competitor. Details included are company overview, company financials, revenue generated, market potential, investment in research and development, new market initiatives, global presence, production sites and facilities, production capacities, company strengths and weaknesses, product launch, product width and breadth, application dominance. The above data points provided are only related to the companies' focus related to edible oil market.
Some of the major players operating in the edible oil market are
- Bunge Limited (US)
- ADM (US)
- Cargill, Incorporated (US)
- ACH Food Companies, Inc. (US)
- Adani Group (India)
- SALAD OILS INTERNATIONAL CORPORATION (US)
- American Vegetable Oils, Inc. (US)
- BORGES INTERNATIONAL GROUP, S.L. (Spain)
- Hebany Group (UAE)
- NGO CHEW HONG EDIBLE OIL PTE LTD (Singapore)
- TITAN OILS Inc., (Canada
- Ragasa - Derechos Reservados (Mexico)
- SOVENA (Thailand)
- Sunora Foods (Canada)
SKU-
Obtenha acesso online ao relatório sobre a primeira nuvem de inteligência de mercado do mundo

- Painel interativo de análise de dados
- Painel de análise da empresa para oportunidades de elevado potencial de crescimento
- Acesso de analista de pesquisa para personalização e customização. consultas
- Análise da concorrência com painel interativo
- Últimas notícias, atualizações e atualizações Análise de tendências
- Aproveite o poder da análise de benchmark para um rastreio abrangente da concorrência
Metodologia de Investigação
A recolha de dados e a análise do ano base são feitas através de módulos de recolha de dados com amostras grandes. A etapa inclui a obtenção de informações de mercado ou dados relacionados através de diversas fontes e estratégias. Inclui examinar e planear antecipadamente todos os dados adquiridos no passado. Da mesma forma, envolve o exame de inconsistências de informação observadas em diferentes fontes de informação. Os dados de mercado são analisados e estimados utilizando modelos estatísticos e coerentes de mercado. Além disso, a análise da quota de mercado e a análise das principais tendências são os principais fatores de sucesso no relatório de mercado. Para saber mais, solicite uma chamada de analista ou abra a sua consulta.
A principal metodologia de investigação utilizada pela equipa de investigação do DBMR é a triangulação de dados que envolve a mineração de dados, a análise do impacto das variáveis de dados no mercado e a validação primária (especialista do setor). Os modelos de dados incluem grelha de posicionamento de fornecedores, análise da linha de tempo do mercado, visão geral e guia de mercado, grelha de posicionamento da empresa, análise de patentes, análise de preços, análise da quota de mercado da empresa, normas de medição, análise global versus regional e de participação dos fornecedores. Para saber mais sobre a metodologia de investigação, faça uma consulta para falar com os nossos especialistas do setor.
Personalização disponível
A Data Bridge Market Research é líder em investigação formativa avançada. Orgulhamo-nos de servir os nossos clientes novos e existentes com dados e análises que correspondem e atendem aos seus objetivos. O relatório pode ser personalizado para incluir análise de tendências de preços de marcas-alvo, compreensão do mercado para países adicionais (solicite a lista de países), dados de resultados de ensaios clínicos, revisão de literatura, mercado remodelado e análise de base de produtos . A análise de mercado dos concorrentes-alvo pode ser analisada desde análises baseadas em tecnologia até estratégias de carteira de mercado. Podemos adicionar quantos concorrentes necessitar de dados no formato e estilo de dados que procura. A nossa equipa de analistas também pode fornecer dados em tabelas dinâmicas de ficheiros Excel em bruto (livro de factos) ou pode ajudá-lo a criar apresentações a partir dos conjuntos de dados disponíveis no relatório.

