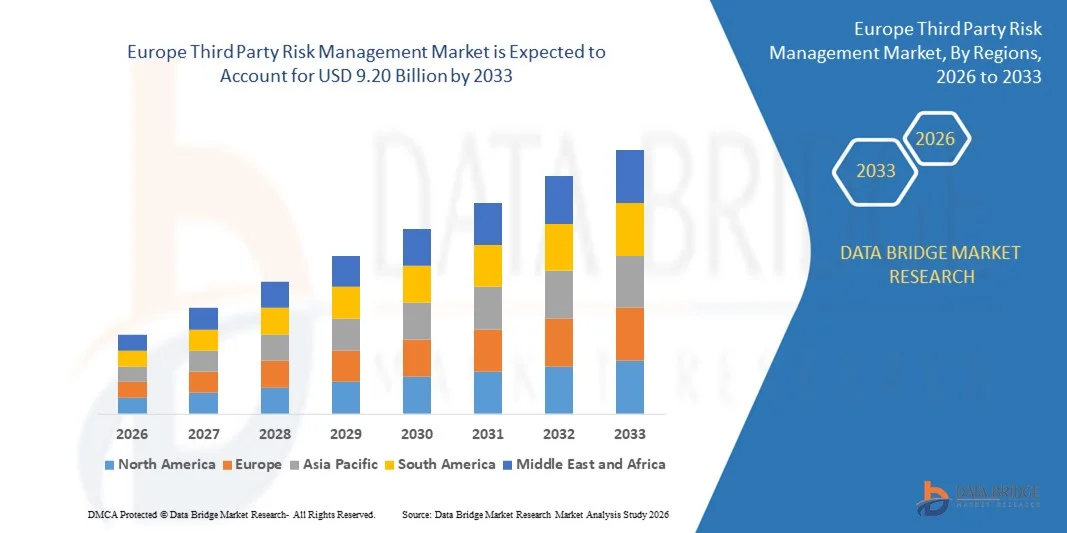
Europe Third Party Risk Management Market
Tamanho do mercado em biliões de dólares
CAGR :
% 
 USD
2.53 Billion
USD
9.20 Billion
2025
2033
USD
2.53 Billion
USD
9.20 Billion
2025
2033
| 2026 –2033 | |
| USD 2.53 Billion | |
| USD 9.20 Billion | |
| % | |
|
Segmentação do mercado europeu de gestão de riscos de terceiros por componente (soluções e serviços), modelo de implantação (local e nuvem), porte da organização (pequenas e médias empresas e grandes empresas) e usuário final (bancos, serviços financeiros e seguros, TI e telecomunicações, saúde e ciências da vida, governo, aeroespacial e defesa, varejo e bens de consumo, manufatura, energia e serviços públicos e outros) - Tendências e previsões do setor até 2033.
Tamanho do mercado europeu de gestão de riscos de terceiros
- O mercado europeu de gestão de riscos de terceiros foi avaliado em US$ 2,53 bilhões em 2025 e deverá atingir US$ 9,20 bilhões até 2033 , com uma taxa de crescimento anual composta (CAGR) de 17,50% durante o período de previsão.
- O crescimento do mercado é impulsionado principalmente pela crescente dependência das organizações em relação a fornecedores e prestadores de serviços terceirizados. As empresas estão terceirizando operações críticas, tornando essencial o monitoramento e gerenciamento eficazes dos riscos associados.
- A crescente exigência de conformidade regulatória e os padrões de segurança e privacidade de dados estão impulsionando as organizações a adotarem soluções robustas de gerenciamento de riscos de terceiros (TPRM). Regulamentações como GDPR, SOX e outras obrigam as empresas a garantir a conformidade com as normas de terceiros.
Análise do mercado europeu de gestão de riscos de terceiros
- O mercado está testemunhando uma rápida adoção em diversos setores devido à necessidade de maior visibilidade e governança de riscos. As empresas buscam proteger suas operações, finanças e reputação gerenciando proativamente os riscos de terceiros.
- Os avanços em IA, aprendizado de máquina e automação estão impulsionando o desenvolvimento de soluções de avaliação de risco mais sofisticadas. A análise preditiva e o monitoramento contínuo estão ajudando as empresas a identificar e lidar com riscos potenciais antes que eles se agravem.
- A Alemanha dominou o mercado de gestão de riscos de terceiros, com a maior participação de receita, de 38,5% em 2025, impulsionada por requisitos regulatórios rigorosos, crescente terceirização de processos de negócios críticos e foco na resiliência operacional em todos os setores.
- Prevê-se que o Reino Unido registre a maior taxa de crescimento anual composta (CAGR) no mercado europeu de gestão de riscos de terceiros, devido ao aumento da fiscalização regulatória, ao crescimento das ameaças à segurança cibernética, à crescente dependência de serviços terceirizados e à adoção acelerada de plataformas de gestão de riscos de terceiros baseadas em nuvem e habilitadas por IA para aprimorar o monitoramento de fornecedores, a conformidade e a resiliência operacional.
- O segmento de Soluções detinha a maior participação na receita de mercado em 2025, impulsionado pela crescente adoção de plataformas automatizadas de avaliação de risco de fornecedores, monitoramento de conformidade e geração de relatórios em diversas empresas. As soluções oferecidas ajudam as organizações a centralizar dados de risco de terceiros, simplificar a integração de fornecedores e aprimorar a visibilidade de riscos em tempo real, tornando-as a escolha preferencial para empresas que gerenciam ecossistemas de fornecedores complexos.
Escopo do relatório e segmentação do mercado de gestão de riscos de terceiros na Europa
|
Atributos |
Principais informações sobre o mercado europeu de gestão de riscos de terceiros |
|
Segmentos abrangidos |
|
|
Países abrangidos |
Europa
|
|
Principais participantes do mercado |
|
|
Oportunidades de mercado |
|
|
Conjuntos de informações de dados de valor agregado |
Além de informações de mercado como valor de mercado, taxa de crescimento, segmentos de mercado, cobertura geográfica, participantes do mercado e cenário de mercado, o relatório de mercado elaborado pela equipe da Data Bridge Market Research inclui análises aprofundadas de especialistas, análises de importação/exportação, análises de preços, análises de produção e consumo e análises PESTEL. |
Tendências do mercado europeu de gestão de riscos de terceiros
Crescente foco na conformidade regulatória e na segurança cibernética
- A crescente complexidade das cadeias de suprimentos e a dependência de fornecedores terceirizados estão moldando significativamente o mercado de gestão de riscos de terceiros (TPRM, na sigla em inglês), à medida que as organizações priorizam a mitigação de riscos operacionais, financeiros e de reputação. As soluções de TPRM estão ganhando força devido à sua capacidade de aprimorar a supervisão de fornecedores, monitorar a conformidade e garantir a continuidade dos negócios sem interromper as operações principais. Essa tendência fortalece a adoção nos setores bancário, de saúde, manufatura e TI, incentivando os provedores de serviços a inovar com ferramentas automatizadas de avaliação de riscos baseadas em IA.
- A crescente conscientização sobre ameaças à segurança cibernética, o escrutínio regulatório e a resiliência operacional aceleraram a demanda por soluções de gerenciamento de riscos de terceiros (TPRM) em setores críticos. Organizações preocupadas com a gestão de riscos buscam ativamente plataformas que ofereçam monitoramento em tempo real, pontuação de riscos e verificações contínuas de conformidade, o que leva os fornecedores de soluções a expandir recursos e integrar análises preditivas para a mitigação proativa de riscos.
- As tendências de conformidade e transparência estão influenciando as decisões de seleção de fornecedores, com as organizações enfatizando a privacidade de dados, a adesão às regulamentações e a preparação para auditorias. Esses fatores estão ajudando as empresas a reduzir a exposição a perdas financeiras e de reputação, além de impulsionar a adoção de estruturas de risco padronizadas e programas de certificação. As empresas estão utilizando cada vez mais programas de treinamento e campanhas de conscientização para reforçar as melhores práticas e a responsabilidade dos fornecedores.
- Por exemplo, em 2024, organizações líderes nos setores de serviços financeiros e saúde aprimoraram seus programas de Gestão de Riscos de Terceiros (TPRM) incorporando monitoramento baseado em IA e relatórios de conformidade automatizados. Essas iniciativas foram introduzidas em resposta às crescentes expectativas regulatórias e aos riscos cibernéticos elevados, com implementação em todas as operações da empresa. As soluções também foram comercializadas como ferramentas estratégicas para fortalecer a governança e a resiliência operacional, melhorando a confiança das partes interessadas e a credibilidade organizacional.
- Embora a demanda por soluções de TPRM esteja crescendo, a expansão sustentada do mercado depende de inovação contínua, implantação com boa relação custo-benefício e integração com os sistemas corporativos existentes. Os fornecedores também estão focando em escalabilidade, segurança de dados e no desenvolvimento de plataformas intuitivas que equilibrem a cobertura de riscos, a eficiência operacional e a conformidade regulatória para uma adoção mais ampla.
Dinâmica do mercado europeu de gestão de riscos de terceiros
Motorista
Crescente necessidade de conformidade regulatória e resiliência operacional
- A crescente dependência organizacional de fornecedores terceirizados e o aumento das exigências regulatórias são os principais impulsionadores do mercado de Gestão de Riscos de Terceiros (TPRM). As empresas estão adotando programas abrangentes de gestão de riscos para monitorar o desempenho dos fornecedores, garantir a conformidade com os padrões do setor e mitigar interrupções operacionais. Essa tendência também impulsiona o investimento em soluções automatizadas e baseadas em inteligência artificial para avaliação de riscos, visando uma gestão de riscos mais proativa.
- A expansão das aplicações nos setores de serviços financeiros, saúde, manufatura e TI está influenciando o crescimento do mercado. As soluções de Gestão de Riscos de Terceiros (TPRM) ajudam as organizações a identificar, avaliar e mitigar os riscos operacionais, de segurança cibernética e de conformidade associados a contratos com terceiros, permitindo que as empresas mantenham a continuidade dos negócios e, ao mesmo tempo, atendam aos requisitos de governança.
- Fornecedores de soluções e consultores estão promovendo ativamente a adoção de Gestão de Riscos de Terceiros (TPRM) por meio de plataformas integradas, insights baseados em análises e recursos de geração de relatórios de conformidade. Esses esforços são apoiados pelo crescente escrutínio regulatório e pela demanda das partes interessadas por transparência, o que também incentiva parcerias entre fornecedores de tecnologia e provedores de serviços para fortalecer a inteligência de riscos e a eficiência operacional.
- Por exemplo, em 2023, empresas globais dos setores financeiro e de tecnologia implementaram plataformas aprimoradas de Gestão de Riscos de Terceiros (TPRM) para simplificar a integração de fornecedores, monitorar métricas de risco e automatizar a geração de relatórios de conformidade. Essas implementações foram impulsionadas pela crescente pressão regulatória, pelo aumento das ameaças cibernéticas e pela necessidade de manter a resiliência operacional. As organizações destacaram a redução de riscos e a conformidade regulatória em suas comunicações internas e externas para reforçar a confiança das partes interessadas.
- Embora as tendências de risco regulatório e operacional favoreçam o crescimento, a adoção em larga escala depende da otimização de custos, da integração com os sistemas corporativos e da facilidade de implementação. O investimento em monitoramento automatizado, análise de IA e ferramentas de colaboração com fornecedores será fundamental para atender às necessidades das empresas e manter a vantagem competitiva.
Restrição/Desafio
Altos custos de implementação e conhecimento limitado.
- O custo relativamente alto das soluções de TPRM (Gerenciamento de Risco de Terceiros) em comparação com os métodos tradicionais de supervisão de fornecedores continua sendo um desafio importante, limitando a adoção entre organizações com restrições orçamentárias. Taxas de assinatura, personalização de software e despesas de integração contribuem para o aumento dos custos. Além disso, a escalabilidade das soluções para grandes redes globais de fornecedores pode aumentar o gasto total.
- O conhecimento sobre os benefícios do TPRM (Gestão de Riscos de Terceiros) ainda é desigual, principalmente entre pequenas e médias empresas, onde os programas formais de gestão de riscos ainda estão em desenvolvimento. A compreensão limitada das métricas de risco e das capacidades das soluções restringe a adoção em certos setores. Isso também leva a uma adoção mais lenta em organizações que não possuem recursos dedicados à gestão de riscos.
- Os desafios de implementação e operação também impactam o crescimento do mercado, uma vez que as soluções de TPRM exigem integração com a infraestrutura de TI existente, atualizações regulares de dados e adesão a rigorosos padrões de segurança. A complexidade da implantação, do gerenciamento de mudanças e dos requisitos de treinamento pode aumentar os custos operacionais e prolongar o tempo de retorno do investimento.
- Por exemplo, em 2024, várias empresas de médio porte que implementaram soluções de TPRM relataram uma adoção mais lenta devido aos altos custos iniciais de configuração e à limitada expertise interna para gerenciar programas de risco de fornecedores. Desafios de integração e requisitos de monitoramento contínuo foram barreiras adicionais, levando algumas organizações a adiar a implementação em larga escala e limitar a cobertura de fornecedores.
- Superar esses desafios exigirá plataformas com boa relação custo-benefício, modelos de implantação escaláveis e iniciativas de conscientização direcionadas às organizações. A colaboração com parceiros de tecnologia, consultores e assessores regulatórios pode ajudar a desbloquear o potencial de crescimento a longo prazo do mercado global de TPRM (Gerenciamento de Riscos de Terceiros). Além disso, o desenvolvimento de soluções automatizadas e fáceis de usar, bem como o fortalecimento da comunicação de valor em torno da conformidade e da mitigação de riscos, serão essenciais para uma adoção mais ampla.
Escopo do mercado europeu de gestão de riscos de terceiros
O mercado é segmentado com base em componentes, modelo de implantação, tamanho da organização e usuário final.
- Por componente
Com base nos componentes, o mercado europeu de Gestão de Riscos de Terceiros (TPRM) é segmentado em Soluções e Serviços. O segmento de Soluções detinha a maior participação na receita de mercado em 2025, impulsionado pela crescente adoção de plataformas automatizadas de avaliação de riscos de fornecedores, monitoramento de conformidade e geração de relatórios em empresas. As soluções oferecidas ajudam as organizações a centralizar dados de risco de terceiros, simplificar a integração de fornecedores e aprimorar a visibilidade de riscos em tempo real, tornando-as a escolha preferencial para empresas que gerenciam ecossistemas de fornecedores complexos.
O segmento de Serviços deverá apresentar o crescimento mais rápido entre 2026 e 2033, impulsionado pela demanda por consultoria especializada, avaliação de riscos e serviços gerenciados de gestão de riscos de terceiros (TPRM). As organizações dependem cada vez mais de fornecedores terceirizados para lidar com o monitoramento de fornecedores, a conformidade regulatória e a mitigação contínua de riscos, principalmente quando os recursos internos são limitados. Os serviços oferecem suporte especializado e escalável, permitindo que as empresas fortaleçam a resiliência operacional e reduzam a carga de conformidade.
- Por modelo de implantação
Com base no modelo de implantação, o mercado é segmentado em On-Premise e Nuvem. O segmento de Nuvem detinha a maior participação de mercado em 2025 devido à sua escalabilidade, menores custos iniciais e facilidade de integração com os sistemas corporativos existentes. As plataformas TPRM baseadas em nuvem permitem monitoramento contínuo, alertas automatizados e relatórios centralizados, tornando-as atraentes para organizações com redes de fornecedores geograficamente distribuídas.
O segmento On-Premise deverá crescer de forma constante de 2026 a 2033, impulsionado por organizações que priorizam a segurança de dados, a conformidade regulatória e o controle interno sobre informações confidenciais de fornecedores. As soluções On-Premise são atraentes para empresas com políticas rigorosas de governança de TI ou para aquelas em setores altamente regulamentados que exigem controle total da infraestrutura de gerenciamento de riscos.
- Por tamanho da organização
Com base no porte da organização, o mercado é segmentado em Pequenas e Médias Empresas (PMEs) e Grandes Empresas. As Grandes Empresas detiveram a maior participação na receita em 2025, devido às suas extensas redes de fornecedores, maior rigor regulatório e necessidade de estruturas abrangentes de monitoramento de riscos. Essas organizações investem significativamente em soluções e serviços de Gestão de Riscos de Terceiros (TPRM) para mitigar riscos operacionais, financeiros e de reputação.
Prevê-se que o segmento de PMEs apresente o crescimento mais rápido entre 2026 e 2033, impulsionado pela crescente conscientização sobre os requisitos regulatórios, pelo aumento das ameaças cibernéticas e pela maior adoção de soluções de gestão de riscos de terceiros (TPRM) escaláveis e econômicas. As PMEs estão cada vez mais utilizando plataformas em nuvem e serviços gerenciados para implementar práticas de gestão de riscos de fornecedores sem grandes investimentos iniciais.
- Por usuário final
Com base no usuário final, o mercado é segmentado em Bancos, Serviços Financeiros e Seguros (BFSI), TI e Telecomunicações, Saúde e Ciências da Vida, Governo, Aeroespacial e Defesa, Varejo e Bens de Consumo, Manufatura, Energia e Serviços Públicos, e Outros. O segmento BFSI detinha a maior participação em 2025, impulsionado por requisitos regulatórios rigorosos, ecossistemas de fornecedores complexos e a necessidade crítica de segurança operacional e de dados. As soluções de Gestão de Riscos de Terceiros (TPRM) permitem que as instituições financeiras garantam a conformidade, monitorem o desempenho de terceiros e reduzam a exposição a riscos operacionais.
O segmento de TI e Telecomunicações deverá apresentar o crescimento mais rápido entre 2026 e 2033, impulsionado pela rápida transformação digital, pelo aumento da terceirização de serviços de TI e pelas crescentes preocupações com a segurança cibernética. As organizações desse setor estão adotando cada vez mais o monitoramento automatizado, a avaliação contínua de riscos e plataformas de gerenciamento de riscos de terceiros (TPRM) baseadas em nuvem para gerenciar com eficiência extensas redes de fornecedores.
Análise Regional do Mercado Europeu de Gestão de Riscos de Terceiros
- A Alemanha dominou o mercado de gestão de riscos de terceiros, com a maior participação de receita, de 38,5% em 2025, impulsionada por requisitos regulatórios rigorosos, crescente terceirização de processos de negócios críticos e foco na resiliência operacional em todos os setores.
- As organizações do país priorizam fortemente o monitoramento de riscos de fornecedores, a gestão de conformidade e a segurança cibernética, investindo em soluções e serviços avançados de TPRM (Gerenciamento de Riscos de Terceiros) para mitigar riscos operacionais e financeiros.
- Essa ampla adoção é ainda mais sustentada por um ecossistema empresarial maduro, alta penetração tecnológica e estruturas de governança robustas, estabelecendo as soluções de TPRM como um componente-chave das estratégias de gestão de riscos.
Análise do Mercado de Gestão de Riscos de Terceiros no Reino Unido
Prevê-se que o mercado de gestão de riscos de terceiros no Reino Unido registre o crescimento mais rápido entre 2026 e 2033, impulsionado pela crescente conscientização sobre os riscos de terceiros, pelo aumento das ameaças cibernéticas e pelas exigências regulatórias nos setores financeiro, de saúde e de TI. As organizações estão priorizando cada vez mais o monitoramento automatizado de riscos, o acompanhamento contínuo da conformidade e as plataformas de avaliação de fornecedores. Além disso, a crescente adoção de soluções de gestão de riscos de terceiros baseadas em nuvem e análises de risco orientadas por inteligência artificial está contribuindo significativamente para a expansão do mercado, permitindo que as empresas fortaleçam a resiliência operacional e a governança.
Participação de mercado na gestão de riscos de terceiros na Europa
O setor europeu de gestão de riscos de terceiros é liderado principalmente por empresas consolidadas, incluindo:
- Outpost24 (Suécia)
- KPMG Internacional (Reino Unido)
- Deloitte (Reino Unido)
- PwC (Reino Unido)
- Ernst & Young (Reino Unido)
- Métodos de risco (Alemanha)
- GRC Solutions (Reino Unido)
- SecureLink (Países Baixos)
- Archlett (Bélgica)
- RiskIQ Europa (Reino Unido)
- Proteção de Fornecedores (Suíça)
- Grupo BSI (Reino Unido)
- EuroRisk Solutions (França)
- SAI Global (Reino Unido)
- Controlar Riscos (Reino Unido)
SKU-
Obtenha acesso online ao relatório sobre a primeira nuvem de inteligência de mercado do mundo

- Painel interativo de análise de dados
- Painel de análise da empresa para oportunidades de elevado potencial de crescimento
- Acesso de analista de pesquisa para personalização e customização. consultas
- Análise da concorrência com painel interativo
- Últimas notícias, atualizações e atualizações Análise de tendências
- Aproveite o poder da análise de benchmark para um rastreio abrangente da concorrência
Metodologia de Investigação
A recolha de dados e a análise do ano base são feitas através de módulos de recolha de dados com amostras grandes. A etapa inclui a obtenção de informações de mercado ou dados relacionados através de diversas fontes e estratégias. Inclui examinar e planear antecipadamente todos os dados adquiridos no passado. Da mesma forma, envolve o exame de inconsistências de informação observadas em diferentes fontes de informação. Os dados de mercado são analisados e estimados utilizando modelos estatísticos e coerentes de mercado. Além disso, a análise da quota de mercado e a análise das principais tendências são os principais fatores de sucesso no relatório de mercado. Para saber mais, solicite uma chamada de analista ou abra a sua consulta.
A principal metodologia de investigação utilizada pela equipa de investigação do DBMR é a triangulação de dados que envolve a mineração de dados, a análise do impacto das variáveis de dados no mercado e a validação primária (especialista do setor). Os modelos de dados incluem grelha de posicionamento de fornecedores, análise da linha de tempo do mercado, visão geral e guia de mercado, grelha de posicionamento da empresa, análise de patentes, análise de preços, análise da quota de mercado da empresa, normas de medição, análise global versus regional e de participação dos fornecedores. Para saber mais sobre a metodologia de investigação, faça uma consulta para falar com os nossos especialistas do setor.
Personalização disponível
A Data Bridge Market Research é líder em investigação formativa avançada. Orgulhamo-nos de servir os nossos clientes novos e existentes com dados e análises que correspondem e atendem aos seus objetivos. O relatório pode ser personalizado para incluir análise de tendências de preços de marcas-alvo, compreensão do mercado para países adicionais (solicite a lista de países), dados de resultados de ensaios clínicos, revisão de literatura, mercado remodelado e análise de base de produtos . A análise de mercado dos concorrentes-alvo pode ser analisada desde análises baseadas em tecnologia até estratégias de carteira de mercado. Podemos adicionar quantos concorrentes necessitar de dados no formato e estilo de dados que procura. A nossa equipa de analistas também pode fornecer dados em tabelas dinâmicas de ficheiros Excel em bruto (livro de factos) ou pode ajudá-lo a criar apresentações a partir dos conjuntos de dados disponíveis no relatório.

