North America Japanese Restaurant Market
Tamanho do mercado em biliões de dólares
CAGR :
% 
 USD
5.11 Billion
USD
6.59 Billion
2024
2032
USD
5.11 Billion
USD
6.59 Billion
2024
2032
| 2025 –2032 | |
| USD 5.11 Billion | |
| USD 6.59 Billion | |
| % | |
North America Japanese Restaurant Market Segmentation, By Cuisine Type(Traditional Japanese Cuisine, Specialty Japanese Cuisine, and Modern Japanese Cuisine), Service Type (Quick Service Restaurants (QSR), Full Service Restaurants, and Take-Out Counters/Outlets), Restaurant Category (Standalone Restaurants and Chain/Franchise Model), Restaurant Model (Takeaway, Home Delivery, and Dine-In), Sales Channel (Physical Outlets and Delivery Online Restaurants/Ghost Kitchen) - Industry Trends and Forecast to 2031
North America Japanese Restaurant Market Analysis
Increasing awareness of health benefits related to Japanese food is driving the market growth. Innovation in menu offerings provides opportunities in the market. Moreover, increase in popularity of the dish sushi is driving market growth.
North America Japanese Restaurant Market Size
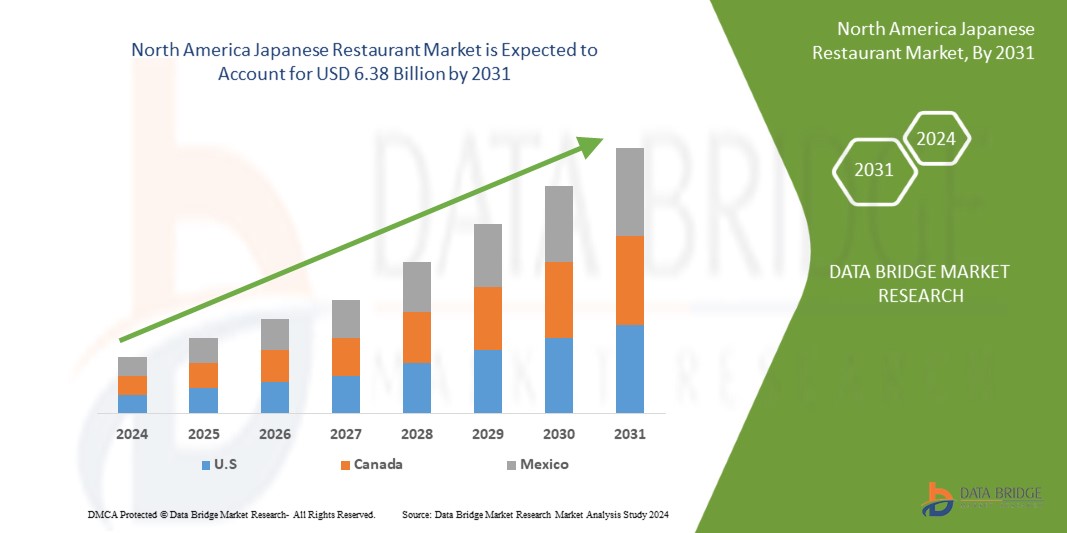
The North America market is expected to reach USD 6.38 billion by 2031 from USD 4.97 billion in 2023, growing with a substantial CAGR of 3.23% in the forecast period of 2024 to 2031.
North America Market Trends
“Increasing Awareness of Health Benefits Related to Japanese Food Drives the North America Japanese Restaurant Market”
The North America Japanese restaurant market is experiencing significant growth, driven by the increasing awareness of the health benefits associated with Japanese cuisine. Japanese cuisine, renowned for its emphasis on fresh, high-quality ingredients and balanced nutrition, aligns well with the growing North America focus on health and wellness. Traditional dishes such as sushi, sashimi, and miso soup are not only flavorful but also low in fat and high in essential nutrients. Sushi, for example, features lean proteins like fish and nutrient-rich vegetables, while miso soup provides probiotics beneficial for digestive health. The health benefits of these foods are becoming more widely recognized, leading to a surge in consumer interest. The growing awareness of Japanese cuisine's health benefits also contributes to its appeal in diverse markets. Consumers in various regions are exploring Japanese food not only for its taste but also for its positive impact on overall health. This shift is particularly evident in regions where there is a rising trend of health-oriented eating habits, such as North America and Europe. Japanese restaurants in these areas are seeing increased patronage as they cater to the demand for healthier dining options.
As more people become health-conscious, they are increasingly seeking out dining options that align with their wellness goals. Japanese restaurants are capitalizing on this trend by highlighting the nutritional advantages of their menus. Many establishments like Sushi Gen Enterprises, Sushi Nozawa Group RE&S and others now emphasize their use of fresh, natural ingredients and traditional cooking methods that retain the maximum nutritional value of the food. This focus on health is not just limited to traditional dishes but extends to modern interpretations and fusion cuisines that integrate Japanese principles with other healthy culinary traditions.
Report Scope and Market Segmentation
|
Attributes |
North America Key Market Insights |
|
Segmentation |
By Cuisine Type: Traditional Japanese Cuisine, Specialty Japanese Cuisine, and Modern Japanese Cuisine By Service Type: Quick Service Restaurants (QSR), Full Service Restaurants, and Take-Out Counters/Outlets By Restaurant Category: Standalone Restaurants and Chain/Franchise Model By Restaurant Model: Takeaway, Home Delivery, and Dine-In By Sales Channel: Physical Outlets and Delivery Online Restaurants/Ghost Kitchen |
|
Countries Covered |
U.S., Canada and Mexico |
|
Key Market Players |
Katsu-Ya Group, Inc (U.S.), Wokcano Asian Restaurant & Bar.(U.S.), 893 Ryōtei Berlin (Germany), Chiba Japanese Restaurant (U.S.), Tsujita Artisan Noodle (Japan), Sushi Den (U.S.), Florilège (Japan), Kaiten Zushi (U.S.), Kura Sushi USA (U.S.), Narisawa (Japan), RE&S (Singapore), Sazenka (Japan), Sushi A Go (U.S.), Sushi Gen Enterprises (U.S.), Sushi Nozawa Group (U.S.), Sushiya (India), Takami Sushi & Robata Restaurant (U.S.), Tatsu Ramen LLC (U.S.), Yamashiro Hollywood (U.S.), among others |
|
Market Opportunities |
|
|
Value Added Data Infosets |
In addition to the insights on market scenarios such as market value, growth rate, segmentation, geographical coverage, and major players, the market reports curated by the Data Bridge Market Research also include in-depth expert analysis, pricing analysis, brand share analysis, consumer survey, demography analysis, supply chain analysis, value chain analysis, raw material/consumables overview, vendor selection criteria, PESTLE Analysis, Porter Analysis, and regulatory framework. |
Japanese Restaurant Market Definition
A Japanese restaurant is an establishment that specializes in serving traditional Japanese cuisine, characterized by its emphasis on fresh, high-quality ingredients and meticulous preparation techniques. The menu typically features a variety of dishes, including sushi, sashimi, tempura, ramen, and other items that reflect Japan's diverse culinary heritage. Japanese restaurants often prioritize authenticity, incorporating traditional cooking methods and presentation styles, such as sushi rolls and bento boxes, to deliver a genuine dining experience. The ambiance of these restaurants often reflects Japanese aesthetics, with a focus on simplicity, elegance, and attention to detail. Service in Japanese restaurants is generally attentive and respectful, aiming to enhance the overall dining experience. In recent years, many Japanese restaurants have also embraced modern innovations, such as online ordering and sustainable practices, to meet the evolving preferences of North America consumers.
Japanese Restaurant Market Dynamics
Drivers
- The Increase in Popularity of the Dish Sushi
The rising popularity of sushi is a significant factors for the North America Japanese restaurant market, influencing consumer preferences and expanding market reach. Sushi, a staple of Japanese cuisine, has experienced a surge in North America popularity due to its alignment with health trends, versatility, and integration into mainstream food culture. One of the primary factors driving this trend is sushi’s reputation as a healthy and convenient food option. With its emphasis on fresh fish, vegetables, and rice, sushi is often perceived as a nutritious choice. The growing awareness of health and wellness has led many consumers to seek out healthier alternatives to traditional fast food. Sushi’s low-calorie, high-protein, and omega-3-rich profile aligns well with these dietary preferences, making it an attractive option for health-conscious diners. As a result, sushi has become an essential in many diets around the world, driving increased demand for Japanese restaurants. Along with it the rise of sushi's popularity is also supported by its versatility and adaptability. Sushi can be customized to suit various tastes and dietary needs, including vegetarian and gluten-free options. This flexibility allows sushi to cater to a wide range of consumer preferences, further enhancing its appeal. The introduction of innovative sushi rolls and fusion creations has also helped to attract a diverse audience, from traditionalists to those seeking novel culinary experiences. This adaptability has facilitated the expansion of sushi offerings in both traditional Japanese restaurants and new, contemporary dining establishments. In addition the mainstream acceptance of sushi has also played a crucial role in its market influence. Sushi has become a common fixture in cities around the world, from New York and London to Sydney and Tokyo. Its presence in popular media, including television shows, social media, and food blogs, has elevated sushi to a prominent position in North America food culture. This increased visibility has led to a broader acceptance of sushi as a mainstream dining option, attracting customers who may not have previously considered Japanese cuisine.
For Instance,
- In 2024, according to World Metrics, the North America sushi market has experienced substantial growth, with the industry valued at over USD 27 billion. This surge highlights the increasing popularity of sushi, driving a significant rise in the number of Japanese restaurants and contributing to the expansion of Japanese dining experiences worldwide
The Recognition of Japanese Cuisine as a UNESCO Intangible Cultural Heritage
The designation of Japanese cuisine as a UNESCO intangible cultural heritage highlights its traditional practices, unique preparation methods, and cultural significance. This acknowledgment not only elevates the profile of Japanese food but also generates heightened North America interest. Consumers are increasingly drawn to Japanese cuisine due to its rich history, authenticity, and the craftsmanship associated with its preparation. As a result, there is a growing demand for authentic Japanese dining experiences, which directly benefits Japanese restaurants worldwide.
The UNESCO recognition also enhances the North America appeal of Japanese cuisine by positioning it as a symbol of cultural sophistication and culinary excellence. This status attracts food enthusiasts and cultural tourists who seek to experience the authentic flavors and traditional techniques that are now internationally celebrated. Japanese restaurants, therefore, benefit from increased foot traffic and consumer interest driven by this prestigious endorsement. Furthermore, the North America focus on preserving intangible cultural heritage aligns with broader trends in cultural tourism and experiential dining. As travelers become more interested in immersing themselves in local traditions and cultural practices, Japanese cuisine’s UNESCO status makes it a compelling choice. Restaurants that offer traditional Japanese dishes and emphasize their heritage connection are likely to attract both international tourists and local consumers who are eager to engage with culturally significant culinary experiences.
For instance,
- In February 2024, according to an article published by the Star Advertiser, the North America interest in Japan’s traditional cuisine, recognized as a UNESCO intangible cultural heritage, continues to rise. The recognition of Japanese cuisine by UNESCO enhances its prestige and appeal, encouraging more diners to explore and appreciate its cultural and historical significance, which in turn fuels the growth and popularity of Japanese dining establishments across the globe
Opportunities
- Innovation in Menu Offerings
Innovation in menu offerings presents a significant opportunity for the North America Japanese restaurant market, possessing growth and capturing new customer segments. As the dining landscape evolves, Japanese restaurants have the chance to differentiate themselves by embracing creative and diverse menu options that appeal to modern consumers. One of the key opportunities lies in the adaptation of traditional Japanese dishes to contemporary tastes and dietary preferences. For example sushi, traditionally consisting of raw fish and rice, has evolved to include a variety of ingredients and styles, such as vegetarian rolls, fusion creations, and even sushi burritos. This innovation allows Japanese restaurants to cater to a broader audience, including those with dietary restrictions or a preference for unique flavor combinations. By offering diverse and inventive menu items, restaurants can attract a wider range of customers and increase their market appeal.
Another opportunity for menu innovation is the integration of North America culinary trends with Japanese cuisine. Japanese restaurants are increasingly incorporating elements from other culinary traditions, resulting in exciting new dishes that blend flavors and techniques. For instance the fusion of Japanese and Mediterranean ingredients can create unique dishes like sushi with hummus or miso-glazed lamb. These cross-cultural innovations not only attract adventurous eaters but also position Japanese restaurants as trendsetters in the North America dining scene.
For instance,
- In 2018, according to the Economic Times, the Japanese restaurant market saw significant innovation with the introduction of sushi doughnuts and sushi burritos. These novel creations, which blend traditional sushi ingredients with new formats, such as a doughnut-shaped sushi or a burrito-style wrap, reflect a growing trend towards inventive menu offerings
Collaboration With Local Cultural Events and Festivals
Collaboration with local cultural events and festivals represents a significant opportunity for the North America Japanese restaurant market, fostering growth and expanding market reach. These collaborations allow Japanese restaurants to enhance their visibility, engage with diverse audiences, and strengthen their brand presence in both established and emerging markets.
Participating in cultural events and festivals enables Japanese restaurants to introduce their cuisine to new customer segments. Events such as food festivals, cultural fairs, and community celebrations attract large and varied audiences, providing a platform for restaurants to showcase their offerings. For instance, a Japanese restaurant setting up a booth at a multicultural food festival can reach attendees who may be unfamiliar with Japanese cuisine. By offering sample dishes or special event menus, restaurants can attract potential customers, generate interest, and encourage them to visit the restaurant for a full dining experience. These collaborations help Japanese restaurants build brand recognition and establish a positive reputation within the community. When restaurants align themselves with popular local events, they benefit from the event's promotional efforts, including marketing materials, social media mentions, and local media coverage. This association can boost the restaurant's visibility and credibility, leading to increased interest and foot traffic. For instance, a Japanese restaurant partnering with a prominent local cultural festival may be featured in event advertisements and receive mentions in local news outlets, boosting its profile among potential diners.
Restraints/Challenges
- High Cost of Ingredients for Japanese Cuisine
Japanese cuisine, known for its emphasis on fresh and high-quality ingredients, often relies on specialized items such as premium-grade sushi-grade fish, rare vegetables, and imported condiments. Such as, ingredients like bluefin tuna, used in high-end sushi, and seasonal items such as Matsutake mushrooms, are not only expensive but also subject to fluctuations in availability and price. The high cost of these ingredients impacts the overall cost structure of Japanese restaurants, leading to increased menu prices and potentially reduced consumer demand. The high costs of ingredients can particularly strain smaller or independent Japanese restaurants. These establishments may struggle to absorb the cost increases without significantly raising menu prices, which could discourage budget-conscious customers. Additionally, the volatility in ingredient prices can lead to inconsistent menu pricing and availability. For instance, fluctuations in the North America market for seafood due to overfishing, environmental changes, or supply chain disruptions can cause sudden increases in costs.
The impact of high ingredient costs extends beyond the restaurant level to affect consumer perceptions and behavior. When menu prices rise due to increased ingredient costs, consumers may perceive the restaurant as less affordable or value-for-money. This perception can lead to decreased support and lower overall sales. Moreover, the high cost of authentic Japanese ingredients can limit the ability of restaurants to offer a diverse menu, potentially reducing their appeal to a broader audience.
- Intensa competição da cozinha italiana e chinesa
O mercado de restaurantes japoneses da América do Norte enfrenta desafios significativos devido à intensa concorrência das cozinhas italiana e chinesa. As opções gastronómicas italianas e chinesas estão profundamente enraizadas na cultura gastronómica da América do Norte, apresentando-se como formidáveis rivais para os restaurantes japoneses na disputa pela atenção do consumidor e pela quota de mercado. Um dos principais desafios é a saturação das cozinhas italiana e chinesa no mercado gastronómico da América do Norte. A cozinha italiana, com a sua grande variedade de pratos como massas, pizzas e risotos, e a cozinha chinesa, conhecida pela sua grande variedade, incluindo dim sum, noodles e salteados, estão amplamente disponíveis e profundamente enraizadas em muitos países. Esta ampla disponibilidade cria um elevado nível de concorrência para os restaurantes japoneses, que se devem diferenciar
para captar o interesse do consumidor. A prevalência destas cozinhas significa que os restaurantes japoneses enfrentam a dificuldade de se destacarem num mercado lotado, onde dominam as opções familiares e populares.
A par disto, o custo de entrada e os desafios operacionais associados à manutenção de um restaurante japonês podem ser desafios significativos. Os restaurantes italianos e chineses beneficiam geralmente de economias de escala devido à sua maior presença e às cadeias de abastecimento estabelecidas. Por outro lado, os restaurantes japoneses podem enfrentar custos mais elevados para obter ingredientes autênticos e equipamento especializado, o que pode afetar os seus preços e rentabilidade. Por exemplo, o peixe de alta qualidade para sushi e os molhos de soja premium são caros e requerem um manuseamento cuidadoso, o que pode aumentar os custos operacionais. Esta disparidade na eficiência operacional pode dificultar a vida dos japoneses
restaurantes para competir em preço, especialmente em mercados onde o custo é uma consideração fundamental para os consumidores.
Impacto e cenário atual do mercado de escassez de matéria-prima e atrasos no envio
A Data Bridge Market Research oferece uma análise de alto nível do mercado e fornece informações tendo em conta o impacto e o ambiente atual do mercado de escassez de matérias-primas e atrasos nas remessas. Isto traduz-se em avaliar possibilidades estratégicas, criar planos de ação eficazes e auxiliar as empresas na tomada de decisões importantes.
Além do relatório padrão, também oferecemos uma análise aprofundada do nível de aquisição, desde atrasos previstos de expedição, mapeamento de distribuidores por região, análise de commodities, análise de produção, tendências de mapeamento de preços, sourcing, análise de desempenho de categoria, soluções avançadas de gestão de risco da cadeia de abastecimento.
Impacto esperado da desaceleração económica nos preços e na disponibilidade dos produtos
Quando a atividade económica abranda, as indústrias começam a sofrer. Os efeitos previstos da crise económica nos preços e na acessibilidade dos produtos são tidos em conta nos relatórios de informação de mercado e nos serviços de informações fornecidos pelo DBMR. Com isto, os nossos clientes conseguem geralmente manter-se um passo à frente dos seus concorrentes, projetar as suas vendas e receitas e estimar as suas despesas com lucros e perdas.
Âmbito do mercado da América do Norte
O mercado está segmentado em cinco segmentos notáveis com base no tipo de cozinha, tipo de serviço, categoria de restaurante, modelo de restaurante e canal de vendas. O crescimento entre estes segmentos irá ajudá-lo a analisar segmentos de baixo crescimento nos setores e fornecerá aos utilizadores uma visão geral e informações valiosas do mercado para os ajudar a tomar decisões estratégicas para identificar as principais aplicações do mercado.
Análise regional do mercado da América do Norte
O mercado está segmentado em cinco segmentos notáveis baseados no tipo de cozinha, tipo de serviço, categoria de restaurante, modelo de restaurante e canal de vendas .
Os países abrangidos pelo mercado são os EUA, o Canadá e o México.
Os EUA dominam o mercado devido à sua infraestrutura bem estabelecida, tecnologia de processamento avançada e maiores níveis de investimento no setor em comparação com outras regiões, o que deverá impulsionar ainda mais o crescimento do mercado.
A secção do relatório sobre os países também fornece fatores individuais que impactam o mercado e alterações na regulamentação do mercado nacional que impactam as tendências atuais e futuras do mercado. Pontos de dados como a análise da cadeia de valor a montante e a jusante, tendências técnicas e análise das cinco forças de Porter, estudos de caso são alguns dos indicadores utilizados para prever o cenário de mercado para países individuais. Além disso, a presença e disponibilidade das marcas da América do Norte e os desafios enfrentados devido à grande ou escassa concorrência das marcas locais e nacionais,
Cozinha tradicional japonesa
- Cozinha tradicional japonesa, por tipo de cozinha
- Sushi
- Sushi, por tipo
- Correia transportadora
- Sem Transportador
- Sushi, por cadeia
- Restaurantes locais
- Cadeia Internacional
- Sushi, Por Estabelecimento
- Serviço rápido
- Restaurantes com serviço completo
- Balcões/pontos de venda para levar
- Sushi, por tipo
- Ramen
- Ramen, por Restaurant Mode
- Levar
- Entrega ao domicílio
- Jantar no local
- Ramen, por estabelecimento
- Serviço rápido
- Restaurantes com serviço completo
- Balcões/pontos de venda para levar
- Ramen, por Restaurant Mode
- Tempura
- Tempura, Por Modo Restaurante
- Levar
- Entrega ao domicílio
- Jantar no local
- Tempura, por estabelecimento
- Serviço rápido
- Restaurantes com serviço completo
- Balcões/pontos de venda para levar
- Tempura, Por Modo Restaurante
- Sashimis
- Sashimi, por Modo Restaurante
- Levar
- Entrega ao domicílio
- Jantar no local
- Sashimi, por estabelecimento
- Serviço rápido
- Restaurantes com serviço completo
- Balcões/pontos de venda para levar
- Sashimi, por Modo Restaurante
- Kaiseki
- Kaiseki, por Modo Restaurante
- Levar
- Entrega ao domicílio
- Jantar no local
- Kaiseki, por estabelecimento
- Serviço rápido
- Restaurantes com serviço completo
- Balcões/pontos de venda para levar
- Kaiseki, por Modo Restaurante
- Udon/Soba
- Udon/Soba, por Restaurant Mode
- Levar
- Entrega ao domicílio
- Jantar no local
- Udon/Soba, por estabelecimento
- Serviço rápido
- Restaurantes com serviço completo
- Balcões/pontos de venda para levar
- Udon/Soba, por Restaurant Mode
- Outros
- Outros, Por Modo Restaurante
- Levar
- Entrega ao domicílio
- Jantar no local
- Outros, por estabelecimento
- Serviço rápido
- Restaurantes com serviço completo
- Balcões/pontos de venda para levar
- Outros, Por Modo Restaurante
- Sushi
Especialidade culinária japonesa
- Especialidade da cozinha japonesa, por tipo
- Yakitori
- Teppanyaki
- Outros
- Especialidade culinária japonesa, por modo de restaurante
- Levar
- Entrega ao domicílio
- Jantar no local
- Especialidade culinária japonesa, por modo de restaurante
- Serviço rápido
- Restaurantes com serviço completo
- Balcões/pontos de venda para levar
- Cozinha Japonesa Moderna
- Cozinha japonesa moderna, por tipo
- Fusão japonesa
- Pratos japoneses contemporâneos
- Cozinha japonesa moderna, por tipo
- Cozinha japonesa moderna, por Restaurant Mode
- Levar
- Entrega ao domicílio
- Jantar no local
- Cozinha japonesa moderna, por estabelecimento
- Serviço rápido
- Restaurantes com serviço completo
- Balcões/pontos de venda para levar
Tipo de serviço
- Restaurantes de serviço rápido (QSR)
- Restaurantes com serviço completo
- Balcões/pontos de venda para levar
Categoria Restaurante
- Restaurantes Independentes
- Modelo de rede/franchising
Modelo de restaurante
- Levar
- Entrega ao domicílio
- Jantar no local
Canal de vendas
- Pontos de venda físicos
- Restaurantes Online de Entrega/Ghost Kitchen
O pacto de tarifas domésticas e rotas comerciais são considerados ao fornecer uma análise de previsão dos dados do país.
Participação no mercado de restaurantes japoneses na América do Norte
O cenário competitivo do mercado fornece detalhes por concorrentes. Os detalhes incluídos são a visão geral da empresa, finanças da empresa, receitas geradas, potencial de mercado, investimento em investigação e desenvolvimento, novas iniciativas de mercado, presença na América do Norte, localizações e instalações de produção, capacidades de produção, pontos fortes e fracos da empresa, lançamento do produto, amplitude e abrangência do produto, domínio da aplicação. Os pontos de dados fornecidos acima estão apenas relacionados com o foco das empresas em relação ao mercado.
Os líderes de mercado de restaurantes japoneses na América do Norte que operam no mercado são:
- Katsu-Ya Group, Inc (EUA)
- Restaurante e bar asiático Wokcano.(EUA),
- 893 Ryōtei Berlim (Alemanha),
- Restaurante Japonês Chiba (EUA)
- Noodles Artesanais Tsujita (Japão)
- Sushi Den (EUA)
- Florilège (Japão)
- Kaiten Zushi (EUA)
- Kura Sushi EUA (EUA)
- Narisawa (Japão)
- RE&S (Singapura)
- Sazenka (Japão)
- Sushi A Go (EUA)
- Sushi Gen Enterprises (EUA)
- Sushi Nozawa Group (EUA)
- Sushiya (Índia)
- Restaurante Takami Sushi & Robata (EUA)
- Tatsu Ramen LLC (EUA)
- Yamashiro Hollywood (EUA)
Últimos desenvolvimentos no mercado de restaurantes japoneses da América do Norte
- Em maio de 2024, o Sushi Den anunciou o relançamento do seu tão aguardado serviço de almoço. Além disso, o OTOTO, a mais recente adição ao Sushi Den e ao Izakaya Den, lançou um delicioso brunch de domingo, das 11h às 14h. A empresa está ansiosa por partilhar este novo capítulo com os seus clientes e aproveitar em conjunto as novas ofertas da estação.
- Em maio de 2024, a Kura Sushi USA lançou uma promoção Bikkura Pon com o tema Dragon Ball Super de 1 de maio a 30 de junho de 2024. A colaboração contou com prémios exclusivos Dragon Ball Super, incluindo porta-chaves em acrílico de edição limitada e pins de esmalte. Um raro porta-chaves do Goku que brilha no escuro estava disponível em quantidades limitadas. De 5 a 9 de junho, os membros do Rewards receberam uma t-shirt gráfica do Dragon Ball Super ao gastarem 70 dólares no restaurante. Um conjunto de garrafas Dragon Ball Super com palhinha e cordão estava disponível por 16,00 dólares a partir de 1 de junho. O sistema de prémios Bikkura Pon recompensou os clientes com prémios temáticos Dragon Ball Super por cada 15 pratos apreciados.
- In December 2023, Kura Sushi USA, Inc. has introduced ecopon, the world’s first plastic-free, biodegradable paper capsule, for its Bikkura Pon prizes. Developed by K2 Station Co., Ltd., Rengo Co., Ltd., and Daiho Industrial Co., Ltd., ecopon capsules are made from starch and paper pulp, reducing CO2 emissions by a third compared to polypropylene. The new capsules will debut with a Peanuts® Bikkura Pon collaboration from Dec. 1, 2024, to Jan. 31, 2025. This initiative reflects Kura Sushi’s commitment to sustainability, following their transition to paper straws and other eco-friendly practices. For more information, visit kurasushi.com/sustainability
- In October 2023, Kura Sushi USA, Inc. has partnered with Peanuts Worldwide LLC for a special Bikkura Pon promotion running from Dec. 1, 2024, to Jan. 31, 2025. Diners can enjoy exclusive Peanuts-themed prizes, including figurine keychains, can badges, and microfiber cloths featuring characters like Snoopy and Charlie Brown. For every 15 sushi plates, guests will receive a Peanuts x Kura Sushi prize, with a rare Snoopy Figurine Keychain available only through the prize system. Rewards Members spending $70 from Jan. 3-7, 2024, will get a Peanuts-inspired cup set. Kura Sushi is also using ecopon’s biodegradable capsules for this promotion
SKU-
Obtenha acesso online ao relatório sobre a primeira nuvem de inteligência de mercado do mundo

- Painel interativo de análise de dados
- Painel de análise da empresa para oportunidades de elevado potencial de crescimento
- Acesso de analista de pesquisa para personalização e customização. consultas
- Análise da concorrência com painel interativo
- Últimas notícias, atualizações e atualizações Análise de tendências
- Aproveite o poder da análise de benchmark para um rastreio abrangente da concorrência
Metodologia de Investigação
A recolha de dados e a análise do ano base são feitas através de módulos de recolha de dados com amostras grandes. A etapa inclui a obtenção de informações de mercado ou dados relacionados através de diversas fontes e estratégias. Inclui examinar e planear antecipadamente todos os dados adquiridos no passado. Da mesma forma, envolve o exame de inconsistências de informação observadas em diferentes fontes de informação. Os dados de mercado são analisados e estimados utilizando modelos estatísticos e coerentes de mercado. Além disso, a análise da quota de mercado e a análise das principais tendências são os principais fatores de sucesso no relatório de mercado. Para saber mais, solicite uma chamada de analista ou abra a sua consulta.
A principal metodologia de investigação utilizada pela equipa de investigação do DBMR é a triangulação de dados que envolve a mineração de dados, a análise do impacto das variáveis de dados no mercado e a validação primária (especialista do setor). Os modelos de dados incluem grelha de posicionamento de fornecedores, análise da linha de tempo do mercado, visão geral e guia de mercado, grelha de posicionamento da empresa, análise de patentes, análise de preços, análise da quota de mercado da empresa, normas de medição, análise global versus regional e de participação dos fornecedores. Para saber mais sobre a metodologia de investigação, faça uma consulta para falar com os nossos especialistas do setor.
Personalização disponível
A Data Bridge Market Research é líder em investigação formativa avançada. Orgulhamo-nos de servir os nossos clientes novos e existentes com dados e análises que correspondem e atendem aos seus objetivos. O relatório pode ser personalizado para incluir análise de tendências de preços de marcas-alvo, compreensão do mercado para países adicionais (solicite a lista de países), dados de resultados de ensaios clínicos, revisão de literatura, mercado remodelado e análise de base de produtos . A análise de mercado dos concorrentes-alvo pode ser analisada desde análises baseadas em tecnologia até estratégias de carteira de mercado. Podemos adicionar quantos concorrentes necessitar de dados no formato e estilo de dados que procura. A nossa equipa de analistas também pode fornecer dados em tabelas dinâmicas de ficheiros Excel em bruto (livro de factos) ou pode ajudá-lo a criar apresentações a partir dos conjuntos de dados disponíveis no relatório.

