
Africa Lab Supplies Market Analysis and Insights
Laboratory equipment supplies are an integral part of every science laboratory in schools and universities. These include tools and equipment which are required for gathering and measuring data for performing various science experiments.
Laboratories requires a variety of equipment and instrumentation to run tests and research. These staple, workhouse general lab equipment can be found across various laboratories across disciplines and markets.
Data Bridge Market Research analyses that the Africa lab supplies market will grow at a CAGR of 8.2% during the forecast period of 2022 to 2030.
|
Report Metric |
Details |
|
Forecast Period |
2022 to 2030 |
|
Base Year |
2021 |
|
Historic Years |
2020 (Customizable to 2019 - 2014) |
|
Quantitative Units |
Revenue in USD Million, Pricing in USD |
|
Segments Covered |
Type (Product Type, Service Type), Service Contract (Standardized, Customized), Service Provider (Original Equipment Manufacturers, Third-Party Agencies), Mode (Automated, Manual), End User (Clinical & Diagnostic Laboratories, Pharmaceutical & Biotechnology Companies, Academic Institutes, and Others), Distribution Channel (Direct Tender, Retail Sales) |
|
Countries Covered |
South Africa, Egypt, Uganda, Kenya, Nigeria, Zambia, Botswana, Namibia and Rest of Africa |
|
Market Players Covered |
Thermo Fisher Scientific Inc. (U.S.), Merck KGaA (Germany), Bio-Rad Laboratories, Inc. (U.S.), PerkinElmer Inc. (U.S.), VITLAB GmbH (Germany), DWK Life Sciences (Germany), Bruker (U.S.), Olympus Corporation (Japan), Beckman Coulter, Inc. (Subsidiary of Danaher Corporation) (U.S.), Agilent Technologies, Inc. (U.S.), Sartorius AG (Germany), Andreas Hettich GmbH & Co. KG (Germany), Eppendorf SE (Germany), LabWare (U.S.), Bellco Glass (U.S.), BRAND GMBH + CO KG (Germany), VWR International, LLC., (U.S.) Montech (South Africa), Anton Paar GmbH (Austria), Shenzhen Mindray Bio-Medical Electronics Co., Ltd. (China), Eurofins Scientific (Germany), and Waters Corporation (U.S.) |
Lab Supplies Market Dynamics
Drivers
- High cases of infectious diseases
South Africa has been facing the burden of HIV and AIDS for the past few decades. The impact of the disease in South Africa is devastating the healthcare system, and the country is failing to combat it. Increasing investment for healthcare infrastructure leading to the heavy requirement for proper diagnostic facilities to improve economic healthcare. Thereby this increases the demand for proper diagnostic supplies in the laboratories to carry out different testing required for better treatment of the diseases in the country.
- Constant demand for lab supplies during COVID-19 pandemic
The COVID-19 pandemic has emerged as one of the most significant humanitarian challenges in recent history, and testing is seen as one of the main components of efforts to contain the virus and mitigate its impact. Such as an outbreak of coronavirus pandemic boosted the demand for lab testing to curb the spread of infections and contain the disease which is fueling up the market growth.
- Poor hygiene, and poor infection control
The country is reported to have a poor-quality healthcare system with poor hygiene and infection control which is considered a major reason for the increase in numerous infectious diseases. The un-sanitary regulations increase the chances of various infectious diseases in the country, thereby raising the requirement of diagnostic labs and facilities to timely diagnose the infections and prevent the spread.
Furthermore, technological advancement in lab equipment, biological and chemical research fields are the factors that will expand the lab supplies market. Other factors such as increase in the volume of life science research investigations and clinical laboratory tests will positively impact the lab supplies market's growth rate. Additionally, rise in the number of testing organisations along with the rise in the biotechnology and pharmaceutical industries will result in the expansion of lab supplies market.
Opportunities
- Government initiatives for better diagnosis
Moreover, numerous programmes developed to evaluate the healthcare delivery in South Africa will boost new opportunities for the market's growth rate.
Also, the rise in the number of clinical trials will provide beneficial opportunities for the lab supplies market in the forecast period of 2022-2030.
Restraints/Challenges
However, shortage of resources for lab equipment and poor quality laboratory services will hamper the growth of the lab supplies market in Africa. Additionally, slow progress in restructuring the healthcare system will further challenge the market in the forecast period mentioned above.
This lab supplies market report provides details of new recent developments, trade regulations, import-export analysis, production analysis, value chain optimization, market share, impact of domestic and localized market players, analyses opportunities in terms of emerging revenue pockets, changes in market regulations, strategic market growth analysis, market size, category market growths, application niches and dominance, product approvals, product launches, geographic expansions, technological innovations in the market. To gain more info on lab supplies market contact Data Bridge Market Research for an Analyst Brief, our team will help you take an informed market decision to achieve market growth.
COVID-19 Impact on Lab Supplies Market
The COVID-19 has positively affected the market. On March 11, 2020, Covid-19 was formally declared a pandemic. The COVID-19 pandemic has resulted in unprecedented demand for healthcare resources since then.
The growing local prevalence of COVID-19 had a significant impact on laboratory services and equipment. While the volume of laboratory tests related to COVID-19 diagnostics and management increased, including some with limited evidence to support their use, overall testing volumes decreased significantly. Thereby the increase in the demand of the lab supplies. Various manufacturers have taken several measures to adjust to the newfound demand for COVID-19.
Recent Development
- In April 2020, Bio-Rad Laboratories, Inc. officially announced that it acquired Celsee, Inc., that provides instruments for analysis of cells and help in the diagnosis. This acquisition created an opportunity for both of them to launch new products which will improve the product portfolio of the company
Africa Lab Supplies Market Scope
The lab supplies market is segmented on the basis of on type, service contract, service provider, mode, end-user, and distribution channel. The growth amongst these segments will help you analyse meager growth segments in the industries and provide the users with a valuable market overview and market insights to help them make strategic decisions for identifying core market applications.
Type
- Product Type
- Service Type
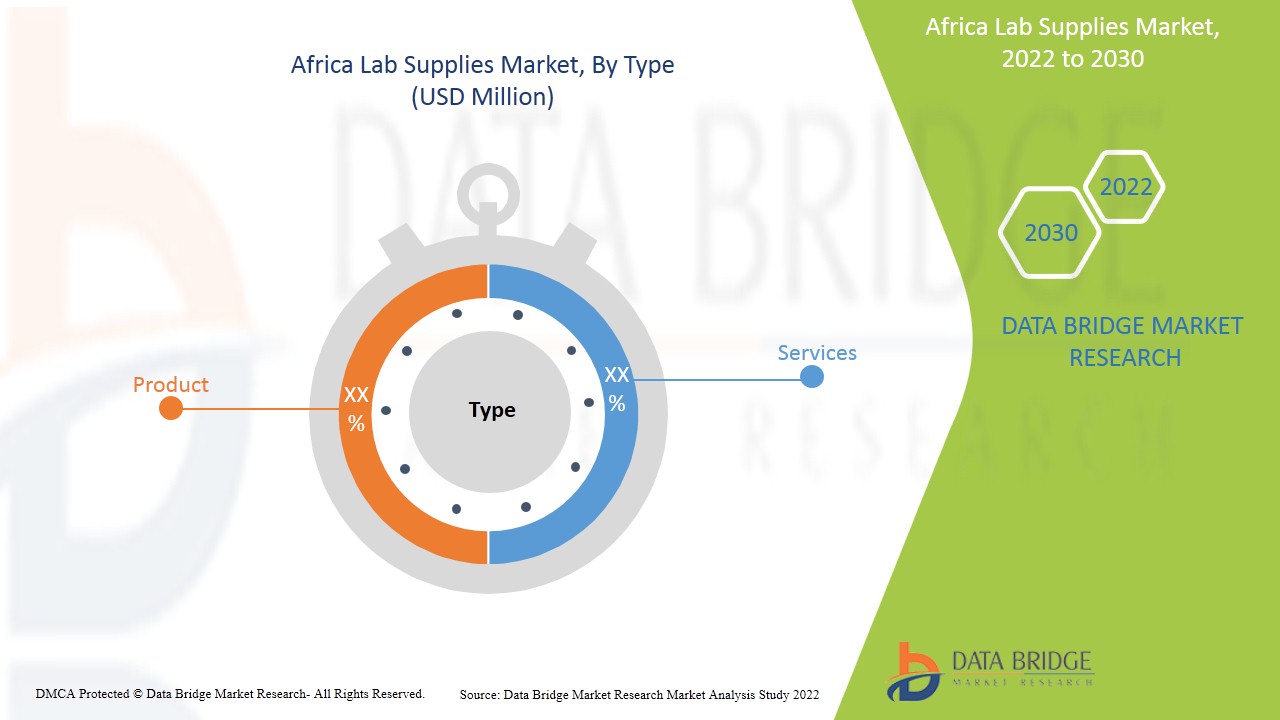
On the basis of type, the Africa lab supplies market is segmented into product type and service type.
Service Contract
- Standardized
- Customized
On the basis of service contract, the Africa lab supplies market is segmented into standardized and customized.
Service Provider
- Original Equipment Manufacturers
- Third-Party Agencies
On the basis of service provider, the Africa lab supplies market is segmented into original equipment manufacturers, third-party agencies.
Mode
- Automated
- Manual
On the basis of mode, the Africa lab supplies market is segmented into automated and manual.
End User
- Clinical & Diagnostic Laboratories
- Pharmaceutical & Biotechnology Companies
- Academic Institutes
- Others
On the basis of end user, the Africa lab supplies market is segmented into clinical & diagnostic laboratories, pharmaceutical & biotechnology companies, academic institutes, and others.
Distribution Channel
- Direct Tender
- Retail Sales
On the basis of distribution channel, the Africa lab supplies market is segmented into direct tender and retail sales.
Lab Supplies Market Regional Analysis/Insights
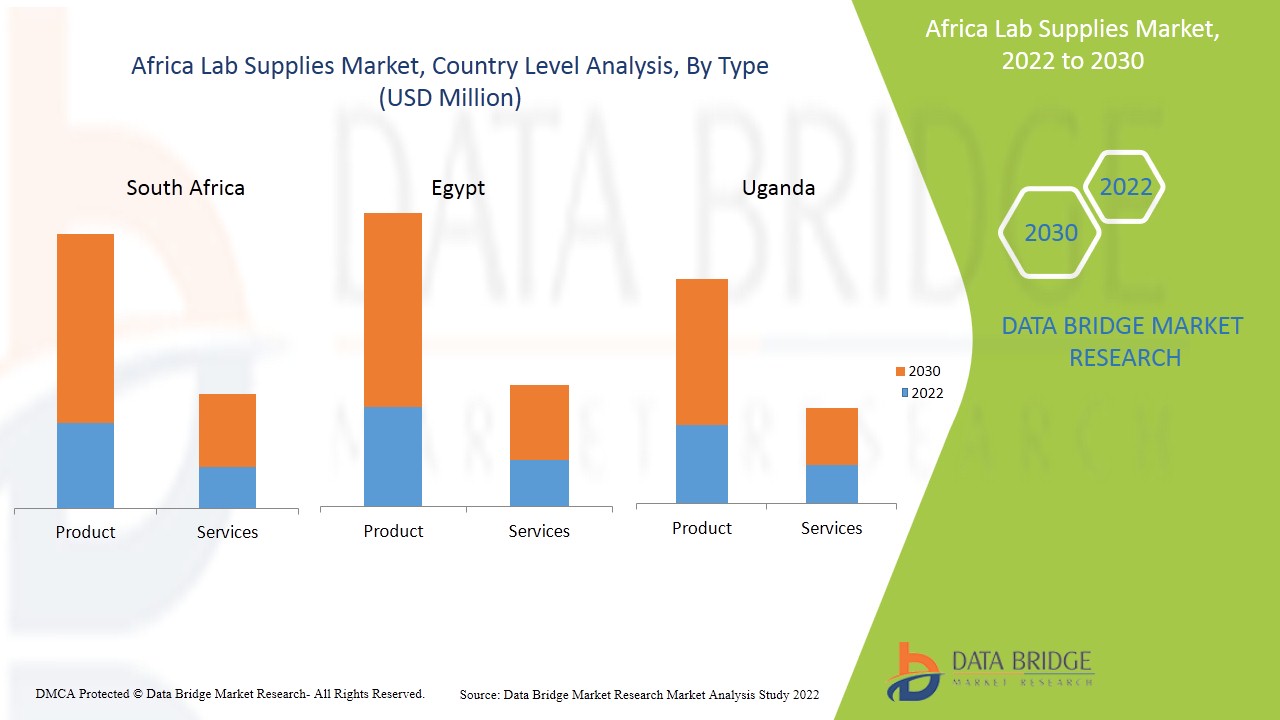
The lab supplies market is analysed and market size insights and trends are provided by country, type, service contract, service provider, mode, end-user and distribution channel as referenced above.
The countries covered in the lab supplies market report are South Africa, Egypt, Uganda, Kenya, Nigeria, Zambia, Botswana, Namibia and rest of Africa.
- In 2022, South Africa lab supplies market is expected to dominate due to factors such as having the most laboratories and the highest health spending per person.
The country section of the report also provides individual market impacting factors and changes in regulations in the market domestically that impacts the current and future trends of the market. Data points such as new sales, replacement sales, country demographics, disease epidemiology and import-export tariffs are some of the major pointers used to forecast the market scenario for individual countries. Also, presence and availability of Africa brands and their challenges faced due to large or scarce competition from local and domestic brands, impact of sales channels are considered while providing forecast analysis of the country data.
Competitive Landscape and Lab Supplies Market Share Analysis
The lab supplies market competitive landscape provides details by competitor. Details included are company overview, company financials, revenue generated, market potential, investment in research and development, new market initiatives, Africa presence, production sites and facilities, production capacities, company strengths and weaknesses, product launch, product width and breadth, application dominance. The above data points provided are only related to the companies' focus related to lab supplies market.
Some of the major players operating in the lab supplies market are Thermo Fisher Scientific Inc., Merck KGaA, Bio-Rad Laboratories, Inc., PerkinElmer Inc., VITLAB GmbH, DWK Life Sciences, Bruker, Olympus Corporation, Beckman Coulter, Inc. (Subsidiary of Danaher Corporation), Agilent Technologies, Inc., Sartorius AG, Andreas Hettich GmbH & Co. KG, Eppendorf SE, LabWare, Bellco Glass, BRAND GMBH + CO KG, VWR International, LLC., Montech, Anton Paar GmbH, Shenzhen Mindray Bio-Medical Electronics Co., Ltd., Eurofins Scientific, and Waters Corporation among others.
SKU-

- Interactive Data Analysis Dashboard
- Company Analysis Dashboard for high growth potential opportunities
- Research Analyst Access for customization & queries
- Competitor Analysis with Interactive dashboard
- Latest News, Updates & Trend analysis
- Harness the Power of Benchmark Analysis for Comprehensive Competitor Tracking
Table of Content
1 INTRODUCTION
1.1 OBJECTIVES OF THE STUDY
1.2 MARKET DEFINITION
1.3 OVERVIEW OF AFRICA LAB SUPPLIES MARKET
1.4 LIMITATIONS
1.5 MARKETS COVERED
2 MARKET SEGMENTATION
2.1 MARKETS COVERED
2.2 GEOGRAPHICAL SCOPE
2.3 YEARS CONSIDERED FOR THE STUDY
2.4 CURRENCY AND PRICING
2.5 DBMR TRIPOD DATA VALIDATION MODEL
2.6 MULTIVARIATE MODELLING
2.7 PRODUCT LIFELINE CURVE
2.8 PRIMARY INTERVIEWS WITH KEY OPINION LEADERS
2.9 DBMR MARKET POSITION GRID
2.1 MARKET END USER COVERAGE GRID
2.11 VENDOR SHARE ANALYSIS
2.12 SECONDARY SOURCES
2.13 ASSUMPTIONS
3 EXECUTIVE SUMMARY
4 PREMIUM INSIGHTS
4.1 PESTEL'S
4.2 PORTER'S 5 FORCES
5 REGULATORY GUIDELINES, AFRICA LAB SUPPLIES MARKET
6 MARKET OVERVIEW: AFRICA LAB SUPPLIES MARKET
6.1 DRIVERS
6.1.1 HIGH CASES OF INFECTIOUS DISEASES
6.1.2 CONSTANT DEMAND FOR LAB SUPPLIES DURING COVID-19 PANDEMIC
6.1.3 POOR HYGIENE, AND POOR INFECTION CONTROL
6.2 RESTRAINT
6.2.1 SHORTAGES OF RESOURCES FOR LAB EQUIPMENT
6.2.2 POOR QUALITY LABORATORY SERVICES
6.3 OPPORTUNITIES
6.3.1 GOVERNMENT INITIATIVES FOR BETTER DIAGNOSIS
6.3.2 PROGRAMMES DEVELOPED TO EVALUATE HEALTHCARE DELIVERY
6.3.3 GROW IN NUMBER OF CLINICAL TRIALS
6.4 CHALLENGE
6.4.1 SLOW PROGRESS IN RESTRUCTURING THE HEALTHCARE SYSTEM
7 AFRICA LAB SUPPLIES MARKET, BY TYPE
7.1 OVERVIEW
7.1.1 PRODUCT
7.1.1.1 GENERAL EQUIPMENT
7.1.1.1.1 SCOPES
7.1.1.1.2 CENTRIFUGE
7.1.1.1.3 LABORATORY HOODS
7.1.1.1.4 INCUBATORS
7.1.1.1.5 AUTOCLAVE
7.1.1.1.6 PIPETTES
7.1.1.1.7 FREEZERS
7.1.1.1.8 MICROWAVE
7.1.1.1.9 HOMOGENIZER
7.1.1.1.10 SHAKERS AND LABORATORY MIXER
7.1.1.1.11 SONICATORS
7.1.1.1.12 BUNSEN BURNER
7.1.1.1.13 STEAM GENERATORS
7.1.1.1.14 STERILIZERS
7.1.1.1.15 MICRO MANIPULATION SYSTEMS
7.1.1.1.16 WATER BATH
7.1.1.1.17 COOLERS
7.1.1.1.18 OTHERS
7.1.1.2 ANALYTICAL EQUIPMENT
7.1.1.2.1 SPECTROMETER
7.1.1.2.1.1 MASS SPECTROMETER
7.1.1.2.1.2 INFRARED SPECTROMETER
7.1.1.2.1.3 FLUORESCENCE SPECTROMETER
7.1.1.2.1.4 OTHERS
7.1.1.2.2 CHROMATOGRAPHY EQUIPMENT
7.1.1.2.2.1 LIQUID CHROMATOGRAPHY EQUIPMENT
7.1.1.2.2.2 GAS CHROMATOGRAPHY EQUIPMENT
7.1.1.2.2.3 OTHERS
7.1.1.2.3 ANALYZER
7.1.1.2.3.1 ELEMENTAL ANALYZERS
7.1.1.2.3.2 PARTICLE SIZE ANALYZERS
7.1.1.2.3.3 OTHERS
7.1.1.2.4 SAMPLE PREPARATION SYSTEM
7.1.1.2.5 TITRATORS
7.1.1.2.6 RHEOMETERS
7.1.1.2.7 FLOW INJECTION SYSTEM
7.1.1.2.8 OTHERS
7.1.1.3 SUPPORT EQUIPMENT
7.1.1.3.1 CELL HARVESTERS
7.1.1.3.2 MICROPLATE READERS
7.1.1.3.3 RADIOMETRIC DETECTORS
7.1.1.3.4 OTHERS
7.1.1.4 SPECIALTY EQUIPMENT
7.1.1.4.1 CELL IMAGING DEVICES
7.1.1.4.2 CYTOGENETICS INSTRUMENTS
7.1.1.4.3 POLARIMETERS
7.1.1.4.4 LASER SYSTEMS
7.1.1.4.5 LABORATORY EVAPORATORS
7.1.1.4.6 MEMBRANE FILTRATION SYSTEMS
7.1.1.4.7 OTHERS
7.1.1.5 OTHERS
7.1.1.5.1 CONSUMABLES
7.1.1.5.1.1 MICROFLUIDIC CHIPS
7.1.1.5.1.2 SAMPLE PREPARATION SUPPLIES
7.1.1.5.1.3 PIPETTES & DISPOSABLE TIPS
7.1.1.5.1.4 PUMPS & PUMP KITS
7.1.1.5.1.5 MASKS
7.1.1.5.1.6 BENCHES & ACCESSORY CARTS
7.1.1.5.1.7 GLOVES
7.1.1.5.1.8 REAGENTS
7.1.1.5.1.9 STATER KITS AND ASSAYS
7.1.1.5.1.10 VIALS, CAPS, & SEPTAINJECTOR LINERS
7.1.1.5.1.11 SAMPLE INTRODUCTION COMPONENTS & KITS
7.1.1.5.1.12 PETRI DISHES
7.1.1.5.1.13 FITTINGS, FERRULES & CONNECTORS
7.1.1.5.1.14 TRAPS
7.1.1.5.1.15 PCR TUBES
7.1.1.5.1.16 CENTRIFUGE TUBES
7.1.1.5.1.17 STORAGE BOXES
7.1.1.5.1.18 OTHERS
7.1.1.5.2 ACCESSORIES
7.1.1.5.2.1 FILTERS & FILTRATION PRODUCTS
7.1.1.5.2.2 CARTRIDGE FILTERS
7.1.1.5.2.3 OTHERS
7.1.1.5.2.4 DISPENSERS
7.1.1.5.2.5 CASSETTES
7.1.1.5.2.6 PRESSES & CRIMPERS
7.1.1.5.2.7 COMBUSTION AND REDUCTION TUBES
7.1.1.5.2.8 PROBES
7.1.1.5.2.9 NEBULIZER SYSTEMS
7.1.1.5.2.10 FLOW INJECTION SUPPLIES
7.1.1.5.2.11 FILAMENTS
7.1.1.5.2.12 COUPLERS
7.1.1.5.2.13 OTHERS
7.1.2 SERVICES
7.1.2.1 REPAIR AND MAINTENANCE SERVICES
7.1.2.2 CALIBRATION SERVICES
7.1.2.3 VALIDATION SERVICES
7.1.2.4 OTHERS
8 AFRICA LAB SUPPLIES MARKET, BY SERVICE CONTRACT
8.1 OVERVIEW
8.2 STANDARDIZED
8.3 CUSTOMIZED
9 AFRICA LAB SUPPLIES MARKET, BY SERVICE PROVIDER
9.1 OVERVIEW
9.2 THIRD-PARTY AGENCIES
9.3 ORIGINAL EQUIPMENT MANUFACTURERS
10 AFRICA LAB SUPPLIES MARKET, BY MODE
10.1 OVERVIEW
10.2 AUTOMATED
10.3 MANUAL
11 AFRICA LAB SUPPLIES MARKET, BY END USER
11.1 OVERVIEW
11.2 CLINICAL & DIAGNOSTIC LABORATORIES
11.3 PHARMACEUTICAL & BIOTECHNOLOGY COMPANIES
11.4 ACADEMIC INSTITUTES
11.5 OTHERS
12 AFRICA LAB SUPPLIES MARKET DISEASE MARKET, BY DISTRIBUTION CHANNEL
12.1 OVERVIEW
12.2 DIRECT TENDER
12.3 RETAIL SALES
13 AFRICA LAB SUPPLIES MARKET, BY COUNTRY
13.1 SOUTH AFRICA
13.2 EGYPT
13.3 UGANDA
13.4 KENYA
13.5 NIGERIA
13.6 ZAMBIA
13.7 BOTSWANA
13.8 NAMIBIA
13.9 REST OF AFRICA
14 AFRICA LAB SUPPLIES MARKET: COMPANY LANDSCAPE
14.1 COMPANY SHARE ANALYSIS: AFRICA
15 COMPANY PROFILE
15.1 BECKMAN COULTER, INC. (SUBSIDIARY OF DANAHER CORPORATION)
15.1.1 COMPANY SNAPSHOT
15.1.2 REVENUE ANALYSIS
15.1.3 PRODUCT PORTFOLIO
15.1.4 RECENT DEVELOPMENT
15.2 AGILENT TECHNOLOGIES, INC.
15.2.1 COMPANY SNAPSHOT
15.2.2 REVENUE ANALYSIS
15.2.3 PRODUCT PORTFOLIO
15.2.4 RECENT DEVELOPMENT
15.2.4.1 ACQUISITION
15.3 SARTORIUS AG
15.3.1 COMPANY SNAPSHOT
15.3.2 REVENUE ANALYSIS
15.3.3 PRODUCT PORTFOLIO
15.3.4 RECENT DEVELOPMENT
15.3.4.1 ACQUISITION
15.4 EPPENDORF SE
15.4.1 COMPANY SNAPSHOT
15.4.2 PRODUCT PORTFOLIO
15.4.3 RECENT DEVELOPMENTS
15.4.4 ACQUISITION
15.4.4.1 CERTIFICATION
15.5 VWR INTERNATIONAL, LLC.
15.5.1 COMPANY SNAPSHOT
15.5.2 REVENUE ANALYSIS
15.5.3 PRODUCT PORTFOLIO
15.5.4 RECENT DEVELOPMENT
15.6 ANDREAS HETTICH GMBH & CO. KG
15.6.1 COMPANY SNAPSHOT
15.6.2 PRODUCT PORTFOLIO
15.6.3 RECENT DEVELOPMENT
15.7 ANTON PAAR GMBH
15.7.1 COMPANY SNAPSHOT
15.7.2 PRODUCT PORTFOLIO
15.7.3 RECENT DEVELOPMENT
15.8 BELLCO GLASS
15.8.1 COMPANY SNAPSHOT
15.8.2 PRODUCT PORTFOLIO
15.8.3 RECENT DEVELOPMENT
15.9 BIO-RAD LABORATORIES, INC.
15.9.1 COMPANY SNAPSHOT
15.9.2 REVENUE ANALYSIS
15.9.3 PRODUCT PORTFOLIO
15.9.4 RECENT DEVELOPMENTS
15.9.4.1 ACQUISITION
15.9.4.2 PARTNERSHIP
15.9.4.3 FDA APPROVAL
15.1 BRAND GMBH + CO KG
15.10.1 COMPANY SNAPSHOT
15.10.2 PRODUCT PORTFOLIO
15.10.3 RECENT DEVELOPMENT
15.11 BRUKER
15.11.1 COMPANY SNAPSHOT
15.11.2 REVENUE ANALYSIS
15.11.3 PRODUCT PORTFOLIO
15.11.4 RECENT DEVELOPMENT
15.12 DWK LIFE SCIENCES
15.12.1 COMPANY SNAPSHOT
15.12.2 PRODUCT PORTFOLIO
15.12.3 RECENT DEVELOPMENT
15.13 EUROFINS SCIENTIFIC
15.13.1 COMPANY SNAPSHOT
15.13.2 REVENUE ANALYSIS
15.13.3 PRODUCT PORTFOLIO
15.13.4 RECENT DEVELOPMENTS
15.13.4.1 ACQUISITION
15.14 LABWARE
15.14.1 COMPANY SNAPSHOT
15.14.2 PRODUCT PORTFOLIO
15.14.3 RECENT DEVELOPMENT
15.15 MERCK KGAA
15.15.1 COMPANY SNAPSHOT
15.15.2 REVENUE ANALYSIS
15.15.3 PRODUCT PORTFOLIO
15.15.4 RECENT DEVELOPMENT
15.16 MONTECH
15.16.1 COMPANY SNAPSHOT
15.16.2 PRODUCT PORTFOLIO
15.16.3 RECENT DEVELOPMENT
15.17 OLYMPUS CORPORATION
15.17.1 COMPANY SNAPSHOT
15.17.2 REVENUE ANALYSIS
15.17.3 PRODUCT PORTFOLIO
15.17.4 RECENT DEVELOPMENT
15.17.4.1 ACQUISITION
15.18 PERKINELMER INC.
15.18.1 COMPANY SNAPSHOT
15.18.2 REVENUE ANALYSIS
15.18.3 PRODUCT PORTFOLIO
15.18.4 RECENT DEVELOPMENT
15.18.4.1 PRODUCT LAUNCH
15.19 SHENZHEN MINDRAY BIO-MEDICAL ELECTRONICS CO., LTD.
15.19.1 COMPANY SNAPSHOT
15.19.2 PRODUCT PORTFOLIO
15.19.3 RECENT DEVELOPMENT
15.2 THERMO FISHER SCIENTIFIC INC.
15.20.1 COMPANY SNAPSHOT
15.20.2 REVENUE ANALYSIS
15.20.3 PRODUCT PORTFOLIO
15.20.4 RECENT DEVELOPMENT
15.20.4.1 COLLABORATION
15.21 VITLAB GMBH
15.21.1 COMPANY SNAPSHOT
15.21.2 PRODUCT PORTFOLIO
15.21.3 RECENT DEVELOPMENT
15.21.3.1 PRODUCT PATENTED
15.22 WATERS CORPORATION
15.22.1 COMPANY SNAPSHOT
15.22.2 REVENUE ANALYSIS
15.22.3 PRODUCT PORTFOLIO
15.22.4 RECENT DEVELOPMENT
16 QUESTIONNAIRE
17 RELATED REPORTS
List of Table
TABLE 1 AFRICA LAB SUPPLIES MARKET, BY TYPE, 2020-2030 (USD MILLION)
TABLE 2 AFRICA PRODUCT IN LAB SUPPLIES MARKET, BY TYPE, 2020-2030 (USD MILLION)
TABLE 3 AFRICA GENERAL EQUIPMENT IN LAB SUPPLIES MARKET, BY TYPE, 2020-2030 (USD MILLION)
TABLE 4 AFRICA ANALYTICAL EQUIPMENT IN LAB SUPPLIES MARKET, BY TYPE, 2020-2030 (USD MILLION)
TABLE 5 AFRICA SPECTROMETER IN LAB SUPPLIES MARKET, BY TYPE, 2020-2030 (USD MILLION)
TABLE 6 AFRICA CHROMATOGRAPHY EQUIPMENT IN LAB SUPPLIES MARKET, BY TYPE, 2020-2030 (USD MILLION)
TABLE 7 AFRICA ANALYZER IN LAB SUPPLIES MARKET, BY TYPE, 2020-2030 (USD MILLION)
TABLE 8 AFRICA SUPPORT EQUIPMENT IN LAB SUPPLIES MARKET, BY TYPE, 2020-2030 (USD MILLION)
TABLE 9 AFRICA SPECIALTY EQUIPMENT IN LAB SUPPLIES MARKET, BY TYPE, 2020-2030 (USD MILLION)
TABLE 10 AFRICA OTHERS IN LAB SUPPLIES MARKET, BY TYPE, 2020-2030 (USD MILLION)
TABLE 11 AFRICA CONSUMABLES IN LAB SUPPLIES MARKET, BY TYPE, 2020-2030 (USD MILLION)
TABLE 12 AFRICA ACCESSORIES IN LAB SUPPLIES MARKET, BY TYPE, 2020-2030 (USD MILLION)
TABLE 13 AFRICA FILTERS & FILTRATION PRODUCTS IN LAB SUPPLIES MARKET, BY TYPE, 2020-2030 (USD MILLION)
TABLE 14 AFRICA SERVICES IN LAB SUPPLIES MARKET, BY TYPE, 2020-2030 (USD MILLION)
TABLE 15 AFRICA LAB SUPPLIES MARKET, BY SERVICE CONTRACT, 2020-2030 (USD MILLION)
TABLE 16 AFRICA LAB SUPPLIES MARKET, BY SERVICE PROVIDER, 2020-2030 (USD MILLION)
TABLE 17 AFRICA LAB SUPPLIES MARKET, BY MODE, 2020-2030 (USD MILLION)
TABLE 18 AFRICA LAB SUPPLIES MARKET, BY END USER, 2020-2030 (USD MILLION)
TABLE 19 AFRICA LAB SUPPLIES MARKET, BY DISTRIBUTION CHANNEL, 2020-2030 (USD MILLION)
TABLE 20 AFRICA LAB SUPPLIES MARKET, BY COUNTRY, 2020-2030 (USD MILLION)
TABLE 21 SOUTH AFRICA LAB SUPPLIES MARKET, BY TYPE, 2020-2030 (USD MILLION)
TABLE 22 SOUTH AFRICA PRODUCT IN LAB SUPPLIES MARKET, BY TYPE, 2020-2030 (USD MILLION)
TABLE 23 SOUTH AFRICA GENERAL EQUIPMENT IN LAB SUPPLIES MARKET, BY TYPE, 2020-2030 (USD MILLION)
TABLE 24 SOUTH AFRICA SUPPORT EQUIPMENT IN LAB SUPPLIES MARKET, BY TYPE, 2020-2030 (USD MILLION)
TABLE 25 SOUTH AFRICA SPECIALTY EQUIPMENT IN LAB SUPPLIES MARKET, BY TYPE, 2020-2030 (USD MILLION)
TABLE 26 SOUTH AFRICA ANALYTICAL EQUIPMENT IN LAB SUPPLIES MARKET, BY TYPE, 2020-2030 (USD MILLION)
TABLE 27 SOUTH AFRICA SPECTROMETER IN LAB SUPPLIES MARKET, BY TYPE, 2020-2030 (USD MILLION)
TABLE 28 SOUTH AFRICA ANALYZER IN LAB SUPPLIES MARKET, BY TYPE, 2020-2030 (USD MILLION)
TABLE 29 SOUTH AFRICA CHROMATOGRAPHY EQUIPMENT IN LAB SUPPLIES MARKET, BY TYPE, 2020-2030 (USD MILLION)
TABLE 30 SOUTH AFRICA OTHERS IN LAB SUPPLIES MARKET, BY TYPE, 2020-2030 (USD MILLION)
TABLE 31 SOUTH AFRICA CONSUMABLES IN LAB SUPPLIES MARKET, BY TYPE, 2020-2030 (USD MILLION)
TABLE 32 SOUTH AFRICA ACCESSORIES IN LAB SUPPLIES MARKET, BY TYPE, 2020-2030 (USD MILLION)
TABLE 33 SOUTH AFRICA FILTERS & FILTRATION PRODUCTS IN LAB SUPPLIES MARKET, BY TYPE, 2020-2030 (USD MILLION)
TABLE 34 SOUTH AFRICA SERVICES IN AFRICA LAB SUPPLIES MARKET, BY TYPE, 2020-2030 (USD MILLION)
TABLE 35 SOUTH AFRICA LAB SUPPLIES MARKET, BY SERVICE CONTRACT, 2020-2030 (USD MILLION)
TABLE 36 SOUTH AFRICA LAB SUPPLIES MARKET, BY SERVICE PROVIDER, 2020-2030 (USD MILLION)
TABLE 37 SOUTH AFRICA LAB SUPPLIES MARKET, BY MODE, 2020-2030 (USD MILLION)
TABLE 38 SOUTH AFRICA LAB SUPPLIES MARKET, BY END USER, 2020-2030 (USD MILLION)
TABLE 39 SOUTH AFRICA LAB SUPPLIES MARKET, BY DISTRIBUTION CHANNEL, 2020-2030 (USD MILLION)
TABLE 40 EGYPT LAB SUPPLIES MARKET, BY TYPE, 2020-2030 (USD MILLION)
TABLE 41 EGYPT PRODUCT IN LAB SUPPLIES MARKET, BY TYPE, 2020-2030 (USD MILLION)
TABLE 42 EGYPT GENERAL EQUIPMENT IN LAB SUPPLIES MARKET, BY TYPE, 2020-2030 (USD MILLION)
TABLE 43 EGYPT SUPPORT EQUIPMENT IN LAB SUPPLIES MARKET, BY TYPE, 2020-2030 (USD MILLION)
TABLE 44 EGYPT SPECIALTY EQUIPMENT IN LAB SUPPLIES MARKET, BY TYPE, 2020-2030 (USD MILLION)
TABLE 45 EGYPT ANALYTICAL EQUIPMENT IN LAB SUPPLIES MARKET, BY TYPE, 2020-2030 (USD MILLION)
TABLE 46 EGYPT SPECTROMETER IN LAB SUPPLIES MARKET, BY TYPE, 2020-2030 (USD MILLION)
TABLE 47 EGYPT ANALYZER IN LAB SUPPLIES MARKET, BY TYPE, 2020-2030 (USD MILLION)
TABLE 48 EGYPT CHROMATOGRAPHY EQUIPMENT IN LAB SUPPLIES MARKET, BY TYPE, 2020-2030 (USD MILLION)
TABLE 49 EGYPT OTHERS IN LAB SUPPLIES MARKET, BY TYPE, 2020-2030 (USD MILLION)
TABLE 50 EGYPT CONSUMABLES IN LAB SUPPLIES MARKET, BY TYPE, 2020-2030 (USD MILLION)
TABLE 51 EGYPT ACCESSORIES IN LAB SUPPLIES MARKET, BY TYPE, 2020-2030 (USD MILLION)
TABLE 52 EGYPT FILTERS & FILTRATION PRODUCTS IN LAB SUPPLIES MARKET, BY TYPE, 2020-2030 (USD MILLION)
TABLE 53 EGYPT SERVICES IN AFRICA LAB SUPPLIES MARKET, BY TYPE, 2020-2030 (USD MILLION)
TABLE 54 EGYPT LAB SUPPLIES MARKET, BY SERVICE CONTRACT, 2020-2030 (USD MILLION)
TABLE 55 EGYPT LAB SUPPLIES MARKET, BY SERVICE PROVIDER, 2020-2030 (USD MILLION)
TABLE 56 EGYPT LAB SUPPLIES MARKET, BY MODE, 2020-2030 (USD MILLION)
TABLE 57 EGYPT LAB SUPPLIES MARKET, BY END USER, 2020-2030 (USD MILLION)
TABLE 58 EGYPT LAB SUPPLIES MARKET, BY DISTRIBUTION CHANNEL, 2020-2030 (USD MILLION)
TABLE 59 UGANDA LAB SUPPLIES MARKET, BY TYPE, 2020-2030 (USD MILLION)
TABLE 60 UGANDA PRODUCT IN LAB SUPPLIES MARKET, BY TYPE, 2020-2030 (USD MILLION)
TABLE 61 UGANDA GENERAL EQUIPMENT IN LAB SUPPLIES MARKET, BY TYPE, 2020-2030 (USD MILLION)
TABLE 62 UGANDA SUPPORT EQUIPMENT IN LAB SUPPLIES MARKET, BY TYPE, 2020-2030 (USD MILLION)
TABLE 63 UGANDA SPECIALTY EQUIPMENT IN LAB SUPPLIES MARKET, BY TYPE, 2020-2030 (USD MILLION)
TABLE 64 UGANDA ANALYTICAL EQUIPMENT IN LAB SUPPLIES MARKET, BY TYPE, 2020-2030 (USD MILLION)
TABLE 65 UGANDA SPECTROMETER IN LAB SUPPLIES MARKET, BY TYPE, 2020-2030 (USD MILLION)
TABLE 66 UGANDA ANALYZER IN LAB SUPPLIES MARKET, BY TYPE, 2020-2030 (USD MILLION)
TABLE 67 UGANDA CHROMATOGRAPHY EQUIPMENT IN LAB SUPPLIES MARKET, BY TYPE, 2020-2030 (USD MILLION)
TABLE 68 UGANDA OTHERS IN LAB SUPPLIES MARKET, BY TYPE, 2020-2030 (USD MILLION)
TABLE 69 UGANDA CONSUMABLES IN LAB SUPPLIES MARKET, BY TYPE, 2020-2030 (USD MILLION)
TABLE 70 UGANDA ACCESSORIES IN LAB SUPPLIES MARKET, BY TYPE, 2020-2030 (USD MILLION)
TABLE 71 UGANDA FILTERS & FILTRATION PRODUCTS IN LAB SUPPLIES MARKET, BY TYPE, 2020-2030 (USD MILLION)
TABLE 72 UGANDA SERVICES IN AFRICA LAB SUPPLIES MARKET, BY TYPE, 2020-2030 (USD MILLION)
TABLE 73 UGANDA LAB SUPPLIES MARKET, BY SERVICE CONTRACT, 2020-2030 (USD MILLION)
TABLE 74 UGANDA LAB SUPPLIES MARKET, BY SERVICE PROVIDER, 2020-2030 (USD MILLION)
TABLE 75 UGANDA LAB SUPPLIES MARKET, BY MODE, 2020-2030 (USD MILLION)
TABLE 76 UGANDA LAB SUPPLIES MARKET, BY END USER, 2020-2030 (USD MILLION)
TABLE 77 UGANDA LAB SUPPLIES MARKET, BY DISTRIBUTION CHANNEL, 2020-2030 (USD MILLION)
TABLE 78 KENYA LAB SUPPLIES MARKET, BY TYPE, 2020-2030 (USD MILLION)
TABLE 79 KENYA PRODUCT IN LAB SUPPLIES MARKET, BY TYPE, 2020-2030 (USD MILLION)
TABLE 80 KENYA GENERAL EQUIPMENT IN LAB SUPPLIES MARKET, BY TYPE, 2020-2030 (USD MILLION)
TABLE 81 KENYA SUPPORT EQUIPMENT IN LAB SUPPLIES MARKET, BY TYPE, 2020-2030 (USD MILLION)
TABLE 82 KENYA SPECIALTY EQUIPMENT IN LAB SUPPLIES MARKET, BY TYPE, 2020-2030 (USD MILLION)
TABLE 83 KENYA ANALYTICAL EQUIPMENT IN LAB SUPPLIES MARKET, BY TYPE, 2020-2030 (USD MILLION)
TABLE 84 KENYA SPECTROMETER IN LAB SUPPLIES MARKET, BY TYPE, 2020-2030 (USD MILLION)
TABLE 85 KENYA ANALYZER IN LAB SUPPLIES MARKET, BY TYPE, 2020-2030 (USD MILLION)
TABLE 86 KENYA CHROMATOGRAPHY EQUIPMENT IN LAB SUPPLIES MARKET, BY TYPE, 2020-2030 (USD MILLION)
TABLE 87 KENYA OTHERS IN LAB SUPPLIES MARKET, BY TYPE, 2020-2030 (USD MILLION)
TABLE 88 KENYA CONSUMABLES IN LAB SUPPLIES MARKET, BY TYPE, 2020-2030 (USD MILLION)
TABLE 89 KENYA ACCESSORIES IN LAB SUPPLIES MARKET, BY TYPE, 2020-2030 (USD MILLION)
TABLE 90 KENYA FILTERS & FILTRATION PRODUCTS IN LAB SUPPLIES MARKET, BY TYPE, 2020-2030 (USD MILLION)
TABLE 91 KENYA SERVICES IN AFRICA LAB SUPPLIES MARKET, BY TYPE, 2020-2030 (USD MILLION)
TABLE 92 KENYA LAB SUPPLIES MARKET, BY SERVICE CONTRACT, 2020-2030 (USD MILLION)
TABLE 93 KENYA LAB SUPPLIES MARKET, BY SERVICE PROVIDER, 2020-2030 (USD MILLION)
TABLE 94 KENYA LAB SUPPLIES MARKET, BY MODE, 2020-2030 (USD MILLION)
TABLE 95 KENYA LAB SUPPLIES MARKET, BY END USER, 2020-2030 (USD MILLION)
TABLE 96 KENYA LAB SUPPLIES MARKET, BY DISTRIBUTION CHANNEL, 2020-2030 (USD MILLION)
TABLE 97 NIGERIA LAB SUPPLIES MARKET, BY TYPE, 2020-2030 (USD MILLION)
TABLE 98 NIGERIA PRODUCT IN LAB SUPPLIES MARKET, BY TYPE, 2020-2030 (USD MILLION)
TABLE 99 NIGERIA GENERAL EQUIPMENT IN LAB SUPPLIES MARKET, BY TYPE, 2020-2030 (USD MILLION)
TABLE 100 NIGERIA SUPPORT EQUIPMENT IN LAB SUPPLIES MARKET, BY TYPE, 2020-2030 (USD MILLION)
TABLE 101 NIGERIA SPECIALTY EQUIPMENT IN LAB SUPPLIES MARKET, BY TYPE, 2020-2030 (USD MILLION)
TABLE 102 NIGERIA SPECIALTY EQUIPMENT IN LAB SUPPLIES MARKET, BY TYPE, 2020-2030 (USD MILLION)
TABLE 103 NIGERIA SPECTROMETER IN LAB SUPPLIES MARKET, BY TYPE, 2020-2030 (USD MILLION)
TABLE 104 NIGERIA ANALYZER IN LAB SUPPLIES MARKET, BY TYPE, 2020-2030 (USD MILLION)
TABLE 105 NIGERIA CHROMATOGRAPHY EQUIPMENT IN LAB SUPPLIES MARKET, BY TYPE, 2020-2030 (USD MILLION)
TABLE 106 NIGERIA OTHERS IN LAB SUPPLIES MARKET, BY TYPE, 2020-2030 (USD MILLION)
TABLE 107 NIGERIA CONSUMABLES IN LAB SUPPLIES MARKET, BY TYPE, 2020-2030 (USD MILLION)
TABLE 108 NIGERIA ACCESSORIES IN LAB SUPPLIES MARKET, BY TYPE, 2020-2030 (USD MILLION)
TABLE 109 NIGERIA FILTERS & FILTRATION PRODUCTS IN LAB SUPPLIES MARKET, BY TYPE, 2020-2030 (USD MILLION)
TABLE 110 NIGERIA SERVICES IN AFRICA LAB SUPPLIES MARKET, BY TYPE, 2020-2030 (USD MILLION)
TABLE 111 NIGERIA LAB SUPPLIES MARKET, BY SERVICE CONTRACT, 2020-2030 (USD MILLION)
TABLE 112 NIGERIA LAB SUPPLIES MARKET, BY SERVICE PROVIDER, 2020-2030 (USD MILLION)
TABLE 113 NIGERIA LAB SUPPLIES MARKET, BY MODE, 2020-2030 (USD MILLION)
TABLE 114 NIGERIA LAB SUPPLIES MARKET, BY END USER, 2020-2030 (USD MILLION)
TABLE 115 NIGERIA LAB SUPPLIES MARKET, BY DISTRIBUTION CHANNEL, 2020-2030 (USD MILLION)
TABLE 116 ZAMBIA LAB SUPPLIES MARKET, BY TYPE, 2020-2030 (USD MILLION)
TABLE 117 ZAMBIA PRODUCT IN LAB SUPPLIES MARKET, BY TYPE, 2020-2030 (USD MILLION)
TABLE 118 ZAMBIA GENERAL EQUIPMENT IN LAB SUPPLIES MARKET, BY TYPE, 2020-2030 (USD MILLION)
TABLE 119 ZAMBIA SUPPORT EQUIPMENT IN LAB SUPPLIES MARKET, BY TYPE, 2020-2030 (USD MILLION)
TABLE 120 ZAMBIA SPECIALTY EQUIPMENT IN LAB SUPPLIES MARKET, BY TYPE, 2020-2030 (USD MILLION)
TABLE 121 ZAMBIA ANALYTICAL EQUIPMENT IN LAB SUPPLIES MARKET, BY TYPE, 2020-2030 (USD MILLION)
TABLE 122 ZAMBIA SPECTROMETER IN LAB SUPPLIES MARKET, BY TYPE, 2020-2030 (USD MILLION)
TABLE 123 ZAMBIA ANALYZER IN LAB SUPPLIES MARKET, BY TYPE, 2020-2030 (USD MILLION)
TABLE 124 ZAMBIA CHROMATOGRAPHY EQUIPMENT IN LAB SUPPLIES MARKET, BY TYPE, 2020-2030 (USD MILLION)
TABLE 125 ZAMBIA OTHERS IN LAB SUPPLIES MARKET, BY TYPE, 2020-2030 (USD MILLION)
TABLE 126 ZAMBIA CONSUMABLES IN LAB SUPPLIES MARKET, BY TYPE, 2020-2030 (USD MILLION)
TABLE 127 ZAMBIA ACCESSORIES IN LAB SUPPLIES MARKET, BY TYPE, 2020-2030 (USD MILLION)
TABLE 128 ZAMBIA FILTERS & FILTRATION PRODUCTS IN LAB SUPPLIES MARKET, BY TYPE, 2020-2030 (USD MILLION)
TABLE 129 ZAMBIA SERVICES IN AFRICA LAB SUPPLIES MARKET, BY TYPE, 2020-2030 (USD MILLION)
TABLE 130 ZAMBIA LAB SUPPLIES MARKET, BY SERVICE CONTRACT, 2020-2030 (USD MILLION)
TABLE 131 ZAMBIA LAB SUPPLIES MARKET, BY SERVICE PROVIDER, 2020-2030 (USD MILLION)
TABLE 132 ZAMBIA LAB SUPPLIES MARKET, BY MODE, 2020-2030 (USD MILLION)
TABLE 133 ZAMBIA LAB SUPPLIES MARKET, BY END USER, 2020-2030 (USD MILLION)
TABLE 134 ZAMBIA LAB SUPPLIES MARKET, BY DISTRIBUTION CHANNEL, 2020-2030 (USD MILLION)
TABLE 135 BOTSWANA LAB SUPPLIES MARKET, BY TYPE, 2020-2030 (USD MILLION)
TABLE 136 BOTSWANA PRODUCT IN LAB SUPPLIES MARKET, BY TYPE, 2020-2030 (USD MILLION)
TABLE 137 BOTSWANA GENERAL EQUIPMENT IN LAB SUPPLIES MARKET, BY TYPE, 2020-2030 (USD MILLION)
TABLE 138 BOTSWANA SUPPORT EQUIPMENT IN LAB SUPPLIES MARKET, BY TYPE, 2020-2030 (USD MILLION)
TABLE 139 BOTSWANA SPECIALTY EQUIPMENT IN LAB SUPPLIES MARKET, BY TYPE, 2020-2030 (USD MILLION)
TABLE 140 BOTSWANA ANALYTICAL EQUIPMENT IN LAB SUPPLIES MARKET, BY TYPE, 2020-2030 (USD MILLION)
TABLE 141 BOTSWANA SPECTROMETER IN LAB SUPPLIES MARKET, BY TYPE, 2020-2030 (USD MILLION)
TABLE 142 BOTSWANA ANALYZER IN LAB SUPPLIES MARKET, BY TYPE, 2020-2030 (USD MILLION)
TABLE 143 BOTSWANA CHROMATOGRAPHY EQUIPMENT IN LAB SUPPLIES MARKET, BY TYPE, 2020-2030 (USD MILLION)
TABLE 144 BOTSWANA OTHERS IN LAB SUPPLIES MARKET, BY TYPE, 2020-2030 (USD MILLION)
TABLE 145 BOTSWANA CONSUMABLES IN LAB SUPPLIES MARKET, BY TYPE, 2020-2030 (USD MILLION)
TABLE 146 BOTSWANA ACCESSORIES IN LAB SUPPLIES MARKET, BY TYPE, 2020-2030 (USD MILLION)
TABLE 147 BOTSWANA FILTERS & FILTRATION PRODUCTS IN LAB SUPPLIES MARKET, BY TYPE, 2020-2030 (USD MILLION)
TABLE 148 BOTSWANA SERVICES IN AFRICA LAB SUPPLIES MARKET, BY TYPE, 2020-2030 (USD MILLION)
TABLE 149 BOTSWANA LAB SUPPLIES MARKET, BY SERVICE CONTRACT, 2020-2030 (USD MILLION)
TABLE 150 BOTSWANA LAB SUPPLIES MARKET, BY SERVICE PROVIDER, 2020-2030 (USD MILLION)
TABLE 151 BOTSWANA LAB SUPPLIES MARKET, BY MODE, 2020-2030 (USD MILLION)
TABLE 152 BOTSWANA LAB SUPPLIES MARKET, BY END USER, 2020-2030 (USD MILLION)
TABLE 153 BOTSWANA LAB SUPPLIES MARKET, BY DISTRIBUTION CHANNEL, 2020-2030 (USD MILLION)
TABLE 154 NAMIBIA LAB SUPPLIES MARKET, BY TYPE, 2020-2030 (USD MILLION)
TABLE 155 NAMIBIA PRODUCT IN LAB SUPPLIES MARKET, BY TYPE, 2020-2030 (USD MILLION)
TABLE 156 NAMIBIA GENERAL EQUIPMENT IN LAB SUPPLIES MARKET, BY TYPE, 2020-2030 (USD MILLION)
TABLE 157 NAMIBIA SUPPORT EQUIPMENT IN LAB SUPPLIES MARKET, BY TYPE, 2020-2030 (USD MILLION)
TABLE 158 NAMIBIA SPECIALTY EQUIPMENT IN LAB SUPPLIES MARKET, BY TYPE, 2020-2030 (USD MILLION)
TABLE 159 NAMIBIA ANALYTICAL EQUIPMENT IN LAB SUPPLIES MARKET, BY TYPE, 2020-2030 (USD MILLION)
TABLE 160 NAMIBIA SPECTROMETER IN LAB SUPPLIES MARKET, BY TYPE, 2020-2030 (USD MILLION)
TABLE 161 NAMIBIA ANALYZER IN LAB SUPPLIES MARKET, BY TYPE, 2020-2030 (USD MILLION)
TABLE 162 NAMIBIA CHROMATOGRAPHY EQUIPMENT IN LAB SUPPLIES MARKET, BY TYPE, 2020-2030 (USD MILLION)
TABLE 163 NAMIBIA OTHERS IN LAB SUPPLIES MARKET, BY TYPE, 2020-2030 (USD MILLION)
TABLE 164 NAMIBIA CONSUMABLES IN LAB SUPPLIES MARKET, BY TYPE, 2020-2030 (USD MILLION)
TABLE 165 NAMIBIA ACCESSORIES IN LAB SUPPLIES MARKET, BY TYPE, 2020-2030 (USD MILLION)
TABLE 166 NAMIBIA FILTERS & FILTRATION PRODUCTS IN LAB SUPPLIES MARKET, BY TYPE, 2020-2030 (USD MILLION)
TABLE 167 NAMIBIA SERVICES IN AFRICA LAB SUPPLIES MARKET, BY TYPE, 2020-2030 (USD MILLION)
TABLE 168 NAMIBIA LAB SUPPLIES MARKET, BY SERVICE CONTRACT, 2020-2030 (USD MILLION)
TABLE 169 NAMIBIA LAB SUPPLIES MARKET, BY SERVICE PROVIDER, 2020-2030 (USD MILLION)
TABLE 170 NAMIBIA LAB SUPPLIES MARKET, BY MODE, 2020-2030 (USD MILLION)
TABLE 171 NAMIBIA LAB SUPPLIES MARKET, BY END USER, 2020-2030 (USD MILLION)
TABLE 172 NAMIBIA LAB SUPPLIES MARKET, BY DISTRIBUTION CHANNEL, 2020-2030 (USD MILLION)
TABLE 173 REST OF AFRICA LAB SUPPLIES MARKET, BY TYPE, 2020-2030 (USD MILLION)
List of Figure
FIGURE 1 AFRICA LAB SUPPLIES MARKET : SEGMENTATION
FIGURE 2 AFRICA LAB SUPPLIES MARKET : DATA TRIANGULATION
FIGURE 3 AFRICA LAB SUPPLIES MARKET : DROC ANALYSIS
FIGURE 4 AFRICA LAB SUPPLIES MARKET : COUNTRY ANALYSIS
FIGURE 5 AFRICA LAB SUPPLIES MARKET : COMPANY RESEARCH ANALYSIS
FIGURE 6 AFRICA LAB SUPPLIES MARKET : INTERVIEW DEMOGRAPHICS
FIGURE 7 AFRICA LAB SUPPLIES MARKET: DBMR MARKET POSITION GRID
FIGURE 8 AFRICA LAB SUPPLIES MARKET: MARKET END USER COVERAGE GRID
FIGURE 9 AFRICA LAB SUPPLIES MARKET:VENDOR SHARE ANALYSIS
FIGURE 10 AFRICA LAB SUPPLIES MARKET: SEGMENTATION
FIGURE 11 INCREASING PREVALENCE OF INFECTIOUS DISEASE AND SURGE IN CLINICAL TRIALS ARE EXPECTED TO DRIVE THE AFRICA LAB SUPPLIES MARKET IN THE FORECAST PERIOD OF 2022 TO 2030
FIGURE 12 TYPE SEGMENT IS EXPECTED TO ACCOUNT FOR THE LARGEST SHARE OF THE AFRICA LAB SUPPLIES MARKET IN 2022 & 2030
FIGURE 13 DRIVERS, RESTRAINTS, OPPORTUNITIES, AND CHALLENGES OF AFRICA LAB SUPPLIES MARKET
FIGURE 14 AFRICA LAB SUPPLIES MARKET: BY TYPE, 2021
FIGURE 15 AFRICA LAB SUPPLIES MARKET: BY TYPE, 2022-2030 (USD MILLION)
FIGURE 16 AFRICA LAB SUPPLIES MARKET: BY TYPE, CAGR (2022-2030)
FIGURE 17 AFRICA LAB SUPPLIES MARKET: BY TYPE, LIFELINE CURVE
FIGURE 18 AFRICA LAB SUPPLIES MARKET: BY SERVICE CONTRACT, 2021
FIGURE 19 AFRICA LAB SUPPLIES MARKET: BY SERVICE CONTRACT, 2022-2030 (USD MILLION)
FIGURE 20 AFRICA LAB SUPPLIES MARKET: BY SERVICE CONTRACT, CAGR (2022-2030)
FIGURE 21 AFRICA LAB SUPPLIES MARKET: BY SERVICE CONTRACT, LIFELINE CURVE
FIGURE 22 AFRICA LAB SUPPLIES MARKET: BY SERVICE PROVIDER, 2021
FIGURE 23 AFRICA LAB SUPPLIES MARKET: BY SERVICE PROVIDER, 2022-2030 (USD MILLION)
FIGURE 24 AFRICA LAB SUPPLIES MARKET: BY SERVICE PROVIDER, CAGR (2022-2030)
FIGURE 25 AFRICA LAB SUPPLIES MARKET: BY SERVICE PROVIDER, LIFELINE CURVE
FIGURE 26 AFRICA LAB SUPPLIES MARKET: BY MODE, 2021
FIGURE 27 AFRICA LAB SUPPLIES MARKET: BY MODE, 2022-2030 (USD MILLION)
FIGURE 28 AFRICA LAB SUPPLIES MARKET: BY MODE, CAGR (2022-2030)
FIGURE 29 AFRICA LAB SUPPLIES MARKET: BY MODE, LIFELINE CURVE
FIGURE 30 AFRICA LAB SUPPLIES MARKET: BY END USER, 2021
FIGURE 31 AFRICA LAB SUPPLIES MARKET: BY END USER, 2022-2030 (USD MILLION)
FIGURE 32 AFRICA LAB SUPPLIES MARKET: BY END USER, CAGR (2022-2030)
FIGURE 33 AFRICA LAB SUPPLIES MARKET: BY END USER, LIFELINE CURVE
FIGURE 34 AFRICA LAB SUPPLIES MARKET DISEASE MARKET: BY DISTRIBUTION CHANNEL, 2021
FIGURE 35 AFRICA LAB SUPPLIES MARKET DISEASE MARKET: BY DISTRIBUTION CHANNEL, 2022-2030 (USD MILLION)
FIGURE 36 AFRICA LAB SUPPLIES MARKET DISEASE MARKET: BY DISTRIBUTION CHANNEL, CAGR (2022-2030)
FIGURE 37 AFRICA LAB SUPPLIES MARKET DISEASE MARKET: BY DISTRIBUTION CHANNEL, LIFELINE CURVE
FIGURE 38 AFRICA LAB SUPPLIES MARKET: SNAPSHOT (2021)
FIGURE 39 AFRICA LAB SUPPLIES MARKET: BY COUNTRY (2021)
FIGURE 40 AFRICA LAB SUPPLIES MARKET: BY COUNTRY (2022 & 2030)
FIGURE 41 AFRICA LAB SUPPLIES MARKET: BY COUNTRY (2021 & 2030)
FIGURE 42 AFRICA LAB SUPPLIES MARKET: BY TYPE (2022-2030)
FIGURE 43 AFRICA LAB SUPPLIES MARKET: COMPANY SHARE 2021 (%)
Data collection and base year analysis are done using data collection modules with large sample sizes. The stage includes obtaining market information or related data through various sources and strategies. It includes examining and planning all the data acquired from the past in advance. It likewise envelops the examination of information inconsistencies seen across different information sources. The market data is analysed and estimated using market statistical and coherent models. Also, market share analysis and key trend analysis are the major success factors in the market report. To know more, please request an analyst call or drop down your inquiry.
The key research methodology used by DBMR research team is data triangulation which involves data mining, analysis of the impact of data variables on the market and primary (industry expert) validation. Data models include Vendor Positioning Grid, Market Time Line Analysis, Market Overview and Guide, Company Positioning Grid, Patent Analysis, Pricing Analysis, Company Market Share Analysis, Standards of Measurement, Global versus Regional and Vendor Share Analysis. To know more about the research methodology, drop in an inquiry to speak to our industry experts.
Data Bridge Market Research is a leader in advanced formative research. We take pride in servicing our existing and new customers with data and analysis that match and suits their goal. The report can be customized to include price trend analysis of target brands understanding the market for additional countries (ask for the list of countries), clinical trial results data, literature review, refurbished market and product base analysis. Market analysis of target competitors can be analyzed from technology-based analysis to market portfolio strategies. We can add as many competitors that you require data about in the format and data style you are looking for. Our team of analysts can also provide you data in crude raw excel files pivot tables (Fact book) or can assist you in creating presentations from the data sets available in the report.


