
 Market Analysis and Insights: Asia-Pacific Broadcast Equipment Market
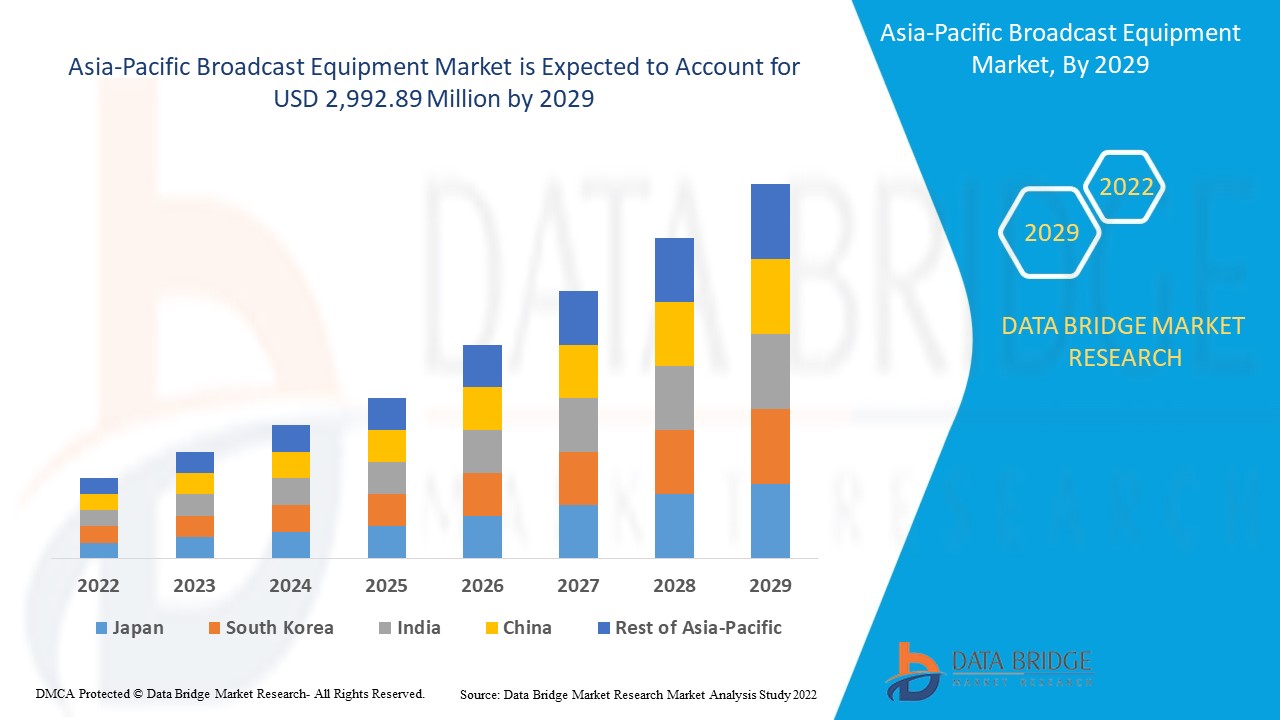
Asia-Pacific broadcast equipment market is expected to gain market growth in the forecast period of 2022 to 2029. Data Bridge Market Research analyses that the market is growing with a CAGR of 6.3% in the forecast period of 2022 to 2029 and expected to reach USD 2,992.89 million by 2029.
A radio or television broadcast is a set of programs transmitted over a medium. Generally, it is an air medium for public reception that anyone can receive with a receiver tuned to the right channel. Broadcast equipment is generally hardware’s which enables the broadcaster to transmit the program, such as radio programs, movies, films, plays, concerts, and others. There are two types of equipment used in program generation and transmission, broadly classified as video equipment and audio equipment. There are various types of video equipment such as complete console systems, broadcast & production consoles, editing & graphics consoles, data, and security devices. On the other hand, audio equipment such as portable sound systems, signal processors, surge protectors, audio cables, headphones and headsets, sound testers, wireless communications devices, audio workstations, and others are combined and used for broadcastin.
The major factors driving the growth of the broadcast equipment market are surging preference for UHD transmission and content production and increasing application of broadcast equipment for a wide range of applications such as radio and television and others. Advent of 5G wireless networks and ATSC 3.0 technologies is creating opportunities for the growth of the market. Increase in cases related to cyber-attacks is acting as the major restraint for broadcast equipment market. Limited availability of UHD or 4K streaming is acting as a major challenge for the growth of the market.
This broadcast equipment market report provides details of market share, new developments, and product pipeline analysis, impact of domestic and localised market players, analyses opportunities in terms of emerging revenue pockets, changes in market regulations, product approvals, strategic decisions, product launches, geographic expansions, and technological innovations in the market. To understand the analysis and the market scenario contact us for an Analyst Brief, our team will help you create a revenue impact solution to achieve your desired goal.
 Asia-Pacific Broadcast Equipment Market Scope and Market Size
Asia-Pacific broadcast equipment market is segmented on the basis of frequency, technology, power range, content type, product type, and application. The growth among segments helps you analyse niche pockets of growth and strategies to approach the market and determine your core application areas and the difference in your target markets.
- Based on frequency, the broadcast equipment market is segmented into low frequency, medium frequency, high frequency, very high frequency, ultra-high frequency, super-high frequency. In 2022, the ultra-high frequency is expected to dominate the broadcast equipment market due to increased focus on the advanced high-speed broadband infrastructure to support the growing demand for television broadcast, cell phones, and satellite communication as these frequency range is best suitable for broadcast.
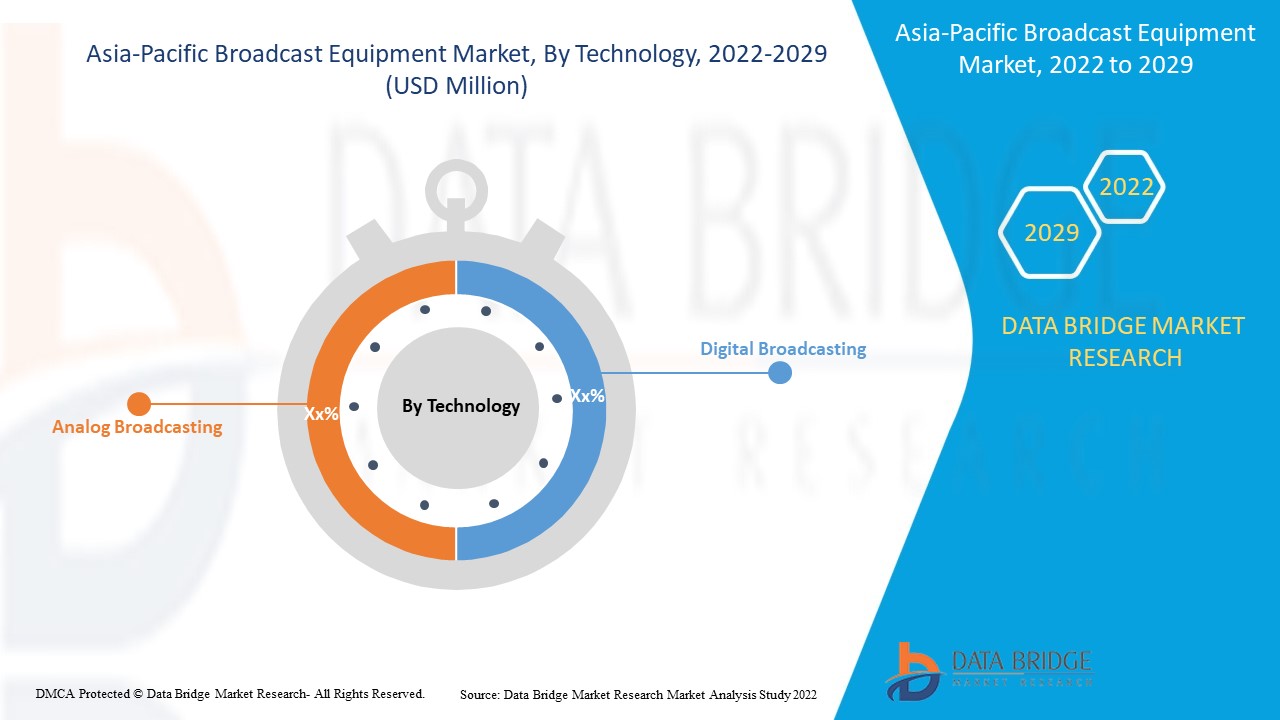
- Based on technology, the broadcast equipment market is segmented into analog broadcast, digital broadcast. In 2022, the digital broadcast segment is expected to dominate the broadcast equipment market due to an increase in the capacity of broadcast transmission networks by improving spectrum efficiency that can cater to the growing demand of consumers for entertainment media content. Digital broadcast is the key to providing better signal quality which increases robustness to interference and picture degradation.
- Based on power range, the broadcast equipment market is segmented into low power range, high power range. In 2022, the high power range segment is expected to dominate the broadcast equipment market as the advent of smart devices has boosted the demand for media-generated content across the globe. In order to offer the best possible service and quality content, high power range broadcast equipment is used for high transmission of HD video content.
- Based on content type, the broadcast equipment market is segmented into audio, video, audio/visual. In 2022, the audio/visual segment is expected to dominate the broadcast equipment market as growing demand for real-time experience of sports events, political meetings, weather reports, and others is boosting the demand for audio/video broadcast equipment. With the advancement in technology and high-speed 5G networks, the live broadcast and podcast can be streamed live and viewed by a consumer.
- Based on product type, the broadcast equipment market is segmented into dish antennas, encoders, amplifiers, transmitters & repeaters, switches, video servers, modulators, others. In 2022, the transmitters & repeaters segment is expected to dominate the broadcast equipment market as increasing demand for media content, advanced high-speed broadband infrastructure, and proliferation of smart consumer electronic devices.
- Based on application, the broadcast equipment market is segmented into radio, television, cable television, and IPTV. In 2022, the IPTV segment is expected to dominate the broadcast equipment market as there is a growing demand for media content of various programs due to advancements in technology such as ATSC 3.0 and AI-based technologies.
Asia-Pacific Broadcast Equipment Market Country Level Analysis
Asia-Pacific broadcast equipment market is analysed and market size information is provided by frequency, technology, power range, content type, product type, application.
The countries covered in broadcast equipment market report are China, Japan, South Korea, India, Australia, Malaysia, Singapore, Thailand, Indonesia, Philippines, and Rest of Asia-Pacific in Asia-Pacific.
China is expected to dominate the market due to the growing availability of a wide variety of OTT content.
The country section of the report also provides individual market impacting factors and changes in regulation in the market domestically that impacts the current and future trends of the market. Data points such as new sales, replacement sales, country demographics, regulatory acts and import-export tariffs are some of the major pointers used to forecast the market scenario for individual countries. Also, presence and availability of Asia-Pacific brands and their challenges faced due to large or scarce competition from local and domestic brands, impact of sales channels are considered while providing forecast analysis of the country data.
Rising Demand of Broadcast Equipment
Broadcast equipment market also provides you with detailed market analysis for every country growth in industry with sales, components sales, impact of technological development in broadcast equipment and changes in regulatory scenarios with their support for the broadcast equipment market. The data is available for historic period 2011 to 2020.
Competitive Landscape and Broadcast Equipment Market Share Analysis
Broadcast equipment market competitive landscape provides details by competitor. Details included are company overview, company financials, revenue generated, market potential, investment in research and development, new market initiatives, Asia-Pacific presence, production sites and facilities, company strengths and weaknesses, product launch, product trials pipelines, product approvals, patents, product width and breadth, application dominance, technology lifeline curve. The above data points provided are only related to the companies’ focus related to Asia-Pacific broadcast equipment market.
Some of the major players operating in the broadcast equipment market are Cisco Systems, Inc., Harmonic, Inc., CommScope Holding Company, Inc., Grass Valley Canada, Global Invacom, Telefonaktiebolaget LM Ericsson, Evertz, General Dynamics Mission Systems, Inc., Sencore, AvL Technologies, EVS Broadcast Equipment, Belden Inc., Elma Electronic., Broadcast Electronics, OMB, Wellav Technologies Ltd., ACORDE Technologies S.A., Eletec Radio Broadcast Equipment & Transmitters., ETL Systems Ltd, Clyde Broadcast Technology Ltd among others. DBMR analysts understand competitive strengths and provide competitive analysis for each competitor separately.
For instance,
- In October 2021, Telefonaktiebolaget LM Ericsson has launched Vuma TV over the OTT platform across the globe through its subsidiary Red Bee Media Ltd. The main objective of this service launch was to broadcast all types of content, be it political, entertainment, and others. Through this company aims to strengthen its global presence.
- In November 2021, Cisco Systems, Inc. acquired replex GmbH. The key feature of this acquisition was to observe enterprise-scale and cloud-native environments capabilities. This helped the company to strengthen the foundation of the AppDynamics platform. Through, this company enhanced its reputation among its consumer.
Partnership, joint ventures and other strategies enhances the company market share with increased coverage and presence. It also provides the benefit for organisation to improve their offering for broadcast equipment market through expanded product range.
SKU-

- Interactive Data Analysis Dashboard
- Company Analysis Dashboard for high growth potential opportunities
- Research Analyst Access for customization & queries
- Competitor Analysis with Interactive dashboard
- Latest News, Updates & Trend analysis
- Harness the Power of Benchmark Analysis for Comprehensive Competitor Tracking
Table of Content
1 INTRODUCTION
1.1 OBJECTIVES OF THE STUDY
1.2 MARKET DEFINITION
1.3 OVERVIEW OF ASIA-PACIFIC BROADCAST EQUIPMENT MARKET
1.4 CURRENCY AND PRICING
1.5 LIMITATIONS
1.6 MARKETS COVERED
2 MARKET SEGMENTATION
2.1 MARKETS COVERED
2.2 GEOGRAPHICAL SCOPE
2.3 YEARS CONSIDERED FOR THE STUDY
2.4 DBMR TRIPOD DATA VALIDATION MODEL
2.5 PRIMARY INTERVIEWS WITH KEY OPINION LEADERS
2.6 DBMR MARKET POSITION GRID
2.7 VENDOR SHARE ANALYSIS
2.8 MULTIVARIATE MODELING
2.9 FREQUENCY TIMELINE CURVE
2.1 SECONDARY SOURCES
2.11 ASSUMPTIONS
3 EXECUTIVE SUMMARY
4 PREMIUM INSIGHTS
5 MARKET OVERVIEW
5.1 DRIVERS
5.1.1 IMPLEMENTATION OF AI-BASED TECHNOLOGIES FOR BROADCASTING
5.1.2 INCREASED FOCUS ON ADVANCED HIGH-SPEED BROADBAND INFRASTRUCTURE
5.1.3 GROWING PROLIFERATION OF SMART CONSUMER ELECTRONIC DEVICES
5.1.4 GROWING AVAILABILITY OF A WIDE VARIETY OF OTT CONTENT
5.2 RESTRAINTS
5.2.1 INCREASE IN CASES OF CYBER ATTACKS
5.2.2 HIGH COSTS ASSOCIATED WITH BROADCASTING EQUIPMENT
5.3 OPPORTUNITIES
5.3.1 ADVENT OF 5G WIRELESS NETWORKS AND ATSC 3.0 TECHNOLOGIES
5.3.2 GROWING NEED FOR MEDIA FILES OVER THE INTERNET
5.3.3 RECENT CONTRACTS, PARTNERSHIPS, MERGERS, AND PRODUCT LAUNCHES FOR BROADCAST EQUIPMENT
5.4 CHALLENGES
5.4.1 ISSUES RELATED TO MANAGEMENT OF SIGNIFICANT AND VALUABLE CONTENT
5.4.2 LIMITED AVAILABILITY OF UHD OR 4K STREAMING
5.4.3 HURDLES FACED OUTSIDE BROADCASTING
6 IMPACT OF COVID-19 ON ASIA-PACIFIC BROADCAST EQUIPMENT MARKET
6.1 ANALYSIS ON IMPACT OF COVID-19 ON BROADCAST EQUIPMENT MARKET
6.2 AFTERMATH OF COVID-19 AND GOVERNMENT INITIATIVES TO BOOST THE MARKET
6.3 STRATEGIC DECISIONS FOR MANUFACTURERS AFTER COVID-19 TO GAIN COMPETITIVE MARKET SHARE
6.4 IMPACT ON PRICE
6.5 IMPACT ON DEMAND AND SUPPLY CHAIN
6.6 CONCLUSION
7 ASIA-PACIFIC BROADCAST EQUIPMENT MARKET, BY FREQUENCY
7.1 OVERVIEW
7.2 ULTRA-HIGH FREQUENCY
7.3 VERY HIGH FREQUENCY
7.4 HIGH FREQUENCY
7.5 SUPER-HIGH FREQUENCY
7.6 MEDIUM FREQUENCY
7.7 LOW FREQUENCY
8 ASIA-PACIFIC BROADCAST EQUIPMENT MARKET, BY TECHNOLOGY
8.1 OVERVIEW
8.2 DIGITAL BROADCASTING
8.3 ANALOG BROADCASTING
9 ASIA-PACIFIC BROADCAST EQUIPMENT MARKET, BY POWER RANGE
9.1 OVERVIEW
9.2 HIGH POWER RANGE
9.3 LOW POWER RANGE
10 ASIA-PACIFIC BROADCAST EQUIPMENT MARKET, BY CONTENT TYPE
10.1 OVERVIEW
10.2 AUDIO/VISUAL
10.3 VIDEO
10.4 AUDIO
11 ASIA-PACIFIC BROADCAST EQUIPMENT MARKET, BY PRODUCT TYPE
11.1 OVERVIEW
11.2 TRANSMITTERS & REPEATERS
11.3 DISH ANTENNAS
11.4 ENCODERS
11.5 AMPLIFIERS
11.6 MODULATORS
11.7 SWITCHES
11.8 VIDEO SERVERS
11.9 OTHERS
12 ASIA-PACIFIC BROADCAST EQUIPMENT MARKET, BY APPLICATION
12.1 OVERVIEW
12.2 IPTV
12.3 TELEVISION
12.3.1 DIRECT BROADCASTING SATELLITE (DBS)
12.3.2 TERRESTRIAL TELEVISION
12.3.2.1 DIGITAL TELEVISION
12.3.2.2 ANALOG TELEVISION
12.4 CABLE TELEVISION
12.5 RADIO
13 ASIA-PACIFIC BROADCAST EQUIPMENT MARKET, BY REGION
13.1 ASIA-PACIFIC
13.1.1 CHINA
13.1.2 JAPAN
13.1.3 SOUTH KOREA
13.1.4 INDIA
13.1.5 AUSTRALIA
13.1.6 SINGAPORE
13.1.7 THAILAND
13.1.8 MALAYSIA
13.1.9 PHILIPPINES
13.1.10 INDONESIA
13.1.11 REST OF ASIA-PACIFIC
14 ASIA-PACIFIC BROADCAST EQUIPMENT MARKET: COMPANY LANDSCAPE
14.1 COMPANY SHARE ANALYSIS: ASIA-PACIFIC
15 SWOT ANALYSIS
16 COMPANY PROFILE
16.1 TELEFONAKTIEBOLAGET LM ERICSSON
16.1.1 COMPANY SNAPSHOT
16.1.2 REVENUE ANALYSIS
16.1.3 COMPANY SHARE ANALYSIS
16.1.4 PRODUCTS PORTFOLIO
16.1.5 RECENT DEVELOPMENTS
16.2 CISCO SYSTEMS, INC.
16.2.1 COMPANY SNAPSHOT
16.2.2 REVENUE ANALYSIS
16.2.3 COMPANY SHARE ANALYSIS
16.2.4 PRODUCTS & SERVICES PORTFOLIO
16.2.5 RECENT DEVELOPMENTS
16.3 GENERAL DYNAMICS MISSION SYSTEMS, INC.
16.3.1 COMPANY SNAPSHOT
16.3.2 REVENUE ANALYSIS
16.3.3 COMPANY SHARE ANALYSIS
16.3.4 PRODUCTS PORTFOLIO
16.3.5 RECENT DEVELOPMENTS
16.4 COMMSCOPE HOLDING COMPANY, INC.
16.4.1 COMPANY SNAPSHOT
16.4.2 REVENUE ANALYSIS
16.4.3 COMPANY SHARE ANALYSIS
16.4.4 PRODUCTS PORTFOLIO
16.4.5 RECENT DEVELOPMENTS
16.5 BELDEN INC.
16.5.1 COMPANY SNAPSHOT
16.5.2 REVENUE ANALYSIS
16.5.3 COMPANY SHARE ANALYSIS
16.5.4 PRODUCTS PORTFOLIO
16.5.5 RECENT DEVELOPMENTS
16.6 ACORDE TECHNOLOGIES S.A.
16.6.1 COMPANY SNAPSHOT
16.6.2 PRODUCTS PORTFOLIO
16.6.3 RECENT DEVELOPMENTS
16.7 AVL TECHNOLOGIES
16.7.1 COMPANY SNAPSHOT
16.7.2 PRODUCTS PORTFOLIO
16.7.3 RECENT DEVELOPMENTS
16.8 BROADCAST ELECTRONICS
16.8.1 COMPANY SNAPSHOT
16.8.2 PRODUCTS PORTFOLIO
16.8.3 RECENT DEVELOPMENTS
16.9 CLYDE BROADCAST TECHNOLOGY LTD
16.9.1 COMPANY SNAPSHOT
16.9.2 PRODUCTS PORTFOLIO
16.9.3 RECENT DEVELOPMENTS
16.1 ELETEC RADIO BROADCASTING EQUIPMENT & TRANSMITTERS.
16.10.1 COMPANY SNAPSHOT
16.10.2 PRODUCTS PORTFOLIO
16.10.3 RECENT DEVELOPMENTS
16.11 ELMA ELECTRONIC.
16.11.1 COMPANY SNAPSHOT
16.11.2 REVENUE ANALYSIS
16.11.3 PRODUCTS PORTFOLIO
16.11.4 RECENT DEVELOPMENTS
16.12 ETL SYSTEMS LTD
16.12.1 COMPANY SNAPSHOT
16.12.2 PRODUCTS PORTFOLIO
16.12.3 RECENT DEVELOPMENTS
16.13 EVERTZ
16.13.1 COMPANY SNAPSHOT
16.13.2 REVENUE ANALYSIS
16.13.3 SOLUTION PORTFOLIO
16.13.4 RECENT DEVELOPMENTS
16.14 EVS BROADCAST EQUIPMENT
16.14.1 COMPANY SNAPSHOT
16.14.2 REVENUE ANALYSIS
16.14.3 PRODUCTS PORTFOLIO
16.14.4 RECENT DEVELOPMENTS
16.15 ASIA-PACIFIC INVACOM
16.15.1 COMPANY SNAPSHOT
16.15.2 REVENUE ANALYSIS
16.15.3 PRODUCTS PORTFOLIO
16.15.4 RECENT DEVELOPMENTS
16.16 GRASS VALLEY CANADA
16.16.1 COMPANY SNAPSHOT
16.16.2 PRODUCT PORTFOLIO
16.16.3 RECENT DEVELOPMENTS
16.17 HARMONIC, INC
16.17.1 COMPANY SNAPSHOT
16.17.2 REVENUE ANALYSIS
16.17.3 PRODUCTS PORTFOLIO
16.17.4 RECENT DEVELOPMENTS
16.18 OMB
16.18.1 COMPANY SNAPSHOT
16.18.2 PRODUCTS PORTFOLIO
16.18.3 RECENT DEVELOPMENTS
16.19 SENCORE
16.19.1 COMPANY SNAPSHOT
16.19.2 PRODUCTS PORTFOLIO
16.19.3 RECENT DEVELOPMENTS
16.2 WELLAV TECHNOLOGIES LTD.
16.20.1 COMPANY SNAPSHOT
16.20.2 PRODUCTS PORTFOLIO
16.20.3 RECENT DEVELOPMENTS
17 QUESTIONNAIRE
18 RELATED REPORTS
List of Table
TABLE 1 CYBER-ATTACKS ON MEDIA & BROADCAST INDUSTRY
TABLE 2 COST OF VARIOUS BROADCASTING EQUIPMENT
TABLE 3 ASIA-PACIFIC BROADCAST EQUIPMENT MARKET, BY FREQUENCY, 2020-2029 (USD MILLION)
TABLE 4 ASIA-PACIFIC ULTRA-HIGH FREQUENCY IN BROADCAST EQUIPMENT MARKET, BY REGION, 2020-2029 (USD MILLION)
TABLE 5 ASIA-PACIFIC VERY HIGH FREQUENCY IN BROADCAST EQUIPMENT MARKET, BY REGION, 2020-2029 (USD MILLION)
TABLE 6 ASIA-PACIFIC HIGH FREQUENCY IN BROADCAST EQUIPMENT MARKET, BY REGION, 2020-2029 (USD MILLION)
TABLE 7 ASIA-PACIFIC SUPER-HIGH FREQUENCY IN BROADCAST EQUIPMENT MARKET, BY REGION, 2020-2029 (USD MILLION)
TABLE 8 ASIA-PACIFIC MEDIUM FREQUENCY IN BROADCAST EQUIPMENT MARKET, BY REGION, 2020-2029 (USD MILLION)
TABLE 9 ASIA-PACIFIC LOW FREQUENCY IN BROADCAST EQUIPMENT MARKET, BY REGION, 2020-2029 (USD MILLION)
TABLE 10 ASIA-PACIFIC BROADCAST EQUIPMENT MARKET, BY TECHNOLOGY, 2020-2029 (USD MILLION)
TABLE 11 ASIA-PACIFIC DIGITAL BROADCASTING IN BROADCAST EQUIPMENT MARKET, BY REGION, 2020-2029 (USD MILLION)
TABLE 12 ASIA-PACIFIC ANALOG BROADCASTING IN BROADCAST EQUIPMENT MARKET, BY REGION, 2020-2029 (USD MILLION)
TABLE 13 ASIA-PACIFIC BROADCAST EQUIPMENT MARKET, BY POWER RANGE, 2020-2029 (USD MILLION)
TABLE 14 ASIA-PACIFIC HIGH POWER RANGE IN BROADCAST EQUIPMENT MARKET, BY REGION, 2020-2029 (USD MILLION)
TABLE 15 ASIA-PACIFIC LOW POWER RANGE IN BROADCAST EQUIPMENT MARKET, BY REGION, 2020-2029 (USD MILLION)
TABLE 16 ASIA-PACIFIC BROADCAST EQUIPMENT MARKET, BY CONTENT TYPE, 2020-2029 (USD MILLION)
TABLE 17 ASIA-PACIFIC AUDIO/VISUAL RANGE IN BROADCAST EQUIPMENT MARKET, BY REGION, 2020-2029 (USD MILLION)
TABLE 18 ASIA-PACIFIC VIDEO IN BROADCAST EQUIPMENT MARKET, BY REGION, 2020-2029 (USD MILLION)
TABLE 19 ASIA-PACIFIC AUDIO IN BROADCAST EQUIPMENT MARKET, BY REGION, 2020-2029 (USD MILLION)
TABLE 20 ASIA-PACIFIC BROADCAST EQUIPMENT MARKET, BY PRODUCT TYPE, 2020-2029 (USD MILLION)
TABLE 21 ASIA-PACIFIC TRANSMITTERS & REPEATERS IN BROADCAST EQUIPMENT MARKET, BY REGION, 2020-2029 (USD MILLION)
TABLE 22 ASIA-PACIFIC DISH ANTENNAS IN BROADCAST EQUIPMENT MARKET, BY REGION, 2020-2029 (USD MILLION)
TABLE 23 ASIA-PACIFIC ENCODERS IN BROADCAST EQUIPMENT MARKET, BY REGION, 2020-2029 (USD MILLION)
TABLE 24 ASIA-PACIFIC AMPLIFIERS IN BROADCAST EQUIPMENT MARKET, BY REGION, 2020-2029 (USD MILLION)
TABLE 25 ASIA-PACIFIC MODULATORS IN BROADCAST EQUIPMENT MARKET, BY REGION, 2020-2029 (USD MILLION)
TABLE 26 ASIA-PACIFIC SWITCHES IN BROADCAST EQUIPMENT MARKET, BY REGION, 2020-2029 (USD MILLION)
TABLE 27 ASIA-PACIFIC VIDEO SERVERS IN BROADCAST EQUIPMENT MARKET, BY REGION, 2020-2029 (USD MILLION)
TABLE 28 ASIA-PACIFIC OTHERS IN BROADCAST EQUIPMENT MARKET, BY REGION, 2020-2029 (USD MILLION)
TABLE 29 ASIA-PACIFIC BROADCAST EQUIPMENT MARKET, BY APPLICATION, 2020-2029 (USD MILLION)
TABLE 30 ASIA-PACIFIC IPTV IN BROADCAST EQUIPMENT MARKET, BY REGION, 2020-2029 (USD MILLION)
TABLE 31 ASIA-PACIFIC TELEVISION IN BROADCAST EQUIPMENT MARKET, BY REGION, 2020-2029 (USD MILLION)
TABLE 32 ASIA-PACIFIC TELEVISION IN BROADCAST EQUIPMENT MARKET, BY TYPE, 2020-2029 (USD MILLION)
TABLE 33 ASIA-PACIFIC TERRESTRIAL TELEVISION IN BROADCAST EQUIPMENT MARKET, BY TYPE, 2020-2029 (USD MILLION)
TABLE 34 ASIA-PACIFIC CABLE TELEVISION IN BROADCAST EQUIPMENT MARKET, BY REGION, 2020-2029 (USD MILLION)
TABLE 35 ASIA-PACIFIC RADIO IN BROADCAST EQUIPMENT MARKET, BY REGION, 2020-2029 (USD MILLION)
TABLE 36 ASIA-PACIFIC BROADCAST EQUIPMENT MARKET, BY COUNTRY, 2020-2029 (USD MILLION)
TABLE 37 ASIA-PACIFIC BROADCAST EQUIPMENT MARKET, BY FREQUENCY, 2020-2029 (USD MILLION)
TABLE 38 ASIA-PACIFIC BROADCAST EQUIPMENT MARKET, BY TECHNOLOGY, 2020-2029 (USD MILLION)
TABLE 39 ASIA-PACIFIC BROADCAST EQUIPMENT MARKET, BY POWER RANGE, 2020-2029 (USD MILLION)
TABLE 40 ASIA-PACIFIC BROADCAST EQUIPMENT MARKET, BY CONTENT TYPE, 2020-2029 (USD MILLION)
TABLE 41 ASIA-PACIFIC BROADCAST EQUIPMENT MARKET, BY PRODUCT TYPE, 2020-2029 (USD MILLION)
TABLE 42 ASIA-PACIFIC BROADCAST EQUIPMENT MARKET, BY APPLICATION, 2020-2029 (USD MILLION)
TABLE 43 ASIA-PACIFIC TELEVISION IN BROADCAST EQUIPMENT MARKET, BY TYPE, 2020-2029 (USD MILLION)
TABLE 44 ASIA-PACIFIC TERRESTRIAL TELEVISION IN BROADCAST EQUIPMENT MARKET, BY TYPE, 2020-2029 (USD MILLION)
TABLE 45 CHINA BROADCAST EQUIPMENT MARKET, BY FREQUENCY, 2020-2029 (USD MILLION)
TABLE 46 CHINA BROADCAST EQUIPMENT MARKET, BY TECHNOLOGY, 2020-2029 (USD MILLION)
TABLE 47 CHINA BROADCAST EQUIPMENT MARKET, BY POWER RANGE, 2020-2029 (USD MILLION)
TABLE 48 CHINA BROADCAST EQUIPMENT MARKET, BY CONTENT TYPE, 2020-2029 (USD MILLION)
TABLE 49 CHINA BROADCAST EQUIPMENT MARKET, BY PRODUCT TYPE, 2020-2029 (USD MILLION)
TABLE 50 CHINA BROADCAST EQUIPMENT MARKET, BY APPLICATION, 2020-2029 (USD MILLION)
TABLE 51 CHINA TELEVISION IN BROADCAST EQUIPMENT MARKET, BY TYPE, 2020-2029 (USD MILLION)
TABLE 52 CHINA TERRESTRIAL TELEVISION IN BROADCAST EQUIPMENT MARKET, BY TYPE, 2020-2029 (USD MILLION)
TABLE 53 JAPAN BROADCAST EQUIPMENT MARKET, BY FREQUENCY, 2020-2029 (USD MILLION)
TABLE 54 JAPAN BROADCAST EQUIPMENT MARKET, BY TECHNOLOGY, 2020-2029 (USD MILLION)
TABLE 55 JAPAN BROADCAST EQUIPMENT MARKET, BY POWER RANGE, 2020-2029 (USD MILLION)
TABLE 56 JAPAN BROADCAST EQUIPMENT MARKET, BY CONTENT TYPE, 2020-2029 (USD MILLION)
TABLE 57 JAPAN BROADCAST EQUIPMENT MARKET, BY PRODUCT TYPE, 2020-2029 (USD MILLION)
TABLE 58 JAPAN BROADCAST EQUIPMENT MARKET, BY APPLICATION, 2020-2029 (USD MILLION)
TABLE 59 JAPAN TELEVISION IN BROADCAST EQUIPMENT MARKET, BY TYPE, 2020-2029 (USD MILLION)
TABLE 60 JAPAN TERRESTRIAL TELEVISION IN BROADCAST EQUIPMENT MARKET, BY TYPE, 2020-2029 (USD MILLION)
TABLE 61 SOUTH KOREA BROADCAST EQUIPMENT MARKET, BY FREQUENCY, 2020-2029 (USD MILLION)
TABLE 62 SOUTH KOREA BROADCAST EQUIPMENT MARKET, BY TECHNOLOGY, 2020-2029 (USD MILLION)
TABLE 63 SOUTH KOREA BROADCAST EQUIPMENT MARKET, BY POWER RANGE, 2020-2029 (USD MILLION)
TABLE 64 SOUTH KOREA BROADCAST EQUIPMENT MARKET, BY CONTENT TYPE, 2020-2029 (USD MILLION)
TABLE 65 SOUTH KOREA BROADCAST EQUIPMENT MARKET, BY PRODUCT TYPE, 2020-2029 (USD MILLION)
TABLE 66 SOUTH KOREA BROADCAST EQUIPMENT MARKET, BY APPLICATION, 2020-2029 (USD MILLION)
TABLE 67 SOUTH KOREA TELEVISION IN BROADCAST EQUIPMENT MARKET, BY TYPE, 2020-2029 (USD MILLION)
TABLE 68 SOUTH KOREA TERRESTRIAL TELEVISION IN BROADCAST EQUIPMENT MARKET, BY TYPE, 2020-2029 (USD MILLION)
TABLE 69 INDIA BROADCAST EQUIPMENT MARKET, BY FREQUENCY, 2020-2029 (USD MILLION)
TABLE 70 INDIA BROADCAST EQUIPMENT MARKET, BY TECHNOLOGY, 2020-2029 (USD MILLION)
TABLE 71 INDIA BROADCAST EQUIPMENT MARKET, BY POWER RANGE, 2020-2029 (USD MILLION)
TABLE 72 INDIA BROADCAST EQUIPMENT MARKET, BY CONTENT TYPE, 2020-2029 (USD MILLION)
TABLE 73 INDIA BROADCAST EQUIPMENT MARKET, BY PRODUCT TYPE, 2020-2029 (USD MILLION)
TABLE 74 INDIA BROADCAST EQUIPMENT MARKET, BY APPLICATION, 2020-2029 (USD MILLION)
TABLE 75 INDIA TELEVISION IN BROADCAST EQUIPMENT MARKET, BY TYPE, 2020-2029 (USD MILLION)
TABLE 76 INDIA TERRESTRIAL TELEVISION IN BROADCAST EQUIPMENT MARKET, BY TYPE, 2020-2029 (USD MILLION)
TABLE 77 AUSTRALIA BROADCAST EQUIPMENT MARKET, BY FREQUENCY, 2020-2029 (USD MILLION)
TABLE 78 AUSTRALIA BROADCAST EQUIPMENT MARKET, BY TECHNOLOGY, 2020-2029 (USD MILLION)
TABLE 79 AUSTRALIA BROADCAST EQUIPMENT MARKET, BY POWER RANGE, 2020-2029 (USD MILLION)
TABLE 80 AUSTRALIA BROADCAST EQUIPMENT MARKET, BY CONTENT TYPE, 2020-2029 (USD MILLION)
TABLE 81 AUSTRALIA BROADCAST EQUIPMENT MARKET, BY PRODUCT TYPE, 2020-2029 (USD MILLION)
TABLE 82 AUSTRALIA BROADCAST EQUIPMENT MARKET, BY APPLICATION, 2020-2029 (USD MILLION)
TABLE 83 AUSTRALIA TELEVISION IN BROADCAST EQUIPMENT MARKET, BY TYPE, 2020-2029 (USD MILLION)
TABLE 84 AUSTRALIA TERRESTRIAL TELEVISION IN BROADCAST EQUIPMENT MARKET, BY TYPE, 2020-2029 (USD MILLION)
TABLE 85 SINGAPORE BROADCAST EQUIPMENT MARKET, BY FREQUENCY, 2020-2029 (USD MILLION)
TABLE 86 SINGAPORE BROADCAST EQUIPMENT MARKET, BY TECHNOLOGY, 2020-2029 (USD MILLION)
TABLE 87 SINGAPORE BROADCAST EQUIPMENT MARKET, BY POWER RANGE, 2020-2029 (USD MILLION)
TABLE 88 SINGAPORE BROADCAST EQUIPMENT MARKET, BY CONTENT TYPE, 2020-2029 (USD MILLION)
TABLE 89 SINGAPORE BROADCAST EQUIPMENT MARKET, BY PRODUCT TYPE, 2020-2029 (USD MILLION)
TABLE 90 SINGAPORE BROADCAST EQUIPMENT MARKET, BY APPLICATION, 2020-2029 (USD MILLION)
TABLE 91 SINGAPORE TELEVISION IN BROADCAST EQUIPMENT MARKET, BY TYPE, 2020-2029 (USD MILLION)
TABLE 92 SINGAPORE TERRESTRIAL TELEVISION IN BROADCAST EQUIPMENT MARKET, BY TYPE, 2020-2029 (USD MILLION)
TABLE 93 THAILAND BROADCAST EQUIPMENT MARKET, BY FREQUENCY, 2020-2029 (USD MILLION)
TABLE 94 THAILAND BROADCAST EQUIPMENT MARKET, BY TECHNOLOGY, 2020-2029 (USD MILLION)
TABLE 95 THAILAND BROADCAST EQUIPMENT MARKET, BY POWER RANGE, 2020-2029 (USD MILLION)
TABLE 96 THAILAND BROADCAST EQUIPMENT MARKET, BY CONTENT TYPE, 2020-2029 (USD MILLION)
TABLE 97 THAILAND BROADCAST EQUIPMENT MARKET, BY PRODUCT TYPE, 2020-2029 (USD MILLION)
TABLE 98 THAILAND BROADCAST EQUIPMENT MARKET, BY APPLICATION, 2020-2029 (USD MILLION)
TABLE 99 THAILAND TELEVISION IN BROADCAST EQUIPMENT MARKET, BY TYPE, 2020-2029 (USD MILLION)
TABLE 100 THAILAND TERRESTRIAL TELEVISION IN BROADCAST EQUIPMENT MARKET, BY TYPE, 2020-2029 (USD MILLION)
TABLE 101 MALAYSIA BROADCAST EQUIPMENT MARKET, BY FREQUENCY, 2020-2029 (USD MILLION)
TABLE 102 MALAYSIA BROADCAST EQUIPMENT MARKET, BY TECHNOLOGY, 2020-2029 (USD MILLION)
TABLE 103 MALAYSIA BROADCAST EQUIPMENT MARKET, BY POWER RANGE, 2020-2029 (USD MILLION)
TABLE 104 MALAYSIA BROADCAST EQUIPMENT MARKET, BY CONTENT TYPE, 2020-2029 (USD MILLION)
TABLE 105 MALAYSIA BROADCAST EQUIPMENT MARKET, BY PRODUCT TYPE, 2020-2029 (USD MILLION)
TABLE 106 MALAYSIA BROADCAST EQUIPMENT MARKET, BY APPLICATION, 2020-2029 (USD MILLION)
TABLE 107 MALAYSIA TELEVISION IN BROADCAST EQUIPMENT MARKET, BY TYPE, 2020-2029 (USD MILLION)
TABLE 108 MALAYSIA TERRESTRIAL TELEVISION IN BROADCAST EQUIPMENT MARKET, BY TYPE, 2020-2029 (USD MILLION)
TABLE 109 PHILIPPINES BROADCAST EQUIPMENT MARKET, BY FREQUENCY, 2020-2029 (USD MILLION)
TABLE 110 PHILIPPINES BROADCAST EQUIPMENT MARKET, BY TECHNOLOGY, 2020-2029 (USD MILLION)
TABLE 111 PHILIPPINES BROADCAST EQUIPMENT MARKET, BY POWER RANGE, 2020-2029 (USD MILLION)
TABLE 112 PHILIPPINES BROADCAST EQUIPMENT MARKET, BY CONTENT TYPE, 2020-2029 (USD MILLION)
TABLE 113 PHILIPPINES BROADCAST EQUIPMENT MARKET, BY PRODUCT TYPE, 2020-2029 (USD MILLION)
TABLE 114 PHILIPPINES BROADCAST EQUIPMENT MARKET, BY APPLICATION, 2020-2029 (USD MILLION)
TABLE 115 PHILIPPINES TELEVISION IN BROADCAST EQUIPMENT MARKET, BY TYPE, 2020-2029 (USD MILLION)
TABLE 116 PHILIPPINES TERRESTRIAL TELEVISION IN BROADCAST EQUIPMENT MARKET, BY TYPE, 2020-2029 (USD MILLION)
TABLE 117 INDONESIA BROADCAST EQUIPMENT MARKET, BY FREQUENCY, 2020-2029 (USD MILLION)
TABLE 118 INDONESIA BROADCAST EQUIPMENT MARKET, BY TECHNOLOGY, 2020-2029 (USD MILLION)
TABLE 119 INDONESIA BROADCAST EQUIPMENT MARKET, BY POWER RANGE, 2020-2029 (USD MILLION)
TABLE 120 INDONESIA BROADCAST EQUIPMENT MARKET, BY CONTENT TYPE, 2020-2029 (USD MILLION)
TABLE 121 INDONESIA BROADCAST EQUIPMENT MARKET, BY PRODUCT TYPE, 2020-2029 (USD MILLION)
TABLE 122 INDONESIA BROADCAST EQUIPMENT MARKET, BY APPLICATION, 2020-2029 (USD MILLION)
TABLE 123 INDONESIA TELEVISION IN BROADCAST EQUIPMENT MARKET, BY TYPE, 2020-2029 (USD MILLION)
TABLE 124 INDONESIA TERRESTRIAL TELEVISION IN BROADCAST EQUIPMENT MARKET, BY TYPE, 2020-2029 (USD MILLION)
TABLE 125 REST OF ASIA-PACIFIC BROADCAST EQUIPMENT MARKET, BY FREQUENCY, 2020-2029 (USD MILLION)
List of Figure
FIGURE 1 ASIA-PACIFIC BROADCAST EQUIPMENT MARKET: SEGMENTATION
FIGURE 2 ASIA-PACIFIC BROADCAST EQUIPMENT MARKET: DATA TRIANGULATION
FIGURE 3 ASIA-PACIFIC BROADCAST EQUIPMENT MARKET: DROC ANALYSIS
FIGURE 4 ASIA-PACIFIC BROADCAST EQUIPMENT MARKET: ASIA-PACIFIC VS REGIONAL MARKET ANALYSIS
FIGURE 5 ASIA-PACIFIC BROADCAST EQUIPMENT MARKET: COMPANY RESEARCH ANALYSIS
FIGURE 6 ASIA-PACIFIC BROADCAST EQUIPMENT MARKET: INTERVIEW DEMOGRAPHICS
FIGURE 7 ASIA-PACIFIC BROADCAST EQUIPMENT MARKET: DBMR MARKET POSITION GRID
FIGURE 8 ASIA-PACIFIC BROADCAST EQUIPMENT MARKET: VENDOR SHARE ANALYSIS
FIGURE 9 ASIA-PACIFIC BROADCAST EQUIPMENT MARKET: SEGMENTATION
FIGURE 10 IIMPLEMENTATION OF AI-BASED TECHNOLOGIES FOR BROADCASTING IS EXPECTED TO DRIVE THE ASIA-PACIFIC BROADCAST EQUIPMENT MARKET IN THE FORECAST PERIOD OF 2022 TO 2029
FIGURE 11 ULTRA-HIGH FREQUENCY SEGMENT IS EXPECTED TO ACCOUNT FOR THE LARGEST SHARE OF THE ASIA-PACIFIC BROADCAST EQUIPMENT MARKET IN 2022 & 2029
FIGURE 12 DRIVERS, RESTRAINTS, OPPORTUNITIES, AND CHALLENGES OF ASIA-PACIFIC BROADCAST EQUIPMENT MARKET
FIGURE 13 ASIA-PACIFIC BROADCAST EQUIPMENT MARKET: BY FREQUENCY, 2021
FIGURE 14 ASIA-PACIFIC BROADCAST EQUIPMENT MARKET: BY TECHNOLOGY, 2021
FIGURE 15 ASIA-PACIFIC BROADCAST EQUIPMENT MARKET: BY POWER RANGE, 2021
FIGURE 16 ASIA-PACIFIC BROADCAST EQUIPMENT MARKET: BY CONTENT TYPE, 2021
FIGURE 17 ASIA-PACIFIC BROADCAST EQUIPMENT MARKET: BY PRODUCT TYPE, 2021
FIGURE 18 ASIA-PACIFIC BROADCAST EQUIPMENT MARKET: BY APPLICATION, 2021
FIGURE 19 ASIA-PACIFIC BROADCAST EQUIPMENT MARKET: SNAPSHOT (2021)
FIGURE 20 ASIA-PACIFIC BROADCAST EQUIPMENT MARKET: BY COUNTRY (2021)
FIGURE 21 ASIA-PACIFIC BROADCAST EQUIPMENT MARKET: BY COUNTRY (2022 & 2029)
FIGURE 22 ASIA-PACIFIC BROADCAST EQUIPMENT MARKET: BY COUNTRY (2021 & 2029)
FIGURE 23 ASIA-PACIFIC BROADCAST EQUIPMENT MARKET: BY FREQUENCY (2022-2029)
FIGURE 24 ASIA-PACIFIC BROADCAST EQUIPMENT MARKET: COMPANY SHARE 2021 (%)
Asia Pacific Broadcast Equipment Market, Supply Chain Analysis and Ecosystem Framework
To support market growth and help clients navigate the impact of geopolitical shifts, DBMR has integrated in-depth supply chain analysis into its Asia Pacific Broadcast Equipment Market research reports. This addition empowers clients to respond effectively to global changes affecting their industries. The supply chain analysis section includes detailed insights such as Asia Pacific Broadcast Equipment Market consumption and production by country, price trend analysis, the impact of tariffs and geopolitical developments, and import and export trends by country and HSN code. It also highlights major suppliers with data on production capacity and company profiles, as well as key importers and exporters. In addition to research, DBMR offers specialized supply chain consulting services backed by over a decade of experience, providing solutions like supplier discovery, supplier risk assessment, price trend analysis, impact evaluation of inflation and trade route changes, and comprehensive market trend analysis.
Data collection and base year analysis are done using data collection modules with large sample sizes. The stage includes obtaining market information or related data through various sources and strategies. It includes examining and planning all the data acquired from the past in advance. It likewise envelops the examination of information inconsistencies seen across different information sources. The market data is analysed and estimated using market statistical and coherent models. Also, market share analysis and key trend analysis are the major success factors in the market report. To know more, please request an analyst call or drop down your inquiry.
The key research methodology used by DBMR research team is data triangulation which involves data mining, analysis of the impact of data variables on the market and primary (industry expert) validation. Data models include Vendor Positioning Grid, Market Time Line Analysis, Market Overview and Guide, Company Positioning Grid, Patent Analysis, Pricing Analysis, Company Market Share Analysis, Standards of Measurement, Global versus Regional and Vendor Share Analysis. To know more about the research methodology, drop in an inquiry to speak to our industry experts.
Data Bridge Market Research is a leader in advanced formative research. We take pride in servicing our existing and new customers with data and analysis that match and suits their goal. The report can be customized to include price trend analysis of target brands understanding the market for additional countries (ask for the list of countries), clinical trial results data, literature review, refurbished market and product base analysis. Market analysis of target competitors can be analyzed from technology-based analysis to market portfolio strategies. We can add as many competitors that you require data about in the format and data style you are looking for. Our team of analysts can also provide you data in crude raw excel files pivot tables (Fact book) or can assist you in creating presentations from the data sets available in the report.


