
Asia Pacific Gas Treatment Market
Market Size in USD Billion
 USD
1.66 Billion
USD
2.49 Billion
2025
2033
USD
1.66 Billion
USD
2.49 Billion
2025
2033
| 2026 - 2033 | |
| USD 1.66 Billion | |
| USD 2.49 Billion | |
| % | |
|
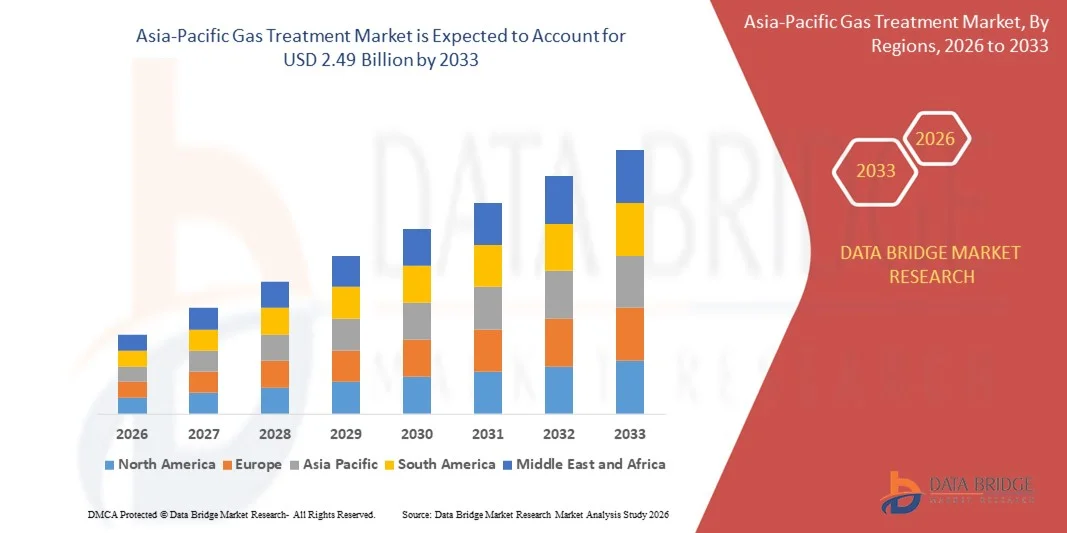
Asia-Pacific Gas Treatment Market Size
- The Asia-Pacific gas treatment market size was valued at USD 1.66 billion in 2025 and is expected to reach USD 2.49 billion by 2033, at a CAGR of 5.2% during the forecast period
- The market growth is largely fueled by the rising need to reduce harmful emissions from industrial operations, driven by stricter environmental regulations and sustainability targets across energy-intensive sectors. Increasing natural gas processing, refining activities, and expansion of hydrogen and LNG infrastructure are accelerating the adoption of advanced gas treatment technologies in both developed and emerging economies
- Furthermore, growing investments in carbon capture, utilization, and storage projects and the shift toward cleaner fuels are strengthening demand for efficient gas purification solutions. These converging factors are accelerating the deployment of gas treatment systems, thereby significantly supporting overall market growth
Asia-Pacific Gas Treatment Market Analysis
- Gas treatment technologies, which remove contaminants such as hydrogen sulfide, carbon dioxide, moisture, and other impurities from gas streams, are critical for ensuring operational safety, equipment protection, and regulatory compliance across oil & gas, power generation, and industrial applications
- The escalating demand for gas treatment solutions is primarily driven by rising global energy consumption, increasing focus on low-carbon and clean energy production, and the growing need to meet stringent emission standards, positioning gas treatment as a foundational component of modern energy and industrial infrastructure
- China dominated the gas treatment market in 2025, due to high natural gas consumption, extensive development of unconventional gas resources, and strong investments in gas processing infrastructure to support power generation, chemicals, and industrial demand
- India is expected to be the fastest growing country in the gas treatment market during the forecast period due to rapid expansion of natural gas infrastructure, rising LNG imports, and increasing use of gas in power, fertilizers, and city gas distribution
- Oil & gas segment dominated the market with a market share of 42.15% in 2025, due to extensive upstream and midstream operations requiring continuous gas purification to meet safety and quality standards. High production volumes and regulatory pressure on emissions continue to drive demand in this segment
Report Scope and Gas Treatment Market Segmentation
|
Attributes |
Gas Treatment Key Market Insights |
|
Segments Covered |
|
|
Countries Covered |
Asia-Pacific
|
|
Key Market Players |
|
|
Market Opportunities |
|
|
Value Added Data Infosets |
In addition to the insights on market scenarios such as market value, growth rate, segmentation, geographical coverage, and major players, the market reports curated by the Data Bridge Market Research also include import export analysis, production capacity overview, production consumption analysis, price trend analysis, climate change scenario, supply chain analysis, value chain analysis, raw material/consumables overview, vendor selection criteria, PESTLE Analysis, Porter Analysis, and regulatory framework. |
Asia-Pacific Gas Treatment Market Trends
Increasing Adoption of Carbon Capture and Storage Technologies
- A key trend in the gas treatment market is the accelerating adoption of carbon capture and storage technologies as industries seek to reduce carbon dioxide emissions and comply with global decarbonization targets. This trend is strengthening the role of gas treatment systems as essential solutions for separating, capturing, and conditioning CO₂ from industrial gas streams across energy and manufacturing sectors
- For instance, Exxon Mobil Corporation has expanded its carbon capture and storage operations at the LaBarge facility in Wyoming, where gas treatment technologies are used to capture large volumes of carbon dioxide from natural gas processing. This deployment demonstrates how advanced treatment systems are being integrated into large-scale industrial operations to support emissions reduction goals
- Energy companies are increasingly combining gas treatment with carbon capture infrastructure to enhance operational efficiency while meeting environmental regulations. This integration is supporting cleaner processing of natural gas and industrial off-gases, reinforcing the relevance of gas treatment solutions in low-carbon transition strategies
- The oil & gas and power generation sectors are adopting CCS-enabled gas treatment to extend the operational life of existing assets while reducing their environmental footprint. This is creating sustained demand for advanced amine-based and physical solvent treatment technologies
- Governments and regulatory bodies are promoting CCS projects through policy support and funding programs, which is further accelerating the deployment of gas treatment systems. This regulatory backing is positioning gas treatment as a critical enabler of long-term emissions management
- The increasing focus on carbon neutrality and industrial decarbonization is reinforcing this trend, driving consistent investments in gas treatment technologies that support large-scale carbon capture and sustainable energy production
Asia-Pacific Gas Treatment Market Dynamics
Driver
Stringent Environmental Regulations on Industrial Gas Emissions
- Stringent environmental regulations aimed at controlling sulfur oxides, carbon dioxide, and other harmful emissions are a major driver of the gas treatment market. Regulatory frameworks across major economies require industries to install efficient gas purification systems to meet emission limits and ensure safe operations
- For instance, U.S. Environmental Protection Agency enforces emission standards that mandate the removal of acid gases from industrial exhaust and natural gas streams. Compliance with these standards has driven widespread adoption of gas treatment units across refineries, power plants, and chemical facilities
- Refineries and natural gas processing plants are investing heavily in gas treatment technologies to meet sulfur recovery and emission control requirements. These investments are directly supporting market growth by increasing demand for advanced absorption and separation systems
- The expansion of LNG terminals and cross-border gas pipelines has intensified regulatory scrutiny on gas quality and emissions. This has further increased reliance on gas treatment systems to ensure compliance and operational reliability
- The continued tightening of emission standards is expected to sustain this driver over the long term, reinforcing gas treatment as a critical solution for regulatory compliance and environmental protection
Restraint/Challenge
High Capital and Operational Costs of Advanced Gas Treatment Systems
- The gas treatment market faces challenges due to the high capital investment and operational costs associated with advanced treatment technologies. Installation of large-scale absorption units, solvent regeneration systems, and carbon capture infrastructure requires significant upfront expenditure
- For instance, Shell International B.V. has highlighted the substantial capital requirements involved in deploying advanced gas treatment and carbon capture systems within its large processing facilities. These costs can limit adoption, particularly among smaller operators
- Operational expenses related to solvent management, energy consumption, and maintenance further increase the total cost of ownership for gas treatment systems. This cost burden can impact project feasibility, especially in volatile energy price environments
- Advanced gas treatment technologies often require skilled labor and specialized equipment, adding complexity to system operation and maintenance. These factors contribute to longer payback periods and financial risk for end users
- Despite strong regulatory and sustainability drivers, these cost-related challenges continue to restrain market growth, compelling technology providers to focus on efficiency improvements and cost-optimization strategies
Asia-Pacific Gas Treatment Market Scope
The market is segmented on the basis of type, type of gas, treatment, technology, and industry.
- By Type
On the basis of type, the Gas Treatment market is segmented into tertiary amine, primary amine, secondary amine, and non-amines. The tertiary amine segment dominated the market with the largest revenue share in 2025, driven by its high selectivity for acid gas removal and lower energy consumption during regeneration. Tertiary amines are widely preferred in large-scale gas processing facilities due to their operational efficiency and reduced corrosion issues, making them suitable for long-term continuous operations. Their strong performance in treating high-sulfur-content gas streams further supports their dominance.
The secondary amine segment is anticipated to witness the fastest growth from 2026 to 2033, supported by its higher reaction rates with acid gases and suitability for treating moderately contaminated gas streams. Growing investments in mid-sized gas processing units and refineries are accelerating adoption, as secondary amines offer a balance between absorption efficiency and operating cost.
- By Type of Gas
On the basis of type of gas, the market is segmented into acid gas and synthesis gas. The acid gas segment accounted for the largest market share in 2025, owing to strict environmental regulations targeting sulfur dioxide and carbon dioxide emissions from oil & gas and refining operations. High volumes of natural gas processing activities globally continue to drive sustained demand for acid gas treatment solutions.
The synthesis gas segment is projected to register the fastest growth during the forecast period, driven by rising production of hydrogen, ammonia, and methanol. Expanding use of syngas in clean fuel generation and chemical manufacturing is increasing the need for advanced purification and treatment systems.
- By Treatment
On the basis of treatment, the Gas Treatment market is segmented into acid gas removal, dehydration, and others. Acid gas removal dominated the market in 2025 due to its critical role in meeting emission standards and protecting downstream equipment from corrosion and fouling. This treatment is extensively deployed across natural gas processing plants and refineries to ensure gas quality and regulatory compliance.
The dehydration segment is expected to grow at the fastest rate from 2026 to 2033, supported by increasing demand for moisture-free gas in pipeline transportation and LNG production. Rising investments in gas infrastructure and export facilities are strengthening the adoption of efficient dehydration technologies.
- By Technology
On the basis of technology, the market is segmented into OASE, Flexsorb, ADIP, UOP, SPREX, and others. The OASE technology segment held the largest revenue share in 2025, driven by its flexibility in handling diverse gas compositions and its ability to reduce operating costs. Its widespread use in large gas processing projects supports its strong market position.
The Flexsorb segment is anticipated to witness the fastest growth during the forecast period, owing to its high sulfur removal efficiency and suitability for treating gases with high H₂S concentrations. Increasing deployment in complex gas fields is contributing to rapid adoption.
- By Industry
On the basis of industry, the Gas Treatment market is segmented into power plants, refineries, metal & mining, oil & gas, pulp & paper, food & beverages, and others. The oil & gas segment dominated the market with the largest share of 42.15% in 2025, supported by extensive upstream and midstream operations requiring continuous gas purification to meet safety and quality standards. High production volumes and regulatory pressure on emissions continue to drive demand in this segment.
The power plants segment is expected to register the fastest growth from 2026 to 2033, driven by increasing use of natural gas for power generation and stricter emission norms. Rising focus on cleaner energy production is accelerating the adoption of advanced gas treatment systems in power generation facilities.
Asia-Pacific Gas Treatment Market Regional Analysis
- China dominated the gas treatment market with the largest revenue share in 2025, driven by high natural gas consumption, extensive development of unconventional gas resources, and strong investments in gas processing infrastructure to support power generation, chemicals, and industrial demand
- Stringent environmental regulations on sulfur emissions, rapid expansion of LNG import terminals, and increasing processing of sour and low-quality gas streams reinforce China’s leadership in the regional market
- The presence of large state-owned energy companies, continuous capacity additions in gas sweetening and sulfur recovery units, and long-term focus on cleaner energy transition consolidate China’s dominant position during the forecast period. Ongoing pipeline expansions and integration of advanced treatment technologies further strengthen market penetration
Japan Gas Treatment Market Insight
Japan is anticipated to grow steadily from 2026 to 2033, supported by stable demand for high-purity gas across power generation, city gas distribution, and industrial applications. Strong reliance on LNG imports drives consistent need for efficient gas treatment and purification systems to meet strict quality and safety standards. Focus on operational reliability, emission reduction, and advanced processing technologies underpins steady adoption. Continuous technology upgrades and emphasis on energy efficiency reinforce Japan’s stable growth outlook in the regional gas treatment market.
India Gas Treatment Market Insight
India is projected to register the fastest CAGR in the Asia-Pacific gas treatment market during 2026–2033, fueled by rapid expansion of natural gas infrastructure, rising LNG imports, and increasing use of gas in power, fertilizers, and city gas distribution. Growing investments in pipelines, gas processing plants, and clean energy initiatives are accelerating adoption of gas treatment solutions. Rising focus on reducing emissions, improving gas quality, and expanding access to cleaner fuels supports strong growth momentum. Government-led energy diversification strategies position India as the fastest-growing market in the region.
Asia-Pacific Gas Treatment Market Share
The gas treatment industry is primarily led by well-established companies, including:
- BASF SE (Germany)
- Dow (U.S.)
- Exxon Mobil Corporation (U.S.)
- Shell International B.V. (Netherlands)
- Honeywell International Inc. (U.S.)
- INEOS (U.K.)
- Eastman Chemical Company (U.S.)
- CLARIANT (Switzerland)
- Ecolab (U.S.)
- Huntsman International LLC (U.S.)
- Cabot Corporation (U.S.)
- Lhoist Group (Belgium)
- Axens (France)
- BERRYMAN CHEMICAL (U.S.)
- John Wood Group PLC (U.K.)
- Eunisell Chemicals (Nigeria)
Latest Developments in Asia-Pacific Gas Treatment Market
- In October 2025, Honeywell introduced a digital platform powered by AI and machine learning to optimize gas treatment operations, directly strengthening efficiency and reliability across the market. This development supports the growing shift toward digitalization in gas treatment, enabling operators to reduce downtime, improve process control, and lower operating costs. By embedding advanced analytics into gas treatment workflows, the platform enhances decision-making and accelerates adoption of smart, data-driven treatment solutions across energy and industrial facilities
- In September 2025, Air Products and Chemicals unveiled a new hydrogen production and gas treatment facility in the Gulf Coast region, significantly expanding its treatment and purification capacity. This development reinforces the gas treatment market’s role in supporting hydrogen as a core element of the energy transition, while improving cost efficiency through advanced treatment technologies. The facility strengthens supply reliability and positions gas treatment as a critical enabler of large-scale clean hydrogen production
- In August 2025, Linde announced a strategic partnership to develop integrated carbon capture and storage solutions, enhancing its portfolio of sustainable gas treatment offerings. This collaboration supports market growth by accelerating deployment of advanced treatment systems designed to reduce industrial emissions. The partnership aligns gas treatment technologies more closely with global decarbonization targets, reinforcing their importance in low-carbon industrial transformation
- In 2021, Shell announced the development of an 820,000-tonnes-per-year biofuels facility in Rotterdam focused on sustainable aviation fuel and renewable diesel from waste feedstocks. This initiative strengthened the gas treatment market by increasing demand for advanced purification and emissions-control technologies required in biofuel production. The project highlighted the role of gas treatment systems in lowering carbon intensity and supporting cleaner fuel pathways across the energy sector
- In 2021, Exxon Mobil Corporation expanded its carbon capture and storage operations at the LaBarge facility in Wyoming to capture up to 1 million metric tons of carbon dioxide annually. This expansion underscored the rising importance of gas treatment technologies in large-scale emissions reduction initiatives. The project contributed to broader market growth by validating carbon capture as a viable, long-term solution for meeting environmental compliance and climate goals
SKU-

- Interactive Data Analysis Dashboard
- Company Analysis Dashboard for high growth potential opportunities
- Research Analyst Access for customization & queries
- Competitor Analysis with Interactive dashboard
- Latest News, Updates & Trend analysis
- Harness the Power of Benchmark Analysis for Comprehensive Competitor Tracking
Asia Pacific Gas Treatment Market, Supply Chain Analysis and Ecosystem Framework
To support market growth and help clients navigate the impact of geopolitical shifts, DBMR has integrated in-depth supply chain analysis into its Asia Pacific Gas Treatment Market research reports. This addition empowers clients to respond effectively to global changes affecting their industries. The supply chain analysis section includes detailed insights such as Asia Pacific Gas Treatment Market consumption and production by country, price trend analysis, the impact of tariffs and geopolitical developments, and import and export trends by country and HSN code. It also highlights major suppliers with data on production capacity and company profiles, as well as key importers and exporters. In addition to research, DBMR offers specialized supply chain consulting services backed by over a decade of experience, providing solutions like supplier discovery, supplier risk assessment, price trend analysis, impact evaluation of inflation and trade route changes, and comprehensive market trend analysis.
Data collection and base year analysis are done using data collection modules with large sample sizes. The stage includes obtaining market information or related data through various sources and strategies. It includes examining and planning all the data acquired from the past in advance. It likewise envelops the examination of information inconsistencies seen across different information sources. The market data is analysed and estimated using market statistical and coherent models. Also, market share analysis and key trend analysis are the major success factors in the market report. To know more, please request an analyst call or drop down your inquiry.
The key research methodology used by DBMR research team is data triangulation which involves data mining, analysis of the impact of data variables on the market and primary (industry expert) validation. Data models include Vendor Positioning Grid, Market Time Line Analysis, Market Overview and Guide, Company Positioning Grid, Patent Analysis, Pricing Analysis, Company Market Share Analysis, Standards of Measurement, Global versus Regional and Vendor Share Analysis. To know more about the research methodology, drop in an inquiry to speak to our industry experts.
Data Bridge Market Research is a leader in advanced formative research. We take pride in servicing our existing and new customers with data and analysis that match and suits their goal. The report can be customized to include price trend analysis of target brands understanding the market for additional countries (ask for the list of countries), clinical trial results data, literature review, refurbished market and product base analysis. Market analysis of target competitors can be analyzed from technology-based analysis to market portfolio strategies. We can add as many competitors that you require data about in the format and data style you are looking for. Our team of analysts can also provide you data in crude raw excel files pivot tables (Fact book) or can assist you in creating presentations from the data sets available in the report.


