
Asia Pacific Iron Deficiency Anemia Therapy Market
Market Size in USD Billion
 USD
480.65 Billion
USD
1,856.30 Billion
2022
2030
USD
480.65 Billion
USD
1,856.30 Billion
2022
2030
| 2023 - 2030 | |
| USD 480.65 Billion | |
| USD 1,856.30 Billion | |
| % | |
Asia-Pacific Iron-Deficiency Anemia Therapy Market Analysis and Size
Anemia is one of the most prevalent blood disorders in the current times. Intravenous iron drugs are facing much use due to its improved quality of treatment outside the dialysis. There has been increasing number of diabetic patients globally and increasing aging population which in turn is letting the adoption of iron-deficiency anemia therapy. The number of research that aids the use of oral iron therapy as a substitute to intravenous treatments in hospital settings is also projected to increase the adoption of oral iron therapy among the population.
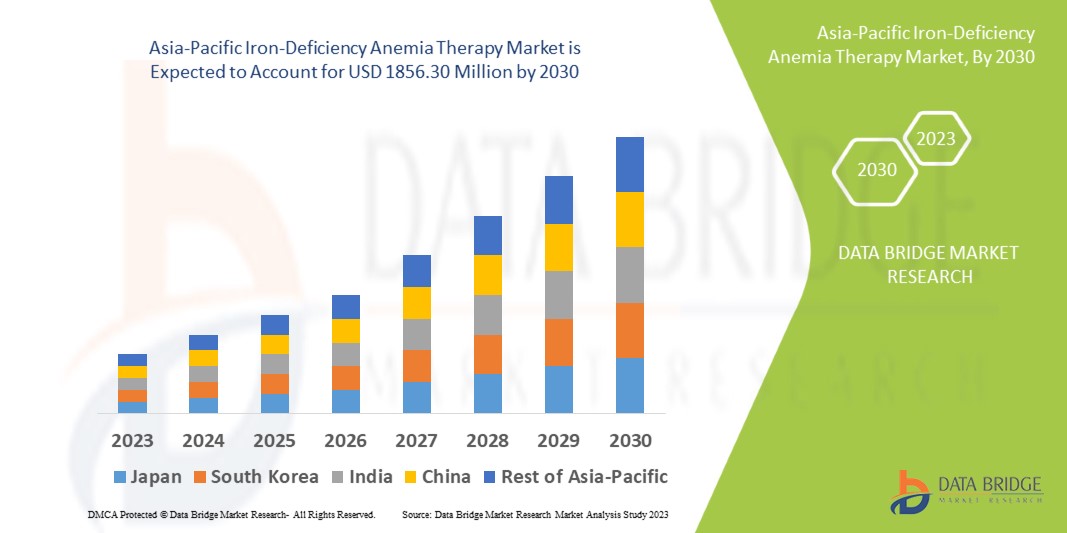
Data Bridge Market Research analyses a growth rate in the iron-deficiency anemia therapy market in the forecast period 2023-2030. The expected CAGR of iron-deficiency anemia therapy market is tend to be around 18.4% in the mentioned forecast period. The market value is USD 480.65 million in 2022, and it would grow upto USD 1856.30 million by 2030. In addition to the insights on market scenarios such as market value, growth rate, segmentation, geographical coverage, and major players, the market reports curated by the Data Bridge Market Research also include depth expert analysis, patient epidemiology, pipeline analysis, pricing analysis, and regulatory framework.
Asia-Pacific Iron-Deficiency Anemia Therapy Market Scope and Segmentation
|
Report Metric |
Details |
|
Forecast Period |
2023 to 2030 |
|
Base Year |
2022 |
|
Historic Years |
2021 (Customizable to 2015 - 2020) |
|
Quantitative Units |
Revenue in USD Million, Volumes in Units, Pricing in USD |
|
Segments Covered |
Therapy (Parenteral Iron Therapy and Oral Iron Therapy), Therapy Areas (Inflammatory Bowel Disease, Renal, Obstetrics and Gynecology, Congestive Heart Failure (CHF), Oncology and Others) Population (Adults, Pediatric and Geriatric), End-Users (Hospitals, Homecare, Speciality Centres, Others), Distribution Channel (Hospital Pharmacy, Online Pharmacy, Retail Pharmacy) |
|
Countries Covered |
China, Japan, India, South Korea, Singapore, Malaysia, Australia, Thailand, Indonesia, Philippines, Rest of Asia-Pacific (APAC) in the Asia-Pacific (APAC) |
|
Market Players Covered |
Teva Pharmaceutical Industries Ltd. (Israel), Sanofi (France), Pfizer Inc. (U.S.), Novartis AG (Switzerland), Bayer AG (Germany), Merck & Co., Inc. (U.S.), Abbott (U.S.), AbbVie Inc. (U.S.), Sun Pharmaceutical Industries Ltd. (India), Hikma Pharmaceuticals PLC (U.K.), Covis Pharma GmbH (U.S.), PHARMACOSMOS A/S (Denmark), Vifor Pharma Management Ltd. (Switzerland), Orion Corporation (Finland), Pharmacosmos A/S (Denmark), Shield Therapeutics (U.K.), Advanz Pharmaceutical (U.K.), Alkem Labs (India) |
|
Market Opportunities |
|
Market Definition
Iron deficiency anemia is a type of anemia that occurs when the body's iron stores are reduced. An inadequacy of healthy red blood cells cause anemia. RBCs supply oxygen to human tissues. Iron is important in the production of haemoglobin. Haemoglobin deficiency shows lack of oxygen in the body. It's essential to keep your iron levels in check. Consumption of iron-rich foods such as meat, vegetables, fruits, and cereals can help to treat or prevent iron deficiency. Vitamin C can help to prevent iron deficiency
Asia-Pacific Iron-Deficiency Anemia Therapy Market Dynamics
Drivers
- Rising Incidences of Chronic Kidney Disease
According to the records of National Kidney Foundation, Inc., the two primary causes of chronic kidney disease are diabetes and hypertension. Much of this growing burden of chronic disease is anticipated to be observed in Asia, the most populous continent with a population of >4.5 billion people. There is a major variation in CKD prevalence (7.0%–34.3%) across Asia. We estimate that up to around 434.3 million people have CKD across the Eastern, Southern and South-East regions of Asia, with most of the disease burden observed in China and India. It is anticipated that the incidence of chronic kidney cases will rise across highly economic countries, such as India and China which infers an increase in the aged population over the upcoming years.
- Growing Adoption of Oral Iron Therapy
The oral iron therapy is anticipated to witness huge growth during the forecast period due to the factors such as rise in the patient population suffering from anemia and anemia-causing diseases. In addition to this, an increasing number of research that supports the use of oral iron therapy as a substitute for intravenous treatments in hospital settings is also anticipated to increase the adoption of oral iron therapy among people, thus boosting the segment growth.
Opportunities
- Increase in Anaemia
According to the records of the National Heart, Lung, and Blood Institute, an expected 3 million individuals suffer from anaemia in Asia-Pacific. Rising incidence of target diseases, such as rheumatoid arthritis, autoimmune diseases, kidney conditions, liver disorders, thyroid diseases, cancer, and inflammatory bowel diseases, is a primary factor helping in the growth of the market for intravenous iron. The World Health Organization expected that iron deficiency anemia took the lives of 273,000 people in 2004. Around 45% were Southeast Asian, 31% African, 9% Eastern Mediterranean, 4% Oceania, and 3% European. Out of all anemia cases, about 97% are found in middle-income countries. Thus, it creates opportunity for the market growth.
- Increasing Incidence of Cancer
A rising number of cancer patients tend to develop iron deficiency anemia. Common types of cancer that are widely associated with anemia includes bone cancer, cervical cancer, blood cancer, colon cancer, and prostate cancer. Lung and breast tumors have been specified with the highest prevalence of anemia among solid tumors. Hematologic malignancies such as lymphoma, leukemia, and multiple myeloma produce abnormal blood cells that as a result harm the immune system and cause anemia. Cancer treatments such as chemotherapy and radiation therapy also increase anemia in cancer patients. This creates more opportunity in the market.
Restraints/Challenges
- Serious Effects of Iron Supplements
There are few adverse effects that are related with the intake of iron drugs. Common effects of include digestive problems such as loss of appetite, constipation, nausea, stomach aches, and vomiting. The overdose of these drugs may also lead to tiredness or weakness, shallow or rapid breathing, convulsions, fatigue, bluish skin, pale skin or fingernails. Thus, this hampers the market growth.
This iron-deficiency anemia therapy market report provides details of new recent developments, trade regulations, import-export analysis, production analysis, value chain optimization, market share, impact of domestic and localized market players, analyses opportunities in terms of emerging revenue pockets, changes in market regulations, strategic market growth analysis, market size, category market growths, application niches and dominance, product approvals, product launches, geographic expansions, technological innovations in the market. To gain more info on the iron-deficiency anemia therapy market contact Data Bridge Market Research for an Analyst Brief, our team will help you take an informed market decision to achieve market growth.
COVID-19 Impact on Asia-Pacific Iron-Deficiency Anemia Therapy Market
The COVID-19 outbreak has disturbed the manufacturing and supply of intravenous iron drugs, however, increased initiatives by manufacturers and government to meet the demand has aided the growth of the market for intravenous iron drugs. In addition to this, numerous studies have recommended that Covid-19 infection has huge risk of Acute Kidney Injury (AKI) and CKD, which, in turn, has fuelled the demand for intravenous iron drugs for the treatment of CKD-related anemia. Health authorities advised that COVID-19 patients who had an acute kidney injury should be tested often as their risk of developing CKD is higher than others. Thus, COVID-19 had a major impact on the market growth.
Asia-Pacific Iron-Deficiency Anemia Therapy Market Scope
The iron-deficiency anemia therapy market is segmented on the basis of therapy, therapy areas, population, distribution channel and end-user. The growth amongst these segments will help you analyze meagre growth segments in the industries and provide the users with a valuable market overview and market insights to help them make strategic decisions for identifying core market applications.
Therapy
- Parenteral Iron Therapy
- Oral Iron Therapy
Therapy Areas
- Inflammatory Bowel Disease
- Renal
- Obstetrics and Gynecology
- Congestive Heart Failure (CHF)
- Oncology
- Others
Population
- Adults
- Pediatric
- Geriatric
End-Users
- Hospitals
- Specialty Clinics
- Homecare
- Others
Distribution Channel
- Hospital Pharmacy
- Retail Pharmacy
- Online Pharmacy
- Others
Iron-Deficiency Anemia Therapy Market Regional Analysis/Insights
The iron-deficiency anemia therapy market is analyzed and market size insights and trends are provided by therapy, therapy areas, population, distribution channel and end-user as referenced above.
The major countries covered in the iron-deficiency anemia therapy market report are China, Japan, India, South Korea, Singapore, Malaysia, Australia, Thailand, Indonesia, Philippines, Rest of Asia-Pacific (APAC) in the Asia-Pacific (APAC).
China is leading the market because of the quality and management of health care system, growing research and development activities of anemia drugs among scientists. Also, increased awareness, growing investment by government firm and presence of generic players is leading the market growth.
The country section of the report also provides individual market impacting factors and changes in regulation in the market domestically that impacts the current and future trends of the market. Also, the presence and availability of global brands and their challenges faced due to large or scarce competition from local and domestic brands, impact of domestic tariffs and trade routes are considered while providing forecast analysis of the country data.
Competitive Landscape and Asia-Pacific Iron-Deficiency Anemia Therapy Market Share Analysis
The iron-deficiency anemia therapy market competitive landscape provides details by competitor. Details included are company overview, company financials, revenue generated, market potential, investment in research and development, new market initiatives, global presence, production sites and facilities, production capacities, company strengths and weaknesses, product launch, product width and breadth, application dominance. The above data points provided are only related to the companies' focus related to iron-deficiency anemia therapy market.
Key players operating in the iron-deficiency anemia therapy market include:
- Teva Pharmaceutical Industries Ltd. (Israel)
- Sanofi (France)
- Pfizer Inc. (U.S.)
- GSK plc (U.K.)
- Novartis AG (Switzerland)
- Bayer AG (Germany)
- Cipla Inc. (U.S.)
- Abbott (U.S.)
- AbbVie Inc. (U.S.)
- Sun Pharmaceutical Industries Ltd. (India)
- Aurobindo Pharma (India)
- Lupin (India)
- Hikma Pharmaceuticals PLC (U.K.)
- Covis Pharma GmbH (U.S.)
- PHARMACOSMOS A/S (Denmark)
- Vifor Pharma Management Ltd. (Switzerland)
- Orion Corporation (Finland)
- Pharmacosmos A/S (Denmark)
- Shield Therapeutics (U.K.)
- Advanz Pharmaceutical (U.K.)
- Alkem Labs (India)
SKU-

- Interactive Data Analysis Dashboard
- Company Analysis Dashboard for high growth potential opportunities
- Research Analyst Access for customization & queries
- Competitor Analysis with Interactive dashboard
- Latest News, Updates & Trend analysis
- Harness the Power of Benchmark Analysis for Comprehensive Competitor Tracking
Table of Content
1 INTRODUCTION
1.1 OBJECTIVES OF THE STUDY
1.2 MARKET DEFINITION
1.3 OVERVIEW OF ASIA-PACIFIC IRON-DEFICIENCY ANEMIA THERAPY MARKET
1.4 CURRENCY AND PRICING
1.5 LIMITATION
1.6 MARKETS COVERED
2 MARKET SEGMENTATION
2.1 KEY TAKEAWAYS
2.2 ARRIVING AT THE ASIA-PACIFIC IRON-DEFICIENCY ANEMIA THERAPY SIZE
2.2.1 VENDOR POSITIONING GRID
2.2.2 TECHNOLOGY LIFE LINE CURVE
2.2.3 TRIPOD DATA VALIDATION MODEL
2.2.4 MARKET GUIDE
2.2.5 MULTIVARIATE MODELLING
2.2.6 TOP TO BOTTOM ANALYSIS
2.2.7 CHALLENGE MATRIX
2.2.8 APPLICATION COVERAGE GRID
2.2.9 STANDARDS OF MEASUREMENT
2.2.10 VENDOR SHARE ANALYSIS
2.2.11 DATA POINTS FROM KEY PRIMARY INTERVIEWS
2.2.12 DATA POINTS FROM KEY SECONDARY DATABASES
2.3 ASIA-PACIFIC IRON-DEFICIENCY ANEMIA THERAPY MARKET: RESEARCH SNAPSHOT
2.4 ASSUMPTIONS
3 MARKET OVERVIEW
3.1 DRIVERS
3.2 RESTRAINTS
3.3 OPPORTUNITIES
3.4 CHALLENGES
4 EXECUTIVE SUMMARY
5 PREMIUM INSIGHTS
5.1 PESTEL ANALYSIS
5.2 PORTER’S FIVE FORCES MODEL
6 INDUSTRY INSIGHTS
6.1 PATENT ANALYSIS
6.1.1 PATENT LANDSCAPE
6.1.2 USPTO NUMBER
6.1.3 PATENT EXPIRY
6.1.4 EPIO NUMBER
6.1.5 PATENT STRENGTH AND QUALITY
6.1.6 PATENT CLAIMS
6.1.7 PATENT CITATIONS
6.1.8 PATENT LITIGATION AND LICENSING
6.1.9 FILE OF PATENT
6.1.10 PATENT RECEIVED CONTRIES
6.1.11 TECHNOLOGY BACKGROUND
6.2 DRUG TREATMENT RATE BY MATURED MARKETS
6.3 DEMOGRAPHIC TRENDS: IMPACTS ON ALL INCIDENCE RATES
6.4 PATIENT FLOW DIAGRAM
6.5 KEY PRICING STRATEGIES
6.6 KEY PATIENT ENROLLMENT STRATEGIES
6.7 INTERVIEWS WITH SPECIALIST
6.8 OTHER KOL SNAPSHOTS
7 EPIDEMIOLOGY
8 MERGERS AND ACQUISITION
8.1 LICENSING
8.2 COMMERCIALIZATION AGREEMENTS
9 REGULATORY FRAMEWORK
9.1 REGULATORY APPROVAL PROCESS
9.2 GEOGRAPHIES’ EASE OF REGULATORY APPROVAL
9.3 REGULATORY APPROVAL PATHWAYS
9.4 LICENSING AND REGISTRATION
9.5 POST-MARKETING SURVEILLANCE
9.6 GOOD MANUFACTURING PRACTICES (GMPS) GUIDELINES
10 PIPELINE ANALYSIS
10.1 CLINICAL TRIALS AND PHASE ANALYSIS
10.2 DRUG THERAPY PIPELINE
10.3 PHASE III CANDIDATES
10.4 PHASE II CANDIDATES
10.5 PHASE I CANDIDATES
10.6 OTHERS (PRE-CLINICAL AND RESEARCH)
TABLE 1 ASIA-PACIFIC CLINICAL TRIAL MARKET FOR XX
Company Name Therapeutic Area
XX XX
XX XX
XX XX
XX XX
XX XX
XX XX
Sources: Press Releases, Annual Reports, SEC Filings, Investor Presentations, Other Government Sources, Analysis Based on Inputs from Secondary, Expert Interviews
TABLE 2 DISTRIBUTION OF PRODUCTS AND PROJECTS BY PHASE
Phase Number of Projects
Preclinical/Research Projects XX
Clinical Development XX
Phase I XX
Phase II XX
Phase III XX
U.S. Filed/Approved But Not Yest Marketed XX
Total XX
Sources: Press Releases, Annual Reports, SEC Filings, Investor Presentations, Other Government Sources, Analysis Based on Inputs from Secondary, Expert Interviews
TABLE 3 DISTRIBUTION OF PROJECTS BY THERAPEUTIC AREA AND PHASE
Therapeutic Area Preclinical/ Research Project
XX XX
XX XX
XX XX
XX XX
XX XX
Total Projects XX
Sources: Press Releases, Annual Reports, SEC Filings, Investor Presentations, Other Government Sources, Analysis Based on Inputs from Secondary, Expert Interviews
TABLE 4 DISTRIBUTION OF PROJECTS BY SCIENTIFIC APPROACH AND PHASE
Technology Preclinical/ Research Project
XX XX
XX XX
XX XX
XX XX
XX XX
Total Projects XX
Sources: Press Releases, Annual Reports, SEC Filings, Investor Presentations, Other Government Sources, Analysis Based on Inputs from Secondary, Expert Interviews
FIGURE 1 TOP ENTITIES BASED ON R&D GLANCE FOR XX
Sources: Press Releases, Annual Reports, SEC Filings, Investor Presentations, Other Government Sources, Analysis Based on Inputs from Secondary, Expert Interviews
11 MARKETED DRUG ANALYSIS
11.1 DRUG
11.1.1 BRAND NAME
11.1.2 GENERICS NAME
11.2 THERAPEUTIC INDIACTION
11.3 PHARACOLOGICAL CLASS OD THE DRUG
11.4 DRUG PRIMARY INDICATION
11.5 MARKET STATUS
11.6 MEDICATION TYPE
11.7 DRUG DOSAGES FORM
11.8 DOSAGES AVAILABILITY
11.9 DRUG ROUTE OF ADMINISTRATION
11.1 DOSING FREQUENCY
11.11 DRUG INSIGHT
11.12 AN OVERVIEW OF THE DRUG DEVELOPMENT ACTIVITIES SUCH AS REGULATORY MILSTONE, SAFETY DATA AND EFFICACY DATA, MARKET EXCLUSIVITY DATA.
11.12.1 FORECAST MARKET OUTLOOK
11.12.2 CROSS COMPETITION
11.12.3 THERAPEUTIC PORTFOLIO
11.12.4 CURRENT DEVELOPMENT SCENARIO
12 MARKET ACCESS
12.1 10-YEAR MARKET FORECAST
12.2 CLINICAL TRIAL RECENT UPDATES
12.3 ANNUAL NEW FDA APPROVED DRUGS
12.4 DRUGS MANUFACTURER AND DEALS
12.5 MAJOR DRUG UPTAKE
12.6 CURRENT TREATMENT PRACTICES
12.7 IMPACT OF UPCOMING THERAPY
13 R & D ANALYSIS
13.1 COMPARATIVE ANALYSIS
13.2 DRUG DEVELOPMENTAL LANDSCAPE
13.3 IN-DEPTH INSIGHTS ON REGULATORY MILESTONES
13.4 THERAPEUTIC ASSESSMENT
13.5 ASSET-BASED COLLABORATIONS AND PARTNERSHIPS
14 MARKET OVERVIEW
14.1 DRIVERS
14.2 RESTRAINTS
14.3 OPPORTUNITIES
14.4 CHALLENGES
15 ASIA-PACIFIC IRON-DEFICIENCY ANEMIA THERAPY MARKET, BY THERAPY
15.1 OVERVIEW
15.2 ORAL IRON THERAPY
15.2.1 IRON GLYCINATE (BISGLYCINATE)
15.2.2 FERRIC MALTOL
15.2.3 IRON SUCROSE
15.2.4 FERROUS FUMARATE
15.2.5 IRON POLYMALTOSE
15.2.6 OTHERS
15.3 PARENTERAL IRON THERAPY
15.3.1 FERRIC DERISOMALTOSE
15.3.2 FERRIC CARBOXYMALTOSE
15.3.3 IRON SUCROSE
15.3.4 IRON DEXTRAN
15.3.5 FERROUS FUMARATE
15.3.6 FERRIC CITRATE
15.3.7 IRON ISOMALTOSIDE
15.3.8 OTHERS
16 ASIA-PACIFIC IRON-DEFICIENCY ANEMIA THERAPY MARKET, BY THERAPY AREA
16.1 OVERVIEW
16.2 OBSTETRICS AND GYNECOLOGY
16.2.1 BY THERAPY
16.2.1.1. ORAL IRON THERAPY
16.2.1.1.1. IRON GLYCINATE (BISGLYCINATE)
16.2.1.1.2. FERRIC MALTOL
16.2.1.1.3. IRON SUCROSE
16.2.1.1.4. FERROUS FUMARATE
16.2.1.1.5. IRON POLYMALTOSE
16.2.1.1.6. OTHERS
16.2.1.2. PARENTERAL IRON THERAPY
16.2.1.2.1. FERRIC DERISOMALTOSE
16.2.1.2.2. FERRIC CARBOXYMALTOSE
16.2.1.2.3. IRON SUCROSE
16.2.1.2.4. IRON DEXTRAN
16.2.1.2.5. FERROUS FUMARATE
16.2.1.2.6. FERRIC CITRATE
16.2.1.2.7. IRON ISOMALTOSIDE
16.2.1.2.8. OTHERS
16.3 RENAL DISEASES
16.3.1 BY TYPE
16.3.1.1. DIALYSIS
16.3.1.2. NON-DIALYSIS
16.3.2 BY THERAPY
16.3.2.1. ORAL IRON THERAPY
16.3.2.1.1. IRON GLYCINATE (BISGLYCINATE)
16.3.2.1.2. FERRIC MALTOL
16.3.2.1.3. IRON SUCROSE
16.3.2.1.4. FERROUS FUMARATE
16.3.2.1.5. IRON POLYMALTOSE
16.3.2.1.6. OTHERS
16.3.2.2. PARENTERAL IRON THERAPY
16.3.2.2.1. FERRIC DERISOMALTOSE
16.3.2.2.2. FERRIC CARBOXYMALTOSE
16.3.2.2.3. IRON SUCROSE
16.3.2.2.4. IRON DEXTRAN
16.3.2.2.5. FERROUS FUMARATE
16.3.2.2.6. FERRIC CITRATE
16.3.2.2.7. IRON ISOMALTOSIDE
16.3.2.2.8. OTHERS
16.4 CONGESTIVE HEART FAILURE (CHF)
16.4.1 BY THERAPY
16.4.1.1. ORAL IRON THERAPY
16.4.1.1.1. IRON GLYCINATE (BISGLYCINATE)
16.4.1.1.2. FERRIC MALTOL
16.4.1.1.3. IRON SUCROSE
16.4.1.1.4. FERROUS FUMARATE
16.4.1.1.5. IRON POLYMALTOSE
16.4.1.1.6. OTHERS
16.4.1.2. PARENTERAL IRON THERAPY
16.4.1.2.1. FERRIC DERISOMALTOSE
16.4.1.2.2. FERRIC CARBOXYMALTOSE
16.4.1.2.3. IRON SUCROSE
16.4.1.2.4. IRON DEXTRAN
16.4.1.2.5. FERROUS FUMARATE
16.4.1.2.6. FERRIC CITRATE
16.4.1.2.7. IRON ISOMALTOSIDE
16.4.1.2.8. OTHERS
16.5 INFLAMMATORY BOWEL DISEASE
16.5.1 BY THERAPY
16.5.1.1. ORAL IRON THERAPY
16.5.1.1.1. IRON GLYCINATE (BISGLYCINATE)
16.5.1.1.2. FERRIC MALTOL
16.5.1.1.3. IRON SUCROSE
16.5.1.1.4. FERROUS FUMARATE
16.5.1.1.5. IRON POLYMALTOSE
16.5.1.1.6. OTHERS
16.5.1.2. PARENTERAL IRON THERAPY
16.5.1.2.1. FERRIC DERISOMALTOSE
16.5.1.2.2. FERRIC CARBOXYMALTOSE
16.5.1.2.3. IRON SUCROSE
16.5.1.2.4. IRON DEXTRAN
16.5.1.2.5. FERROUS FUMARATE
16.5.1.2.6. FERRIC CITRATE
16.5.1.2.7. IRON ISOMALTOSIDE
16.5.1.2.8. OTHERS
16.6 ONCOLOGY
16.6.1 BY THERAPY
16.6.1.1. ORAL IRON THERAPY
16.6.1.1.1. IRON GLYCINATE (BISGLYCINATE)
16.6.1.1.2. FERRIC MALTOL
16.6.1.1.3. IRON SUCROSE
16.6.1.1.4. FERROUS FUMARATE
16.6.1.1.5. IRON POLYMALTOSE
16.6.1.1.6. OTHERS
16.6.1.2. PARENTERAL IRON THERAPY
16.6.1.2.1. FERRIC DERISOMALTOSE
16.6.1.2.2. FERRIC CARBOXYMALTOSE
16.6.1.2.3. IRON SUCROSE
16.6.1.2.4. IRON DEXTRAN
16.6.1.2.5. FERROUS FUMARATE
16.6.1.2.6. FERRIC CITRATE
16.6.1.2.7. IRON ISOMALTOSIDE
16.6.1.2.8. OTHERS
16.7 OTHERS
17 ASIA-PACIFIC IRON-DEFICIENCY ANEMIA THERAPY MARKET, BY POPULATION
17.1 OVERVIEW
17.2 PEDIATRIC
17.3 ADULTS
18 ASIA-PACIFIC IRON-DEFICIENCY ANEMIA THERAPY MARKET, BY END USER
18.1 OVERVIEW
18.2 HOSPITALS
18.2.1 BY TYPE
18.2.1.1. PRIVATE
18.2.1.2. PUBLIC
18.3 SPECIALTY CLINICS
18.4 HOME CARE SETTING
18.5 AMBULATORY SURGICAL CENTERS
18.6 OTHERS
19 ASIA-PACIFIC IRON-DEFICIENCY ANEMIA THERAPY MARKET, BY DISTRIBUTION CHANNEL
19.1 OVERVIEW
19.2 DIRECT TENDER
19.3 RETAIL SALES
19.3.1 HOSPITAL PHARMACY
19.3.2 RETAIL PHARMACY
19.3.3 ONLINE PHARMACY
19.4 OTHERS
20 ASIA-PACIFIC IRON-DEFICIENCY ANEMIA THERAPY MARKET, SWOT AND DBMR ANALYSIS
21 ASIA-PACIFIC IRON-DEFICIENCY ANEMIA THERAPY MARKET, COMPANY LANDSCAPE
21.1 COMPANY SHARE ANALYSIS: ASIA-PACIFIC
21.2 MERGERS & ACQUISITIONS
21.3 NEW PRODUCT DEVELOPMENT & APPROVALS
21.4 EXPANSIONS
21.5 REGULATORY CHANGES
21.6 PARTNERSHIP AND OTHER STRATEGIC DEVELOPMENTS
22 ASIA-PACIFIC IRON-DEFICIENCY ANEMIA THERAPY MARKET, BY REGION
Asia-Pacific iron-deficiency anemia therapy Market, (ALL SEGMENTATION PROVIDED ABOVE IS REPRESENTED IN THIS CHAPTER BY COUNTRY)
22.1 ASIA-PACIFIC
22.1.1 JAPAN
22.1.2 CHINA
22.1.3 SOUTH KOREA
22.1.4 INDIA
22.1.5 SINGAPORE
22.1.6 THAILAND
22.1.7 INDONESIA
22.1.8 MALAYSIA
22.1.9 PHILIPPINES
22.1.10 AUSTRALIA
22.1.11 NEW ZEALAND
22.1.12 VIETNAM
22.1.13 TAIWAN
22.1.14 REST OF ASIA-PACIFIC
22.2 KEY PRIMARY INSIGHTS: BY MAJOR COUNTRIES
23 ASIA-PACIFIC IRON-DEFICIENCY ANEMIA THERAPY MARKET, COMPANY PROFILE
23.1 SANOFI
23.1.1 COMPANY OVERVIEW
23.1.2 REVENUE ANALYSIS
23.1.3 GEOGRAPHIC PRESENCE
23.1.4 PRODUCT PORTFOLIO
23.1.5 RECENT DEVELOPMENTS
23.2 PFIZER INC.
23.2.1 COMPANY OVERVIEW
23.2.2 REVENUE ANALYSIS
23.2.3 GEOGRAPHIC PRESENCE
23.2.4 PRODUCT PORTFOLIO
23.2.5 RECENT DEVELOPMENTS
23.3 MERCK KGAA
23.3.1 COMPANY OVERVIEW
23.3.2 REVENUE ANALYSIS
23.3.3 GEOGRAPHIC PRESENCE
23.3.4 PRODUCT PORTFOLIO
23.3.5 RECENT DEVELOPMENTS
23.4 VIFOR PHARMA MANAGEMENT LTD.
23.4.1 COMPANY OVERVIEW
23.4.2 REVENUE ANALYSIS
23.4.3 GEOGRAPHIC PRESENCE
23.4.4 PRODUCT PORTFOLIO
23.4.5 RECENT DEVELOPMENTS
23.5 GSK GROUP
23.5.1 COMPANY OVERVIEW
23.5.2 REVENUE ANALYSIS
23.5.3 GEOGRAPHIC PRESENCE
23.5.4 PRODUCT PORTFOLIO
23.5.5 RECENT DEVELOPMENTS
23.6 AFT PHARMACEUTICALS.
23.6.1 COMPANY OVERVIEW
23.6.2 REVENUE ANALYSIS
23.6.3 GEOGRAPHIC PRESENCE
23.6.4 PRODUCT PORTFOLIO
23.6.5 RECENT DEVELOPMENTS
23.7 ASPEN AUSTRALIA
23.7.1 COMPANY OVERVIEW
23.7.2 REVENUE ANALYSIS
23.7.3 GEOGRAPHIC PRESENCE
23.7.4 PRODUCT PORTFOLIO
23.7.5 RECENT DEVELOPMENTS
23.8 ANC (AUSTRALIAN NATURALCARE)
23.8.1 COMPANY OVERVIEW
23.8.2 REVENUE ANALYSIS
23.8.3 GEOGRAPHIC PRESENCE
23.8.4 PRODUCT PORTFOLIO
23.8.5 RECENT DEVELOPMENTS
23.9 BLACKMORES
23.9.1 COMPANY OVERVIEW
23.9.2 REVENUE ANALYSIS
23.9.3 GEOGRAPHIC PRESENCE
23.9.4 PRODUCT PORTFOLIO
23.9.5 RECENT DEVELOPMENTS
23.1 FRESENIUS KABI AG
23.10.1 COMPANY OVERVIEW
23.10.2 REVENUE ANALYSIS
23.10.3 GEOGRAPHIC PRESENCE
23.10.4 PRODUCT PORTFOLIO
23.10.5 RECENT DEVELOPMENTS
23.11 PHARMACARE LABORATORIES AUSTRALIA.
23.11.1 COMPANY OVERVIEW
23.11.2 REVENUE ANALYSIS
23.11.3 GEOGRAPHIC PRESENCE
23.11.4 PRODUCT PORTFOLIO
23.11.5 RECENT DEVELOPMENTS
23.12 PHARMACOSMOS A/S
23.12.1 COMPANY OVERVIEW
23.12.2 REVENUE ANALYSIS
23.12.3 GEOGRAPHIC PRESENCE
23.12.4 PRODUCT PORTFOLIO
23.12.5 RECENT DEVELOPMENTS
23.13 SHIELD THERAPEUTICS PLC
23.13.1 COMPANY OVERVIEW
23.13.2 REVENUE ANALYSIS
23.13.3 GEOGRAPHIC PRESENCE
23.13.4 PRODUCT PORTFOLIO
23.13.5 RECENT DEVELOPMENTS
23.14 THORNE
23.14.1 COMPANY OVERVIEW
23.14.2 REVENUE ANALYSIS
23.14.3 GEOGRAPHIC PRESENCE
23.14.4 PRODUCT PORTFOLIO
23.14.5 RECENT DEVELOPMENTS
23.15 PAVAN NUTRA
23.15.1 COMPANY OVERVIEW
23.15.2 REVENUE ANALYSIS
23.15.3 GEOGRAPHIC PRESENCE
23.15.4 PRODUCT PORTFOLIO
23.15.5 RECENT DEVELOPMENTS
23.16 TRIVIGYA BIOSCIENCE
23.16.1 COMPANY OVERVIEW
23.16.2 REVENUE ANALYSIS
23.16.3 GEOGRAPHIC PRESENCE
23.16.4 PRODUCT PORTFOLIO
23.16.5 RECENT DEVELOPMENTS
23.17 DAIICHI SANKYO COMPANY, LIMITED.
23.17.1 COMPANY OVERVIEW
23.17.2 REVENUE ANALYSIS
23.17.3 GEOGRAPHIC PRESENCE
23.17.4 PRODUCT PORTFOLIO
23.17.5 RECENT DEVELOPMENTS
24 RELATED REPORTS
25 CONCLUSION
26 QUESTIONNAIRE
27 ABOUT DATA BRIDGE MARKET RESEARCH
Data collection and base year analysis are done using data collection modules with large sample sizes. The stage includes obtaining market information or related data through various sources and strategies. It includes examining and planning all the data acquired from the past in advance. It likewise envelops the examination of information inconsistencies seen across different information sources. The market data is analysed and estimated using market statistical and coherent models. Also, market share analysis and key trend analysis are the major success factors in the market report. To know more, please request an analyst call or drop down your inquiry.
The key research methodology used by DBMR research team is data triangulation which involves data mining, analysis of the impact of data variables on the market and primary (industry expert) validation. Data models include Vendor Positioning Grid, Market Time Line Analysis, Market Overview and Guide, Company Positioning Grid, Patent Analysis, Pricing Analysis, Company Market Share Analysis, Standards of Measurement, Global versus Regional and Vendor Share Analysis. To know more about the research methodology, drop in an inquiry to speak to our industry experts.
Data Bridge Market Research is a leader in advanced formative research. We take pride in servicing our existing and new customers with data and analysis that match and suits their goal. The report can be customized to include price trend analysis of target brands understanding the market for additional countries (ask for the list of countries), clinical trial results data, literature review, refurbished market and product base analysis. Market analysis of target competitors can be analyzed from technology-based analysis to market portfolio strategies. We can add as many competitors that you require data about in the format and data style you are looking for. Our team of analysts can also provide you data in crude raw excel files pivot tables (Fact book) or can assist you in creating presentations from the data sets available in the report.


