
Asia-Pacific Kaolin Market Analysis and Insights
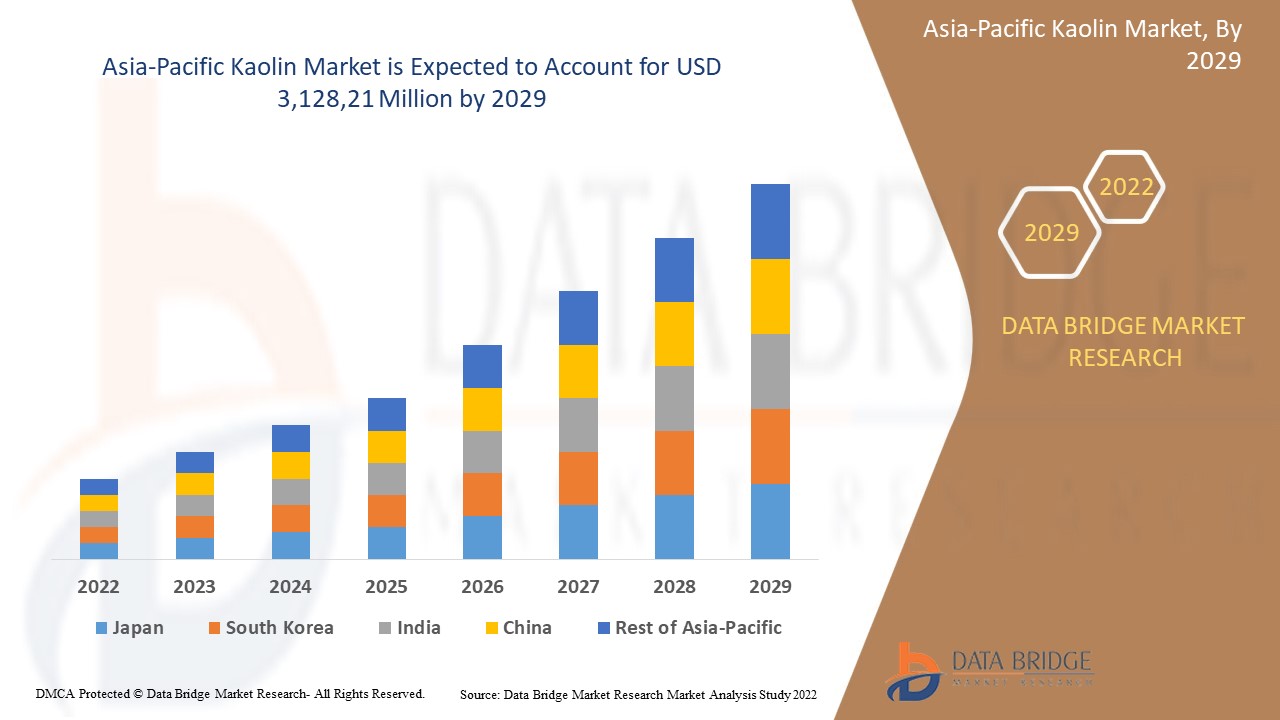
The Asia-Pacific kaolin market is expected to grow significantly in the forecast period of 2022 to 2029. Data Bridge Market Research analyses that the market is growing with a CAGR of 5.3% in the forecast period of 2022 to 2029 and is expected to reach USD 3,128,21 million by 2029. The major factor driving the growth of the kaolin market is the rise in construction activities across the globe, favorable chemical and physical properties of kaolin, increase in demand for kaolin from various end-use industries, and high adoption of kaolin as a coating additive.
Industries are increasingly adopting kaolin as a raw material for the production of commercially important medicinal and cosmetic products. In addition, chemical property such as adsorbing proteins, lipids, and oils has increased the use of kaolin to produce face washes, facial masks, mud packs, body scrubs, and other cosmetic products. Medicinal products, such as mouthwashes, surgical pads, drying agents, and temporary protectants against diaper rash, use kaolin as a key ingredient due to its favorable chemical properties. Therefore, extensive use of kaolin in varied applications and industries may drive the growth of the Asia-Pacific kaolin market.
The Asia-Pacific kaolin market report provides details of market share, new developments, and the impact of domestic and localized market players, analyses opportunities in terms of emerging revenue pockets, changes in market regulations, products approvals, strategic decisions, product launches, geographic expansions, and technological innovations in the market. To understand the analysis and the market scenario, contact us for an analyst brief. Our team will help you create a revenue impact solution to achieve your desired goal.
|
Report Metric |
Details |
|
Forecast Period |
2022 to 2029 |
|
Base Year |
2021 |
|
Historic Years |
2020 (Customizable to 2019 - 2014) |
|
Quantitative Units |
Revenue in USD Million |
|
Segments Covered |
By Grade (Calcined, Hydrous, Delaminated, Surface Treated, and Structured), Process (Water-Washed, Airfloat, Calcined, Delaminated, and Surface-Modified & Unprocessed), Application (Paper, Ceramics, Paint & Coatings, Fiberglass, Plastic, Rubber, Pharmaceuticals & Medical, Cosmetics, and Others) |
|
Countries Covered |
Japan, China, South Korea, India, Singapore, Thailand, Indonesia, Malaysia, Philippines, Australia & New Zealand, and the Rest of Asia-Pacific. |
|
Market Players Covered |
Ashapura Group, BASF SE, EICL, Imerys S.A., SIBELCO |
Market Definition
Kaolin, also called china clay, is a soft white clay used as a necessary ingredient in manufacturing paper, rubber, cosmetics, and others. Kaolin is used as a filler agent in the paper industry with adhesive, which improves the paper's appearance, giving it varied gloss, smoothness, brightness, opacity, and printability. In addition, the product enhances paper's printability by providing added ink absorption, ink pigment holdout, and increased roughness. It is highly used in the ceramic industry for manufacturing porcelain and refractory. Kaolin improves mechanical strength and abrasion resistance in the rubber industry.
Asia-Pacific Kaolin Market Dynamics
This section deals with understanding the market drivers, restraints, opportunities, and challenges. All of this is discussed in detail below:
Drivers
- Rise in construction activities across the globe
Increasing construction activities in developing economies have been supported by greater migration of the rural population to urban centers and rising investment in infrastructure development. Growing product demand due to the increasing residential remodeling practices in various countries such as the US, drifting consumer focus towards replacing wood floors with ceramic tiles drives the kaolin market growth. Moreover, Asia-Pacific is also expected to witness a rapid pace due to growing ceramic production and consumption in its countries.
- Favorable chemical and physical properties of kaolin
Kaolin is preferred as a metal of choice in various application and end-use industries owing to its desired and favorable chemical and physical properties it executes when used. There is a growing demand for kaolin clay in the plastics industry as its use enhances its electrical performance, durability, and strength. Moreover, the increasing adoption of ceramics is due to the opacity, chemical inertness, non-abrasive texture, and flat shape of kaolin clay. In addition, the use of kaolin in concretes and mortar is rising due to its thermal stability. Some grades of kaolin have fine particle sizes, high adsorption, and suspension properties.
- Increase in demand for kaolin from various end-use industries
Many significant variables and properties that act in favor of kaolin and rising demand for kaolin-made products have kept the kaolin market growing steadily worldwide. The most common application of kaolin is in the paper sector, allowing it to be utilized as a paper coating with a smooth texture and appropriate opacity. The increase is attributable to increased demand for paper from various end-use industries, such as packaging and printing. Furthermore, this material is widely used to fill and coat pieces as it reduces particle size and enhances strength. Kaolin is frequently used in the paper industry because it offers a variety of qualities, including good ink receptivity, paper smoothness, and the optimum opacity for paper making.
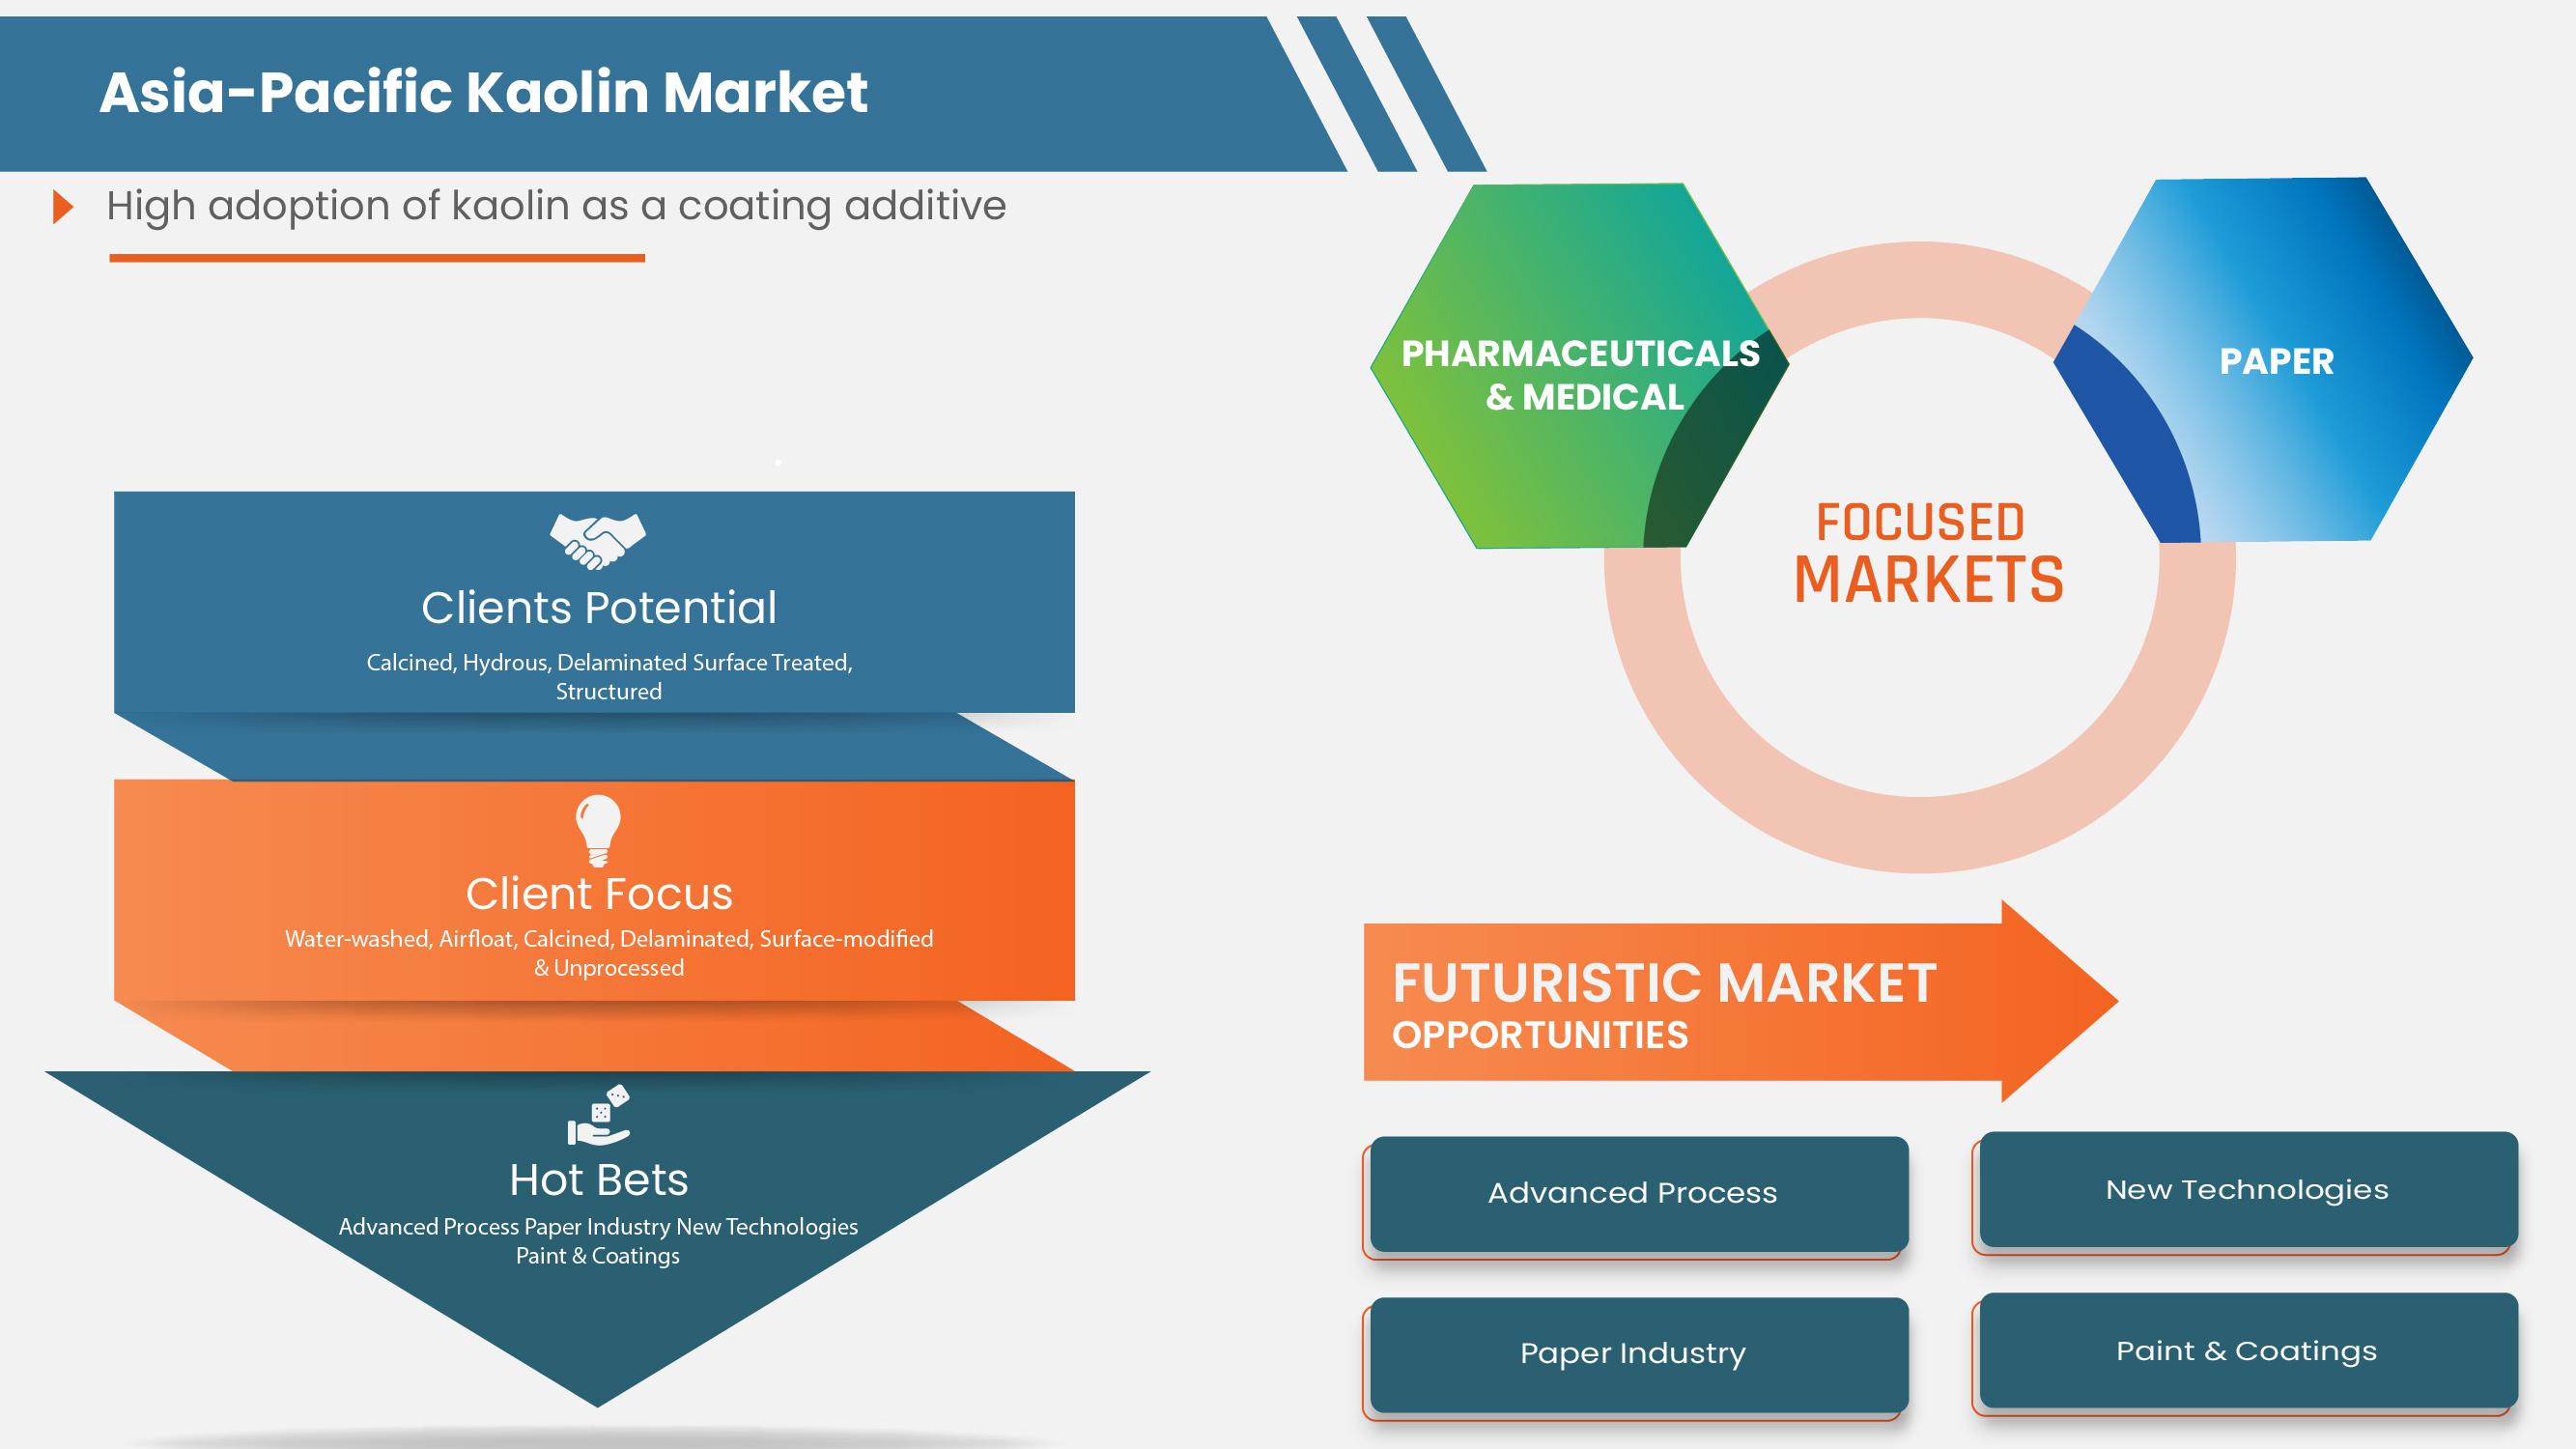
- High adoption of kaolin as a coating additive
The paper and paints & coatings industry are among the major users of kaolin in its products. Kaolin is used to enhance the performance of paints in the form of better suspension properties, rapid dispersion, corrosion resistance, superior water resistance, and reduced viscosities. In addition, kaolin is employed as a coating and filling agent when combined with adhesives in paper coating to provide its opacity, color, and printability. Kaolin is the most extensively used particulate mineral in the filling and coating paper. It improves paper appearance, characterized by gloss, smoothness, brightness, and opacity, and of greatest significance, it improves printability. Paper is also filled with kaolin to extend fiber.
Opportunities
- Key strategic initiatives implemented by leading companies
The Asia-Pacific kaolin market has seen an unexpected negative effect due to the emergence of COVID-10 and nationwide lockdowns and movement restrictions. Therefore, the manufacturers mostly focus on keeping the liquidity flow to avoid further losses. Moreover, key players in the kaolin market have been implementing various strategic initiatives and developments to gain a major and dominant market share and enhance their operations.
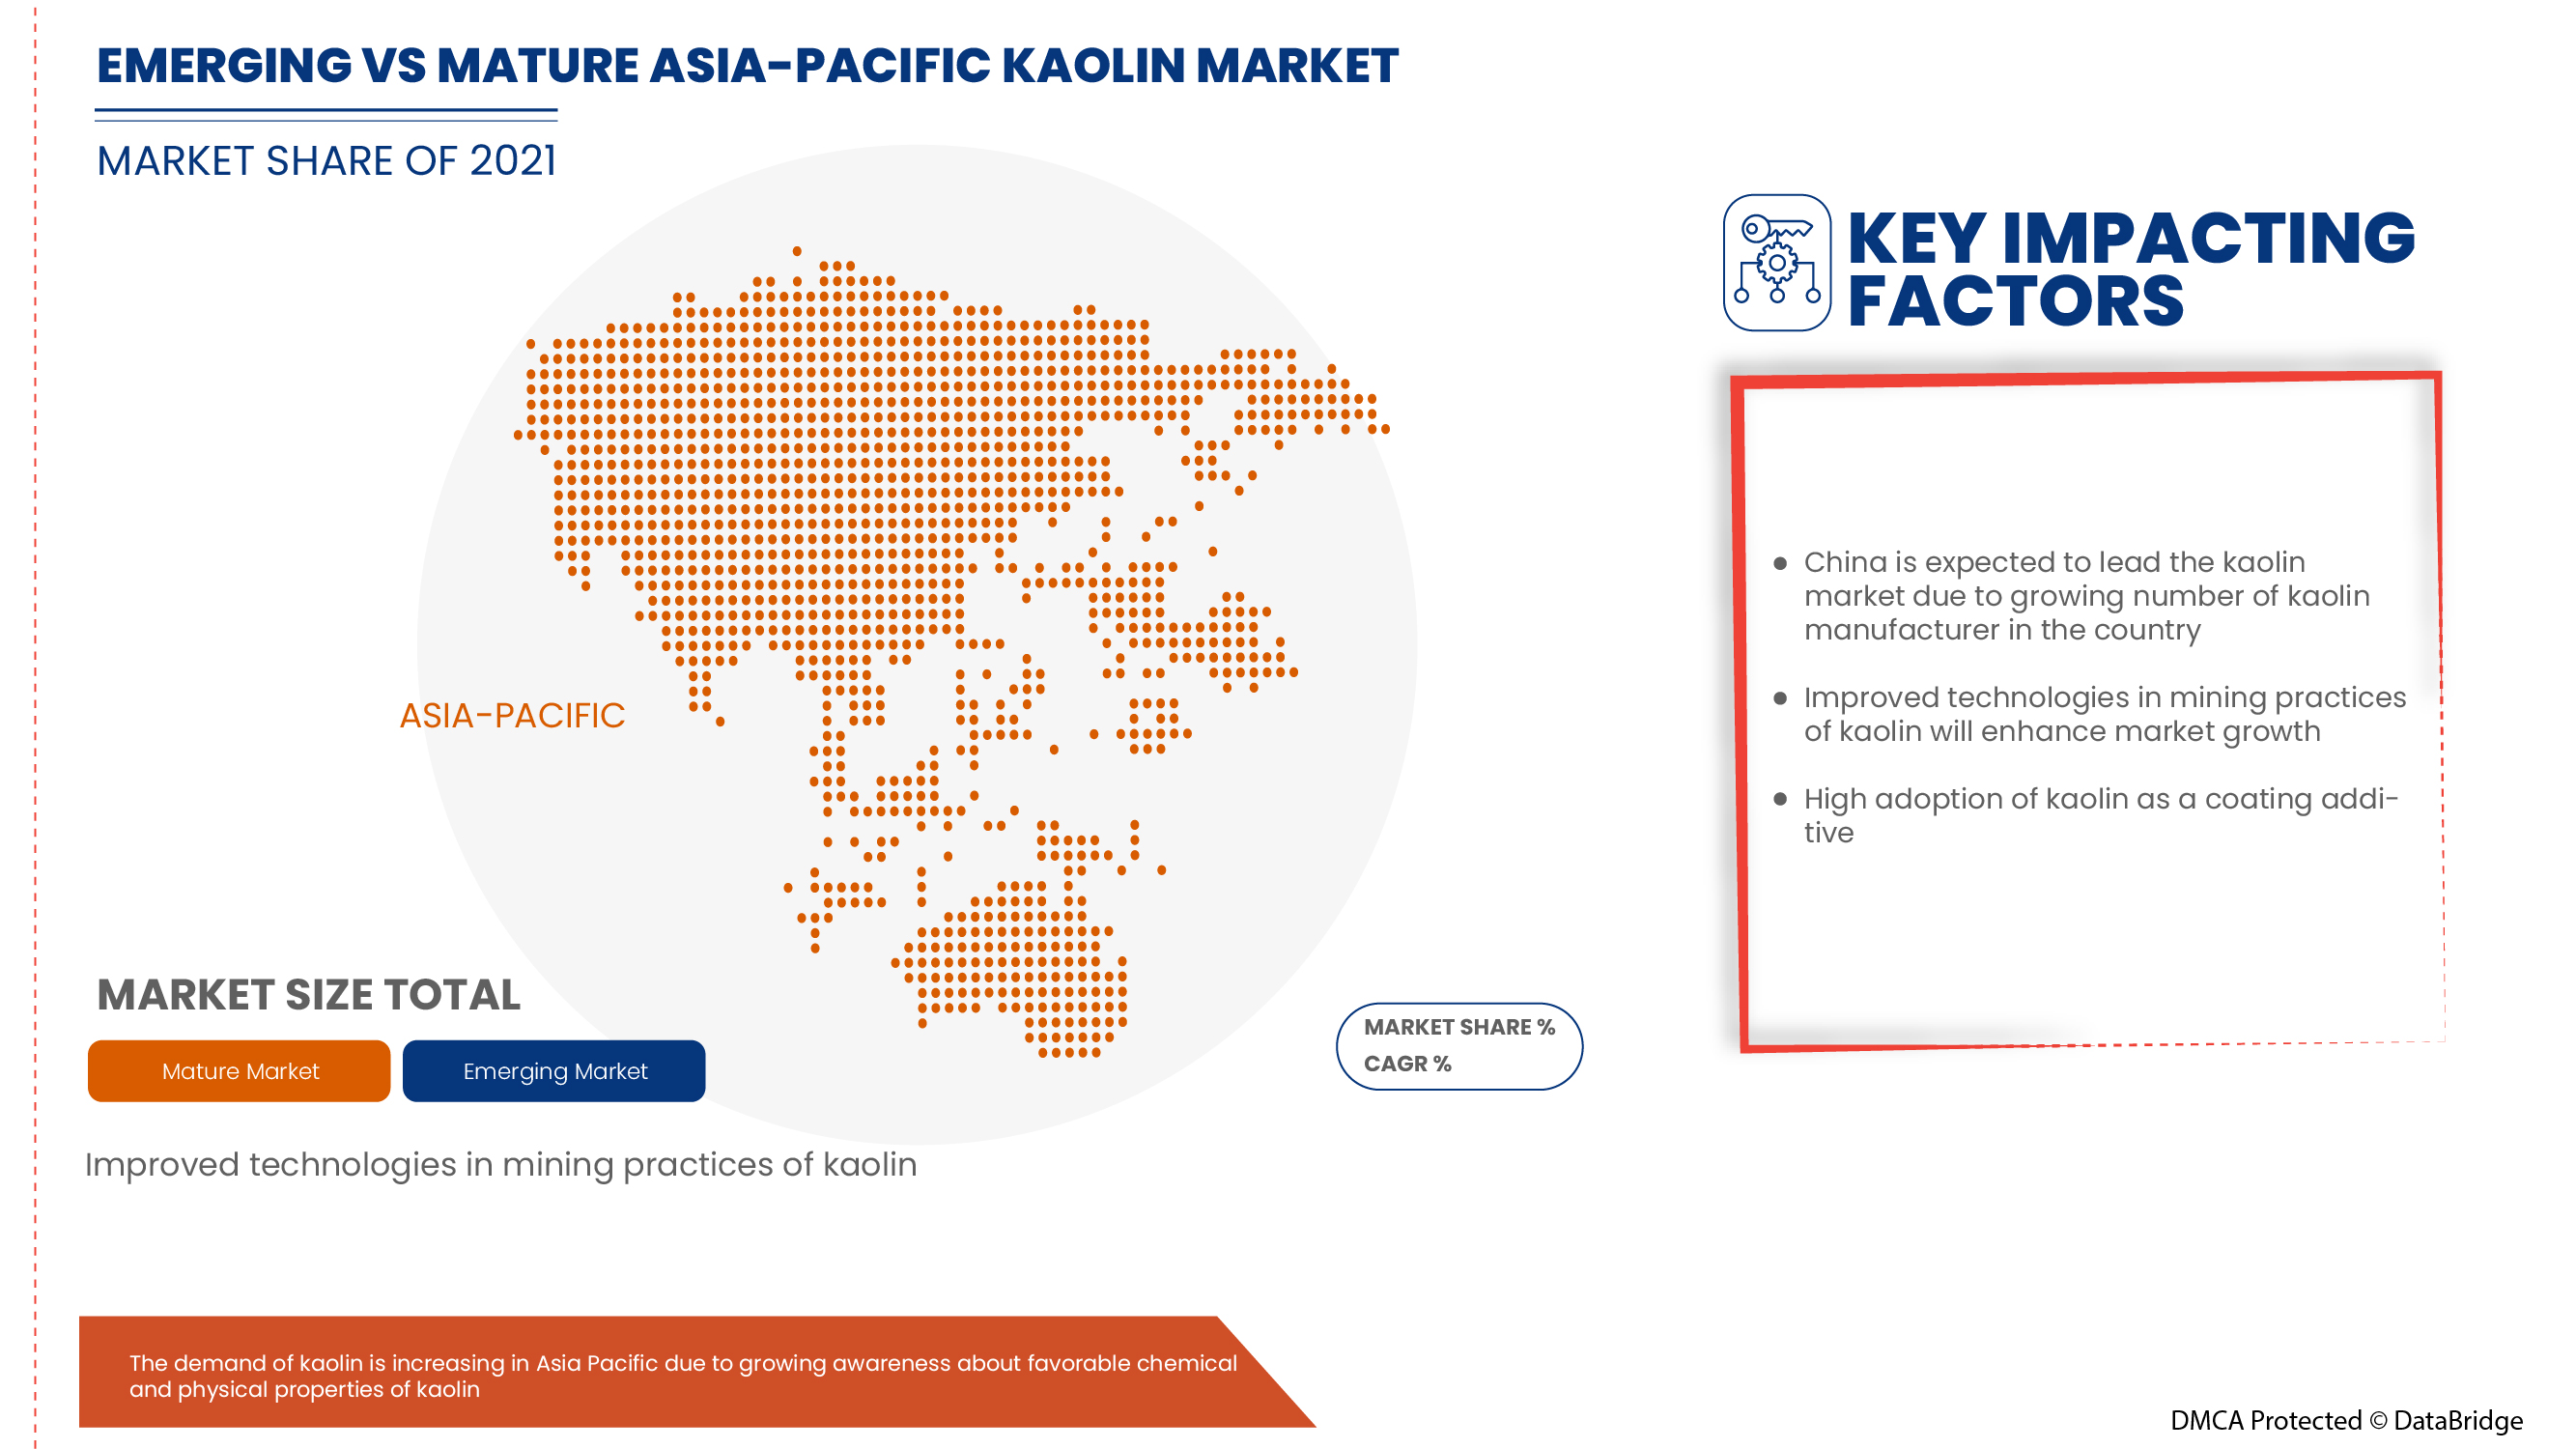
- Improved technologies in mining practices of kaolin
Technology development for the processing of kaolin is essentially the development of a sequentilised flow sheet for its beneficiation so that all unwanted impurities are removed, and the required properties of the processed material are ensured by suitable sizing, brightness improvement, surface modifications, and other operations. Modern methods of (wet route) kaolin beneficiation use techniques such as crushing/attrition, blunging, screening or mechanical classification, centrifugal separations, magnetic separation, selective flocculation, froth flotation, and oxidative and reductive bleaching. Additional techniques, such as attrition/delamination, pugging, calcination, surface modification, etc., are also employed to enhance the end product's properties.
Restraints/Challenges
- Negative effect on paper industry due to the emergence of covid-19
The COVID-19 outbreak has disrupted kaolin market manufacture and supply, delaying the worldwide industry's expansion. Many kaolin enterprises are employing ways to avoid downtime losses, which are increasingly concerning as the pandemic's effects endure. The performance of kaolin in paper filling applications has been eroded by competition from alternative materials, particularly calcium carbonates. Slow growth in coated paper production will limit advances for kaolin in the future, thus, restraining the development of the Asia-Pacific kaolin market.
- Kaolin mining causes numerous environmental and health hazards
From an environmental point of view, the most significant environmental problem arises because the kaolin extractive operations create surfaces with high susceptibility to runoff and water erosion, with a high potential for on- and off-site environmental effects. Moreover, mining kaolin has long-term negative impacts on the environment, such as environmental and agricultural imbalances, erosion, silting of rivers and lakes, and deforestation. Because of the removal of vegetation for the process of excavation and removal of clay, part of the local soil is unprotected, causing compaction processes in certain situations and leaching. Once the leached soil becomes unsuitable for agriculture, the land used for clay extraction ends up being abandoned by the owners. Therefore, mining kaolin results in the degradation of the environment and human health, which is expected to restrain the growth and development of the Asia-Pacific kaolin market.
- Easy availability of substitutes
Some other easily available substitutes in the market are bentonite clay. Bentonite clay has powerful oil absorption properties and can absorb more than its body mass in water. This makes it an excellent ingredient for people with extremely oily skin and drives its use in cosmetic products. Bentonite clay is composed of montmorillonite, a type of smectite clay. It has high water content and swells when it comes into contact with water. This makes it effective at drawing out impurities from the skin. Another alternative is fuller's earth, which is also used for skin care and detoxification. In addition, rhassoul clay is a clay that is mined in the Atlas Mountains in Morocco. It is rich in minerals, has cleansing and conditioning properties, and is a great alternative to kaolin clay.
- Rise in the price of kaolin
The companies and players operating in the Asia-Pacific kaolin market are focused on increasing kaolin prices to ensure the business's long-term sustainability. These players announced an increase in prices in 2021 for different applications, in which paper was among the key applications. Most companies experienced inflation in various aspects of the business, including inflation in chemicals and freight costs. In addition, the downgrade caused due to the breakout of the pandemic from key application sectors directly impacted the revenue earnings of major market participants.
Recent Development
- In July 2022, Thiele Kaolin Company announced a price increase of 9% for all product categories owing to the current Asia-Pacific economic climate, which has resulted in increased costs to manufacturing operations worldwide. For the company, these cost increases have impacted energy, chemicals, labor, mining, maintenance, and other inputs needed to produce quality products
- In November 2021, KaMin LLC / CADAM agreed to acquire the kaolin mineral business of BASF SE. The kaolin minerals business is part of BASF's Performance Chemicals division. This greatly strengthens the company's kaolin business across the globe
Asia-Pacific Kaolin Market Scope
The Asia-Pacific kaolin market is categorized based on grade, process, and application. The growth amongst these segments will help you analyze major growth segments in the industries and provide the users with a valuable market overview and market insights to make strategic decisions to identify core market applications.
Grade
- Calcined
- Hydrous
- Delaminated
- Surface treated
- Structured
Based on grade, the Asia-Pacific kaolin market is classified into five segments, namely calcined, hydrous, delaminated, surface treated, and structured.
Process
- Water-Washed
- Airfloat
- Calcined
- Delaminated
- Surface-modified & unprocessed
Based on process, the Asia-Pacific kaolin market is classified into five segments water-washed, airfloat, calcined, delaminated, and surface-modified & unprocessed.
Application
- Paper
- Ceramics
- Paint & coatings
- Fiberglass
- Plastic
- Rubber
- Pharmaceuticals & medical
- Cosmetics
- Others
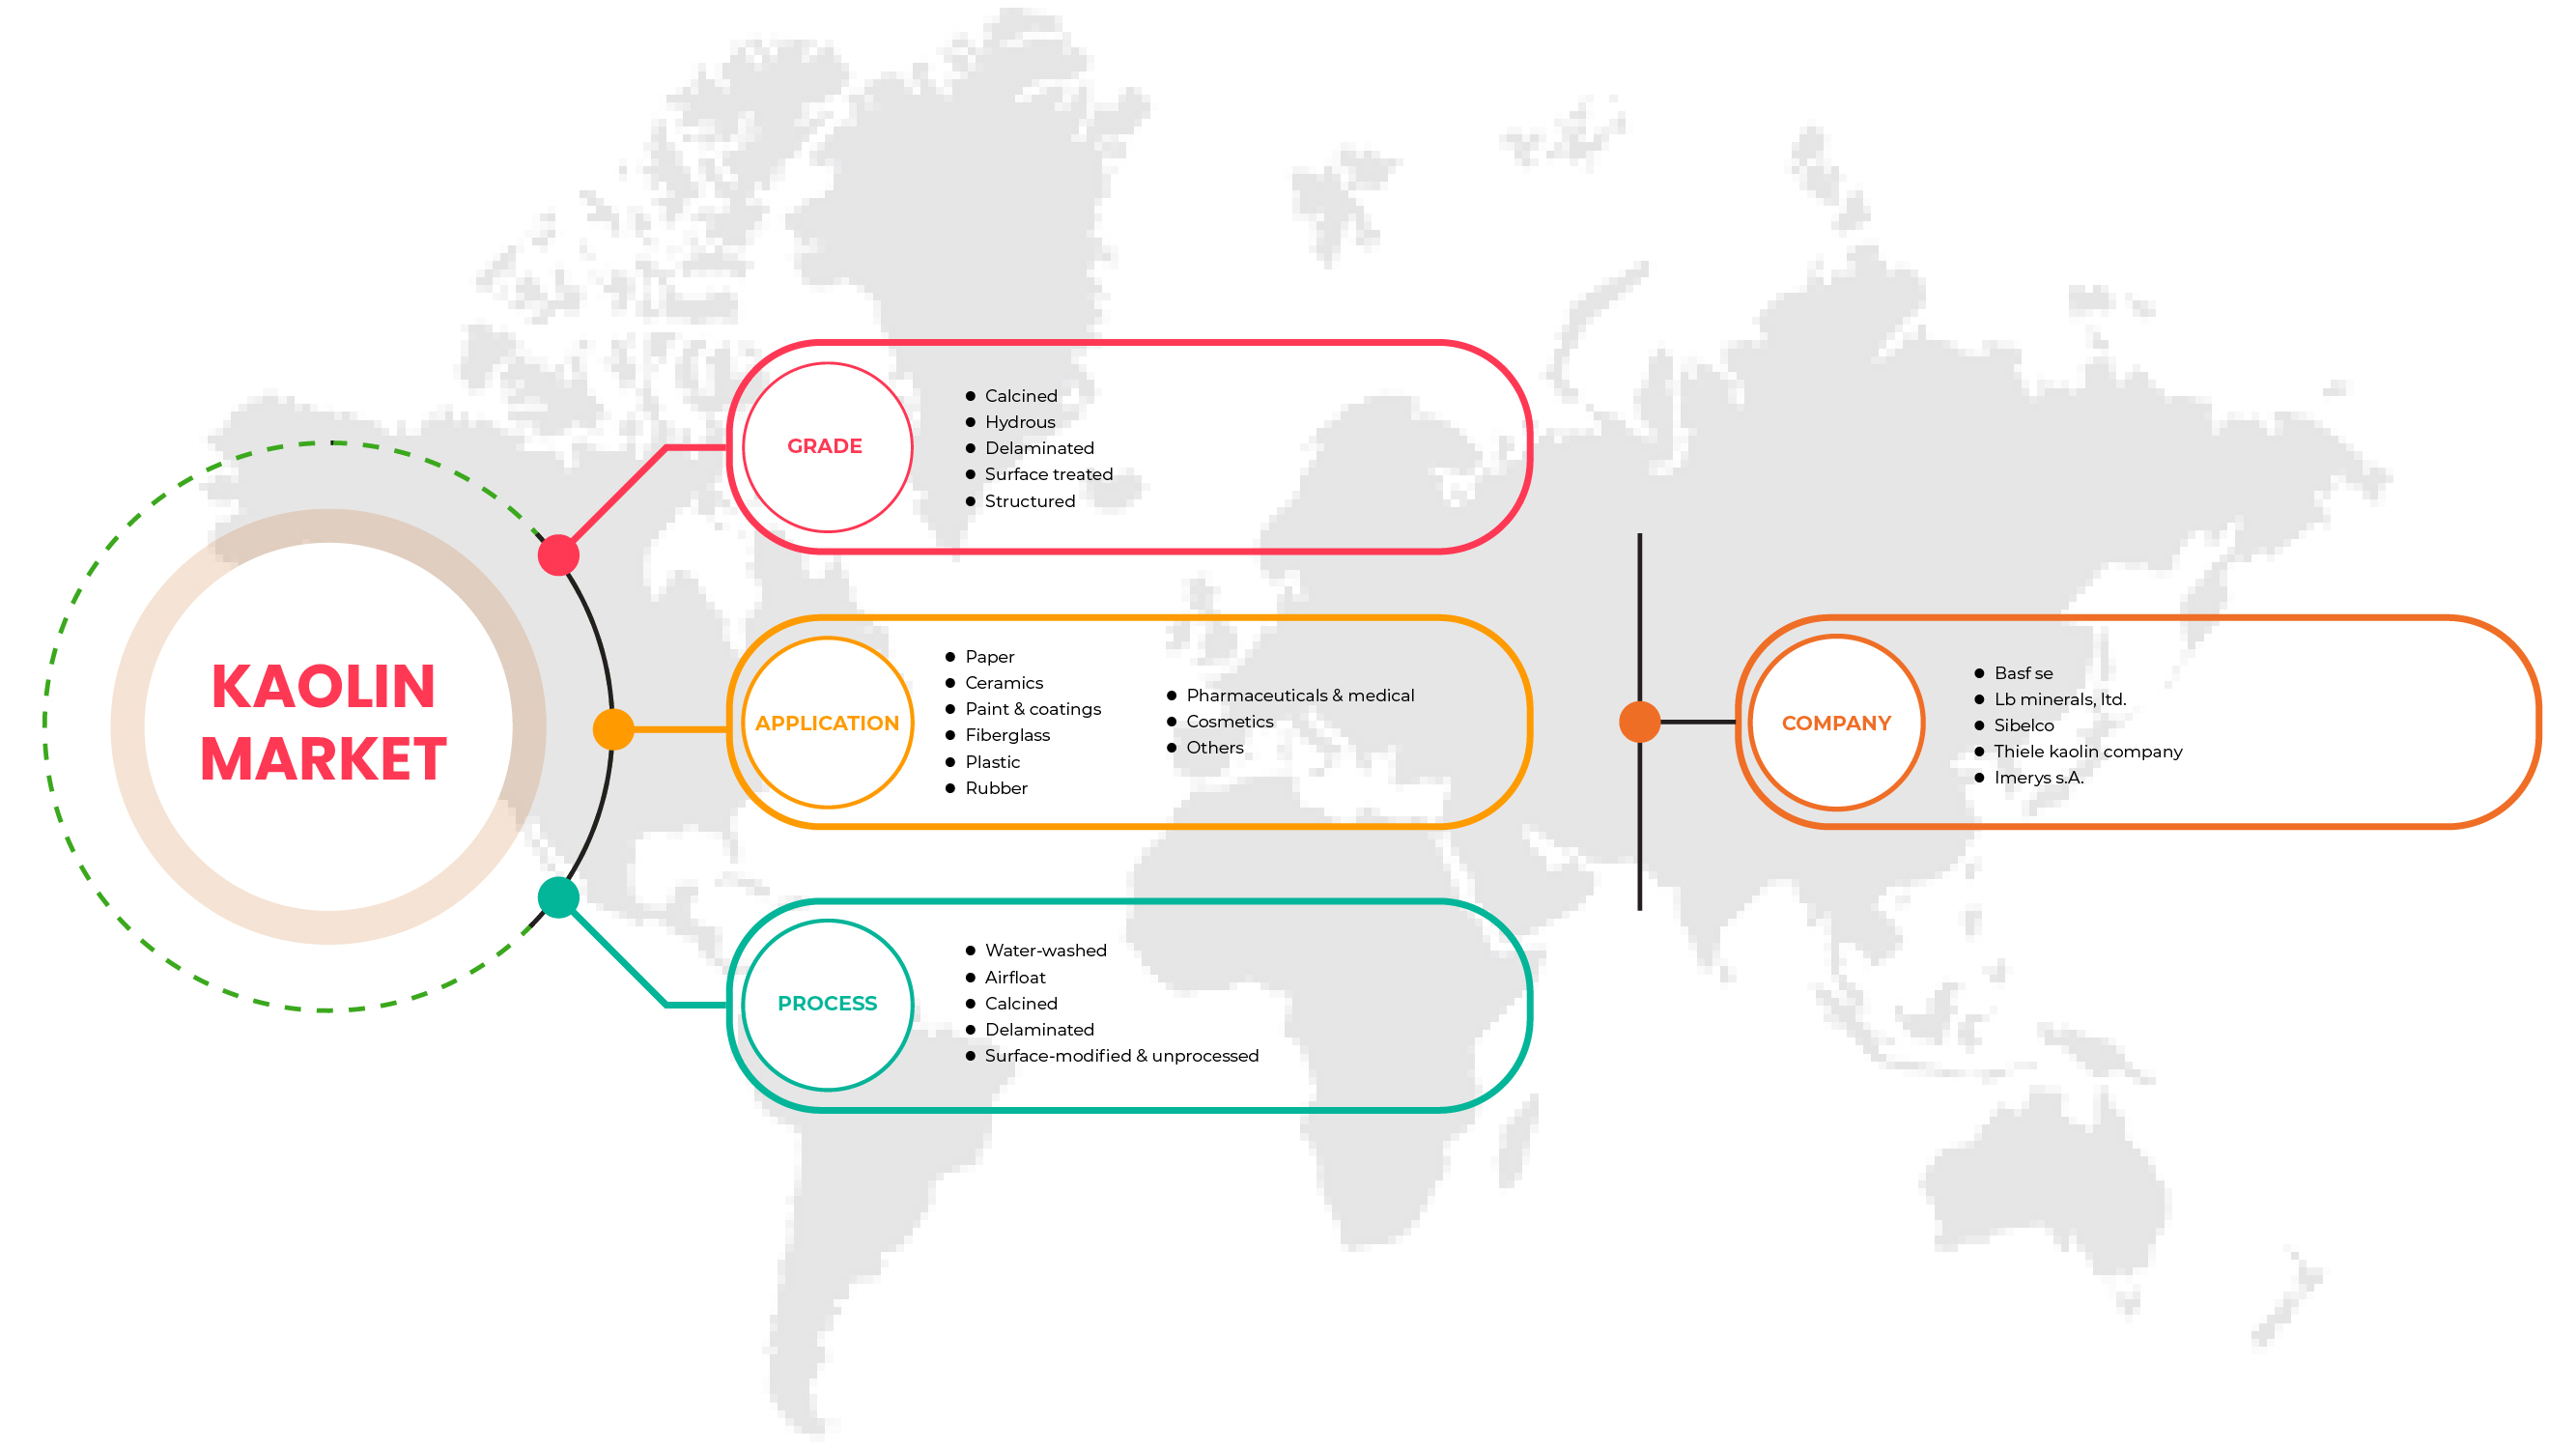
Based on the application, the Asia-Pacific kaolin market is classified into nine segments paper, ceramics, paint & coatings, fiberglass, plastic, rubber, pharmaceuticals & medical, cosmetics, and others.
Asia-Pacific Kaolin Market Regional Analysis/Insights
The Asia-Pacific kaolin market is segmented based on grade, process, and application.
The countries covered in the Asia-Pacific Kaolin market are Japan, China, South Korea, India, Singapore, Thailand, Indonesia, Malaysia, Philippines, Australia & New Zealand, and the Rest of Asia-Pacific. China is dominating the Asia-Pacific Kaolin market in terms of market share and revenue due to the increasing number of ceramic manufacturing companies that contributed to the growth of the kaolin industry in recent years, and this trend is expected to continue.
The country section of the report also provides individual market-impacting factors and market regulation changes that impact the market's current and future trends. Data point downstream and upstream value chain analysis, technological trends, porter's five forces analysis, and case studies are some pointers used to forecast the market scenario for individual countries. Also, the presence and availability of Asia-Pacific brands and their challenges faced due to large or scarce competition from local and domestic brands, the impact of domestic tariffs, and trade routes are considered while providing forecast analysis of the country data.
Competitive Landscape and Asia-Pacific Kaolin Market Share Analysis
Asia-Pacific kaolin market competitive landscape provides details by competitors. Details included are company overview, company financials, revenue generated, market potential, investment in research and development, new market initiatives, production sites and facilities, company strengths and weaknesses, product launch, product trials pipelines, product approvals, patents, product width and breadth, application dominance, technology lifeline curve. The above data points are only related to the companies focusing on the Asia-Pacific Kaolin market.
Some prominent Asian-Pacific kaolin market participants are Ashapura Group, BASF SE, EICL, Imerys S.A., and SIBELCO.
Research Methodology
Data collection and base year analysis are done using data collection modules with large sample sizes. The market data is analyzed and estimated using market statistical and coherent models. In addition, market share analysis and key trend analysis are the major success factors in the market report. The key research methodology used by the DBMR research team is data triangulation which involves data mining, analysis of the impact of data variables on the market, and primary (industry expert) validation. Data models include Vendor Positioning grids, Market Time Line Analysis, Market Overview and Guide, Company Positioning grids, Company Market Share Analysis, Standards of Measurement, Asia-Pacific Vs. Regional and Vendor Share Analysis. Please request an analyst call in case of further inquiry.
SKU-

- Interactive Data Analysis Dashboard
- Company Analysis Dashboard for high growth potential opportunities
- Research Analyst Access for customization & queries
- Competitor Analysis with Interactive dashboard
- Latest News, Updates & Trend analysis
- Harness the Power of Benchmark Analysis for Comprehensive Competitor Tracking
Table of Content
1 INTRODUCTION
1.1 OBJECTIVES OF THE STUDY
1.2 MARKET DEFINITION
1.3 OVERVIEW OF ASIA PACIFIC KAOLIN MARKET
1.4 LIMITATIONS
1.5 MARKETS COVERED
2 MARKET SEGMENTATION
2.1 MARKETS COVERED
2.2 GEOGRAPHICAL SCOPE
2.3 YEARS CONSIDERED FOR THE STUDY
2.4 CURRENCY AND PRICING
2.5 DBMR TRIPOD DATA VALIDATION MODEL
2.6 PRODUCT LIFE LINE CURVE
2.7 MULTIVARIATE MODELING
2.8 PRIMARY INTERVIEWS WITH KEY OPINION LEADERS
2.9 DBMR MARKET POSITION GRID
2.1 MARKET APPLICATION COVERAGE GRID
2.11 DBMR MARKET CHALLENGE MATRIX
2.12 DBMR VENDOR SHARE ANALYSIS
2.13 IMPORT-EXPORT DATA
2.14 SECONDARY SOURCES
2.15 ASSUMPTIONS
3 EXECUTIVE SUMMARY
4 PREMIUM INSIGHTS
4.1 PESTLE ANALYSIS
4.1.1 POLITICAL FACTORS
4.1.2 ECONOMIC FACTORS
4.1.3 SOCIAL FACTORS
4.1.4 TECHNOLOGICAL FACTORS
4.1.5 LEGAL FACTORS
4.1.6 ENVIRONMENTAL FACTORS
4.2 PORTER’S FIVE FORCES:
4.2.1 THREAT OF NEW ENTRANTS:
4.2.2 THREAT OF SUBSTITUTES:
4.2.3 CUSTOMER BARGAINING POWER:
4.2.4 SUPPLIER BARGAINING POWER:
4.2.5 INTERNAL COMPETITION (RIVALRY):
4.3 CRITICAL SELECTION CRITERIA FOR BUSINESS DECISION
4.4 IMPORT EXPORT SCENARIO
4.5 MANUFACTURING PROCESS: ASIA PACIFIC KAOLIN MARKET
4.6 MARKET CHANGES / CURRENT EVENTS
4.7 PRODUCTION CAPACITY BY MANUFACTURERS: ASIA PACIFIC KAOLIN MARKET
4.8 SUPPLY CHAIN ANALYSIS- ASIA PACIFIC KAOLIN MARKET
4.8.1 OVERVIEW
4.8.2 LOGISTIC COST SCENARIO
4.8.3 IMPORTANCE OF LOGISTICS SERVICE PROVIDERS
4.9 TECHNOLOGIES OVERVIEW
4.1 VENDOR SELECTION CRITERIA
4.11 PRICE ANALYSIS SCENARIO
4.11.1 RAW MATERIALS PRICE ANALYSIS
4.11.2 CURRENT PRICE STATISTICS
4.11.3 PRICE FORECASTS
4.12 PRODUCTION CONSUMPTION ANALYSIS
4.13 REGULATION COVERAGE
4.14 MANUFACTURING COST SCENARIO AND FUTURE IMPACT
5 MARKET OVERVIEW
5.1 DRIVERS
5.1.1 RISE IN CONSTRUCTION ACTIVITIES ACROSS THE GLOBE
5.1.2 FAVOURABLE CHEMICAL AND PHYSICAL PROPERTIES OF KAOLIN
5.1.3 INCREASE IN DEMAND FOR KAOLIN FROM VARIOUS END-USE INDUSTRIES
5.1.4 HIGH ADOPTION OF KAOLIN AS A COATING ADDITIVE
5.2 ERROR! HYPERLINK REFERENCE NOT VALID.RESTRAINTS
5.2.1 NEGATIVE EFFECT ON PAPER INDUSTRY DUE TO EMERGENCE OF COVID-19
5.2.2 KAOLIN MINING CAUSES NUMEROUS ENVIRONMENTAL AND HEALTH HAZARDS
5.3 OPPORTUNITIES
5.3.1 KEY STRATEGIC INITIATIVES IMPLEMENTED BY LEADING COMPANIES
5.3.2 IMPROVED TECHNOLOGIES IN MINING PRACTICES OF KAOLIN
5.4 CHALLENGES
5.4.1 EASY AVAILABILITY OF SUBSTITUTES
5.4.2 RISE IN THE PRICE OF KAOLIN
6 ASIA PACIFIC KAOLIN MARKET, BY GRADE
6.1 OVERVIEW
6.2 CALCINED
6.3 HYDROUS
6.4 DELAMINATED
6.5 SURFACE TREATED
6.6 STRUCTURED
7 ASIA PACIFIC KAOLIN MARKET, BY PROCESS
7.1 OVERVIEW
7.2 WATER-WASHED
7.3 AIRFLOAT
7.4 CALCINED
7.5 DELAMINATED
7.6 SURFACE-MODIFIED & UNPROCESSED
8 ASIA PACIFIC KAOLIN MARKET, BY APPLICATION
8.1 OVERVIEW
8.2 PAPER
8.3 CERAMICS
8.4 PAINT & COATINGS
8.5 FIBERGLASS
8.6 PLASTIC
8.7 RUBBER
8.8 PHARMACEUTICALS & MEDICAL
8.9 COSMETICS
8.1 OTHERS
9 ASIA PACIFIC KAOLIN MARKET, BY REGION
9.1 ASIA-PACIFIC
9.1.1 CHINA
9.1.2 INDIA
9.1.3 JAPAN
9.1.4 SOUTH KOREA
9.1.5 THAILAND
9.1.6 SINGAPORE
9.1.7 INDONESIA
9.1.8 AUSTRALIA & NEW ZEALAND
9.1.9 PHILIPPINES
9.1.10 MALAYSIA
9.1.11 REST OF ASIA-PACIFIC
10 ASIA PACIFIC KAOLIN MARKET: COMPANY LANDSCAPE
10.1 COMPANY SHARE ANALYSIS: ASIA PACIFIC
10.2 DISINVESTMENT
10.3 PRICE INCREASE
10.4 ACQUISITION
10.5 FACILITY EXPANSION
11 SWOT ANALYSIS
12 COMPANY PROFILES
12.1 IMERYS S.A.
12.1.1 COMPANY SNAPSHOT
12.1.2 REVENUE ANALYSIS
12.1.3 COMPANY SHARE ANALYSIS
12.1.4 PRODUCT PORTFOLIO
12.1.5 RECENT DEVELOPMENT
12.2 SIBELCO
12.2.1 COMPANY SNAPSHOT
12.2.2 REVENUE ANALYSIS
12.2.3 COMPANY SHARE ANALYSIS
12.2.4 PRODUCT PORTFOLIO
12.2.5 RECENT DEVELOPMENT
12.3 BASF SE
12.3.1 COMPANY SNAPSHOT
12.3.2 REVENUE ANALYSIS
12.3.3 COMPANY SHARE ANALYSIS
12.3.4 PRODUCT PORTFOLIO
12.3.5 RECENT DEVELOPMENT
12.4 KAMIN LLC. / CADAM
12.4.1 COMPANY SNAPSHOT
12.4.2 COMPANY SHARE ANALYSIS
12.4.3 PRODUCT PORTFOLIO
12.4.4 RECENT DEVELOPMENTS
12.5 THIELE KAOLIN COMPANY
12.5.1 COMPANY SNAPSHOT
12.5.2 COMPANY SHARE ANALYSIS
12.5.3 PRODUCT PORTFOLIO
12.5.4 RECENT DEVELOPMENTS
12.6 ASHAPURA GROUP
12.6.1 COMPANY SNAPSHOT
12.6.2 REVENUE ANALYSIS
12.6.3 PRODUCT PORTFOLIO
12.6.4 RECENT DEVELOPMENTS
12.7 EICL
12.7.1 COMPANY SNAPSHOT
12.7.2 REVENUE ANALYSIS
12.7.3 PRODUCT PORTFOLIO
12.7.4 RECENT DEVELOPMENTS
12.8 I-MINERALSINC.
12.8.1 COMPANY SNAPSHOT
12.8.2 REVENUE ANALYSIS
12.8.3 PRODUCT PORTFOLIO
12.8.4 RECENT DEVELOPMENTS
12.9 LB MINERALS, LTD.
12.9.1 COMPANY SNAPSHOT
12.9.2 PRODUCT PORTFOLIO
12.9.3 RECENT DEVELOPMENTS
12.1 QUARTZ WORKS GMBH
12.10.1 COMPANY SNAPSHOT
12.10.2 PRODUCT PORTFOLIO
12.10.3 RECENT DEVELOPMENTS
13 QUESTIONNAIRE
14 RELATED REPORTS
List of Table
TABLE 1 IMPORT DATA OF KAOLIN AND OTHER KAOLINIC CLAYS, WHETHER OR NOT CALCINED; HS CODE – 2507 (USD THOUSAND)
TABLE 2 EXPORT DATA OF KAOLIN AND OTHER KAOLINIC CLAYS, WHETHER OR NOT CALCINED; HS CODE – 2507 (USD THOUSAND)
TABLE 3 THE FOLLOWING TABLE SHOWS THE PRODUCTION CAPACITIES OF VARIOUS COMPANIES OPERATING IN THE ASIA PACIFIC KAOLIN MARKET.
TABLE 4 REGULATORY FRAMEWORK
TABLE 5 ASIA PACIFIC KAOLIN MARKET, BY GRADE, 2020-2029 (USD MILLION)
TABLE 6 ASIA PACIFIC KAOLIN MARKET, BY GRADE, 2020-2029 (KILO TONS)
TABLE 7 ASIA PACIFIC CALCINED IN KAOLIN MARKET, BY REGION, 2020-2029 (USD MILLION)
TABLE 8 ASIA PACIFIC CALCINED IN KAOLIN MARKET, BY REGION, 2020-2029 (KILO TONS)
TABLE 9 ASIA PACIFIC HYDROUS IN ASIA PACIFIC KAOLIN MARKET, BY REGION, 2020-2029 (USD MILLION)
TABLE 10 ASIA PACIFIC HYDROUS IN ASIA PACIFIC KAOLIN MARKET, BY REGION, 2020-2029 (KILO TONS)
TABLE 11 ASIA PACIFIC DELAMINATED IN ASIA PACIFIC KAOLIN MARKET, BY REGION, 2020-2029 (USD MILLION)
TABLE 12 ASIA PACIFIC DELAMINATED IN ASIA PACIFIC KAOLIN MARKET, BY REGION, 2020-2029 (KILO TONS)
TABLE 13 ASIA PACIFIC SURFACE TREATED IN ASIA PACIFIC KAOLIN MARKET, BY REGION, 2020-2029 (USD MILLION)
TABLE 14 ASIA PACIFIC SURFACE TREATED IN ASIA PACIFIC KAOLIN MARKET, BY REGION, 2020-2029 (KILO TONS)
TABLE 15 ASIA PACIFIC STRUCTURED IN ASIA PACIFIC KAOLIN MARKET, BY REGION, 2020-2029 (USD MILLION)
TABLE 16 ASIA PACIFIC STRUCTURED IN ASIA PACIFIC KAOLIN MARKET, BY REGION, 2020-2029 (KILO TONS)
TABLE 17 ASIA PACIFIC KAOLIN MARKET, BY PROCESS, 2020-2029 (USD MILLION)
TABLE 18 ASIA PACIFIC KAOLIN MARKET, BY GRADE, 2020-2029 (KILO TONS)
TABLE 19 ASIA PACIFIC WATER-WASHED IN KAOLIN MARKET, BY REGION, 2020-2029 (USD MILLION)
TABLE 20 ASIA PACIFIC WATER-WASHED IN KAOLIN MARKET, BY REGION, 2020-2029 (KILO TONS)
TABLE 21 ASIA PACIFIC AIRFLOAT IN ASIA PACIFIC KAOLIN MARKET, BY REGION, 2020-2029 (USD MILLION)
TABLE 22 ASIA PACIFIC AIRFLOAT IN ASIA PACIFIC KAOLIN MARKET, BY REGION, 2020-2029 (KILO TONS)
TABLE 23 ASIA PACIFIC CALCINED IN ASIA PACIFIC KAOLIN MARKET, BY REGION, 2020-2029 (USD MILLION)
TABLE 24 ASIA PACIFIC CALCINED IN ASIA PACIFIC KAOLIN MARKET, BY REGION, 2020-2029 (KILO TONS)
TABLE 25 ASIA PACIFIC DELAMINATED IN ASIA PACIFIC KAOLIN MARKET, BY REGION, 2020-2029 (USD MILLION)
TABLE 26 ASIA PACIFIC DELAMINATED IN ASIA PACIFIC KAOLIN MARKET, BY REGION, 2020-2029 (KILO TONS)
TABLE 27 ASIA PACIFIC SURFACE-MODIFIED & UNPROCESSED IN ASIA PACIFIC KAOLIN MARKET, BY REGION, 2020-2029 (USD MILLION)
TABLE 28 ASIA PACIFIC SURFACE-MODIFIED & UNPROCESSED IN ASIA PACIFIC KAOLIN MARKET, BY REGION, 2020-2029 (KILO TONS)
TABLE 29 ASIA PACIFIC KAOLIN MARKET, BY APPLICATION, 2020-2029 (USD MILLION)
TABLE 30 ASIA PACIFIC KAOLIN MARKET, BY APPLICATION, 2020-2029 (KILO TONS)
TABLE 31 ASIA PACIFIC PAPER IN KAOLIN MARKET, BY REGION, 2020-2029 (USD MILLION)
TABLE 32 ASIA PACIFIC PAPER IN KAOLIN MARKET, BY REGION, 2020-2029 (KILO TONS)
TABLE 33 ASIA PACIFIC CERAMICS IN ASIA PACIFIC KAOLIN MARKET, BY REGION, 2020-2029 (USD MILLION)
TABLE 34 ASIA PACIFIC CERAMICS IN ASIA PACIFIC KAOLIN MARKET, BY REGION, 2020-2029 (KILO TONS)
TABLE 35 ASIA PACIFIC PAINT & COATINGS IN ASIA PACIFIC KAOLIN MARKET, BY REGION, 2020-2029 (USD MILLION)
TABLE 36 ASIA PACIFIC PAINT & COATINGS IN ASIA PACIFIC KAOLIN MARKET, BY REGION, 2020-2029 (KILO TONS)
TABLE 37 ASIA PACIFIC FIBERGLASS IN ASIA PACIFIC KAOLIN MARKET, BY REGION, 2020-2029 (USD MILLION)
TABLE 38 ASIA PACIFIC FIBERGLASS IN ASIA PACIFIC KAOLIN MARKET, BY REGION, 2020-2029 (KILO TONS)
TABLE 39 ASIA PACIFIC PLASTIC IN ASIA PACIFIC KAOLIN MARKET, BY REGION, 2020-2029 (USD MILLION)
TABLE 40 ASIA PACIFIC PLASTIC IN ASIA PACIFIC KAOLIN MARKET, BY REGION, 2020-2029 (KILO TONS)
TABLE 41 ASIA PACIFIC RUBBER IN ASIA PACIFIC KAOLIN MARKET, BY REGION, 2020-2029 (USD MILLION)
TABLE 42 ASIA PACIFIC RUBBER IN ASIA PACIFIC KAOLIN MARKET, BY REGION, 2020-2029 (KILO TONS)
TABLE 43 ASIA PACIFIC PHARMACEUTICALS & MEDICAL IN ASIA PACIFIC KAOLIN MARKET, BY REGION, 2020-2029 (USD MILLION)
TABLE 44 ASIA PACIFIC PHARMACEUTICALS & MEDICAL IN ASIA PACIFIC KAOLIN MARKET, BY REGION, 2020-2029 (KILO TONS)
TABLE 45 ASIA PACIFIC COSMETICS IN ASIA PACIFIC KAOLIN MARKET, BY REGION, 2020-2029 (USD MILLION)
TABLE 46 ASIA PACIFIC COSMETICS IN ASIA PACIFIC KAOLIN MARKET, BY REGION, 2020-2029 (KILO TONS)
TABLE 47 ASIA PACIFIC OTHERS IN ASIA PACIFIC KAOLIN MARKET, BY REGION, 2020-2029 (USD MILLION)
TABLE 48 ASIA PACIFIC OTHERS IN ASIA PACIFIC KAOLIN MARKET, BY REGION, 2020-2029 (KILO TONS)
TABLE 49 ASIA-PACIFIC KAOLIN MARKET, BY COUNTRY, 2020-2029 (USD MILLION)
TABLE 50 ASIA-PACIFIC KAOLIN MARKET, BY COUNTRY, 2020-2029 (KILO TONS)
TABLE 51 ASIA-PACIFIC KAOLIN MARKET, BY GRADE, 2020-2029 (USD MILLION)
TABLE 52 ASIA-PACIFIC KAOLIN MARKET, BY GRADE, 2020-2029 (KILO TONS)
TABLE 53 ASIA-PACIFIC KAOLIN MARKET, BY PROCESS, 2020-2029 (USD MILLION)
TABLE 54 ASIA-PACIFIC KAOLIN MARKET, BY PROCESS, 2020-2029 (KILO TONS)
TABLE 55 ASIA-PACIFIC KAOLIN MARKET, BY APPLICATION, 2020-2029 (USD MILLION)
TABLE 56 ASIA-PACIFIC KAOLIN MARKET, BY APPLICATION, 2020-2029 (KILO TONS)
TABLE 57 CHINA KAOLIN MARKET, BY GRADE, 2020-2029 (USD MILLION)
TABLE 58 CHINA KAOLIN MARKET, BY GRADE, 2020-2029 (KILO TONS)
TABLE 59 CHINA KAOLIN MARKET, BY PROCESS, 2020-2029 (USD MILLION)
TABLE 60 CHINA KAOLIN MARKET, BY PROCESS, 2020-2029 (KILO TONS)
TABLE 61 CHINA KAOLIN MARKET, BY APPLICATION, 2020-2029 (USD MILLION)
TABLE 62 CHINA KAOLIN MARKET, BY APPLICATION, 2020-2029 (KILO TONS)
TABLE 63 INDIA KAOLIN MARKET, BY GRADE, 2020-2029 (USD MILLION)
TABLE 64 INDIA KAOLIN MARKET, BY GRADE, 2020-2029 (KILO TONS)
TABLE 65 INDIA KAOLIN MARKET, BY PROCESS, 2020-2029 (USD MILLION)
TABLE 66 INDIA KAOLIN MARKET, BY PROCESS, 2020-2029 (KILO TONS)
TABLE 67 INDIA KAOLIN MARKET, BY APPLICATION, 2020-2029 (USD MILLION)
TABLE 68 INDIA KAOLIN MARKET, BY APPLICATION, 2020-2029 (KILO TONS)
TABLE 69 JAPAN KAOLIN MARKET, BY GRADE, 2020-2029 (USD MILLION)
TABLE 70 JAPAN KAOLIN MARKET, BY GRADE, 2020-2029 (KILO TONS)
TABLE 71 JAPAN KAOLIN MARKET, BY PROCESS, 2020-2029 (USD MILLION)
TABLE 72 JAPAN KAOLIN MARKET, BY PROCESS, 2020-2029 (KILO TONS)
TABLE 73 JAPAN KAOLIN MARKET, BY APPLICATION, 2020-2029 (USD MILLION)
TABLE 74 JAPAN KAOLIN MARKET, BY APPLICATION, 2020-2029 (KILO TONS)
TABLE 75 SOUTH KOREA KAOLIN MARKET, BY GRADE, 2020-2029 (USD MILLION)
TABLE 76 SOUTH KOREA KAOLIN MARKET, BY GRADE, 2020-2029 (KILO TONS)
TABLE 77 SOUTH KOREA KAOLIN MARKET, BY PROCESS, 2020-2029 (USD MILLION)
TABLE 78 SOUTH KOREA KAOLIN MARKET, BY PROCESS, 2020-2029 (KILO TONS)
TABLE 79 SOUTH KOREA KAOLIN MARKET, BY APPLICATION, 2020-2029 (USD MILLION)
TABLE 80 SOUTH KOREA KAOLIN MARKET, BY APPLICATION, 2020-2029 (KILO TONS)
TABLE 81 THAILAND KAOLIN MARKET, BY GRADE, 2020-2029 (USD MILLION)
TABLE 82 THAILAND KAOLIN MARKET, BY GRADE, 2020-2029 (KILO TONS)
TABLE 83 THAILAND KAOLIN MARKET, BY PROCESS, 2020-2029 (USD MILLION)
TABLE 84 THAILAND KAOLIN MARKET, BY PROCESS, 2020-2029 (KILO TONS)
TABLE 85 THAILAND KAOLIN MARKET, BY APPLICATION, 2020-2029 (USD MILLION)
TABLE 86 THAILAND KAOLIN MARKET, BY APPLICATION, 2020-2029 (KILO TONS)
TABLE 87 SINGAPORE KAOLIN MARKET, BY GRADE, 2020-2029 (USD MILLION)
TABLE 88 SINGAPORE KAOLIN MARKET, BY GRADE, 2020-2029 (KILO TONS)
TABLE 89 SINGAPORE KAOLIN MARKET, BY PROCESS, 2020-2029 (USD MILLION)
TABLE 90 SINGAPORE KAOLIN MARKET, BY PROCESS, 2020-2029 (KILO TONS)
TABLE 91 SINGAPORE KAOLIN MARKET, BY APPLICATION, 2020-2029 (USD MILLION)
TABLE 92 SINGAPORE KAOLIN MARKET, BY APPLICATION, 2020-2029 (KILO TONS)
TABLE 93 INDONESIA KAOLIN MARKET, BY GRADE, 2020-2029 (USD MILLION)
TABLE 94 INDONESIA KAOLIN MARKET, BY GRADE, 2020-2029 (KILO TONS)
TABLE 95 INDONESIA KAOLIN MARKET, BY PROCESS, 2020-2029 (USD MILLION)
TABLE 96 INDONESIA KAOLIN MARKET, BY PROCESS, 2020-2029 (KILO TONS)
TABLE 97 INDONESIA KAOLIN MARKET, BY APPLICATION, 2020-2029 (USD MILLION)
TABLE 98 INDONESIA KAOLIN MARKET, BY APPLICATION, 2020-2029 (KILO TONS)
TABLE 99 AUSTRALIA & NEW ZEALAND KAOLIN MARKET, BY GRADE, 2020-2029 (USD MILLION)
TABLE 100 AUSTRALIA & NEW ZEALAND KAOLIN MARKET, BY GRADE, 2020-2029 (KILO TONS)
TABLE 101 AUSTRALIA & NEW ZEALAND KAOLIN MARKET, BY PROCESS, 2020-2029 (USD MILLION)
TABLE 102 AUSTRALIA & NEW ZEALAND KAOLIN MARKET, BY PROCESS, 2020-2029 (KILO TONS)
TABLE 103 AUSTRALIA & NEW ZEALAND KAOLIN MARKET, BY APPLICATION, 2020-2029 (USD MILLION)
TABLE 104 AUSTRALIA & NEW ZEALAND KAOLIN MARKET, BY APPLICATION, 2020-2029 (KILO TONS)
TABLE 105 PHILIPPINES KAOLIN MARKET, BY GRADE, 2020-2029 (USD MILLION)
TABLE 106 PHILIPPINES KAOLIN MARKET, BY GRADE, 2020-2029 (KILO TONS)
TABLE 107 PHILIPPINES KAOLIN MARKET, BY PROCESS, 2020-2029 (USD MILLION)
TABLE 108 PHILIPPINES KAOLIN MARKET, BY PROCESS, 2020-2029 (KILO TONS)
TABLE 109 PHILIPPINES KAOLIN MARKET, BY APPLICATION, 2020-2029 (USD MILLION)
TABLE 110 PHILIPPINES KAOLIN MARKET, BY APPLICATION, 2020-2029 (KILO TONS)
TABLE 111 MALAYSIA KAOLIN MARKET, BY GRADE, 2020-2029 (USD MILLION)
TABLE 112 MALAYSIA KAOLIN MARKET, BY GRADE, 2020-2029 (KILO TONS)
TABLE 113 MALAYSIA KAOLIN MARKET, BY PROCESS, 2020-2029 (USD MILLION)
TABLE 114 MALAYSIA KAOLIN MARKET, BY PROCESS, 2020-2029 (KILO TONS)
TABLE 115 MALAYSIA KAOLIN MARKET, BY APPLICATION, 2020-2029 (USD MILLION)
TABLE 116 MALAYSIA KAOLIN MARKET, BY APPLICATION, 2020-2029 (KILO TONS)
TABLE 117 REST OF ASIA-PACIFIC KAOLIN MARKET, BY GRADE, 2020-2029 (USD MILLION)
TABLE 118 REST OF ASIA-PACIFIC KAOLIN MARKET, BY GRADE, 2020-2029 (KILO TONS)
List of Figure
FIGURE 1 ASIA PACIFIC KAOLIN MARKET
FIGURE 2 ASIA PACIFIC KAOLIN MARKET: DATA TRIANGULATION
FIGURE 3 ASIA PACIFIC KAOLIN MARKET: DROC ANALYSIS
FIGURE 4 ASIA PACIFIC KAOLIN MARKET: ASIA PACIFIC VS REGIONAL MARKET ANALYSIS
FIGURE 5 ASIA PACIFIC KAOLIN MARKET: COMPANY RESEARCH ANALYSIS
FIGURE 6 ASIA PACIFIC KAOLIN MARKET: THE PRODUCT LIFE LINE CURVE
FIGURE 7 ASIA PACIFIC KAOLIN MARKET: MULTIVARIATE MODELLING
FIGURE 8 ASIA PACIFIC KAOLIN MARKET: INTERVIEW DEMOGRAPHICS
FIGURE 9 ASIA PACIFIC KAOLIN MARKET: DBMR MARKET POSITION GRID
FIGURE 10 ASIA PACIFIC KAOLIN MARKET: MARKET APPLICATION COVERAGE GRID
FIGURE 11 ASIA PACIFIC KAOLIN MARKET: THE MARKET CHALLENGE MATRIX
FIGURE 12 ASIA PACIFIC KAOLIN MARKET: VENDOR SHARE ANALYSIS
FIGURE 13 ASIA PACIFIC KAOLIN MARKET: SEGMENTATION
FIGURE 14 RISE IN CONSTRUCTION ACTIVITIES ACROSS THE GLOBE IS EXPECTED TO DRIVE THE ASIA PACIFIC KAOLIN MARKET IN THE FORECAST PERIOD
FIGURE 15 CALCINED SEGMENT IS EXPECTED TO ACCOUNT FOR THE LARGEST SHARE OF THE ASIA PACIFIC KAOLIN MARKET IN 2022 & 2029
FIGURE 16 IMPORT-EXPORT SCENARIO (USD THOUSAND)
FIGURE 17 CURRENT PRICE STATISTICS (PER KG)
FIGURE 18 PRICE FORECASTS (PER KG)
FIGURE 19 PRODUCTION CONSUMPTION ANALYSIS
FIGURE 20 DRIVERS, RESTRAINTS, OPPORTUNITIES, AND CHALLENGES OF THE ASIA PACIFIC KAOLIN MARKET
FIGURE 21 ASIA PACIFIC KAOLIN MARKET: BY GRADE, 2021
FIGURE 22 ASIA PACIFIC KAOLIN MARKET: BY PROCESS, 2021
FIGURE 23 ASIA PACIFIC KAOLIN MARKET: BY APPLICATION, 2021
FIGURE 24 ASIA-PACIFIC KAOLIN MARKET: SNAPSHOT (2021)
FIGURE 25 ASIA-PACIFIC KAOLIN MARKET: BY COUNTRY (2021)
FIGURE 26 ASIA-PACIFIC KAOLIN MARKET: BY COUNTRY (2022 & 2029)
FIGURE 27 ASIA-PACIFIC KAOLIN MARKET: BY COUNTRY (2021 & 2029)
FIGURE 28 ASIA-PACIFIC KAOLIN MARKET: BY GRADE (2022-2029)
FIGURE 29 ASIA PACIFIC KAOLIN MARKET: COMPANY SHARE 2021 (%)
Asia Pacific Kaolin Market, Supply Chain Analysis and Ecosystem Framework
To support market growth and help clients navigate the impact of geopolitical shifts, DBMR has integrated in-depth supply chain analysis into its Asia Pacific Kaolin Market research reports. This addition empowers clients to respond effectively to global changes affecting their industries. The supply chain analysis section includes detailed insights such as Asia Pacific Kaolin Market consumption and production by country, price trend analysis, the impact of tariffs and geopolitical developments, and import and export trends by country and HSN code. It also highlights major suppliers with data on production capacity and company profiles, as well as key importers and exporters. In addition to research, DBMR offers specialized supply chain consulting services backed by over a decade of experience, providing solutions like supplier discovery, supplier risk assessment, price trend analysis, impact evaluation of inflation and trade route changes, and comprehensive market trend analysis.
Data collection and base year analysis are done using data collection modules with large sample sizes. The stage includes obtaining market information or related data through various sources and strategies. It includes examining and planning all the data acquired from the past in advance. It likewise envelops the examination of information inconsistencies seen across different information sources. The market data is analysed and estimated using market statistical and coherent models. Also, market share analysis and key trend analysis are the major success factors in the market report. To know more, please request an analyst call or drop down your inquiry.
The key research methodology used by DBMR research team is data triangulation which involves data mining, analysis of the impact of data variables on the market and primary (industry expert) validation. Data models include Vendor Positioning Grid, Market Time Line Analysis, Market Overview and Guide, Company Positioning Grid, Patent Analysis, Pricing Analysis, Company Market Share Analysis, Standards of Measurement, Global versus Regional and Vendor Share Analysis. To know more about the research methodology, drop in an inquiry to speak to our industry experts.
Data Bridge Market Research is a leader in advanced formative research. We take pride in servicing our existing and new customers with data and analysis that match and suits their goal. The report can be customized to include price trend analysis of target brands understanding the market for additional countries (ask for the list of countries), clinical trial results data, literature review, refurbished market and product base analysis. Market analysis of target competitors can be analyzed from technology-based analysis to market portfolio strategies. We can add as many competitors that you require data about in the format and data style you are looking for. Our team of analysts can also provide you data in crude raw excel files pivot tables (Fact book) or can assist you in creating presentations from the data sets available in the report.


