
Asia Pacific Network Packet Broker Market
Market Size in USD Million
 USD
921.87 Million
USD
1,644.14 Million
2024
2032
USD
921.87 Million
USD
1,644.14 Million
2024
2032
| 2025 - 2032 | |
| USD 921.87 Million | |
| USD 1,644.14 Million | |
| % | |
Network Packet Broker Market Analysis
Network packet broker is being utilized for various applications, such as intelligence and filtering, data masking, and SSL decryption, among others. These devices are being used in sectors such as service providers, enterprises, government organization, and various other industrial verticals.
Network Packet Broker Market Size
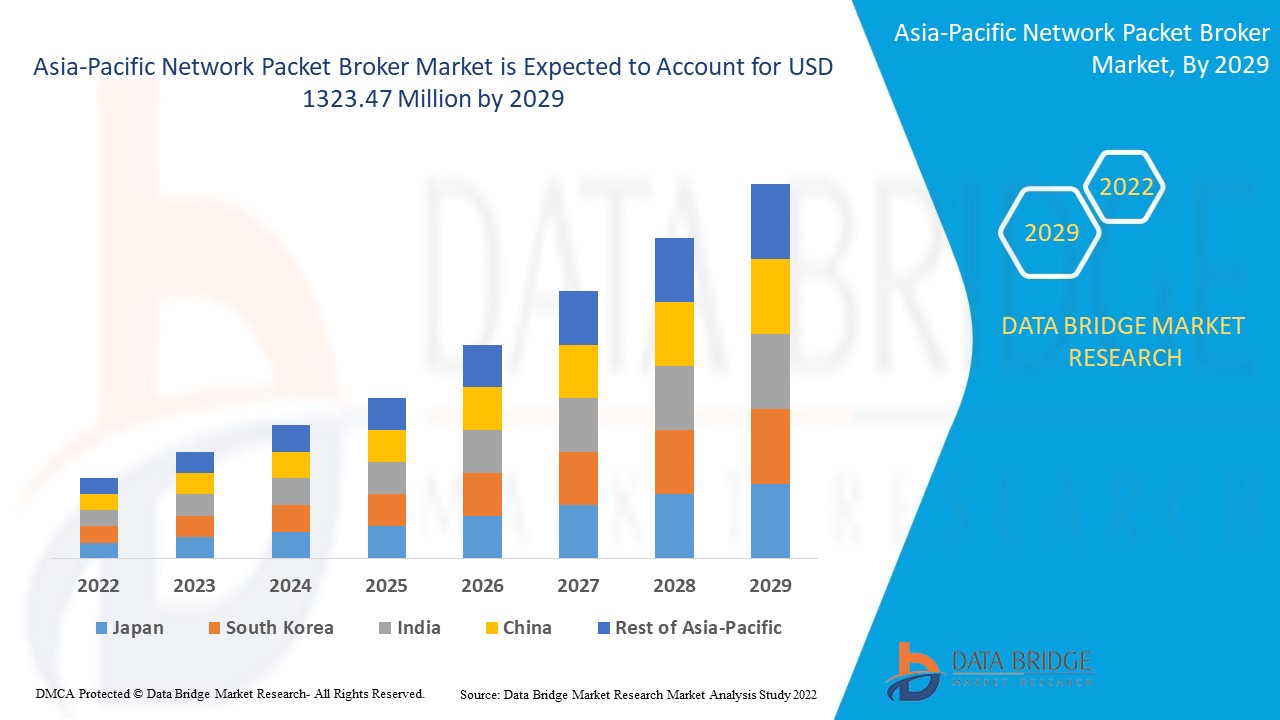
Asia-Pacific network packet broker market size was valued at USD 921.87 million in 2024 and is projected to reach USD 1644.14 million by 2032, with a CAGR of 7.5% during the forecast period of 2025 to 2032.
Report Scope and Market Segmentation
|
Attributes |
Network Packet Broker Key Market Insights |
|
Segmentation |
|
|
Countries Covered |
Japan, China, India, South Korea, Australia, Singapore, Malaysia, Thailand, Indonesia, Philippines, Rest of Asia-Pacific |
|
Key Market Players |
NETSCOUT (US), VIAVI Solutions Inc. (US), Keysight Technologies (US), Gigamon (US), APCON (Switzerland), Garland Technology (India), Big Switch Networks, Inc. (US), Network Critical (UK), Corvil (Ireland), Microtel Innovation S.r.l (Italy), Juniper Networks, Inc. (US), Arista Networks, Inc. (US), CPACKET NETWORKS (US), Niagara Networks (US), Profitap HQ B.V. (Netherlands), CGS Tower Networks (Israel), Datacom Systems INC (US), 5FeetNetworks Oy (Finland), Cisco (US) and ECI Telecom (Israel), among others |
|
Market Opportunities |
|
Network Packet Broker Market Definition
Network packet broker, also teemed as NPB, is a type of device that offers a collection of monitoring tools and is located between tools and device infrastructure. It helps to re-strengthen network security by providing monitoring, security and acceleration on tools for their applications and eradicating repetitive data and protecting monitoring tools from being congested.
Network Packet Broker Market Dynamics
This section deals with understanding the market drivers, advantages, opportunities, restraints and challenges. All of this is discussed in detail as below:
Drivers:
- Need For Simplified Data Center Management
The rise in need for simplified data center management, and automation is one of the major factors driving the growth of network packet broker market. The increase in demand for cloud services have a positive impact on the market.
- Surge in Connecting Devices
The rise in number of connecting devices associated with increasing security concerns resulting in high demand for monitoring and security tools accelerate the market growth.
- Adoption of Cloud Computing
The surge in the adoption of cloud computing and the ever-increasing number of multimedia content on the internet further influence the market. Also, use of bare-metal switches and introduction of cost-effective network packet broker further assist in the expansion of the market.
Additionally, rapid urbanization, change in lifestyle, surge in investments and increased consumer spending positively impact the network packet broker market.
Opportunities
Furthermore, rise in trend of bare-metal switches extend profitable opportunities to the market players in the forecast period of 2025 to 2032. Also, increase in bandwidth requirements in data centers will further expand the market.
Restraints/Challenges
On the other hand, presence of self-reliant better servers is expected to obstruct market growth. Also, issues with compatibility with different data center architectures are projected to challenge the network packet broker market in the forecast period of 2025-2032.
This network packet broker market report provides details of new recent developments, trade regulations, import-export analysis, production analysis, value chain optimization, market share, impact of domestic and localized market players, analyses opportunities in terms of emerging revenue pockets, changes in market regulations, strategic market growth analysis, market size, category market growths, application niches and dominance, product approvals, product launches, geographic expansions, technological innovations in the market. To gain more info on network packet broker market contact Data Bridge Market Research for an Analyst Brief, our team will help you take an informed market decision to achieve market growth.
Network Packet Broker Market Scope
The pet companion robots market is segmented on the basis of bandwidth, network set-up, security tools and end user. The growth amongst these segments will help you analyze meager growth segments in the industries and provide the users with a valuable market overview and market insights to help them make strategic decisions for identifying core market applications.
Bandwidth
- 1 gbps and 10 gbps
- 40 gbps
- 100 gbps
Network Set-Up
- On-Premise
- Virtual
- Cloud
Security Tools
- Passive
- Active (Inline)
End User
- Enterprise
- Service Providers
- Government Organizations
Asia-Pacific Network Packet Broker Market Share
The network packet broker market competitive landscape provides details by competitor. Details included are company overview, company financials, revenue generated, market potential, investment in research and development, new market initiatives, global presence, production sites and facilities, production capacities, company strengths and weaknesses, product launch, product width and breadth, application dominance. The above data points provided are only related to the companies' focus related to network packet broker market.
Network Packet Broker Market Leaders Operating in the Market Are:
- NETSCOUT (US), VIAVI Solutions Inc. (US)
- Keysight Technologies (US)
- Gigamon (US)
- APCON (Switzerland)
- Garland Technology (India)
- Big Switch Networks, Inc. (US)
- Network Critical (UK)
- Corvil (Ireland)
- Microtel Innovation S.r.l (Italy)
- Juniper Networks, Inc. (US)
- Arista Networks, Inc. (US)
- CPACKET NETWORKS (US)
- Niagara Networks (US)
- Profitap HQ B.V. (Netherlands)
- CGS Tower Networks (Israel)
- Datacom Systems INC (US)
- 5FeetNetworks Oy (Finland)
- Cisco (US)
- ECI Telecom (Israel)
Latest Developments in Network Packet Broker Market
- In July 2019, Niagara Networks collaborated with L7 Defense for API security in order to attempt to bring zero trust safety to API communication across a company network. Niagara Networks collects traffic throughout the network and offers Ammune complete visibility for risk inspection to secure the API. The company enhances the customer base with this collaboration.
- In July 2018, Gigamon launched “next-generation” network packet broker in security business. This helps in setting up its network visibility equipment as traffic monitoring systems by identifying the movement in any network and transmitting them to suitable security tool for additional inquiry. This will help the company in sale maximization by catering the customer’s needs.
SKU-

- Interactive Data Analysis Dashboard
- Company Analysis Dashboard for high growth potential opportunities
- Research Analyst Access for customization & queries
- Competitor Analysis with Interactive dashboard
- Latest News, Updates & Trend analysis
- Harness the Power of Benchmark Analysis for Comprehensive Competitor Tracking
Asia Pacific Network Packet Broker Market, Supply Chain Analysis and Ecosystem Framework
To support market growth and help clients navigate the impact of geopolitical shifts, DBMR has integrated in-depth supply chain analysis into its Asia Pacific Network Packet Broker Market research reports. This addition empowers clients to respond effectively to global changes affecting their industries. The supply chain analysis section includes detailed insights such as Asia Pacific Network Packet Broker Market consumption and production by country, price trend analysis, the impact of tariffs and geopolitical developments, and import and export trends by country and HSN code. It also highlights major suppliers with data on production capacity and company profiles, as well as key importers and exporters. In addition to research, DBMR offers specialized supply chain consulting services backed by over a decade of experience, providing solutions like supplier discovery, supplier risk assessment, price trend analysis, impact evaluation of inflation and trade route changes, and comprehensive market trend analysis.
Data collection and base year analysis are done using data collection modules with large sample sizes. The stage includes obtaining market information or related data through various sources and strategies. It includes examining and planning all the data acquired from the past in advance. It likewise envelops the examination of information inconsistencies seen across different information sources. The market data is analysed and estimated using market statistical and coherent models. Also, market share analysis and key trend analysis are the major success factors in the market report. To know more, please request an analyst call or drop down your inquiry.
The key research methodology used by DBMR research team is data triangulation which involves data mining, analysis of the impact of data variables on the market and primary (industry expert) validation. Data models include Vendor Positioning Grid, Market Time Line Analysis, Market Overview and Guide, Company Positioning Grid, Patent Analysis, Pricing Analysis, Company Market Share Analysis, Standards of Measurement, Global versus Regional and Vendor Share Analysis. To know more about the research methodology, drop in an inquiry to speak to our industry experts.
Data Bridge Market Research is a leader in advanced formative research. We take pride in servicing our existing and new customers with data and analysis that match and suits their goal. The report can be customized to include price trend analysis of target brands understanding the market for additional countries (ask for the list of countries), clinical trial results data, literature review, refurbished market and product base analysis. Market analysis of target competitors can be analyzed from technology-based analysis to market portfolio strategies. We can add as many competitors that you require data about in the format and data style you are looking for. Our team of analysts can also provide you data in crude raw excel files pivot tables (Fact book) or can assist you in creating presentations from the data sets available in the report.


