
Market Analysis and Size
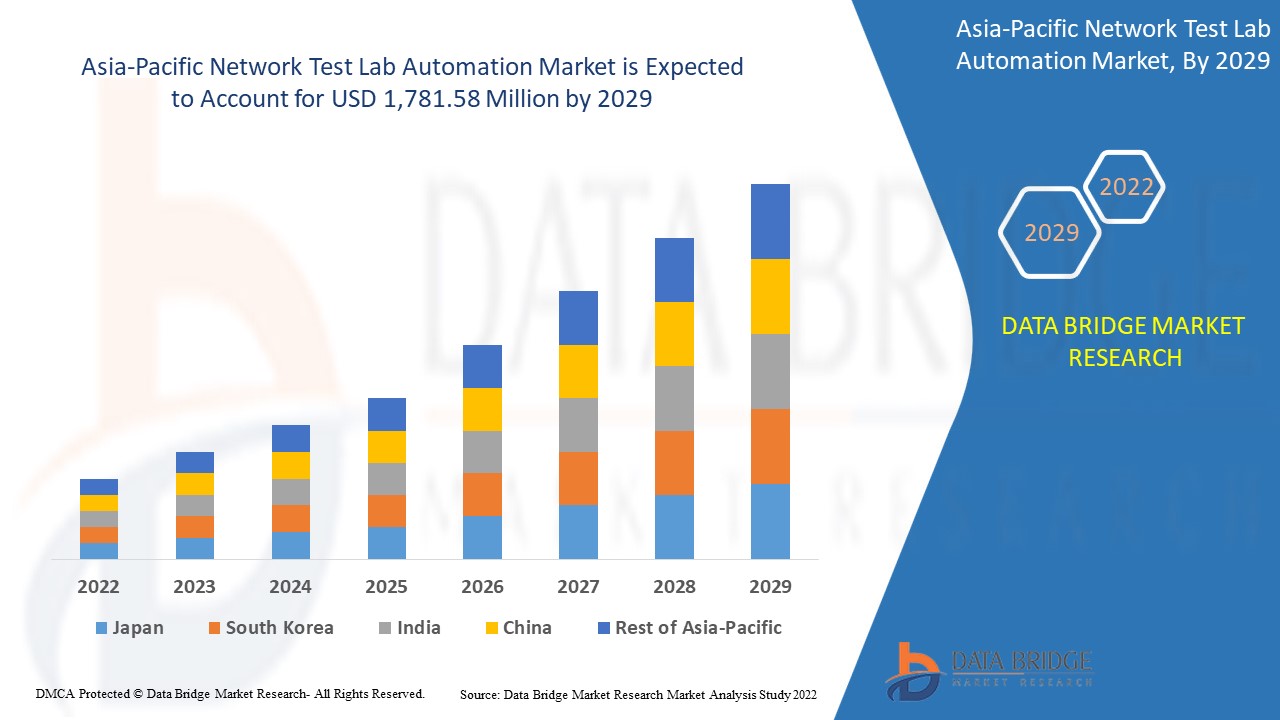
As industries and enterprises accelerate their digital transformation initiatives, new product and technology cycles are getting shorter. To ensure success of new technology introduction in existing operational environments, it is critical to have the right resources to extensively test and validate the device, product or solution for real world reliability, performance and interoperability. Since testing on simulated environments introduces significant future risks, most enterprises make considerable investments in building lab infrastructure and expertise or get it tested by network test lab automation service providers. As these new technologies and products from industries and enterprises are more complex than before and enterprises face a skills gap in networking, testing, monitoring and automation; the service providers do the testing on behalf of enterprises. The services provider may use testing type such as functional, performance or regression for the proposed product and take help of various tools in test. The arrival of Artificial Intelligence and its integration with IOTs and 5G will rise the rate of digital products in all industries and has to be tested before launch. This will make the Asia-Pacific network test lab automation market bloom in the future.
Data Bridge Market Research analyses that the Asia-Pacific Network test lab automation market is expected to reach the value of USD 1,781.58 million by 2029. The network test lab automation market report also covers pricing analysis, patent analysis, and technological advancements in depth.
|
Report Metric |
Details |
|
Forecast Period |
2022 to 2029 |
|
Base Year |
2021 |
|
Historic Year |
2020 |
|
Quantitative Units |
Revenue in USD Million |
|
Segments Covered |
By Component (Hardware, Software, Services), Network Type (Physical Network, Virtual Network, Hybrid Network), Testing Type (Functional Testing, Regression Testing, Performance Testing), Deployment Mode (Cloud, On-Premise, Hybrid), End-User (Enterprise Vertical, Service Provider), Organization Size (Large Enterprise, Small & Medium Enterprise), Automation Type (Modular Automation, Total Lab Automation) |
|
Countries Covered |
China, Japan, India, South Korea, Singapore, Malaysia, Australia, Thailand, Indonesia, Philippines, Rest of Asia-Pacific (APAC) in the Asia-Pacific (APAC). |
|
Market Players Covered |
Qualisystems Ltd., Spirent Communications, Lepton, Pluribus Networks, Polatis, Fiber Smart Networks, Cisco, Sedona Systems, Anuta Networks, Versa Networks, Netbrain, Juniper Networks, Netscout, Keysight Technologies, ZPE Systems, Inc., Danaher, Great Software Laboratory, Accuver, Wipro, Appviewx, HCL Technologies. |
Market Definition
The process of automating the configuration, operation, deployment, testing, and management of virtual and physical devices in a network is referred to as network automation. The availability of the network service will increase as everyday functions and network testing, as well as repetitive procedures, are handled and controlled automatically. Any network can benefit from network automation. Enterprises, service providers, and data centres can use software and hardware-based solutions to automate their networks, lowering operational costs, reducing human error, and increasing productivity.
Network Test Lab Automation Market Dynamics
This section deals with understanding the market drivers, advantages, opportunities, restraints and challenges. All of this is discussed in detail as below:
Drivers
- Rise in demand for automation and solution for seamless customer experience
Nowadays, research and pathology laboratories have undergone significant evolution in the last two decades. In the labs, there is a growing demand for technologically advanced automated instruments and laboratory systems. Several innovations, including lab automation, are being driven by the desire to improve diagnoses, medication discovery, and research.
With lab automation, different lab scientists and professionals are able to achieve next-gen speed, consistency, and precision in research and report generation. Furthermore, lab automation advancements have resulted in the standardization of processes that help in reducing the number of errors. Therefore, the increasing evaluation of real-time results with the help of automated techniques and the growing cases of diagnosis has resulted in a significant demand for advanced software and cutting-edge automated systems.
- Penetration of cloud based storage options for various lab applications
Over the last few decades, it is reported that 90% of businesses have chosen the cloud-based solutions over traditional computing and data storage methods for benefits like better insights, easier collaboration, and reduced costs for the organizations. However, increased cloud usage means that businesses also need to manage their cloud infrastructure more efficiently in order to manage operational efficiency and reduced complexity. Cloud automation refers to the use of software and processes to automate the provisioning and management of cloud computing workloads and services such as virtual network creation, virtual machine deployment, load balancing, and performance monitoring. Using cloud automation, IT administrators can reduce or eliminate manual processes to lower administrative overhead and speed up the delivery of resources.
Opportunities
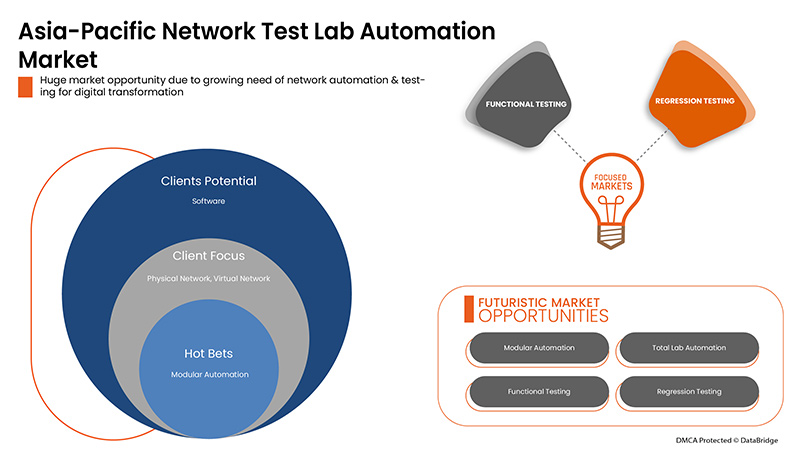
- Growing need of network automation & testing for digital transformation
Digital transformation is the process of using digital technologies to transform existing traditional and non-digital business processes and services, or creating new ones, to meet the evolving market and customer expectations. Thus it is completely altering the way businesses are managed and operated, and how value is delivered to customers. Digital transformation is important as it allows organizations to adapt to ever-changing industries and continually improve its operations accordingly. Every digital transformation initiative will have its own specific goals. The main purpose of any digital transformation is to improve the current processes. But, the digital transformation of organizations, it requires extensive planning, proper resource management, testing & development of products and software with huge capital investment. If not done, it can take a long time to implement the software and business model which result leads in a loss of capital and time for an organisation. According to a Bain & Company study, only 8% of global companies have been able to achieve their targeted business outcomes from their investments in digital technology. This makes the integration of network automation and testing very essential for the successful digital transformation.
Restraints/Challenges
- Rise in complexity of lab automation systems and thereby increasing the risk of downtime
Network lab automation processes have been implemented across the globe to benefit from decreasing the necessity for human staff and to perform repetitive tasks by implementing automated machine processes instead. But the higher the complexity of the system, the greater the risk that a system failure would generate serious consequences on laboratory functioning. Many critical system failures, especially involving the assembly lines, would require restoring manual procedures for managing samples (i.e. manual sorting, centrifugation). Although in most labs, it is found that resources are a limiting factor for development and testing. A traditional way to manage the labs and coordinate schedules is to use patch panels and change connections manually. However, this approach is not scalable and is inefficient in many cases.
- Lack of skilled workforce and experienced expertise
Artificial Intelligence (AI), Machine Learning (ML), the Internet of Things (IoT), and Automation are new technologies which have the potential to transform the network testing industry over the next decade. These technological trends have become even more important with the COVID-19 pandemic changing the tech-driven landscape. With the global pandemic changing workforce dynamics, the reliance on cutting-edge software, web, and mobile applications has grown substantially. To support this ever-growing demand, businesses turned to technology to increase the need to release fully functional, feature-rich, and flawless products and software to their end-users. As a result, in came test automation brought the promise of extensive test coverage, scientific test accuracy, streamlined testing operations, lower cost, and increased resource efficiency. This resulted in the need for a large skilled workforce for the industry to meet the rising demand. A skilled worker is any worker who has special skills, training, or knowledge that they can then apply to their work. The skills required for the network testing industry may include proficiency in various programming languages, mastery of leading automation testing tools (codeless ones too), should have experience in manual testing and knowledge of test management tools with an understanding of business requirements. This requirement narrowed down the number of skilled labour for the industry additionally the demand for this role is increasing as less qualified labour is in the industry.
Post COVID-19 Impact on Network Test Lab Automation Market
COVID-19 created a positive impact on the network test lab automation market due to rapid adoption of remote working and cloud infrastructure.
The COVID-19 pandemic has impacted the network test lab automation market to an extent in positive manner. Increasing adoption and utilization of artificial intelligence and machine learning in enterprises has helped the market to grow during and after the pandemic. Also, the growth has been high after the market has opened after COVID-19, and it is expected that there would be considerable growth in the sector owing to higher demand of industry 4.0 and automation technology.
Solution providers are making various strategic decisions to bounce back post-COVID-19. The players are conducting multiple research and development activities to improve the technology involved in the network test lab automation. With this, the companies will bring advanced technologies to the market. In addition, government initiatives for use of automation technology has led to the market's growth
Recent Development
- In April 2022, Keysight Technologies, Inc. announced that its automated field-to-lab device test platform solutions have been selected by Xiaomi. Xiaomi chose Keysight's test tools to verify 5G device performance under a variety of network signaling and radio channel circumstances. To develop advanced 5G test solutions, Keysight effectively combined lab and field-based test capabilities. This collaboration will enhance the client portfolio and the presence of the company.
- In January 2022, Spirent acquires octoScope to expand WiFi testing capabilities. octoScope’s test solutions comprise automated Wi-Fi and 5G testing in emulated real-world-like environments, including the latest WiFi 6 and WiFi 6E technologies. This acquisition will help in wireless network test solutions company to expand WiFi testing capabilities also enhance the services and also brand reorganization across the globe.
Asia-Pacific Network Test Lab Automation Market Scope
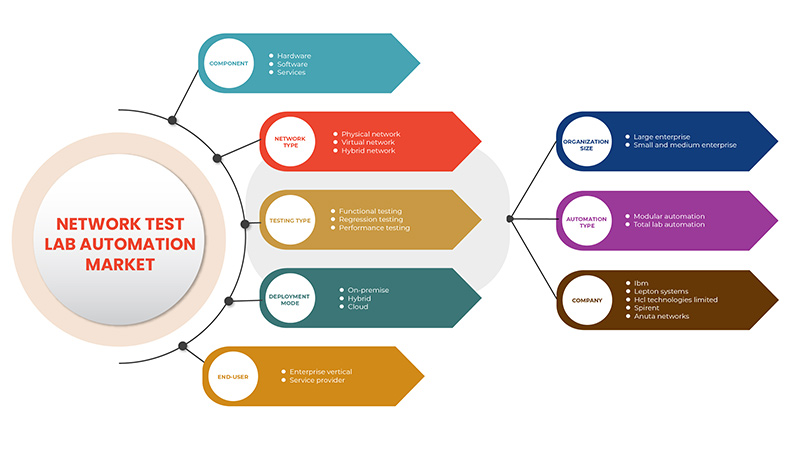
The network test lab automation market is segmented on the basis of component, network type, testing type, deployment mode, end-user, organization size, automation type. The growth amongst these segments will help you analyze meagre growth segments in the industries and provide the users with a valuable market overview and market insights to help them make strategic decisions for identifying core market applications.
Component
- Hardware
- Software
- Services
On the basis of component, the Asia-Pacific network test lab automation market is segmented into hardware, software, services.
Network Type
- Physical Network
- Virtual Network
- Hybrid Network
On the basis of network type, the Asia-Pacific network test lab automation market has been segmented into physical network, virtual network, hybrid network.
Testing Type
- Functional Testing
- Regression Testing
- Performance Testing
On the basis of testing type, the Asia-Pacific network test lab automation market has been segmented into functional testing, regression testing, performance testing.
Deployment Mode
- Cloud
- Hybrid
- On-Premise
On the basis of deployment mode, the Asia-Pacific network test lab automation market is segmented into cloud, hybrid, on-premise.
End-User
- Enterprise Vertical
- Service Provider
On the basis of end-user, the Asia-Pacific network test lab automation market has been segmented into enterprise vertical, service provider.
Organization Size
- Large Enterprise
- Small & Medium Enterprise
On the basis of organization size, the Asia-Pacific network test lab automation market is segmented into large enterprise, small & medium enterprise.
Automation Type
- Modular Automation
- Total Lab Automation
On the basis of automation type, the Asia-Pacific network test lab automation market is segmented into modular automation, total lab automation.
Network Test Lab Automation Market Regional Analysis/Insights
The network test lab automation market is analysed and market size insights and trends are provided by country, material type, manufacturing process and end-use industry as referenced above.
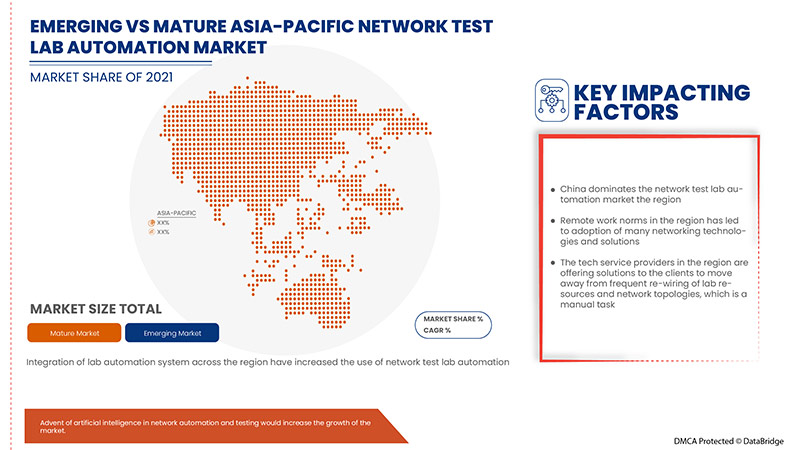
The countries covered in the network test lab automation market report are China, Japan, India, South Korea, Singapore, Malaysia, Australia, Thailand, Indonesia, Philippines, Rest of Asia-Pacific (APAC) in the Asia-Pacific (APAC). China dominates in the Asia-Pacific region due to heavy investment from enterprises in digitizing the business operations.
The country section of the report also provides individual market impacting factors and changes in market regulation that impact the current and future trends of the market. Data points like down-stream and upstream value chain analysis, technical trends and porter's five forces analysis, case studies are some of the pointers used to forecast the market scenario for individual countries. Also, the presence and availability of global brands and their challenges faced due to large or scarce competition from local and domestic brands, impact of domestic tariffs and trade routes are considered while providing forecast analysis of the country data.
Competitive Landscape and Network Test Lab Automation Market Share Analysis
The network test lab automation market competitive landscape provides details by competitor. Details included are company overview, company financials, revenue generated, market potential, investment in research and development, new market initiatives, global presence, production sites and facilities, production capacities, company strengths and weaknesses, product launch, product width and breadth, application dominance. The above data points provided are only related to the companies' focus related to network test lab automation market.
Some of the major players operating in the network test lab automation market are: Qualisystems Ltd., Spirent Communications, Lepton, Pluribus Networks, Polatis, Fiber Smart Networks, Cisco, Sedona Systems, Anuta Networks, Versa Networks, Netbrain, Juniper Networks, Netscout, Keysight Technologies, ZPE Systems, Inc., Danaher, Great Software Laboratory, Accuver, Wipro, Appviewx, HCL Technologies.
SKU-

- Interactive Data Analysis Dashboard
- Company Analysis Dashboard for high growth potential opportunities
- Research Analyst Access for customization & queries
- Competitor Analysis with Interactive dashboard
- Latest News, Updates & Trend analysis
- Harness the Power of Benchmark Analysis for Comprehensive Competitor Tracking
Table of Content
1 INTRODUCTION
1.1 OBJECTIVES OF THE STUDY
1.2 MARKET DEFINITION
1.3 OVERVIEW OF ASIA PACIFIC NETWORK TEST LAB AUTOMATION MARKET
1.4 CURRENCY AND PRICING
1.5 LIMITATIONS
1.6 MARKETS COVERED
2 MARKET SEGMENTATION
2.1 MARKETS COVERED
2.2 YEARS CONSIDERED FOR THE STUDY
2.3 GEOGRAPHIC SCOPE
2.4 DBMR TRIPOD DATA VALIDATION MODEL
2.5 PRIMARY INTERVIEWS WITH KEY OPINION LEADERS
2.6 DBMR MARKET POSITION GRID
2.7 VENDOR SHARE ANALYSIS
2.8 MARKET END-USER COVERAGE GRID
2.9 MULTIVARIATE MODELLING
2.1 COMPONENT CURVE
2.11 SECONDARY SOURCES
2.12 ASSUMPTIONS
3 EXECUTIVE SUMMARY
4 PREMIUM INSIGHTS
4.1 TECHNOLOGICAL TRENDS
4.2 CASE STUDIES
4.2.1 AUTOMATION OF API TESTING FOR NETWORK APPLICATION
4.2.2 CIRCUIT SWITCHED CORE NETWORK AUTOMATION
4.3 VALUE CHAIN ANALYSIS
5 MARKET OVERVIEW
5.1 DRIVERS
5.1.1 RISE IN DEMAND FOR AUTOMATION AND SOLUTION FOR SEAMLESS CUSTOMER EXPERIENCE
5.1.2 INTEGRATION OF LAB AUTOMATION SYSTEM ACROSS THE REGION
5.1.3 PENETRATION OF CLOUD BASED STORAGE OPTIONS FOR VARIOUS LAB APPLICATIONS
5.1.4 HIGHER ACCURACY AND QUALITY OF TESTING ASSOCIATED WITH NETWORK TEST LAB AUTOMATION
5.2 RESTRAINTS
5.2.1 HIGHER COST FOR IMPLEMENTATION OF LAB AUTOMATION SYSTEMS
5.2.2 RISE IN COMPLEXITY OF LAB AUTOMATION SYSTEMS AND THEREBY INCREASING THE RISK OF DOWNTIME
5.3 OPPORTUNITIES
5.3.1 GROWING NEED OF NETWORK AUTOMATION & TESTING FOR DIGITAL TRANSFORMATION
5.3.2 INCREASING ADVANCEMENT OF AUTOMATION IN MEDICAL SEGMENT
5.3.3 ADVENT OF ARTIFICIAL INTELLIGENCE IN NETWORK AUTOMATION AND TESTING
5.3.4 INCREASING STRATEGIC PARTNERSHIP AMONG MAJOR MARKET PLAYERS
5.4 CHALLENGES
5.4.1 LACK OF END USER FRIENDLY TOOLS IN TEST LAB AUTOMATION
5.4.2 LACK OF SKILLED WORKFORCE AND EXPERIENCED EXPERTISE
6 ASIA PACIFIC NETWORK TEST LAB AUTOMATION MARKET, BY COMPONENT
6.1 OVERVIEW
6.2 SOFTWARE
6.2.1 TEST AS A SERVICE
6.2.2 NETWORK AUTOMATION TOOLS
6.2.3 TEST LAB AS A SERVICE (LAAS)
6.2.4 INTENT-BASED NETWORKING
6.3 HARDWARE
6.4 SERVICES
6.4.1 PROFESSIONAL SERVICE
6.4.1.1 DEPLOYMENT AND INTEGRATION SERVICES
6.4.1.2 TRAINING AND SUPPORT SERVICES
6.4.1.3 ADVISORY AND CONSULTING SERVICE
6.4.2 MANAGED SERVICE
7 ASIA PACIFIC NETWORK TEST LAB AUTOMATION MARKET, BY NETWORK TYPE
7.1 OVERVIEW
7.2 VIRTUAL NETWORK
7.3 HYBRID NETWORK
7.4 PHYSICAL NETWORK
8 ASIA PACIFIC NETWORK TEST LAB AUTOMATION MARKET, BY TESTING TYPE
8.1 OVERVIEW
8.2 FUNCTIONAL TESTING
8.3 REGRESSION TESTING
8.4 PERFORMANCE TESTING
9 ASIA PACIFIC NETWORK TEST LAB AUTOMATION MARKET, BY DEPLOYMENT MODE
9.1 OVERVIEW
9.2 CLOUD
9.3 ON-PREMISE
9.4 HYBRID
10 ASIA PACIFIC NETWORK TEST LAB AUTOMATION MARKET, BY END-USER
10.1 OVERVIEW
10.2 ENTERPRISE VERTICAL
10.2.1 INFORMATION TECHNOLOGY
10.2.2 BANKING, FINANCIAL SERVICE AND INSURANCE
10.2.3 MANUFACTURING
10.2.4 HEALTHCARE
10.2.5 EDUCATION
10.2.6 ENERGY AND UTILITIES
10.2.7 OTHERS
10.3 SERVICE PROVIDER
11 ASIA PACIFIC NETWORK TEST LAB AUTOMATION MARKET, BY AUTOMATION TYPE
11.1 OVERVIEW
11.2 MODULAR AUTOMATION
11.3 TOTAL LAB AUTOMATION
12 ASIA PACIFIC NETWORK TEST LAB AUTOMATION MARKET, BY ORGANIZATION SIZE
12.1 OVERVIEW
12.2 LARGE ENTERPRISE
12.3 SMALL AND MEDIUM ENTERPRISE
13 ASIA PACIFIC NETWORK TEST LAB AUTOMATION MARKET, BY REGION
13.1 ASIA-PACIFIC
13.1.1 CHINA
13.1.2 JAPAN
13.1.3 SOUTH KOREA
13.1.4 INDIA
13.1.5 AUSTRALIA
13.1.6 SINGAPORE
13.1.7 INDONESIA
13.1.8 MALAYSIA
13.1.9 THAILAND
13.1.10 PHILIPPINES
13.1.11 REST OF ASIA-PACIFIC
14 ASIA PACIFIC NETWORK TEST LAB AUTOMATION MARKET: COMPANY LANDSCAPE
14.1 COMPANY SHARE ANALYSIS: ASIA PACIFIC
15 SWOT ANALYSIS
16 COMPANY PROFILE
16.1 KEYSIGHT TECHNOLOGIES
16.1.1 COMPANY SNAPSHOT
16.1.2 REVENUE ANALYSIS
16.1.3 COMPANY SHARE ANALYSIS
16.1.4 SOLUTION PORTFOLIO
16.1.5 RECENT DEVELOPMENT
16.2 IBM
16.2.1 COMPANY SNAPSHOT
16.2.2 REVENUE ANALYSIS
16.2.3 COMPANY SHARE ANALYSIS
16.2.4 PRODUCT PORTFOLIO
16.2.5 RECENT DEVELOPMENTS
16.3 SPIRENT COMMUNICATIONS
16.3.1 COMPANY SNAPSHOT
16.3.2 REVENUE ANALYSIS
16.3.3 COMPANY SHARE ANALYSIS
16.3.4 PRODUCT PORTFOLIO
16.3.5 RECENT DEVELOPMENTS
16.4 CISCO SYSTEMS, INC.
16.4.1 COMPANY SNAPSHOT
16.4.2 REVENUE ANALYSIS
16.4.3 COMPANY SHARE ANALYSIS
16.4.4 PRODUCT PORTFOLIO
16.4.5 RECENT DEVELOPMENTS
16.5 HCL TECHNOLOGIES LIMITED
16.5.1 COMPANY SNAPSHOT
16.5.2 REVENUE ANALYSIS
16.5.3 COMPANY SHARE ANALYSIS
16.5.4 SOLUTIONS PORTFOLIO
16.5.5 RECENT DEVELOPMENTS
16.6 ACCUVER
16.6.1 COMPANY SNAPSHOT
16.6.2 PRODUCT PORTFOLIO
16.6.3 RECENT DEVELOPMENT
16.7 ANUTA NETWORKS PVT. LTD.
16.7.1 COMPANY SNAPSHOT
16.7.2 PRODUCT PORTFOLIO
16.7.3 RECENT DEVELOPMENTS
16.8 APPVIEWX
16.8.1 COMPANY SNAPSHOT
16.8.2 PRODUCT PORTFOLIO
16.8.3 RECENT DEVELOPMENTS
16.9 BELL INTEGRATOR
16.9.1 COMPANY SNAPSHOT
16.9.2 SERVICE PORTFOLIO
16.9.3 RECENT DEVELOPMENTS
16.1 CALIENT TECHNOLOGIES
16.10.1 COMPANY SNAPSHOT
16.10.2 SOLUTION PORTFOLIO
16.10.3 RECENT DEVELOPMENT
16.11 DANAHER
16.11.1 COMPANY SNAPSHOT
16.11.2 REVENUE ANALYSIS
16.11.3 BRAND PORTFOLIO
16.11.4 RECENT DEVELOPMENT
16.12 FIBER MOUNTAIN
16.12.1 COMPANY SNAPSHOT
16.12.2 PRODUCT PORTFOLIO
16.12.3 RECENT DEVELOPMENT
16.13 FIBER SMART NETWORKS INC.
16.13.1 COMPANY SNAPSHOT
16.13.2 PRODUCT PORTFOLIO
16.13.3 RECENT DEVELOPMENTS
16.14 GREAT SOFTWARE LABORATORY
16.14.1 COMPANY SNAPHSOT
16.14.2 SOLUTION PORTFOLIO
16.14.3 RECENT DEVELOPMENT
16.15 JUNIPER NETWORKS, INC.
16.15.1 COMPANY SNAPSHOT
16.15.2 REVENUE ANALYSIS
16.15.3 PRODUCT PORTFOLIO
16.15.4 RECENT DEVELOPMENTS
16.16 KENTIK
16.16.1 COMPANY SNAPSHOT
16.16.2 SOLUTION PORTFOLIO
16.16.3 RECENT DEVELOPMENTS
16.17 LEPTON SYSTEMS
16.17.1 COMPANY SNAPSHOT
16.17.2 PRODUCT PORTFOLIO
16.17.3 RECENT DEVELOPMENTS
16.18 NETBRAIN TECHNOLOGIES, INC.
16.18.1 COMPANY SNAPSHOT
16.18.2 SERVICE PORTFOLIO
16.18.3 RECENT DEVELOPMENT
16.19 NETSCOUT
16.19.1 COMPANY SNAPSHOT
16.19.2 REVENUE ANALYSIS
16.19.3 PRODUCT PORTFOLIO
16.19.4 RECENT DEVELOPMENTS
16.2 PHOENIX DATACOM LIMITED
16.20.1 COMPANY SNAPSHOT
16.20.2 SOLUTION PORTFOLIO
16.20.3 RECENT DEVELOPMENT
16.21 PLURIBUS NETWORKS
16.21.1 COMPANY SNAPSHOT
16.21.2 PRODUCT PORTFOLIO
16.21.3 RECENT DEVELOPMENTS
16.22 POLATIS, INC.
16.22.1 COMPANY SNAPSHOT
16.22.2 PRODUCT PORTFOLIO
16.22.3 RECENT DEVELOPMENTS
16.23 QUALISYSTEMS LTD
16.23.1 COMPANY SNAPSHOT
16.23.2 PRODUCT PORTFOLIO
16.23.3 RECENT DEVELOPMENTS
16.24 SEGRON AUTOMATION S.R.O
16.24.1 COMPANY SNAPSHOT
16.24.2 PRODUCT PORTFOLIO
16.24.3 RECENT DEVELOPMENTS
16.25 VERSA NETWORKS
16.25.1 COMPANY SNAPSHOT
16.25.2 PRODUCT PORTFOLIO
16.25.3 RECENT DEVELOPMENTS
16.26 WIPRO LIMITED
16.26.1 COMPANY SNAPSHOT
16.26.2 REVENUE ANALYSIS
16.26.3 PRODUCT PORTFOLIO
16.26.4 RECENT DEVELOPMENTS
16.27 ZPE SYSTEMS, INC.
16.27.1 COMPANY SNAPSHOT
16.27.2 SOLUTION PORTFOLIO
16.27.3 RECENT DEVELOPMENTS
17 QUESTIONNAIRE
18 RELATED REPORTS
List of Table
TABLE 1 ASIA PACIFIC NETWORK TEST LAB AUTOMATION MARKET, BY COMPONENT, 2020-2029 (USD MILLION)
TABLE 2 ASIA PACIFIC SOFTWARE IN NETWORK TEST LAB AUTOMATION MARKET, BY REGION, 2020-2029, (USD MILLION)
TABLE 3 ASIA PACIFIC SOFTWARE IN NETWORK TEST LAB AUTOMATION MARKET, BY TYPE, 2020-2029 (USD MILLION)
TABLE 4 ASIA PACIFIC HARDWARE IN NETWORK TEST LAB AUTOMATION MARKET, BY REGION, 2020-2029 (USD MILLION)
TABLE 5 ASIA PACIFIC SERVICES IN NETWORK TEST LAB AUTOMATION MARKET, BY REGION, 2020-2029, (USD MILLION)
TABLE 6 ASIA PACIFIC SERVICES IN NETWORK TEST LAB AUTOMATION MARKET, BY TYPE, 2020-2029 (USD MILLION)
TABLE 7 ASIA PACIFIC PROFESSIONAL SERVICE IN NETWORK TEST LAB AUTOMATION MARKET, BY TYPE, 2020-2029 (USD MILLION)
TABLE 8 ASIA PACIFIC NETWORK TEST LAB AUTOMATION MARKET, BY NETWORK TYPE, 2020-2029 (USD MILLION)
TABLE 9 ASIA PACIFIC VIRTUAL NETWORK IN NETWORK TEST LAB AUTOMATION MARKET, BY REGION, 2020-2029 (USD MILLION)
TABLE 10 ASIA PACIFIC HYBRID NETWORK IN NETWORK TEST LAB AUTOMATION MARKET, BY REGION, 2020-2029 (USD MILLION)
TABLE 11 ASIA PACIFIC PHYSICAL NETWORK IN NETWORK TEST LAB AUTOMATION MARKET, BY REGION, 2020-2029 (USD MILLION)
TABLE 12 ASIA PACIFIC NETWORK TEST LAB AUTOMATION MARKET, BY TESTING TYPE, 2020-2029 (USD MILLION)
TABLE 13 ASIA PACIFIC FUNCTIONAL TESTING IN NETWORK TEST LAB AUTOMATION MARKET, BY REGION, 2020-2029 (USD MILLION)
TABLE 14 ASIA PACIFIC REGRESSION TESTING IN NETWORK TEST LAB AUTOMATION MARKET, BY REGION, 2020-2029 (USD MILLION)
TABLE 15 ASIA PACIFIC PERFORMANCE TESTING IN NETWORK TEST LAB AUTOMATION MARKET, BY REGION, 2020-2029 (USD MILLION)
TABLE 16 ASIA PACIFIC NETWORK TEST LAB AUTOMATION MARKET, BY DEPLOYMENT MODE, 2020-2029 (USD MILLION)
TABLE 17 ASIA PACIFIC CLOUD IN NETWORK TEST LAB AUTOMATION MARKET, BY REGION, 2020-2029 (USD MILLION)
TABLE 18 ASIA PACIFIC ON-PREMISE IN NETWORK TEST LAB AUTOMATION MARKET, BY REGION, 2020-2029 (USD MILLION)
TABLE 19 ASIA PACIFIC HYBRID IN NETWORK TEST LAB AUTOMATION MARKET, BY REGION, 2020-2029 (USD MILLION)
TABLE 20 ASIA PACIFIC NETWORK TEST LAB AUTOMATION MARKET, BY END-USER, 2020-2029 (USD MILLION)
TABLE 21 ASIA PACIFIC ENTERPRISE VERTICAL IN NETWORK TEST LAB AUTOMATION MARKET, BY REGION, 2020-2029 (USD MILLION)
TABLE 22 ASIA PACIFIC ENTERPRISE VERTICAL IN NETWORK TEST LAB AUTOMATION MARKET, BY TYPE, 2020-2029 (USD MILLION)
TABLE 23 ASIA PACIFIC SERVICE PROVIDER IN NETWORK TEST LAB AUTOMATION MARKET, BY REGION, 2020-2029 (USD MILLION)
TABLE 24 ASIA PACIFIC NETWORK TEST LAB AUTOMATION MARKET, BY AUTOMATION TYPE, 2020-2029 (USD MILLION)
TABLE 25 ASIA PACIFIC MODULAR AUTOMATION IN NETWORK TEST LAB AUTOMATION MARKET, BY REGION, 2020-2029 (USD MILLION)
TABLE 26 ASIA PACIFIC TOTAL LAB AUTOMATION IN NETWORK TEST LAB AUTOMATION MARKET, BY REGION, 2020-2029 (USD MILLION)
TABLE 27 ASIA PACIFIC NETWORK TEST LAB AUTOMATION MARKET, BY ORGANIZATION SIZE, 2020-2029 (USD MILLION)
TABLE 28 ASIA PACIFIC LARGE ENTERPRISE IN NETWORK TEST LAB AUTOMATION MARKET, BY REGION, 2020-2029 (USD MILLION)
TABLE 29 ASIA PACIFIC SMALL AND MEDIUM ENTERPRISE IN NETWORK TEST LAB AUTOMATION MARKET, BY REGION, 2020-2029 (USD MILLION)
TABLE 30 ASIA-PACIFIC NETWORK TEST LAB AUTOMATION MARKET, BY COUNTRY, 2020-2029 (USD MILLION)
TABLE 31 ASIA-PACIFIC NETWORK TEST LAB AUTOMATION MARKET, BY COMPONENT, 2020-2029 (USD MILLION)
TABLE 32 ASIA-PACIFIC SOFTWARE IN NETWORK TEST LAB AUTOMATION MARKET, BY TYPE, 2020-2029 (USD MILLION)
TABLE 33 ASIA-PACIFIC SERVICES IN NETWORK TEST LAB AUTOMATION MARKET, BY TYPE, 2020-2029 (USD MILLION)
TABLE 34 ASIA-PACIFIC PROFESSIONAL SERVICE IN NETWORK TEST LAB AUTOMATION MARKET, BY TYPE, 2020-2029 (USD MILLION)
TABLE 35 ASIA-PACIFIC NETWORK TEST LAB AUTOMATION MARKET, BY NETWORK TYPE, 2020-2029 (USD MILLION)
TABLE 36 ASIA-PACIFIC NETWORK TEST LAB AUTOMATION MARKET, BY TESTING TYPE, 2020-2029 (USD MILLION)
TABLE 37 ASIA-PACIFIC NETWORK TEST LAB AUTOMATION MARKET, BY DEPLOYMENT MODE, 2020-2029 (USD MILLION)
TABLE 38 ASIA-PACIFIC NETWORK TEST LAB AUTOMATION MARKET, BY END-USER, 2020-2029 (USD MILLION)
TABLE 39 ASIA-PACIFIC ENTERPRISE VERTICAL IN NETWORK TEST LAB AUTOMATION MARKET, BY TYPE, 2020-2029 (USD MILLION)
TABLE 40 ASIA-PACIFIC NETWORK TEST LAB AUTOMATION MARKET, BY ORGANIZATION SIZE, 2020-2029 (USD MILLION)
TABLE 41 ASIA-PACIFIC NETWORK TEST LAB AUTOMATION MARKET, BY AUTOMATION TYPE, 2020-2029 (USD MILLION)
TABLE 42 CHINA NETWORK TEST LAB AUTOMATION MARKET, BY COMPONENT, 2020-2029 (USD MILLION)
TABLE 43 CHINA SOFTWARE IN NETWORK TEST LAB AUTOMATION MARKET, BY TYPE, 2020-2029 (USD MILLION)
TABLE 44 CHINA SERVICES IN NETWORK TEST LAB AUTOMATION MARKET, BY TYPE, 2020-2029 (USD MILLION)
TABLE 45 CHINA PROFESSIONAL SERVICE IN NETWORK TEST LAB AUTOMATION MARKET, BY TYPE, 2020-2029 (USD MILLION)
TABLE 46 CHINA NETWORK TEST LAB AUTOMATION MARKET, BY NETWORK TYPE, 2020-2029 (USD MILLION)
TABLE 47 CHINA NETWORK TEST LAB AUTOMATION MARKET, BY TESTING TYPE, 2020-2029 (USD MILLION)
TABLE 48 CHINA NETWORK TEST LAB AUTOMATION MARKET, BY DEPLOYMENT MODE, 2020-2029 (USD MILLION)
TABLE 49 CHINA NETWORK TEST LAB AUTOMATION MARKET, BY END-USER, 2020-2029 (USD MILLION)
TABLE 50 CHINA ENTERPRISE VERTICAL IN NETWORK TEST LAB AUTOMATION MARKET, BY TYPE, 2020-2029 (USD MILLION)
TABLE 51 CHINA NETWORK TEST LAB AUTOMATION MARKET, BY ORGANIZATION SIZE, 2020-2029 (USD MILLION)
TABLE 52 CHINA NETWORK TEST LAB AUTOMATION MARKET, BY AUTOMATION TYPE, 2020-2029 (USD MILLION)
TABLE 53 JAPAN NETWORK TEST LAB AUTOMATION MARKET, BY COMPONENT, 2020-2029 (USD MILLION)
TABLE 54 JAPAN SOFTWARE IN NETWORK TEST LAB AUTOMATION MARKET, BY TYPE, 2020-2029 (USD MILLION)
TABLE 55 JAPAN SERVICES IN NETWORK TEST LAB AUTOMATION MARKET, BY TYPE, 2020-2029 (USD MILLION)
TABLE 56 JAPAN PROFESSIONAL SERVICE IN NETWORK TEST LAB AUTOMATION MARKET, BY TYPE, 2020-2029 (USD MILLION)
TABLE 57 JAPAN NETWORK TEST LAB AUTOMATION MARKET, BY NETWORK TYPE, 2020-2029 (USD MILLION)
TABLE 58 JAPAN NETWORK TEST LAB AUTOMATION MARKET, BY TESTING TYPE, 2020-2029 (USD MILLION)
TABLE 59 JAPAN NETWORK TEST LAB AUTOMATION MARKET, BY DEPLOYMENT MODE, 2020-2029 (USD MILLION)
TABLE 60 JAPAN NETWORK TEST LAB AUTOMATION MARKET, BY END-USER, 2020-2029 (USD MILLION)
TABLE 61 JAPAN ENTERPRISE VERTICAL IN NETWORK TEST LAB AUTOMATION MARKET, BY TYPE, 2020-2029 (USD MILLION)
TABLE 62 JAPAN NETWORK TEST LAB AUTOMATION MARKET, BY ORGANIZATION SIZE, 2020-2029 (USD MILLION)
TABLE 63 JAPAN NETWORK TEST LAB AUTOMATION MARKET, BY AUTOMATION TYPE, 2020-2029 (USD MILLION)
TABLE 64 SOUTH KOREA NETWORK TEST LAB AUTOMATION MARKET, BY COMPONENT, 2020-2029 (USD MILLION)
TABLE 65 SOUTH KOREA SOFTWARE IN NETWORK TEST LAB AUTOMATION MARKET, BY TYPE, 2020-2029 (USD MILLION)
TABLE 66 SOUTH KOREA SERVICES IN NETWORK TEST LAB AUTOMATION MARKET, BY TYPE, 2020-2029 (USD MILLION)
TABLE 67 SOUTH KOREA PROFESSIONAL SERVICE IN NETWORK TEST LAB AUTOMATION MARKET, BY TYPE, 2020-2029 (USD MILLION)
TABLE 68 SOUTH KOREA NETWORK TEST LAB AUTOMATION MARKET, BY NETWORK TYPE, 2020-2029 (USD MILLION)
TABLE 69 SOUTH KOREA NETWORK TEST LAB AUTOMATION MARKET, BY TESTING TYPE, 2020-2029 (USD MILLION)
TABLE 70 SOUTH KOREA NETWORK TEST LAB AUTOMATION MARKET, BY DEPLOYMENT MODE, 2020-2029 (USD MILLION)
TABLE 71 SOUTH KOREA NETWORK TEST LAB AUTOMATION MARKET, BY END-USER, 2020-2029 (USD MILLION)
TABLE 72 SOUTH KOREA ENTERPRISE VERTICAL IN NETWORK TEST LAB AUTOMATION MARKET, BY TYPE, 2020-2029 (USD MILLION)
TABLE 73 SOUTH KOREA NETWORK TEST LAB AUTOMATION MARKET, BY ORGANIZATION SIZE, 2020-2029 (USD MILLION)
TABLE 74 SOUTH KOREA NETWORK TEST LAB AUTOMATION MARKET, BY AUTOMATION TYPE, 2020-2029 (USD MILLION)
TABLE 75 INDIA NETWORK TEST LAB AUTOMATION MARKET, BY COMPONENT, 2020-2029 (USD MILLION)
TABLE 76 INDIA SOFTWARE IN NETWORK TEST LAB AUTOMATION MARKET, BY TYPE, 2020-2029 (USD MILLION)
TABLE 77 INDIA SERVICES IN NETWORK TEST LAB AUTOMATION MARKET, BY TYPE, 2020-2029 (USD MILLION)
TABLE 78 INDIA PROFESSIONAL SERVICE IN NETWORK TEST LAB AUTOMATION MARKET, BY TYPE, 2020-2029 (USD MILLION)
TABLE 79 INDIA NETWORK TEST LAB AUTOMATION MARKET, BY NETWORK TYPE, 2020-2029 (USD MILLION)
TABLE 80 INDIA NETWORK TEST LAB AUTOMATION MARKET, BY TESTING TYPE, 2020-2029 (USD MILLION)
TABLE 81 INDIA NETWORK TEST LAB AUTOMATION MARKET, BY DEPLOYMENT MODE, 2020-2029 (USD MILLION)
TABLE 82 INDIA NETWORK TEST LAB AUTOMATION MARKET, BY END-USER, 2020-2029 (USD MILLION)
TABLE 83 INDIA ENTERPRISE VERTICAL IN NETWORK TEST LAB AUTOMATION MARKET, BY TYPE, 2020-2029 (USD MILLION)
TABLE 84 INDIA NETWORK TEST LAB AUTOMATION MARKET, BY ORGANIZATION SIZE, 2020-2029 (USD MILLION)
TABLE 85 INDIA NETWORK TEST LAB AUTOMATION MARKET, BY AUTOMATION TYPE, 2020-2029 (USD MILLION)
TABLE 86 AUSTRALIA NETWORK TEST LAB AUTOMATION MARKET, BY COMPONENT, 2020-2029 (USD MILLION)
TABLE 87 AUSTRALIA SOFTWARE IN NETWORK TEST LAB AUTOMATION MARKET, BY TYPE, 2020-2029 (USD MILLION)
TABLE 88 AUSTRALIA SERVICES IN NETWORK TEST LAB AUTOMATION MARKET, BY TYPE, 2020-2029 (USD MILLION)
TABLE 89 AUSTRALIA PROFESSIONAL SERVICE IN NETWORK TEST LAB AUTOMATION MARKET, BY TYPE, 2020-2029 (USD MILLION)
TABLE 90 AUSTRALIA NETWORK TEST LAB AUTOMATION MARKET, BY NETWORK TYPE, 2020-2029 (USD MILLION)
TABLE 91 AUSTRALIA NETWORK TEST LAB AUTOMATION MARKET, BY TESTING TYPE, 2020-2029 (USD MILLION)
TABLE 92 AUSTRALIA NETWORK TEST LAB AUTOMATION MARKET, BY DEPLOYMENT MODE, 2020-2029 (USD MILLION)
TABLE 93 AUSTRALIA NETWORK TEST LAB AUTOMATION MARKET, BY END-USER, 2020-2029 (USD MILLION)
TABLE 94 AUSTRALIA ENTERPRISE VERTICAL IN NETWORK TEST LAB AUTOMATION MARKET, BY TYPE, 2020-2029 (USD MILLION)
TABLE 95 AUSTRALIA NETWORK TEST LAB AUTOMATION MARKET, BY ORGANIZATION SIZE, 2020-2029 (USD MILLION)
TABLE 96 AUSTRALIA NETWORK TEST LAB AUTOMATION MARKET, BY AUTOMATION TYPE, 2020-2029 (USD MILLION)
TABLE 97 SINGAPORE NETWORK TEST LAB AUTOMATION MARKET, BY COMPONENT, 2020-2029 (USD MILLION)
TABLE 98 SINGAPORE SOFTWARE IN NETWORK TEST LAB AUTOMATION MARKET, BY TYPE, 2020-2029 (USD MILLION)
TABLE 99 SINGAPORE SERVICES IN NETWORK TEST LAB AUTOMATION MARKET, BY TYPE, 2020-2029 (USD MILLION)
TABLE 100 SINGAPORE PROFESSIONAL SERVICE IN NETWORK TEST LAB AUTOMATION MARKET, BY TYPE, 2020-2029 (USD MILLION)
TABLE 101 SINGAPORE NETWORK TEST LAB AUTOMATION MARKET, BY NETWORK TYPE, 2020-2029 (USD MILLION)
TABLE 102 SINGAPORE NETWORK TEST LAB AUTOMATION MARKET, BY TESTING TYPE, 2020-2029 (USD MILLION)
TABLE 103 SINGAPORE NETWORK TEST LAB AUTOMATION MARKET, BY DEPLOYMENT MODE, 2020-2029 (USD MILLION)
TABLE 104 SINGAPORE NETWORK TEST LAB AUTOMATION MARKET, BY END-USER, 2020-2029 (USD MILLION)
TABLE 105 SINGAPORE ENTERPRISE VERTICAL IN NETWORK TEST LAB AUTOMATION MARKET, BY TYPE, 2020-2029 (USD MILLION)
TABLE 106 SINGAPORE NETWORK TEST LAB AUTOMATION MARKET, BY ORGANIZATION SIZE, 2020-2029 (USD MILLION)
TABLE 107 SINGAPORE NETWORK TEST LAB AUTOMATION MARKET, BY AUTOMATION TYPE, 2020-2029 (USD MILLION)
TABLE 108 INDONESIA NETWORK TEST LAB AUTOMATION MARKET, BY COMPONENT, 2020-2029 (USD MILLION)
TABLE 109 INDONESIA SOFTWARE IN NETWORK TEST LAB AUTOMATION MARKET, BY TYPE, 2020-2029 (USD MILLION)
TABLE 110 INDONESIA SERVICES IN NETWORK TEST LAB AUTOMATION MARKET, BY TYPE, 2020-2029 (USD MILLION)
TABLE 111 INDONESIA PROFESSIONAL SERVICE IN NETWORK TEST LAB AUTOMATION MARKET, BY TYPE, 2020-2029 (USD MILLION)
TABLE 112 INDONESIA NETWORK TEST LAB AUTOMATION MARKET, BY NETWORK TYPE, 2020-2029 (USD MILLION)
TABLE 113 INDONESIA NETWORK TEST LAB AUTOMATION MARKET, BY TESTING TYPE, 2020-2029 (USD MILLION)
TABLE 114 INDONESIA NETWORK TEST LAB AUTOMATION MARKET, BY DEPLOYMENT MODE, 2020-2029 (USD MILLION)
TABLE 115 INDONESIA NETWORK TEST LAB AUTOMATION MARKET, BY END-USER, 2020-2029 (USD MILLION)
TABLE 116 INDONESIA ENTERPRISE VERTICAL IN NETWORK TEST LAB AUTOMATION MARKET, BY TYPE, 2020-2029 (USD MILLION)
TABLE 117 INDONESIA NETWORK TEST LAB AUTOMATION MARKET, BY ORGANIZATION SIZE, 2020-2029 (USD MILLION)
TABLE 118 INDONESIA NETWORK TEST LAB AUTOMATION MARKET, BY AUTOMATION TYPE, 2020-2029 (USD MILLION)
TABLE 119 MALAYSIA NETWORK TEST LAB AUTOMATION MARKET, BY COMPONENT, 2020-2029 (USD MILLION)
TABLE 120 MALAYSIA SOFTWARE IN NETWORK TEST LAB AUTOMATION MARKET, BY TYPE, 2020-2029 (USD MILLION)
TABLE 121 MALAYSIA SERVICES IN NETWORK TEST LAB AUTOMATION MARKET, BY TYPE, 2020-2029 (USD MILLION)
TABLE 122 MALAYSIA PROFESSIONAL SERVICE IN NETWORK TEST LAB AUTOMATION MARKET, BY TYPE, 2020-2029 (USD MILLION)
TABLE 123 MALAYSIA NETWORK TEST LAB AUTOMATION MARKET, BY NETWORK TYPE, 2020-2029 (USD MILLION)
TABLE 124 MALAYSIA NETWORK TEST LAB AUTOMATION MARKET, BY TESTING TYPE, 2020-2029 (USD MILLION)
TABLE 125 MALAYSIA NETWORK TEST LAB AUTOMATION MARKET, BY DEPLOYMENT MODE, 2020-2029 (USD MILLION)
TABLE 126 MALAYSIA NETWORK TEST LAB AUTOMATION MARKET, BY END-USER, 2020-2029 (USD MILLION)
TABLE 127 MALAYSIA ENTERPRISE VERTICAL IN NETWORK TEST LAB AUTOMATION MARKET, BY TYPE, 2020-2029 (USD MILLION)
TABLE 128 MALAYSIA NETWORK TEST LAB AUTOMATION MARKET, BY ORGANIZATION SIZE, 2020-2029 (USD MILLION)
TABLE 129 MALAYSIA NETWORK TEST LAB AUTOMATION MARKET, BY AUTOMATION TYPE, 2020-2029 (USD MILLION)
TABLE 130 THAILAND NETWORK TEST LAB AUTOMATION MARKET, BY COMPONENT, 2020-2029 (USD MILLION)
TABLE 131 THAILAND SOFTWARE IN NETWORK TEST LAB AUTOMATION MARKET, BY TYPE, 2020-2029 (USD MILLION)
TABLE 132 THAILAND SERVICES IN NETWORK TEST LAB AUTOMATION MARKET, BY TYPE, 2020-2029 (USD MILLION)
TABLE 133 THAILAND PROFESSIONAL SERVICE IN NETWORK TEST LAB AUTOMATION MARKET, BY TYPE, 2020-2029 (USD MILLION)
TABLE 134 THAILAND NETWORK TEST LAB AUTOMATION MARKET, BY NETWORK TYPE, 2020-2029 (USD MILLION)
TABLE 135 THAILAND NETWORK TEST LAB AUTOMATION MARKET, BY TESTING TYPE, 2020-2029 (USD MILLION)
TABLE 136 THAILAND NETWORK TEST LAB AUTOMATION MARKET, BY DEPLOYMENT MODE, 2020-2029 (USD MILLION)
TABLE 137 THAILAND NETWORK TEST LAB AUTOMATION MARKET, BY END-USER, 2020-2029 (USD MILLION)
TABLE 138 THAILAND ENTERPRISE VERTICAL IN NETWORK TEST LAB AUTOMATION MARKET, BY TYPE, 2020-2029 (USD MILLION)
TABLE 139 THAILAND NETWORK TEST LAB AUTOMATION MARKET, BY ORGANIZATION SIZE, 2020-2029 (USD MILLION)
TABLE 140 THAILAND NETWORK TEST LAB AUTOMATION MARKET, BY AUTOMATION TYPE, 2020-2029 (USD MILLION)
TABLE 141 PHILIPPINES NETWORK TEST LAB AUTOMATION MARKET, BY COMPONENT, 2020-2029 (USD MILLION)
TABLE 142 PHILIPPINES SOFTWARE IN NETWORK TEST LAB AUTOMATION MARKET, BY TYPE, 2020-2029 (USD MILLION)
TABLE 143 PHILIPPINES SERVICES IN NETWORK TEST LAB AUTOMATION MARKET, BY TYPE, 2020-2029 (USD MILLION)
TABLE 144 PHILIPPINES PROFESSIONAL SERVICE IN NETWORK TEST LAB AUTOMATION MARKET, BY TYPE, 2020-2029 (USD MILLION)
TABLE 145 PHILIPPINES NETWORK TEST LAB AUTOMATION MARKET, BY NETWORK TYPE, 2020-2029 (USD MILLION)
TABLE 146 PHILIPPINES NETWORK TEST LAB AUTOMATION MARKET, BY TESTING TYPE, 2020-2029 (USD MILLION)
TABLE 147 PHILIPPINES NETWORK TEST LAB AUTOMATION MARKET, BY DEPLOYMENT MODE, 2020-2029 (USD MILLION)
TABLE 148 PHILIPPINES NETWORK TEST LAB AUTOMATION MARKET, BY END-USER, 2020-2029 (USD MILLION)
TABLE 149 PHILIPPINES ENTERPRISE VERTICAL IN NETWORK TEST LAB AUTOMATION MARKET, BY TYPE, 2020-2029 (USD MILLION)
TABLE 150 PHILIPPINES NETWORK TEST LAB AUTOMATION MARKET, BY ORGANIZATION SIZE, 2020-2029 (USD MILLION)
TABLE 151 PHILIPPINES NETWORK TEST LAB AUTOMATION MARKET, BY AUTOMATION TYPE, 2020-2029 (USD MILLION)
TABLE 152 REST OF ASIA-PACIFIC NETWORK TEST LAB AUTOMATION MARKET, BY COMPONENT, 2020-2029 (USD MILLION)
List of Figure
FIGURE 1 ASIA PACIFIC NETWORK TEST LAB AUTOMATION MARKET: SEGMENTATION
FIGURE 2 ASIA PACIFIC NETWORK TEST LAB AUTOMATION MARKET : DATA TRIANGULATION
FIGURE 3 ASIA PACIFIC NETWORK TEST LAB AUTOMATION MARKET: DROC ANALYSIS
FIGURE 4 ASIA PACIFIC NETWORK TEST LAB AUTOMATION MARKET:REGIONAL MARKET ANALYSIS
FIGURE 5 ASIA PACIFIC NETWORK TEST LAB AUTOMATION MARKET: COMPANY RESEARCH ANALYSIS
FIGURE 6 ASIA PACIFIC NETWORK TEST LAB AUTOMATION MARKET: INTERVIEW DEMOGRAPHICS
FIGURE 7 ASIA PACIFIC NETWORK TEST LAB AUTOMATION MARKET: DBMR MARKET POSITION GRID
FIGURE 8 ASIA PACIFIC NETWORK TEST LAB AUTOMATION MARKET: VENDOR SHARE ANALYSIS
FIGURE 9 ASIA PACIFIC NETWORK TEST LAB AUTOMATION MARKET: MARKET END-USER COVERAGE GRID
FIGURE 10 ASIA PACIFIC NETWORK TEST LAB AUTOMATION MARKET: SEGMENTATION
FIGURE 11 INTEGRATION OF LAB AUTOMATION ACROSS THE REGION MAGNET IS EXPECTED TO BE KEY DRIVERS THE MARKET FOR ASIA PACIFIC NETWORK TEST LAB AUTOMATION MARKET IN THE FORECAST PERIOD OF 2021 TO 2029
FIGURE 12 SOFTWARE SEGMENT IS EXPECTED TO ACCOUNT FOR THE LARGEST SHARE OF ASIA PACIFIC NETWORK TEST LAB AUTOMATION MARKET IN 2022 TO 2029
FIGURE 13 DRIVERS, RESTRAINTS, OPPORTUNITIES & CHALLENGES OF ASIA PACIFIC NETWORK TEST LAB AUTOMATION MARKET
FIGURE 14 TYPE OF CLOUD COMPUTING SERVICE, BY SERVICE MODEL, 2021 (EUROPE)
FIGURE 15 ASIA PACIFIC NETWORK TEST LAB AUTOMATION MARKET: BY COMPONENT, 2021
FIGURE 16 ASIA PACIFIC NETWORK TEST LAB AUTOMATION MARKET: BY NETWORK TYPE, 2021
FIGURE 17 ASIA PACIFIC NETWORK TEST LAB AUTOMATION MARKET: BY TESTING TYPE, 2021
FIGURE 18 ASIA PACIFIC NETWORK TEST LAB AUTOMATION MARKET: BY DEPLOYMENT MODE, 2021
FIGURE 19 ASIA PACIFIC NETWORK TEST LAB AUTOMATION MARKET: BY END-USER, 2021
FIGURE 20 ASIA PACIFIC NETWORK TEST LAB AUTOMATION MARKET: BY AUTOMATION TYPE, 2021
FIGURE 21 ASIA PACIFIC NETWORK TEST LAB AUTOMATION MARKET: BY ORGANIZATION SIZE, 2021
FIGURE 22 ASIA-PACIFIC NETWORK TEST LAB AUTOMATION MARKET: SNAPSHOT (2021)
FIGURE 23 ASIA-PACIFIC NETWORK TEST LAB AUTOMATION MARKET: BY COUNTRY (2021)
FIGURE 24 ASIA-PACIFIC NETWORK TEST LAB AUTOMATION MARKET: BY COUNTRY (2022 & 2029)
FIGURE 25 ASIA-PACIFIC NETWORK TEST LAB AUTOMATION MARKET: BY COUNTRY (2021 & 2029)
FIGURE 26 ASIA-PACIFIC NETWORK TEST LAB AUTOMATION MARKET: BY COMPONENT (2022-2029)
FIGURE 27 ASIA PACIFIC NETWORK TEST LAB AUTOMATION MARKET: COMPANY SHARE 2021 (%)
Data collection and base year analysis are done using data collection modules with large sample sizes. The stage includes obtaining market information or related data through various sources and strategies. It includes examining and planning all the data acquired from the past in advance. It likewise envelops the examination of information inconsistencies seen across different information sources. The market data is analysed and estimated using market statistical and coherent models. Also, market share analysis and key trend analysis are the major success factors in the market report. To know more, please request an analyst call or drop down your inquiry.
The key research methodology used by DBMR research team is data triangulation which involves data mining, analysis of the impact of data variables on the market and primary (industry expert) validation. Data models include Vendor Positioning Grid, Market Time Line Analysis, Market Overview and Guide, Company Positioning Grid, Patent Analysis, Pricing Analysis, Company Market Share Analysis, Standards of Measurement, Global versus Regional and Vendor Share Analysis. To know more about the research methodology, drop in an inquiry to speak to our industry experts.
Data Bridge Market Research is a leader in advanced formative research. We take pride in servicing our existing and new customers with data and analysis that match and suits their goal. The report can be customized to include price trend analysis of target brands understanding the market for additional countries (ask for the list of countries), clinical trial results data, literature review, refurbished market and product base analysis. Market analysis of target competitors can be analyzed from technology-based analysis to market portfolio strategies. We can add as many competitors that you require data about in the format and data style you are looking for. Our team of analysts can also provide you data in crude raw excel files pivot tables (Fact book) or can assist you in creating presentations from the data sets available in the report.


