
Market Analysis and Insights
Pterygium is a common ocular surface lesion that begins in the limbal conjunctiva within the palpebral fissure and progresses to the cornea. It is named after the Greek word pterygos, which means "wing". The lesion occurs more frequently at the nasal limbus than the temporal with a characteristic wing-like appearance. UV exposure is strongly linked to the occurrence of pterygia. Individuals having a history of elevated UV exposure and those living closer to the equator have a higher incidence (outdoor work). According to certain research, males have a somewhat higher incidence than females, which could be due to a higher rate of UV exposure.
It can cause redness, inflammation, and a change in the look of the eye; it can create astigmatism, which can cause blurry vision; and it can cause a whitish or pinkish growth covering the front of the eye. It could affect one or both eyes.
Pterygium is diagnosed using a microscope to examine the front components of the eye during a full eye examination and based on the appearance of tissue growth on the cornea from the white area of the eye.
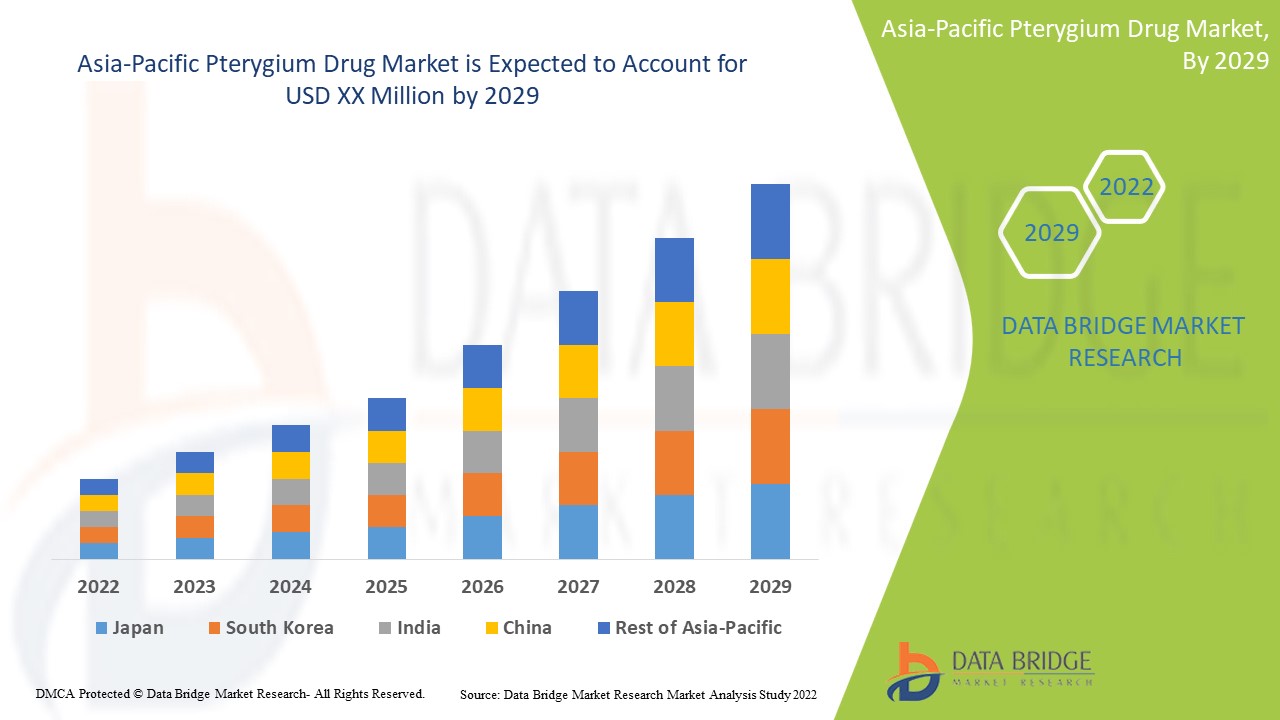
Data Bridge Market Research analyses that the global Asia-Pacific pterygium drug market will grow at a CAGR of 6.9% during the forecast period of 2022 to 2029.
|
Report Metric |
Details |
|
Forecast Period |
2022 to 2029 |
|
Base Year |
2021 |
|
Historic Years |
2020 (Customisable to 2019-2014) |
|
Quantitative Units |
Revenue in USD Million, Pricing in USD |
|
Segments Covered |
Disease Type (Progressive Pterygium and Atrophic Pterygium), Stages (Stage 2, Stage 3, Stage 1, Stage 4), Treatment (Artificial Tears/Topical Lubricants and Steroid Eye Drops.), Formulation (Eye Drops, Eye Ointments, Others), Mode of Purchase (Prescription and Over the Counter (OTC)), Population Type (Geriatric and Adults), End-User (Hospitals, Specialty Clinics, Home Healthcare, Others), Distribution Channel (Retail Pharmacies, Hospital Pharmacies, Online Pharmacies, Others) |
|
Countries Covered |
China, Japan, South Korea, India, Australia, Singapore, Thailand, Malaysia, Indonesia, Philippines, Vietnam, Rest of the Asia-Pacific |
|
Market Players Covered |
Johnson & Johnson Services, Inc. (U.S.), Novartis AG (Switzerland), Akorn Operating Company LLC (U.S.), Bausch & Lomb Incorporated (Canada), AbbVie Inc. (U.S.), Prestige Consumer Healthcare Inc. (U.S.), Spectra Vision Care (India), Théa Laboratories (France), Wellona Pharma (India), SAGER PHARMA (Hungary), Maya Biotech Private Limited (India), EYERIS VISIONCARE Pvt. Ltd. (India), Bayer AG (Germany), Zydus Group, Amneal Pharmaceuticals LLC (India), OASIS Medical (U.S.), Alcon (Switzerland), and Santen Pharmaceutical Co., Ltd. (Japan) |
Market Definition
Pterygium is a common ocular surface lesion that begins in the limbal conjunctiva within the palpebral fissure and progresses to the cornea. It is named after the Greek word pterygos, which means "wing". The lesion occurs more frequently at the nasal limbus than the temporal with a characteristic wing-like appearance. UV exposure is strongly linked to the occurrence of pterygia. Individuals having a history of elevated UV exposure and those living closer to the equator have a higher incidence (outdoor work). According to certain research, males have a somewhat higher incidence than females, which could simply be due to a higher rate of UV exposure.
Pterygium is diagnosed using a microscope to examine the front components of the eye during a full eye examination and based on the appearance of tissue growth on the cornea from the white area of the eye.
Asia-Pacific Pterygium Drug Market Dynamics
This section deals with understanding the market drivers, advantages, opportunities, restraints, and challenges. All of this is discussed in detail below:
Drivers
- The rise in incidences and prevalence of ophthalmic disorders
According to data published in the National Library of Medicine (National Centre for Biotechnology Information) in 2021, the prevalence rates vary in different places. It is most abundant in Cameron's "pterygium belt," which runs between 37° north and south of the equator.
The most common causes of pterygium include long-term exposure to ultraviolet (UV) light from the sun (most common cause) and eye irritation caused by hot, dry weather, wind, and dust. The affirmative factors state that this is the major driver for the global pterygium drugs market.
- The rise in the geriatric population
With the growing geriatric population across the globe, the prevalence of ophthalmic diseases with severe ocular pain is also growing. According to a data provided published in "Global Prevalence of Blindness and Distance and Near Vision Impairment in 2020: progress towards the Vision 2020 targets and what the future holds" by "The Association for Research in Vision and Ophthalmology" (ARVO) estimated 41.9 million people were blind.
With the growing population, the pressure on the healthcare system is increasing. The demand for care and services is rising to treat the problem of ophthalmic disorder, including pterygium. Therefore, the increasing geriatric population is a great opportunity for the Asia-Pacific pterygium drug market.
Opportunity
-
Programs and initiatives to reduce the burden of eye diseases
The International agency to prevent blindness has launched several programs and initiatives with well-reputed NGOs and corporates to spread awareness and reduce the burden of eye diseases.
For instance,
-
International Agency endorses our Children's Vision and an initiative co-founded by the Brien Holden Vision Institute and the Vision For Life fund (created by Essilor) for the Prevention of Blindness (IAPB)
Restraint/Challenge
The growing prevalence of various ophthalmic disorders has also increased the necessity for timely treatments. However, the treatments and proper medication for ophthalmology disorders are not very cheap. Recent studies show that the price of topical steroids price is increasing in the past few years. Even though some topical ophthalmic steroids like prednisolone are mildly cheap, other advanced medications and eye drops are still expensive.
Asia-Pacific pterygium drug market report provides details of new recent developments, trade regulations, import-export analysis, production analysis, value chain optimization, market share, the impact of domestic and localized market players, analyses opportunities in terms of emerging revenue pockets, changes in market regulations, strategic market growth analysis, market size, category market growths, application niches and dominance, product approvals, product launches, geographic expansions, technological innovations in the market. To gain more info on the pterygium drug market, contact Data Bridge Market Research for an Analyst Brief. Our team will help you make an informed market decision to achieve market growth.
Patient Epidemiology Analysis
The prevalence of ophthalmic disorders keeps showing a surge in growth due to the rise in chemical industries and pollution worldwide. Chemical burns and flash burns cause significant and severe ocular pain due to irritations over the eye surface.
According to data published in the National Library of Medicine (National Centre for Biotechnology Information) in 2021, the prevalence rates vary in different places. It is most abundant in Cameron's "pterygium belt," which runs between 37° north and south of the equator. Pterygium prevalence has been reported to range from 0.3 to 29% worldwide.
The Asia-Pacific pterygium drug market also provides detailed market analysis for patient analysis, prognosis, and cures. Prevalence, incidence, mortality, and adherence are some data variables available in the report. Direct or indirect impact analysis of epidemiology to the market growth are analysed to create a more robust and cohot multivariate statistical model for forecasting the market in the growth period.
Post COVID-19 Impact on Asia-Pacific Pterygium Drug Market
COVID-19 has negatively affected the market. Lockdowns and isolations during pandemics complicate disease management and medication adherence. The lack of access to healthcare facilities for routine treatment and medication administration will further impact the market.
Recent Development
- In February 2021, Allergan (Subsidiary of AbbVie Inc.) launched REFRESH® DIGITAL, a new lubricant eye drop formulated to relieve dryness and irritation that may occur from prolonged screen time. A scientific advancement, REFRESH® DIGITAL features proprietary HydroCell™ technology that supports all three tear film layers to keep eyes hydrated. The launch helped the company expand its eye care product portfolio and earn lucrative revenue growth across several markets.
Asia-Pacific pterygium drug market Scope
Asia-Pacific pterygium drug market is categorized into eight notable segments based on disease type, stages, treatment, formulation, mode of purchase, population type, end-user, and distribution channel. The growth amongst these segments will help you analyse meagre growth segments in the industries and provide the users with a valuable market overview and market insights to help them make strategic decisions for identifying core market applications.
Disease Type
- Progressive Pterygium
- Atrophic Pterygium
Based on disease, the Asia-Pacific pterygium drug market is segmented into progressive pterygium and atrophic pterygium.
Stages
- Stage 1
- Stage 2
- Stage 3
- Stage 4
Based on stages, the Asia-Pacific pterygium drug market is segmented into stage 1, stage 2, stage 3, and stage 4.
Treatment
- Artificial Tears/Topical Lubricants
- Steroid Eye Drops
Based on treatment, the Asia-Pacific pterygium drug market is segmented into artificial tears/topical lubricants, and steroid eye drops.
Formulation
- Eye Drops
- Eye Ointments
- Others
Based on formulation, the Asia-Pacific pterygium drug market is segmented into eye drops, ointments, and others.
Mode of Purchase
- Prescription
- Over the Counter (OTC)
Based on mode of purchase, the Asia-Pacific pterygium drug market is segmented into prescription and over-the-counter (OTC).
Population Type
- Geriatric
- Adults
Based on population type, the Asia-Pacific pterygium drug market is segmented into geriatric and adults.
End-User
- Hospitals
- Specialty Clinics
- Home Healthcare
- Others
Based on end-user, the Asia-Pacific pterygium drug market is segmented into hospitals, specialty clinics, home healthcare, and others.
Distribution Channel
- Retail Pharmacies
- Hospital Pharmacies
- Online Pharmacies
- Others
Based on distribution channels, the Asia-Pacific pterygium drug market is segmented into retail pharmacies, hospital pharmacies, and online pharmacies.
Asia-Pacific Pterygium Drug Market Regional Analysis/Insights
Asia-Pacific pterygium drug market is analysed, and market size insights and trends are provided by country, disease type, stages, treatment, formulation, mode of purchase, population type, end-user, and distribution channel as referenced above.
The countries covered in the Asia-Pacific pterygium drug market report are China, Japan, South Korea, India, Australia, Singapore, Thailand, Malaysia, Indonesia, Philippines, Vietnam, and Rest of Asia-Pacific.
The Asia-Pacific pterygium drug market is expected to grow due to the increasing prevalence of pterygium in tropical areas and the growing geriatric population. Also, rising initiatives by players to launch new products in the region will further boost the market growth in the forecast period.
Asia-Pacific is expected to dominate the global pterygium drug market in terms of market share and revenue and will continue to flourish its dominance during the forecast period. This is due to the high prevalence of disease in the region.
China is expected to dominate the Asia-Pacific pterygium drug market due to the large patient pool, and people are getting more aware of early diagnosis of the disease.
The country section of the report also provides individual market impacting factors and changes in regulations in the market that impact the current and future trends of the market. Data points, such as new and replacement sales, country demographics, and import-export tariffs, are some of the major pointers used to forecast the market scenario for individual countries. In addition, the presence and availability of global brands and their challenges faced due to high competition from local and domestic brands and the impact of sales channels are considered while providing forecast analysis of the country data.
Competitive Landscape and Asia-Pacific Pterygium Drug Market Share Analysis
Asia-Pacific pterygium drug market competitive landscape provides details of the competitor. Details include company overview, company financials, revenue generated, market potential, investment in research and development, new market initiatives, European presence, production sites and facilities, production capacities, company strengths and weaknesses, product launch, product width and breadth, application dominance. The above data points provided are only related to the companies' focus related to the pterygium drug market.
Some of the major players operating in the Asia-Pacific pterygium drug market are Johnson & Johnson Services, Inc., Novartis AG, Akorn Operating Company LLC, Bausch & Lomb Incorporated, AbbVie Inc., Prestige Consumer Healthcare Inc., Spectra Vision Care, Théa Laboratories, Wellona Pharma, SAGER PHARMA, Maya Biotech Private Limited, EYERIS VISIONCARE Pvt. Ltd., Bayer AG, Zydus Group, Amneal Pharmaceuticals LLC, OASIS Medical, Alcon, and Santen Pharmaceutical Co., Ltd. among others.
Research Methodology
Data collection and base year analysis are done using data collection modules with large sample sizes. The market data is analysed and estimated using market statistical and coherent models. In addition, market share analysis and key trend analysis are the major success factors in the market report. The key research methodology used by the DBMR research team is data triangulation which involves data mining, analysis of the impact of data variables on the market, and primary (industry expert) validation. Apart from this, data models include Vendor Positioning grids, Market Time Line Analysis, Market Overview and Guide, Company Positioning grids, Company Market Share Analysis, Standards of Measurement, Asia-Pacific Vs Regional, and Vendor Share Analysis. Please request an analyst call in case of further inquiry.
SKU-

- Interactive Data Analysis Dashboard
- Company Analysis Dashboard for high growth potential opportunities
- Research Analyst Access for customization & queries
- Competitor Analysis with Interactive dashboard
- Latest News, Updates & Trend analysis
- Harness the Power of Benchmark Analysis for Comprehensive Competitor Tracking
Table of Content
1 INTRODUCTION
1.1 OBJECTIVES OF THE STUDY
1.2 MARKET DEFINITION
1.3 OVERVIEW OF ASIA PACIFIC PTERYGIUM DRUG MARKET
1.4 CURRENCY AND PRICING
1.5 LIMITATIONS
1.6 MARKETS COVERED
2 ASIA PACIFIC PTERYGIUM DRUG MARKET: SEGMENTATION
2.1 MARKETS COVERED
2.2 GEOGRAPHICAL SCOPE
2.3 YEARS CONSIDERED FOR THE STUDY
2.4 DBMR TRIPOD DATA VALIDATION MODEL
2.5 PRIMARY INTERVIEWS WITH KEY OPINION LEADERS
2.6 MULTIVARIATE MODELLING
2.7 CLASS SEGMENT LIFELINE CURVE
2.8 DBMR MARKET POSITION GRID
2.9 VENDOR SHARE ANALYSIS
2.1 MARKET END USER COVERAGE GRID
2.11 SECONDARY SOURCES
3 EXECUTIVE SUMMARY
4 PREMIUM INSIGHTS
4.1 PESTEL'S MODEL
4.2 PORTER'S 5 FORCES
4.3 ASIA PACIFIC PTERYGIUM DRUG MARKET: NUMBER OF SURGERIES
5 EPIDEMIOLOGY
6 PIPELINE ANALYSIS
7 ASIA PACIFIC PTERYGIUM DRUG MARKET: REGULATIONS
7.1 REGULATION IN THE U.S.
7.2 REGULATION IN EUROPE:
7.3 REGULATIONS IN CHINA:
7.4 REGULATIONS IN INDIA:
7.5 RELEVANT ACTS FOR THIS FRAMEWORK:
8 MARKET OVERVIEW
8.1 DRIVERS
8.1.1 RISE IN INCIDENCES AND PREVALENCE OF OPHTHALMIC DISORDERS
8.1.2 RISE IN GERIATRIC POPULATION
8.1.3 INCREASE IN HEALTHCARE AWARENESS TO REDUCE THE RISK OF EYE ILLNESSES
8.2 RESTRAINTS
8.2.1 HIGH COST OF EYE TREATMENT AND MEDICATION
8.2.2 SIDE EFFECTS OF STEROIDS EYE DROPS
8.3 OPPORTUNITIES
8.3.1 PROGRAMS AND INITIATIVES TO REDUCE THE BURDEN OF EYE DISEASES
8.3.2 RISE IN HEALTHCARE EXPENDITURE AND DISPOSABLE INCOME
8.3.3 INCREASE IN RESEARCH AND DEVELOPMENT ACTIVITIES
8.4 CHALLENGES
8.4.1 STRINGENT RULES & REGULATIONS
8.4.2 EXPOSURE TO ULTRAVIOLET RADIATIONS
9 ASIA PACIFIC PTERYGIUM DRUG MARKET, BY DISEASE TYPE
9.1 OVERVIEW
9.2 PROGRESSIVE PTERYGIUM
9.3 ATROPHIC PTERYGIUM
10 ASIA PACIFIC PTERYGIUM DRUG MARKET, BY STAGES
10.1 OVERVIEW
10.2 STAGE 2
10.3 STAGE 3
10.4 STAGE 1
10.5 STAGE 4
11 ASIA PACIFIC PTERYGIUM DRUG MARKET, BY TREATMENT
11.1 OVERVIEW
11.2 ARTIFICIAL TEARS/TOPICAL LUBRICANTS
11.2.1 DEMULCENT
11.2.2 EMOLLIENTS
11.3 STEROID EYE DROPS
11.3.1 KETONE STEROIDS
11.3.1.1 PREDNOSOLONE
11.3.1.2 DEXAMETHASONE
11.3.1.3 FLUROMETHOLONE
11.3.1.4 OTHERS
11.3.2 ESTER STEROID (LOTERPREDNOL)
12 ASIA PACIFIC PTERYGIUM DRUG MARKET, BY FORMULATION
12.1 OVERVIEW
12.2 EYE DROPS
12.2.1 EYE DROPS WITH PRESERVATIVES
12.2.2 PRESERVATIVE-FREE EYE DROPS
12.3 EYE OINTMENTS
12.4 OTHERS
13 ASIA PACIFIC PTERYGIUM DRUG MARKET, BY MODE OF PURCHASE
13.1 OVERVIEW
13.2 PRESCRIPTION
13.3 OVER THE COUNTER (OTC)
14 ASIA PACIFIC PTERYGIUM DRUG MARKET, BY POPULATION TYPE
14.1 OVERVIEW
14.2 GERIATRIC
14.3 ADULTS
15 ASIA PACIFIC PTERYGIUM DRUG MARKET, BY END USER
15.1 OVERVIEW
15.2 HOSPITALS
15.3 SPECIALTY CLINICS
15.4 HOME HEALTHCARE
15.5 OTHERS
16 ASIA PACIFIC PTERYGIUM DRUG MARKET, BY DISTRIBUTION CHANNEL
16.1 OVERVIEW
16.2 RETAIL PHARMACIES
16.3 HOSPITAL PHARMACIES
16.4 ONLINE PHARMACIES
16.5 OTHERS
17 ASIA PACIFIC PTERYGIUM DRUG MARKET, BY REGION
17.1 ASIA-PACIFIC
17.1.1 CHINA
17.1.2 INDIA
17.1.3 JAPAN
17.1.4 INDONESIA
17.1.5 VIETNAM
17.1.6 THAILAND
17.1.7 PHILIPPINES
17.1.8 SOUTH KOREA
17.1.9 AUSTRALIA
17.1.10 MALAYSIA
17.1.11 SINGAPORE
17.1.12 REST OF ASIA-PACIFIC
18 ASIA PACIFIC PTERYGIUM DRUG MARKET: COMPANY LANDSCAPE
18.1 COMPANY SHARE ANALYSIS: ASIA PACIFIC
19 SWOT ANALYSIS
20 COMPANY PROFILES
20.1 ALCON
20.1.1 COMPANY SNAPSHOT
20.1.2 RECENT FINANCIALS
20.1.3 COMPANY SHARE ANALYSIS
20.1.4 PRODUCT PORTFOLIO
20.1.5 RECENT DEVELOPMENTS
20.2 ABBVIE INC.
20.2.1 COMPANY SNAPSHOT
20.2.2 REVENUE ANALYSIS
20.2.3 COMPANY SHARE ANALYSIS
20.2.4 PRODUCT PORTFOLIO
20.2.5 RECENT DEVELOPMENT
20.3 BAUSCH & LOMB INCORPORATED
20.3.1 COMPANY SNAPSHOT
20.3.2 REVENUE ANALYSIS
20.3.3 COMPANY SHARE ANALYSIS
20.3.4 PRODUCT PORTFOLIO
20.3.5 RECENT DEVELOPMENT
20.4 JOHNSON & JOHNSON SERVICES, INC.
20.4.1 COMPANY SNAPSHOT
20.4.2 REVENUE ANALYSIS
20.4.3 COMPANY SHARE ANALYSIS
20.4.4 PRODUCT PORTFOLIO
20.4.5 RECENT DEVELOPMENTS
20.5 BAYER AG
20.5.1 COMPANY SNAPSHOT
20.5.2 REVENUE ANALYSIS
20.5.3 COMPANY SHARE ANALYSIS
20.5.4 PRODUCT PORTFOLIO
20.5.5 RECENT DEVELOPMENTS
20.6 NOVARTIS AG
20.6.1 COMPANY SNAPSHOT
20.6.2 REVENUE ANALYSIS
20.6.3 PRODUCT PORTFOLIO
20.6.4 RECENT DEVELOPMENTS
20.7 SANTEN PHARMACEUTICAL CO., LTD.
20.7.1 COMPANY SNAPSHOT
20.7.2 RECENT FINANCIALS
20.7.3 PRODUCT PORTFOLIO
20.7.4 RECENT DEVELOPMENT
20.8 AKORN OPERATING COMPANY LLC
20.8.1 COMPANY SNAPSHOT
20.8.2 PRODUCT PORTFOLIO
20.8.3 RECENT DEVELOPMENT
20.9 AMNEAL PHARMACEUTICALS LLC.
20.9.1 COMPANY SNAPSHOT
20.9.2 REVENUE ANALYSIS
20.9.3 PRODUCT PORTFOLIO
20.9.4 RECENT DEVELOPMENTS
20.1 EYERIS VISIONCARE PVT. LTD.
20.10.1 COMPANY SNAPSHOT
20.10.2 PRODUCT PORTFOLIO
20.10.3 RECENT DEVELOPMENTS
20.11 MAYA BIOTECH PRIVATE LIMITED
20.11.1 COMPANY SNAPSHOT
20.11.2 PRODUCT PORTFOLIO
20.11.3 RECENT DEVELOPMENTS
20.12 OASIS MEDICAL
20.12.1 COMPANY SNAPSHOT
20.12.2 PRODUCT PORTFOLIO
20.12.3 RECENT DEVELOPMENTS
20.13 PRESTIGE CONSUMER HEALTHCARE INC.
20.13.1 COMPANY SNAPSHOT
20.13.2 REVENUE ANALYSIS
20.13.3 PRODUCT PORTFOLIO
20.13.4 RECENT DEVELOPMENT
20.14 SAGER PHARMA
20.14.1 COMPANY SNAPSHOT
20.14.2 PRODUCT PORTFOLIO
20.14.3 RECENT DEVELOPMENTS
20.15 SIMILASAN CORPORATION
20.15.1 COMPANY SNAPSHOT
20.15.2 PRODUCT PORTFOLIO
20.15.3 RECENT DEVELOPMENTS
20.16 SPECTRA VISION CARE
20.16.1 COMPANY SNAPSHOT
20.16.2 PRODUCT PORTFOLIO
20.16.3 RECENT DEVELOPMENTS
20.17 SYLENTIS
20.17.1 COMPANY SNAPSHOT
20.17.2 PRODUCT PORTFOLIO
20.17.3 RECENT DEVELOPMENT
20.18 THÉA LABORATORIES
20.18.1 COMPANY SNAPSHOT
20.18.2 PRODUCT PORTFOLIO
20.18.3 RECENT DEVELOPMENTS
20.19 WELLONA PHARMA
20.19.1 COMPANY SNAPSHOT
20.19.2 PRODUCT PORTFOLIO
20.19.3 RECENT DEVELOPMENTS
20.2 ZYDUS GROUP
20.20.1 COMPANY SNAPSHOT
20.20.2 REVENUE ANALYSIS
20.20.3 PRODUCT PORTFOLIO
20.20.4 RECENT DEVELOPMENTS
21 QUESTIONNAIRE
22 RELATED REPORTS
List of Table
TABLE 1 ASIA PACIFIC PTERYGIUM DRUG MARKET, PIPELINE ANALYSIS
TABLE 2 ASIA PACIFIC PTERYGIUM DRUG MARKET, BY DISEASE TYPE, 2020-2029 (USD MILLION)
TABLE 3 ASIA PACIFIC PROGRESSIVE PTERYGIUM IN PTERYGIUM DRUG MARKET, BY REGION, 2020-2029 (USD MILLION)
TABLE 4 ASIA PACIFIC ATROPHIC PTERYGIUM IN PTERYGIUM DRUG MARKET, BY REGION, 2020-2029 (USD MILLION)
TABLE 5 ASIA PACIFIC PTERYGIUM DRUG MARKET , BY STAGES, 2020-2029 (USD MILLION)
TABLE 6 ASIA PACIFIC STAGE 2 IN PTERYGIUM DRUG MARKET, BY REGION, 2020-2029 (USD MILLION)
TABLE 7 ASIA PACIFIC STAGE 3 IN PTERYGIUM DRUG MARKET, BY REGION, 2020-2029 (USD MILLION)
TABLE 8 ASIA PACIFIC STAGE 1 IN PTERYGIUM DRUG MARKET, BY REGION, 2020-2029 (USD MILLION)
TABLE 9 ASIA PACIFIC STAGE 4 IN PTERYGIUM DRUG MARKET, BY REGION, 2020-2029 (USD MILLION)
TABLE 10 ASIA PACIFIC PTERYGIUM DRUG MARKET, BY TREATMENT, 2020-2029 (USD MILLION)
TABLE 11 ASIA PACIFIC ARTIFICIAL TEARS/TOPICAL LUBRICANTS IN PTERYGIUM DRUG MARKET, BY REGION, 2020-2029 (USD MILLION)
TABLE 12 ASIA PACIFIC ARTIFICIAL TEARS/TOPICAL LUBRICANTS IN PTERYGIUM DRUG MARKET, BY TYPE, 2020-2029 (USD MILLION)
TABLE 13 ASIA PACIFIC STEROID EYE DROPS IN PTERYGIUM DRUG MARKET, BY REGION, 2020-2029 (USD MILLION)
TABLE 14 ASIA PACIFIC STEROID EYE DROPS IN PTERYGIUM DRUG MARKET, BY TYPE, 2020-2029 (USD MILLION)
TABLE 15 ASIA PACIFIC KETONE STEROIDS IN PTERYGIUM DRUG MARKET, BY TYPE, 2020-2029 (USD MILLION)
TABLE 16 ASIA PACIFIC PTERYGIUM DRUG MARKET, BY FORMULATION, 2020-2029 (USD MILLION)
TABLE 17 ASIA PACIFIC EYE DROPS IN PTERYGIUM DRUG MARKET, BY REGION, 2020-2029 (USD MILLION)
TABLE 18 ASIA PACIFIC EYE DROPS IN PTERYGIUM DRUG MARKET, BY FORMULATION, 2020-2029 (USD MILLION)
TABLE 19 ASIA PACIFIC EYE OINTMENTS IN PTERYGIUM DRUG MARKET, BY REGION, 2020-2029 (USD MILLION)
TABLE 20 ASIA PACIFIC OTHERS IN PTERYGIUM DRUG MARKET, BY REGION, 2020-2029 (USD MILLION)
TABLE 21 ASIA PACIFIC PTERYGIUM DRUG MARKET, BY MODE OF PURCHASE, 2020-2029 (USD MILLION)
TABLE 22 ASIA PACIFIC PRESCRIPTION IN PTERYGIUM DRUG MARKET, BY REGION, 2020-2029 (USD MILLION)
TABLE 23 ASIA PACIFIC OVER THE COUNTER (OTC) IN PTERYGIUM DRUG MARKET, BY REGION, 2020-2029 (USD MILLION)
TABLE 24 ASIA PACIFIC PTERYGIUM DRUG MARKET, BY POPULATION TYPE, 2020-2029 (USD MILLION)
TABLE 25 ASIA PACIFIC GERIATRICS IN PTERYGIUM DRUG MARKET, BY REGION, 2020-2029 (USD MILLION)
TABLE 26 ASIA PACIFIC ADULTS IN PTERYGIUM DRUG MARKET, BY REGION, 2020-2029 (USD MILLION)
TABLE 27 ASIA PACIFIC PTERYGIUM DRUG MARKET, BY END USER, 2020-2029 (USD MILLION)
TABLE 28 ASIA PACIFIC HOSPITALS IN PTERYGIUM DRUG MARKET, BY REGION, 2020-2029 (USD MILLION)
TABLE 29 ASIA PACIFIC SPECIALTY CLINICS IN PTERYGIUM DRUG MARKET, BY REGION, 2020-2029 (USD MILLION)
TABLE 30 ASIA PACIFIC HOME HEALTHCARE IN PTERYGIUM DRUG MARKET, BY REGION, 2020-2029 (USD MILLION)
TABLE 31 ASIA PACIFIC OTHERS IN PTERYGIUM DRUG MARKET, BY REGION, 2020-2029 (USD MILLION)
TABLE 32 ASIA PACIFIC PTERYGIUM DRUG MARKET, BY DISTRIBUTION CHANNEL, 2020-2029 (USD MILLION)
TABLE 33 ASIA PACIFIC RETAIL PHARMACIES IN PTERYGIUM DRUG MARKET, BY REGION, 2020-2029 (USD MILLION)
TABLE 34 ASIA PACIFIC HOSPITAL PHARMACIES IN PTERYGIUM DRUG MARKET, BY REGION, 2020-2029 (USD MILLION)
TABLE 35 ASIA PACIFIC ONLINE PHARMACIES IN PTERYGIUM DRUG MARKET, BY REGION, 2020-2029 (USD MILLION)
TABLE 36 ASIA PACIFIC OTHERS IN PTERYGIUM DRUG MARKET, BY REGION, 2020-2029 (USD MILLION)
TABLE 37 ASIA-PACIFIC PTERYGIUM DRUG MARKET, BY COUNTRY, 2020-2029 (USD MILLION)
TABLE 38 ASIA-PACIFIC PTERYGIUM DRUG MARKET, BY DISEASE TYPE, 2020-2029 (USD MILLION)
TABLE 39 ASIA-PACIFIC PTERYGIUM DRUG MARKET, BY STAGES, 2020-2029 (USD MILLION)
TABLE 40 ASIA-PACIFIC PTERYGIUM DRUG MARKET, BY TREATMENT, 2020-2029 (USD MILLION)
TABLE 41 ASIA-PACIFIC ARTIFICIAL TEARS/TOPICAL LUBRICANTS IN PTERYGIUM DRUG MARKET, BY TYPE, 2020-2029 (USD MILLION)
TABLE 42 ASIA-PACIFIC STEROIDS EYE DROPS IN PTERYGIUM DRUG MARKET, BY TYPE, 2020-2029 (USD MILLION)
TABLE 43 ASIA-PACIFIC KETONE STEROIDS IN PTERYGIUM DRUG MARKET, BY TYPE, 2020-2029 (USD MILLION)
TABLE 44 ASIA-PACIFIC PTERYGIUM DRUG MARKET, BY FORMULATION, 2020-2029 (USD MILLION)
TABLE 45 ASIA-PACIFIC EYE DROPS IN PTERYGIUM DRUG MARKET, BY FORMULATION, 2020-2029 (USD MILLION)
TABLE 46 ASIA-PACIFIC PTERYGIUM DRUG MARKET, BY MODE OF PURCHASE, 2020-2029 (USD MILLION)
TABLE 47 ASIA-PACIFIC PTERYGIUM DRUG MARKET, BY POPULATION TYPE, 2020-2029 (USD MILLION)
TABLE 48 ASIA-PACIFIC PTERYGIUM DRUG MARKET, BY END USER, 2020-2029 (USD MILLION)
TABLE 49 ASIA-PACIFIC PTERYGIUM DRUG MARKET, BY DISTRIBUTION CHANNEL, 2020-2029 (USD MILLION)
TABLE 50 CHINA PTERYGIUM DRUG MARKET, BY DISEASE TYPE, 2020-2029 (USD MILLION)
TABLE 51 CHINA PTERYGIUM DRUG MARKET, BY STAGES, 2020-2029 (USD MILLION)
TABLE 52 CHINA PTERYGIUM DRUG MARKET, BY TREATMENT, 2020-2029 (USD MILLION)
TABLE 53 CHINA ARTIFICIAL TEARS/TOPICAL LUBRICANTS IN PTERYGIUM DRUG MARKET, BY TYPE, 2020-2029 (USD MILLION)
TABLE 54 CHINA STEROIDS EYE DROPS IN PTERYGIUM DRUG MARKET, BY TYPE, 2020-2029 (USD MILLION)
TABLE 55 CHINA KETONE STEROIDS IN PTERYGIUM DRUG MARKET, BY TYPE, 2020-2029 (USD MILLION)
TABLE 56 CHINA PTERYGIUM DRUG MARKET, BY FORMULATION, 2020-2029 (USD MILLION)
TABLE 57 CHINA EYE DROPS IN PTERYGIUM DRUG MARKET, BY FORMULATION, 2020-2029 (USD MILLION)
TABLE 58 CHINA PTERYGIUM DRUG MARKET, BY MODE OF PURCHASE, 2020-2029 (USD MILLION)
TABLE 59 CHINA PTERYGIUM DRUG MARKET, BY POPULATION TYPE, 2020-2029 (USD MILLION)
TABLE 60 CHINA PTERYGIUM DRUG MARKET, BY END USER, 2020-2029 (USD MILLION)
TABLE 61 CHINA PTERYGIUM DRUG MARKET, BY DISTRIBUTION CHANNEL, 2020-2029 (USD MILLION)
TABLE 62 INDIA PTERYGIUM DRUG MARKET, BY DISEASE TYPE, 2020-2029 (USD MILLION)
TABLE 63 INDIA PTERYGIUM DRUG MARKET, BY STAGES, 2020-2029 (USD MILLION)
TABLE 64 INDIA PTERYGIUM DRUG MARKET, BY TREATMENT, 2020-2029 (USD MILLION)
TABLE 65 INDIA ARTIFICIAL TEARS/TOPICAL LUBRICANTS IN PTERYGIUM DRUG MARKET, BY TYPE, 2020-2029 (USD MILLION)
TABLE 66 INDIA STEROIDS EYE DROPS IN PTERYGIUM DRUG MARKET, BY TYPE, 2020-2029 (USD MILLION)
TABLE 67 INDIA KETONE STEROIDS IN PTERYGIUM DRUG MARKET, BY TYPE, 2020-2029 (USD MILLION)
TABLE 68 INDIA PTERYGIUM DRUG MARKET, BY FORMULATION, 2020-2029 (USD MILLION)
TABLE 69 INDIA EYE DROPS IN PTERYGIUM DRUG MARKET, BY FORMULATION, 2020-2029 (USD MILLION)
TABLE 70 INDIA PTERYGIUM DRUG MARKET, BY MODE OF PURCHASE, 2020-2029 (USD MILLION)
TABLE 71 INDIA PTERYGIUM DRUG MARKET, BY POPULATION TYPE, 2020-2029 (USD MILLION)
TABLE 72 INDIA PTERYGIUM DRUG MARKET, BY END USER, 2020-2029 (USD MILLION)
TABLE 73 INDIA PTERYGIUM DRUG MARKET, BY DISTRIBUTION CHANNEL, 2020-2029 (USD MILLION)
TABLE 74 JAPAN PTERYGIUM DRUG MARKET, BY DISEASE TYPE, 2020-2029 (USD MILLION)
TABLE 75 JAPAN PTERYGIUM DRUG MARKET, BY STAGES, 2020-2029 (USD MILLION)
TABLE 76 JAPAN PTERYGIUM DRUG MARKET, BY TREATMENT, 2020-2029 (USD MILLION)
TABLE 77 JAPAN ARTIFICIAL TEARS/TOPICAL LUBRICANTS IN PTERYGIUM DRUG MARKET, BY TYPE, 2020-2029 (USD MILLION)
TABLE 78 JAPAN STEROIDS EYE DROPS IN PTERYGIUM DRUG MARKET, BY TYPE, 2020-2029 (USD MILLION)
TABLE 79 JAPAN KETONE STEROIDS IN PTERYGIUM DRUG MARKET, BY TYPE, 2020-2029 (USD MILLION)
TABLE 80 JAPAN PTERYGIUM DRUG MARKET, BY FORMULATION, 2020-2029 (USD MILLION)
TABLE 81 JAPAN EYE DROPS IN PTERYGIUM DRUG MARKET, BY FORMULATION, 2020-2029 (USD MILLION)
TABLE 82 JAPAN PTERYGIUM DRUG MARKET, BY MODE OF PURCHASE, 2020-2029 (USD MILLION)
TABLE 83 JAPAN PTERYGIUM DRUG MARKET, BY POPULATION TYPE, 2020-2029 (USD MILLION)
TABLE 84 JAPAN PTERYGIUM DRUG MARKET, BY END USER, 2020-2029 (USD MILLION)
TABLE 85 JAPAN PTERYGIUM DRUG MARKET, BY DISTRIBUTION CHANNEL, 2020-2029 (USD MILLION)
TABLE 86 INDONESIA PTERYGIUM DRUG MARKET, BY DISEASE TYPE, 2020-2029 (USD MILLION)
TABLE 87 INDONESIA PTERYGIUM DRUG MARKET, BY STAGES, 2020-2029 (USD MILLION)
TABLE 88 INDONESIA PTERYGIUM DRUG MARKET, BY TREATMENT, 2020-2029 (USD MILLION)
TABLE 89 INDONESIA ARTIFICIAL TEARS/TOPICAL LUBRICANTS IN PTERYGIUM DRUG MARKET, BY TYPE, 2020-2029 (USD MILLION)
TABLE 90 INDONESIA STEROIDS EYE DROPS IN PTERYGIUM DRUG MARKET, BY TYPE, 2020-2029 (USD MILLION)
TABLE 91 INDONESIA KETONE STEROIDS IN PTERYGIUM DRUG MARKET, BY TYPE, 2020-2029 (USD MILLION)
TABLE 92 INDONESIA PTERYGIUM DRUG MARKET, BY FORMULATION, 2020-2029 (USD MILLION)
TABLE 93 INDONESIA EYE DROPS IN PTERYGIUM DRUG MARKET, BY FORMULATION, 2020-2029 (USD MILLION)
TABLE 94 INDONESIA PTERYGIUM DRUG MARKET, BY MODE OF PURCHASE, 2020-2029 (USD MILLION)
TABLE 95 INDONESIA PTERYGIUM DRUG MARKET, BY POPULATION TYPE, 2020-2029 (USD MILLION)
TABLE 96 INDONESIA PTERYGIUM DRUG MARKET, BY END USER, 2020-2029 (USD MILLION)
TABLE 97 INDONESIA PTERYGIUM DRUG MARKET, BY DISTRIBUTION CHANNEL, 2020-2029 (USD MILLION)
TABLE 98 VIETNAM PTERYGIUM DRUG MARKET, BY DISEASE TYPE, 2020-2029 (USD MILLION)
TABLE 99 VIETNAM PTERYGIUM DRUG MARKET, BY STAGES, 2020-2029 (USD MILLION)
TABLE 100 VIETNAM PTERYGIUM DRUG MARKET, BY TREATMENT, 2020-2029 (USD MILLION)
TABLE 101 VIETNAM ARTIFICIAL TEARS/TOPICAL LUBRICANTS IN PTERYGIUM DRUG MARKET, BY TYPE, 2020-2029 (USD MILLION)
TABLE 102 VIETNAM STEROIDS EYE DROPS IN PTERYGIUM DRUG MARKET, BY TYPE, 2020-2029 (USD MILLION)
TABLE 103 VIETNAM KETONE STEROIDS IN PTERYGIUM DRUG MARKET, BY TYPE, 2020-2029 (USD MILLION)
TABLE 104 VIETNAM PTERYGIUM DRUG MARKET, BY FORMULATION, 2020-2029 (USD MILLION)
TABLE 105 VIETNAM EYE DROPS IN PTERYGIUM DRUG MARKET, BY FORMULATION, 2020-2029 (USD MILLION)
TABLE 106 VIETNAM PTERYGIUM DRUG MARKET, BY MODE OF PURCHASE, 2020-2029 (USD MILLION)
TABLE 107 VIETNAM PTERYGIUM DRUG MARKET, BY POPULATION TYPE, 2020-2029 (USD MILLION)
TABLE 108 VIETNAM PTERYGIUM DRUG MARKET, BY END USER, 2020-2029 (USD MILLION)
TABLE 109 VIETNAM PTERYGIUM DRUG MARKET, BY DISTRIBUTION CHANNEL, 2020-2029 (USD MILLION)
TABLE 110 THAILAND PTERYGIUM DRUG MARKET, BY DISEASE TYPE, 2020-2029 (USD MILLION)
TABLE 111 THAILAND PTERYGIUM DRUG MARKET, BY STAGES, 2020-2029 (USD MILLION)
TABLE 112 THAILAND PTERYGIUM DRUG MARKET, BY TREATMENT, 2020-2029 (USD MILLION)
TABLE 113 THAILAND ARTIFICIAL TEARS/TOPICAL LUBRICANTS IN PTERYGIUM DRUG MARKET, BY TYPE, 2020-2029 (USD MILLION)
TABLE 114 THAILAND STEROIDS EYE DROPS IN PTERYGIUM DRUG MARKET, BY TYPE, 2020-2029 (USD MILLION)
TABLE 115 THAILAND KETONE STEROIDS IN PTERYGIUM DRUG MARKET, BY TYPE, 2020-2029 (USD MILLION)
TABLE 116 THAILAND PTERYGIUM DRUG MARKET, BY FORMULATION, 2020-2029 (USD MILLION)
TABLE 117 THAILAND EYE DROPS IN PTERYGIUM DRUG MARKET, BY FORMULATION, 2020-2029 (USD MILLION)
TABLE 118 THAILAND PTERYGIUM DRUG MARKET, BY MODE OF PURCHASE, 2020-2029 (USD MILLION)
TABLE 119 THAILAND PTERYGIUM DRUG MARKET, BY POPULATION TYPE, 2020-2029 (USD MILLION)
TABLE 120 THAILAND PTERYGIUM DRUG MARKET, BY END USER, 2020-2029 (USD MILLION)
TABLE 121 THAILAND PTERYGIUM DRUG MARKET, BY DISTRIBUTION CHANNEL, 2020-2029 (USD MILLION)
TABLE 122 PHILIPPINES PTERYGIUM DRUG MARKET, BY DISEASE TYPE, 2020-2029 (USD MILLION)
TABLE 123 PHILIPPINES PTERYGIUM DRUG MARKET, BY STAGES, 2020-2029 (USD MILLION)
TABLE 124 PHILIPPINES PTERYGIUM DRUG MARKET, BY TREATMENT, 2020-2029 (USD MILLION)
TABLE 125 PHILIPPINES ARTIFICIAL TEARS/TOPICAL LUBRICANTS IN PTERYGIUM DRUG MARKET, BY TYPE, 2020-2029 (USD MILLION)
TABLE 126 PHILIPPINES STEROIDS EYE DROPS IN PTERYGIUM DRUG MARKET, BY TYPE, 2020-2029 (USD MILLION)
TABLE 127 PHILIPPINES KETONE STEROIDS IN PTERYGIUM DRUG MARKET, BY TYPE, 2020-2029 (USD MILLION)
TABLE 128 PHILIPPINES PTERYGIUM DRUG MARKET, BY FORMULATION, 2020-2029 (USD MILLION)
TABLE 129 PHILIPPINES EYE DROPS IN PTERYGIUM DRUG MARKET, BY FORMULATION, 2020-2029 (USD MILLION)
TABLE 130 PHILIPPINES PTERYGIUM DRUG MARKET, BY MODE OF PURCHASE, 2020-2029 (USD MILLION)
TABLE 131 PHILIPPINES PTERYGIUM DRUG MARKET, BY POPULATION TYPE, 2020-2029 (USD MILLION)
TABLE 132 PHILIPPINES PTERYGIUM DRUG MARKET, BY END USER, 2020-2029 (USD MILLION)
TABLE 133 PHILIPPINES PTERYGIUM DRUG MARKET, BY DISTRIBUTION CHANNEL, 2020-2029 (USD MILLION)
TABLE 134 SOUTH KOREA PTERYGIUM DRUG MARKET, BY DISEASE TYPE, 2020-2029 (USD MILLION)
TABLE 135 SOUTH KOREA PTERYGIUM DRUG MARKET, BY STAGES, 2020-2029 (USD MILLION)
TABLE 136 SOUTH KOREA PTERYGIUM DRUG MARKET, BY TREATMENT, 2020-2029 (USD MILLION)
TABLE 137 SOUTH KOREA ARTIFICIAL TEARS/TOPICAL LUBRICANTS IN PTERYGIUM DRUG MARKET, BY TYPE, 2020-2029 (USD MILLION)
TABLE 138 SOUTH KOREA STEROIDS EYE DROPS IN PTERYGIUM DRUG MARKET, BY TYPE, 2020-2029 (USD MILLION)
TABLE 139 SOUTH KOREA KETONE STEROIDS IN PTERYGIUM DRUG MARKET, BY TYPE, 2020-2029 (USD MILLION)
TABLE 140 SOUTH KOREA PTERYGIUM DRUG MARKET, BY FORMULATION, 2020-2029 (USD MILLION)
TABLE 141 SOUTH KOREA EYE DROPS IN PTERYGIUM DRUG MARKET, BY FORMULATION, 2020-2029 (USD MILLION)
TABLE 142 SOUTH KOREA PTERYGIUM DRUG MARKET, BY MODE OF PURCHASE, 2020-2029 (USD MILLION)
TABLE 143 SOUTH KOREA PTERYGIUM DRUG MARKET, BY POPULATION TYPE, 2020-2029 (USD MILLION)
TABLE 144 SOUTH KOREA PTERYGIUM DRUG MARKET, BY END USER, 2020-2029 (USD MILLION)
TABLE 145 SOUTH KOREA PTERYGIUM DRUG MARKET, BY DISTRIBUTION CHANNEL, 2020-2029 (USD MILLION)
TABLE 146 AUSTRALIA PTERYGIUM DRUG MARKET, BY DISEASE TYPE, 2020-2029 (USD MILLION)
TABLE 147 AUSTRALIA PTERYGIUM DRUG MARKET, BY STAGES, 2020-2029 (USD MILLION)
TABLE 148 AUSTRALIA PTERYGIUM DRUG MARKET, BY TREATMENT, 2020-2029 (USD MILLION)
TABLE 149 AUSTRALIA ARTIFICIAL TEARS/TOPICAL LUBRICANTS IN PTERYGIUM DRUG MARKET, BY TYPE, 2020-2029 (USD MILLION)
TABLE 150 AUSTRALIA STEROIDS EYE DROPS IN PTERYGIUM DRUG MARKET, BY TYPE, 2020-2029 (USD MILLION)
TABLE 151 AUSTRALIA KETONE STEROIDS IN PTERYGIUM DRUG MARKET, BY TYPE, 2020-2029 (USD MILLION)
TABLE 152 AUSTRALIA PTERYGIUM DRUG MARKET, BY FORMULATION, 2020-2029 (USD MILLION)
TABLE 153 AUSTRALIA EYE DROPS IN PTERYGIUM DRUG MARKET, BY FORMULATION, 2020-2029 (USD MILLION)
TABLE 154 AUSTRALIA PTERYGIUM DRUG MARKET, BY MODE OF PURCHASE, 2020-2029 (USD MILLION)
TABLE 155 AUSTRALIA PTERYGIUM DRUG MARKET, BY POPULATION TYPE, 2020-2029 (USD MILLION)
TABLE 156 AUSTRALIA PTERYGIUM DRUG MARKET, BY END USER, 2020-2029 (USD MILLION)
TABLE 157 AUSTRALIA PTERYGIUM DRUG MARKET, BY DISTRIBUTION CHANNEL, 2020-2029 (USD MILLION)
TABLE 158 MALAYSIA PTERYGIUM DRUG MARKET, BY DISEASE TYPE, 2020-2029 (USD MILLION)
TABLE 159 MALAYSIA PTERYGIUM DRUG MARKET, BY STAGES, 2020-2029 (USD MILLION)
TABLE 160 MALAYSIA PTERYGIUM DRUG MARKET, BY TREATMENT, 2020-2029 (USD MILLION)
TABLE 161 MALAYSIA ARTIFICIAL TEARS/TOPICAL LUBRICANTS IN PTERYGIUM DRUG MARKET, BY TYPE, 2020-2029 (USD MILLION)
TABLE 162 MALAYSIA STEROIDS EYE DROPS IN PTERYGIUM DRUG MARKET, BY TYPE, 2020-2029 (USD MILLION)
TABLE 163 MALAYSIA KETONE STEROIDS IN PTERYGIUM DRUG MARKET, BY TYPE, 2020-2029 (USD MILLION)
TABLE 164 MALAYSIA PTERYGIUM DRUG MARKET, BY FORMULATION, 2020-2029 (USD MILLION)
TABLE 165 MALAYSIA EYE DROPS IN PTERYGIUM DRUG MARKET, BY FORMULATION, 2020-2029 (USD MILLION)
TABLE 166 MALAYSIA PTERYGIUM DRUG MARKET, BY MODE OF PURCHASE, 2020-2029 (USD MILLION)
TABLE 167 MALAYSIA PTERYGIUM DRUG MARKET, BY POPULATION TYPE, 2020-2029 (USD MILLION)
TABLE 168 MALAYSIA PTERYGIUM DRUG MARKET, BY END USER, 2020-2029 (USD MILLION)
TABLE 169 MALAYSIA PTERYGIUM DRUG MARKET, BY DISTRIBUTION CHANNEL, 2020-2029 (USD MILLION)
TABLE 170 SINGAPORE PTERYGIUM DRUG MARKET, BY DISEASE TYPE, 2020-2029 (USD MILLION)
TABLE 171 SINGAPORE PTERYGIUM DRUG MARKET, BY STAGES, 2020-2029 (USD MILLION)
TABLE 172 SINGAPORE PTERYGIUM DRUG MARKET, BY TREATMENT, 2020-2029 (USD MILLION)
TABLE 173 SINGAPORE ARTIFICIAL TEARS/TOPICAL LUBRICANTS IN PTERYGIUM DRUG MARKET, BY TYPE, 2020-2029 (USD MILLION)
TABLE 174 SINGAPORE STEROIDS EYE DROPS IN PTERYGIUM DRUG MARKET, BY TYPE, 2020-2029 (USD MILLION)
TABLE 175 SINGAPORE KETONE STEROIDS IN PTERYGIUM DRUG MARKET, BY TYPE, 2020-2029 (USD MILLION)
TABLE 176 SINGAPORE PTERYGIUM DRUG MARKET, BY FORMULATION, 2020-2029 (USD MILLION)
TABLE 177 SINGAPORE EYE DROPS IN PTERYGIUM DRUG MARKET, BY FORMULATION, 2020-2029 (USD MILLION)
TABLE 178 SINGAPORE PTERYGIUM DRUG MARKET, BY MODE OF PURCHASE, 2020-2029 (USD MILLION)
TABLE 179 SINGAPORE PTERYGIUM DRUG MARKET, BY POPULATION TYPE, 2020-2029 (USD MILLION)
TABLE 180 SINGAPORE PTERYGIUM DRUG MARKET, BY END USER, 2020-2029 (USD MILLION)
TABLE 181 SINGAPORE PTERYGIUM DRUG MARKET, BY DISTRIBUTION CHANNEL, 2020-2029 (USD MILLION)
TABLE 182 SINGAPORE PTERYGIUM DRUG MARKET, BY DISEASE TYPE, 2020-2029 (USD MILLION)
List of Figure
FIGURE 1 ASIA PACIFIC PTERYGIUM DRUG MARKET: SEGMENTATION
FIGURE 2 ASIA PACIFIC PTERYGIUM DRUG MARKET: DATA TRIANGULATION
FIGURE 3 ASIA PACIFIC PTERYGIUM DRUG MARKET: DROC ANALYSIS
FIGURE 4 ASIA PACIFIC PTERYGIUM DRUG MARKET: ASIA PACIFIC VS REGIONAL MARKET ANALYSIS
FIGURE 5 ASIA PACIFIC PTERYGIUM DRUG MARKET: COMPANY RESEARCH ANALYSIS
FIGURE 6 ASIA PACIFIC PTERYGIUM DRUG MARKET: INTERVIEW DEMOGRAPHICS
FIGURE 7 ASIA PACIFIC PTERYGIUM DRUG MARKET: DBMR POSITION GRID
FIGURE 8 ASIA PACIFIC PTERYGIUM DRUG MARKET: VENDOR SHARE ANALYSIS
FIGURE 9 ASIA PACIFIC PTERYGIUM DRUG MARKET: END USER COVERAGE GRID
FIGURE 10 ASIA PACIFIC PTERYGIUM DRUG MARKET: SEGMENTATION
FIGURE 11 ASIA-PACIFIC IS ANTICIPATED TO DOMINATE THE PTERYGIUM DRUG MARKET AND GROW WITH THE HIGHEST CAGR IN THE FORECAST PERIOD OF 2022 TO 2029
FIGURE 12 INCREASING PREVALENCE OF OPHTHALMIC DISORDERS AND RISE IN GERIATRIC POPULATION ARE EXPECTED TO DRIVE THE ASIA PACIFIC PTERYGIUM DRUG MARKET FROM 2022 TO 2029
FIGURE 13 PROGRESSIVE PTERYGIUM SEGMENT IS EXPECTED TO HAVE THE LARGEST SHARE OF THE ASIA PACIFIC PTERYGIUM DRUG MARKET FROM 2022 & 2029
FIGURE 14 DRIVERS, RESTRAINTS, OPPORTUNITIES, AND CHALLENGES OF THE ASIA PACIFIC PTERYGIUM DRUG MARKET
FIGURE 15 AGEING POPULATION IN THE WORLD (IN MILLIONS)
FIGURE 16 ASIA PACIFIC PTERYGIUM DRUG MARKET: BY DISEASE TYPE, 2021
FIGURE 17 ASIA PACIFIC PTERYGIUM DRUG MARKET: BY DISEASE TYPE, 2022-2029 (USD MILLION)
FIGURE 18 ASIA PACIFIC PTERYGIUM DRUG MARKET: BY DISEASE TYPE, CAGR (2022-2029)
FIGURE 19 ASIA PACIFIC PTERYGIUM DRUG MARKET: BY DISEASE TYPE, LIFELINE CURVE
FIGURE 20 ASIA PACIFIC PTERYGIUM DRUG MARKET: BY STAGES, 2021
FIGURE 21 ASIA PACIFIC PTERYGIUM DRUG MARKET: BY STAGES, 2022-2029 (USD MILLION)
FIGURE 22 ASIA PACIFIC PTERYGIUM DRUG MARKET: BY STAGES, CAGR (2022-2029)
FIGURE 23 ASIA PACIFIC PTERYGIUM DRUG MARKET: BY STAGES, LIFELINE CURVE
FIGURE 24 ASIA PACIFIC PTERYGIUM DRUG MARKET: BY TREATMENT, 2021
FIGURE 25 ASIA PACIFIC PTERYGIUM DRUG MARKET: BY TREATMENT, 2022-2029 (USD MILLION)
FIGURE 26 ASIA PACIFIC PTERYGIUM DRUG MARKET: BY TREATMENT, CAGR (2022-2029)
FIGURE 27 ASIA PACIFIC PTERYGIUM DRUG MARKET: BY TREATMENT, LIFELINE CURVE
FIGURE 28 ASIA PACIFIC PTERYGIUM DRUG MARKET: BY FORMULATION, 2021
FIGURE 29 ASIA PACIFIC PTERYGIUM DRUG MARKET: BY FORMULATION, 2022-2029 (USD MILLION)
FIGURE 30 ASIA PACIFIC PTERYGIUM DRUG MARKET: BY FORMULATION, CAGR (2022-2029)
FIGURE 31 ASIA PACIFIC PTERYGIUM DRUG MARKET: BY FORMULATION, LIFELINE CURVE
FIGURE 32 ASIA PACIFIC PTERYGIUM DRUG MARKET: BY MODE OF PURCHASE, 2021
FIGURE 33 ASIA PACIFIC PTERYGIUM DRUG MARKET: BY MODE OF PURCHASE, 2022-2029 (USD MILLION)
FIGURE 34 ASIA PACIFIC PTERYGIUM DRUG MARKET: BY MODE OF PURCHASE, CAGR (2022-2029)
FIGURE 35 ASIA PACIFIC PTERYGIUM DRUG MARKET: BY MODE OF PURCHASE, LIFELINE CURVE
FIGURE 36 ASIA PACIFIC PTERYGIUM DRUG MARKET: BY POPULATION TYPE, 2021
FIGURE 37 ASIA PACIFIC PTERYGIUM DRUG MARKET: BY POPULATION TYPE, 2022-2029 (USD MILLION)
FIGURE 38 ASIA PACIFIC PTERYGIUM DRUG MARKET: BY POPULATION TYPE, CAGR (2022-2029)
FIGURE 39 ASIA PACIFIC PTERYGIUM DRUG MARKET: BY POPULATION TYPE, LIFELINE CURVE
FIGURE 40 ASIA PACIFIC PTERYGIUM DRUG MARKET: BY END USER, 2021
FIGURE 41 ASIA PACIFIC PTERYGIUM DRUG MARKET: BY END USER, 2022-2029 (USD MILLION)
FIGURE 42 ASIA PACIFIC PTERYGIUM DRUG MARKET: BY END USER, CAGR (2022-2029)
FIGURE 43 ASIA PACIFIC PTERYGIUM DRUG MARKET: BY END USER, LIFELINE CURVE
FIGURE 44 ASIA PACIFIC PTERYGIUM DRUG MARKET: BY DISTRIBUTION CHANNEL, 2021
FIGURE 45 ASIA PACIFIC PTERYGIUM DRUG MARKET: BY DISTRIBUTION CHANNEL, 2022-2029 (USD MILLION)
FIGURE 46 ASIA PACIFIC PTERYGIUM DRUG MARKET: BY DISTRIBUTION CHANNEL, CAGR (2022-2029)
FIGURE 47 ASIA PACIFIC PTERYGIUM DRUG MARKET: BY DISTRIBUTION CHANNEL, LIFELINE CURVE
FIGURE 48 ASIA-PACIFIC PTERYGIUM DRUG MARKET: SNAPSHOT (2021)
FIGURE 49 ASIA-PACIFIC PTERYGIUM DRUG MARKET: BY COUNTRY (2021)
FIGURE 50 ASIA-PACIFIC PTERYGIUM DRUG MARKET: BY COUNTRY (2022 & 2029)
FIGURE 51 ASIA-PACIFIC PTERYGIUM DRUG MARKET: BY COUNTRY (2021 & 2029)
FIGURE 52 ASIA-PACIFIC PTERYGIUM DRUG MARKET: BY DISEASE TYPE (2022-2029)
FIGURE 53 ASIA PACIFIC PTERYGIUM DRUG MARKET: COMPANY SHARE 2021 (%)
Data collection and base year analysis are done using data collection modules with large sample sizes. The stage includes obtaining market information or related data through various sources and strategies. It includes examining and planning all the data acquired from the past in advance. It likewise envelops the examination of information inconsistencies seen across different information sources. The market data is analysed and estimated using market statistical and coherent models. Also, market share analysis and key trend analysis are the major success factors in the market report. To know more, please request an analyst call or drop down your inquiry.
The key research methodology used by DBMR research team is data triangulation which involves data mining, analysis of the impact of data variables on the market and primary (industry expert) validation. Data models include Vendor Positioning Grid, Market Time Line Analysis, Market Overview and Guide, Company Positioning Grid, Patent Analysis, Pricing Analysis, Company Market Share Analysis, Standards of Measurement, Global versus Regional and Vendor Share Analysis. To know more about the research methodology, drop in an inquiry to speak to our industry experts.
Data Bridge Market Research is a leader in advanced formative research. We take pride in servicing our existing and new customers with data and analysis that match and suits their goal. The report can be customized to include price trend analysis of target brands understanding the market for additional countries (ask for the list of countries), clinical trial results data, literature review, refurbished market and product base analysis. Market analysis of target competitors can be analyzed from technology-based analysis to market portfolio strategies. We can add as many competitors that you require data about in the format and data style you are looking for. Our team of analysts can also provide you data in crude raw excel files pivot tables (Fact book) or can assist you in creating presentations from the data sets available in the report.


