
Asia Pacific Track And Trace Solutions Market
Market Size in USD Billion
 USD
1.24 Billion
USD
5.67 Billion
2024
2032
USD
1.24 Billion
USD
5.67 Billion
2024
2032
| 2025 - 2032 | |
| USD 1.24 Billion | |
| USD 5.67 Billion | |
| % | |
Asia-Pacific Track and Trace Solutions Market Analysis
Tracking and tracing medications to enhance the accessibility of products in the prescription supply chain is not a novel phenomenon. In reality, the concept of serialization has been debated for more than 15 years. In 1999, after a study by the U.S. College of Medicine, President Bill Clinton put patient protection (including avoiding mistakes at the point of dispensing medicines) on the agenda of the federal government and proceeded to advocate for reform after his presidency. In 2003, the U.S. Food and Drug Administration (FDA) required barcoding at unit levels, and in the same year, the World Health Organization (WHO) released a study highlighting the scope of the counterfeit medication problem, claiming that 10% of medicines worldwide were counterfeit. A major shift in serialization took place around 2005 and the variety of countries started to set targets for adoption. However, after making several measures in protecting the supply chain, the challenge was less of a concern after the 2008 financial crisis.
As the world economy has changed, the focus has gradually moved. Turkey adopted serialization standards in 2010 and rules are in effect for other markets such as China, South Korea and India. With the EU Falsified Medicines Directive (FMD) coming into force in February 2019 and the U.S. adopting legislation as part of the Drug Supply Chain Security Act (DSCSA) in November 2017, more than 75% of Asia-Pacific medicines are required to be protected by some form of monitor and trace regulations by 2019. The track and trace solutions market is of keen importance in various industries starting from pharmaceutical to medical devices and food and beverages among more.
The progress in demand of track and trace solutions in healthcare facilities is due to stringent laws formulated for serialization and labeling which leads to the lucrative growth of track and trace solutions in the market. The vast product portfolio with enormous options for almost all major industries such as food and beverage, cosmetic and medical devices among more further impels the growth of track and trace solutions in the Asia-Pacific track and trace solutions market.
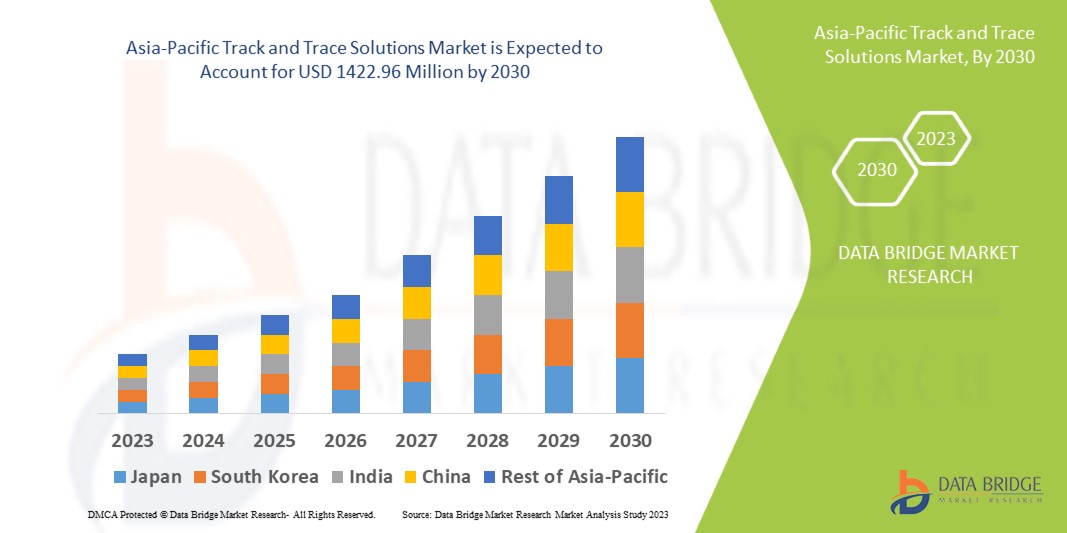
Asia-Pacific Track and Trace Solutions Market Size
Asia-Pacific track and trace solutions market size was valued at USD 1.24 billion in 2024 and is projected to reach USD 5.67 billion by 2032, with a CAGR of 20.9% during the forecast period of 2025 to 2032. In addition to the insights on market scenarios such as market value, growth rate, segmentation, geographical coverage, and major players, the market reports curated by the Data Bridge Market Research also include import export analysis, production capacity overview, production consumption analysis, price trend analysis, climate change scenario, supply chain analysis, value chain analysis, raw material/consumables overview, vendor selection criteria, PESTLE Analysis, Porter Analysis, and regulatory framework.
Asia-Pacific Track and Trace Solutions Market Trends
“Increased Demand For Supply Chain Transparency”
The demand for track and trace solutions is particularly strong due to the need for ensuring patient safety, product integrity, and regulatory compliance. Track and trace technologies help monitor the movement of pharmaceutical products, medical devices, and vaccines throughout the supply chain, minimizing the risk of counterfeit drugs and ensuring that products are stored and transported under proper conditions. Additionally, with the rising need for personalized medicine and greater healthcare accountability, these solutions enable healthcare providers to track products from production to end-use, ensuring they reach the right patients safely and efficiently. Regulatory bodies, such as the FDA, require stringent traceability measures, making track and trace systems an essential part of healthcare operations.
Report Scope and Asia-Pacific Track and Trace Solutions Market Segmentation
|
Attributes |
Asia-Pacific Track and Trace Solutions Market Market Insights |
|
Segments Covered |
|
|
Region Covered |
China, Japan, India, South Korea, Australia, Singapore, Indonesia, Thailand, Malaysia, Philippines, New Zealand, Vietnam, Taiwan, Rest of Asia-Pacific |
|
Key Market Players |
SAP SE(Germany), Zebra Technologies Corp.(U.S.), Videojet Technologies, Inc.(U.S.), METTLER TOLEDO(U.S.), Tracelink Inc.(U.S.), Siemens, Domino Printing Sciences plc(U.K.), Laetus GmbH(Germany), Xyntek Incorporated(U.S.), IBM Corporation(U.S.), WIPOTEC-OCS GmbH(Germany), 3Keys(Germany), ACG(India), NJM Packaging Inc.(U.S.), OPTEL GROUP(Canada), Systech(U.S.), Robert Bosch Manufacturing Solutions GmbH(Germany), ANTARES VISION S.p.A.(Italy), Uhlmann(Germany), SEA VISION S.r.l.(Italy), Jekson Vision(India), Kevision Systems(india), Arvato Systems, Grant-Soft Ltd.(Turkey), PharmaSecure Inc.(U.S.), Axyway(France), and SL Controls Ltd.(U.S.) |
|
Market Opportunities |
Expansion in Asia-Pacific Trade |
|
Value Added Data Infosets |
In addition to the insights on market scenarios such as market value, growth rate, segmentation, geographical coverage, and major players, the market reports curated by the Data Bridge Market Research also include import export analysis, production capacity overview, production consumption analysis, price trend analysis, climate change scenario, supply chain analysis, value chain analysis, raw material/consumables overview, vendor selection criteria, PESTLE Analysis, Porter Analysis, and regulatory framework. |
Asia-Pacific Track and Trace Solutions Market Definition
The method of identifying the present and historical position (and other information) of a particular object or property involves the storage and transportation of several kinds of items, monitoring and tracking or tracing. This definition can be followed by the estimation and recording of the location of cars and containers, for instance, recorded in a real-time database. This method leaves the challenge of drawing up a cohesive description of the corresponding progress notes. Track and trace stands for linking machines to IT and data sharing at all rates. This includes strong hardware suite device modules or stand-alone systems. The major goal of track and trace solutions is to decline the chain of counterfeit drugs and fake products across globe and to provide smooth flow and traceability of the goods at each and every point.
Asia-Pacific Track and Trace Solutions Market Dynamics
Drivers
- Stringent Regulations and Standards for the Implementation of Serialization
The arrival of mandatory serialization has completely transformed the pharmaceutical market. With both the United States Drug Supply Chain Security Act (DSCSA) and Asia-Pacifican Union Falsified Medicines Directive (FMD) now “live”, the supply chain of pharmaceuticals is forever linked to serialized products and data. Looking deeper, a successful serialization program involves far more than just placing serial numbers on packaging. Regulations vary from market to market and can often change, which means that the regulatory professionals need to be prepared to adjust procedures, processes, and filings to keep up. Since the law on the labeling and serialization of medicines is fairly recent, it is subject to greater Asia-Pacific complexity and varies more often than other regulations. Moreover, as the supply chain for genuine pharmaceuticals has grown longer, this creates an opportunity for counterfeiters at every step in the supply chain. Hence, stringent regulations and standardization are made in order to protect the goods.
- In July 2024, according to the article published by Food and Drug Administration, the Drug Supply Chain Security Act (DSCSA) mandates the electronic identification and tracing of prescription drugs at the package level to prevent harmful drugs from entering the U.S. supply chain. This stringent regulation drives the need for advanced track and trace solutions to ensure compliance, protect patients, and enable quick responses to threats, thereby acting as a key driver for the Asia-Pacific market
- In February 2022, according to the article published by USAID Asia-Pacific Health Supply Chain Program, China's State Food and Drug Administration has mandated serialization for 502 pharmaceutical drugs on the essential drug list, ensuring traceability and authenticity. This stringent regulation boosts the demand for track and trace solutions to comply with serialization requirements. As a result, it acts as a key driver for the Asia-Pacific market, pushing for wider adoption of advanced tracking technologies
The issue of medicines and medication adulteration has been a Asia-Pacific concern for decades. Fuelled by unsecured physical and cyber Asia-Pacific supply chains, internet sales, and minimal penalties, the government believes and various pharmaceutical companies worldwide that the implementation of serialization could decrease and stop the issues related to counterfeiting. This makes the stringent regulations and standards for the implementation of serialization to act as a driver for the Asia-Pacific track and trace solutions market.
- Rising Counterfeit Concerns
Rising concerns about counterfeit products have become a significant issue, particularly in the pharmaceutical and healthcare sectors, where the presence of fake drugs can have severe consequences on patient health and safety. Counterfeit medications not only compromise the integrity of the healthcare system but also increase risks of adverse effects, drug resistance, and treatment failures. In response to this growing threat, regulators and industry stakeholders are pushing for more stringent traceability and serialization measures. These measures help ensure the authenticity of products by enabling manufacturers, distributors, and retailers to track the movement of goods through the entire supply chain. Technologies such as RFID, barcoding, and blockchain are increasingly being deployed to combat counterfeiting, allowing products to be monitored and verified at each stage of the supply chain, from manufacturing to the end consumer. With the expansion of global trade and more complex supply chains, the risk of counterfeit products entering markets has become more pronounced, further driving the need for enhanced traceability systems. This heightened awareness of counterfeit risks acts as a key driver for the global track and trace solutions market, as businesses and governments seek robust systems to authenticate products, maintain regulatory compliance, and protect consumers from potentially harmful counterfeit goods.
For instance,
- In May 2024, according to the article published by Food and Drug Administration, Counterfeit medicines, which may contain incorrect, insufficient, or harmful ingredients, pose serious health risks while being falsely marketed as authentic. This growing concern over the safety and efficacy of pharmaceuticals is driving the adoption of track and trace solutions to ensure product authenticity. As a result, the rising concerns over counterfeit products act as a significant driver for the global track and trace solutions market
- In October 2024, according to the article published by Science Direct, Falsified and counterfeit medicines, particularly in international travel, pose a serious public health risk. With the rise in reported cases globally, concerns about the spread of counterfeit drugs have grown significantly. This has led to a greater need for traceability systems to ensure product authenticity. As a result, rising concerns over counterfeit medicines act as a key driver for the global track and trace solutions market
Concerns about counterfeit products, especially in the pharmaceutical and healthcare industries, have become a major issue due to the potential harm fake drugs can cause to patients. Counterfeit medications can lead to ineffective treatments and health risks, prompting increased demand for traceability solutions. By using technologies such as RFID, barcodes, and blockchain, companies can track products throughout the supply chain to ensure authenticity. As global supply chains grow more complex, the risk of counterfeit goods entering the market increases, driving the need for stronger tracking systems. This demand for secure and reliable traceability solutions acts as a major driver for the global track and trace solution market.
Opportunities
- Growth In The E-Commerce Sector
The rapid growth of the E-commerce sector presents a substantial opportunity for the Asia-Pacific track and trace solutions market due to the increasing complexity and scale of online retail operations. As more consumers shift to online shopping, businesses are required to ensure that their logistics and supply chain processes are efficient and transparent. Track and trace solutions facilitate real-time monitoring of inventory levels, shipment status, and delivery processes, enabling companies to provide accurate information to customers regarding their orders. This heightened level of transparency boosts customer confidence and enhances the overall shopping experience, making E-commerce companies more competitive in a crowded marketplace.
For instance,
- In July 2024, according to an article, ‘Impact of E-commerce on Logistics: Adapting to Demand’, published in the marketplace digest, implementing advanced tracking and visibility solutions enhances tracking and visibility solutions are critical for meeting e-commerce demands. Real-time tracking technology enables carriers to provide accurate delivery estimates and updates, improving transparency and customer trust
- In April 2023, according to an article, ‘Identification of benefits, challenges, and pathways in E-commerce industries, published in the ScienceDirect: An integrated two-phase decision-making model,’ the e-commerce industry has seen significant growth over the past decade as it focuses on convenience and accessibility, leading to a surge in online shopping with a larger number of consumers opting for it
Moreover, with the rise of E-commerce, there is a growing risk of issues such as theft, fraud, and counterfeit goods, necessitating robust track and trace systems that can mitigate these challenges. Implementing advanced technologies such as RFID, blockchain, and automated tracking systems empowers e-commerce businesses to maintain the integrity of their products from warehouse to delivery. These solutions further enable enterprises to comply with regulatory requirements and industry standards related to product accountability and safety. As e-commerce continues to expand, the demand for reliable track and trace solutions will grow, creating significant market opportunities for providers of such technologies.
- Expansion in Global Trade
The expansion of global trade creates a significant opportunity for the global track and trace solutions market, driven by the growing complexity of supply chains that cross international borders. As businesses increasingly rely on global networks to source materials and distribute their products, the need for effective tracking systems becomes paramount. Track and trace solutions allow companies to monitor shipments in real time, ensuring transparency and efficiency throughout the logistics process. This capability enhances operational efficiency and helps organizations comply with international regulations and standards, leading to greater trust among partners and customers. As global trade continues to expand, the demand for sophisticated tracking technologies that can handle various regulatory requirements and provide visibility across multiple jurisdictions is likely to surge.
For instance,
- In May 2024, according to an article published in the World Economic Forum, it is expected that global trade in goods and services to grow by 2.3% this year and 3.3% in 2025 – more than double the 1% growth seen in 2023
Moreover, the rise of E-commerce and online retail has further accelerated the demand for track and trace solutions, as consumers expect timely deliveries and transparency regarding their orders. With vast amounts of goods being transported across the globe, businesses need robust systems to track their inventory and shipments accurately. This demand has spurred innovation in the track and trace market, encouraging the development of advanced technologies such as blockchain, IoT, and artificial intelligence. These innovations enhance the capabilities of track and trace solutions and offer the opportunity to differentiate themselves in a crowded marketplace. As global trade continues to grow and evolve, the track and trace solutions market stands poised to capitalize on this trend, providing essential tools that support businesses in navigating the complexities of modern supply chain management while meeting consumer demands for transparency and accountability.
Restraints/Challenges
- Risks Associated with Sample Contamination
Data security and privacy concerns represent a significant challenge for the Asia-Pacific track and trace solutions market, as these systems often involve the collection, storage, and transmission of sensitive information. This can include personal data, product details, and supply chain information, which, if inadequately protected, pose risks to both consumers and businesses. Breaches in data security can lead to financial losses, reputational damage, and legal ramifications, particularly in light of increasingly stringent regulations such as the GDPR in Asia-Pacific and various data protection laws Asia-Pacificly. As organizations implement track and trace technologies, they must ensure robust security measures, which can increase costs and complicate the deployment process, potentially deterring companies from adopting these solutions.
For instance,
- In August 2024, according to an article, ‘Top Challenges in Implementing Track and Trace Solutions in Supply Chain Management’, published by Shriram Veritech Solutions Pvt. Ltd., with the implementation of track and trace solutions, businesses handle a vast amount of sensitive data, including proprietary information, customer details, and real-time location tracking. Track and trace systems are vulnerable to cyberattacks.
Moreover, consumer awareness regarding data privacy is growing, leading to heightened scrutiny of businesses that handle personal information. Organizations are under pressure to demonstrate compliance with data protection regulations and to build trust with their customers. If businesses cannot confidently assure stakeholders of their ability to safeguard data, they risk losing market share and facing backlash from consumers. This climate of concern can limit the willingness of companies to fully invest in and adopt advanced track and trace solutions that may require extensive data handling and processing. Consequently, the market may show slower growth as organizations navigate these complexities, seeking to balance the benefits of enhanced tracking capabilities with the imperative of maintaining data privacy and security.
- Damage To Tracking Tags During Delivery
Damage to tracking tags during delivery significantly impacts the effectiveness of track and trace solutions in the global market. When tracking tags, such as RFID labels or barcodes, are damaged during transit, it leads to data inaccuracies, loss of product visibility, and delays in tracking. This compromises the reliability of supply chain operations, especially in industries that depend on precise product movement and compliance. In the pharmaceutical sector, for instance, damaged tags disrupt critical traceability processes, increasing the risk of counterfeit products and regulatory non-compliance. Such issues result in inefficiencies, higher operational costs, and a decrease in customer confidence, acting as a significant restraint on the global track and trace solutions market.
For instance,
- In August 2024, according to the article published by encstorge.com, RFID tags are vulnerable to damage during delivery, caused by factors like water, excessive heat, chemicals, or physical breakage in the chip or antenna lines. Understanding these risks is crucial for optimizing RFID performance in different environments. Such damage disrupts track and trace systems, leading to inaccuracies and inefficiencies, which act as a significant restraint on the global market's growth
- In August 2023, according to the article published by Lexicon Tech Solutions, Barcodes can be damaged during delivery due to exposure to moisture, oils, or rough surfaces, leading to issues such as smudging or tearing. This damage makes the barcode unreadable, disrupting the tracking process. Such issues with barcode integrity can cause delays, inaccuracies, and inefficiencies in supply chains, acting as a significant restraint to the global track and trace solutions market
Damage to tracking tags during delivery hinders the effectiveness of track and trace systems in the global market. Damaged RFID labels or barcodes result in tracking errors, loss of visibility, and delays, affecting supply chain accuracy. In sectors such as pharmaceuticals, this disrupts compliance and traceability, leading to inefficiencies, higher costs, and reduced trust, which restraints market growth.
Asia-Pacific Track and Trace Solutions Market Scope
The market is segmented on the basis of product, solution, application, technology, end user, and distribution channel. The growth amongst these segments will help you analyze meagre growth segments in the industries and provide the users with a valuable market overview and market insights to help them make strategic decisions for identifying core market applications.
Product
- Software Components
- Plant Manager
- Line Controller
- Enterprise And Network Manager
- Bundle Tracking
- Case Tracking
- Warehouse And Shipment Manager
- Pallet Tracking
- Others
- Hardware Components
- Printing And Marking
- Barcode Scanner
- Monitoring And Verification
- Labeler
- Checkweigher
- Rfid Reader
- Others
- Standalone Platform
Solution
- Line And Site-Level Serialization
- Cloud Enterprise-Level Traceability
- Distribution And Warehouse Solution
- Supply Chain Data-Sharing Network
- Others
Application
- Serialization
- Carton Serialization
- Bottle Serialization
- Medical Device Serialization
- Vial And Ampoule Serialization
- Blister Serialization
- Printing
- Labeling And Packaging Inspection
- Aggregation
- Bundle Aggregation
- Case Aggregation
- Pallet Aggregation
- Tracking
- Tracing
- Reporting
Technology
- 2d Barcodes
- Radiofrequency Identification (Rfid)
- Linear/1d Barcodes
End User
- Pharmaceutical And Biopharmaceutical Companies
- Consumer Packaged Goods
- Luxury Goods
- Food And Beverage
- Medical Device Companies
- Contract Manufacturing Organizations
- Repackagers
- Cosmetics Companies
- Others
Distribution Channel
- Direct Sales
- Third Party Distributors
Asia-Pacific Track and Trace Solutions Market Regional Analysis
The market is analyzed and market size insights and trends are provided country, product, solution, application, technology, end user, and distribution channel as referenced above.
The country covered in the market are China, Japan, India, South Korea, Australia, Singapore, Indonesia, Thailand, Malaysia, Philippines, New Zealand, Vietnam, Taiwan, Rest of Asia-Pacific.
China is expected to dominate the market due to technological advancement in the region along with the presence of major players of track and trace solutions in the region.
China is expected to witness the fastest in the Asia Pacific track and trace market due to rapid industrialization, growing e-commerce, stringent regulatory requirements, and increasing concerns over counterfeit products. Additionally, expanding pharmaceutical and healthcare sectors, along with technological advancements, are driving demand for efficient supply chain visibility solutions.
The country section of the report also provides individual market impacting factors and changes in regulation in the market domestically that impacts the current and future trends of the market. Data points like down-stream and upstream value chain analysis, technical trends and porter's five forces analysis, case studies are some of the pointers used to forecast the market scenario for individual countries. Also, the presence and availability of Asia-Pacific brands and their challenges faced due to large or scarce competition from local and domestic brands, impact of domestic tariffs and trade routes are considered while providing forecast analysis of the country data.
Asia-Pacific Track and Trace Solutions Market Share
The market competitive landscape provides details by competitor. Details included are company overview, company financials, revenue generated, market potential, investment in research and development, new market initiatives, Asia-Pacific presence, production sites and facilities, production capacities, company strengths and weaknesses, product launch, product width and breadth, application dominance. The above data points provided are only related to the companies' focus related to market.
Asia-Pacific Track and Trace Solutions Market Leaders Operating in the Market Are:
- SAP SE (Germany)
- Zebra Technologies Corp. (U.S.)
- Videojet Technologies, Inc. (U.S.)
- METTLER TOLEDO (U.S.)
- Tracelink Inc. (U.S.)
- Siemens (Germany)
- Domino Printing Sciences plc (U.K.)
- Laetus GmbH (Germany)
- Xyntek Incorporated (U.S.)
- IBM Corporation (U.S.)
- WIPOTEC-OCS GmbH (Germany)
- 3Keys (Germany)
- ACG (India)
- NJM Packaging Inc. (U.S.)
- OPTEL GROUP (Canada)
- Systech (India)
- Robert Bosch Manufacturing Solutions GmbH (Germany)
- ANTARES VISION S.p.A. (Italy)
- Uhlmann (India)
- SEA VISION S.r.l. (Italy)
- Jekson Vision (India)
- Kevision Systems (India)
- Arvato Systems (Germany)
- Grant-Soft Ltd. (Turkey)
- PharmaSecure Inc. (U.S.)
- Axyway (France)
- SL Controls Ltd. (U.S.)
Latest Developments in Asia-Pacific Track and Trace Solution Market
- In May 2024, Videojet has launched the 3350 30-Watt CO2 Laser, designed to provide high-quality, permanent marking for a variety of materials. This advanced laser solution improves operational efficiency and reduces downtime with its reliable, high-speed performance. It is particularly suited for industries requiring precision marking, like food, beverage, and pharmaceuticals
- In May 2019, METTLER TOLEDO opened its new product inspection test centre for Asia-Pacifican food and pharmaceutical processors at Barcelona. This new test center opened by the company increase its credibility in the market leading to increased demand and sales of its product in future
- In February 2020, ACG introduced an innovative blockchain-based brand platform. This new platform introduced by the company will increase its demand in the market
- In November 2019, ACG introduced the NXT Series are future ready machines which will provide smart USER experience to our customers. Under the NXT series, the machines included are Protab 300 NXT, Protab 700 NXT, BMax NXT, KartonX NXT, Verishield CS18 NXT at PMEC 2019. These new product launched by ACG will increased the demand for its product in the market
- In July 2020, Axyway had received both the AWS Healthcare Competency designation and AWS Life Sciences Competency designation from Amazon Web Services (AWS) for its solutions used in multiple industries. This recognition received by the company will increase its credibility in the market
SKU-

- Interactive Data Analysis Dashboard
- Company Analysis Dashboard for high growth potential opportunities
- Research Analyst Access for customization & queries
- Competitor Analysis with Interactive dashboard
- Latest News, Updates & Trend analysis
- Harness the Power of Benchmark Analysis for Comprehensive Competitor Tracking
Table of Content
1 INTRODUCTION
1.1 OBJECTIVES OF THE STUDY
1.2 MARKET DEFINITION
1.3 OVERVIEW OF ASIA-PACIFIC TRACK AND TRACE SOLUTIONS MARKET
1.4 CURRENCY AND PRICING
1.5 LIMITATIONS
1.6 MARKETS COVERED
2 MARKET SEGMENTATION
2.1 MARKETS COVERED
2.2 GEOGRAPHICAL SCOPE
2.3 YEARS CONSIDERED FOR THE STUDY
2.4 DBMR TRIPOD DATA VALIDATION MODEL
2.5 PRIMARY INTERVIEWS WITH KEY OPINION LEADERS
2.6 MULTIVARIATE MODELLING
2.7 MARKET APPLICATION COVERAGE GRID
2.8 PRODUCTS LIFELINE CURVE
2.9 DBMR MARKET POSITION GRID
2.1 VENDOR SHARE ANALYSIS
2.11 SECONDARY SOURCES
2.12 ASSUMPTIONS
3 EXECUTIVE SUMMARY
4 PREMIUM INSIGHTS
4.1 PESTAL ANALYSIS
4.2 PORTERS FIVE FORCES ANALYSIS
5 ASIA-PACIFIC TRACK & TRACE SOLUTIONS MARKET: REGULATIONS
6 MARKET OVERVIEW
6.1 DRIVERS
6.1.1 STRINGENT REGULATIONS & STANDARDS FOR THE IMPLEMENTATION OF SERIALIZATION
6.1.2 RISING COUNTERFEIT CONCERNS
6.1.3 TECHNOLOGICAL ADVANCEMENTS IN TRACK AND TRACE SOLUTIONS
6.1.4 COMPLEXITY IN ASIA-PACIFIC SUPPLY CHAIN
6.2 RESTRAINTS
6.2.1 RESISTANCE FROM SMALL BUSINESSES
6.2.2 DAMAGE TO TRACKING TAGS DURING DELIVERY
6.3 OPPORTUNITIES
6.3.1 GROWTH IN THE E-COMMERCE SECTOR
6.3.2 INCREASING FOCUS ON DATA ANALYTICS
6.3.3 EXPANSION IN ASIA-PACIFIC TRADE
6.4 CHALLENGES
6.4.1 HIGH IMPLEMENTATION COSTS
6.4.2 DATA SECURITY AND PRIVACY CONCERNS
7 ASIA-PACIFIC TRACK AND TRACE SOLUTIONS MARKET, BY PRODUCTS
7.1 OVERVIEW
7.2 SOFTWARE COMPONENTS
7.2.1.1 PLANT MANAGER
7.2.1.2 ENTERPRISE & NETWORK MANAGER
7.2.1.3 BUNDLE TRACKING
7.2.1.4 PALLET TRACKING
7.2.1.5 CASE TRACKING
7.2.1.6 WAREHOUSE & SHIPMENT MANAGER
7.2.1.7 LINE CONTROLLER
7.2.1.8 OTHERS
7.3 HARDWARE COMPONENTS
7.3.1.1 PRINTING & MARKING
7.3.1.2 LABELER
7.3.1.3 BARCODE SCANNER
7.3.1.4 RFID READER
7.3.1.5 CHECKWEIGHER
7.3.1.6 MONITORING & VERIFICATION
7.3.1.7 OTHERS
7.4 STANDALONE PLATFORMS
8 ASIA-PACIFIC TRACK AND TRACE SOLUTIONS MARKET, BY SOLUTION
8.1 OVERVIEW
8.2 LINE & SITE LEVEL SERIALIZATION
8.3 CLOUD ENTERPRISE-LEVEL TRACEABILITY
8.4 DISTRIBUTION & WAREHOUSE SOLUTION
8.5 SUPPLY CHAIN DATA-SHARING NETWORK
8.6 OTHERS
9 ASIA-PACIFIC TRACK AND TRACE SOLUTIONS MARKET, BY TECHNOLOGY
9.1 OVERVIEW
9.2 2D BARCODES
9.3 RADIOFREQUENCY IDENTIFICATION (RFID)
9.4 LINEAR/1D BARCODESS
10 ASIA-PACIFIC TRACK AND TRACE SOLUTIONS MARKET, BY APPLICATION
10.1 OVERVIEW
10.2 SERIALIZATION
10.3 PRINTING
10.4 LABELING & PACKAGING INSPECTION
10.5 AGGREGATION
10.6 TRACKING
10.7 TRACING
10.8 REPORTING
11 ASIA-PACIFIC TRACK AND TRACE SOLUTIONS MARKET, BY END USER
11.1 OVERVIEW
11.2 PHARMACEUTICAL & BIOPHARMACEUTICAL COMPANIE
11.3 CONSUMER PACKAGED GOODS
11.4 LUXURY GOODS
11.5 FOOD & BEVERAGE
11.6 MEDICAL DEVICE COMPANIES
11.7 CONTRACT MANUFACTURING ORGANIZATIONS
11.8 REPACKAGERS
11.9 COSMETICS COMPANIES
11.1 OTHERS
12 ASIA-PACIFIC TRACK AND TRACE SOLUTIONS MARKET, BY DISTRIBUTION CHANNEL
12.1 OVERVIEW
12.2 DIRECT SALES
12.3 THIRD PARTY DISTRIBUTORS
13 ASIA-PACIFIC TRACK AND TRACE SOLUTIONS MARKET
13.1 ASIA-PACIFIC
13.1.1 CHINA
13.1.2 JAPAN
13.1.3 INDIA
13.1.4 SOUTH KOREA
13.1.5 AUSTRALIA
13.1.6 SINGAPORE
13.1.7 THAILAND
13.1.8 MALAYSIA
13.1.9 INDONESIA
13.1.10 PHILIPPINES
13.1.11 REST OF ASIA-PACIFIC
14 ASIA-PACIFIC TRACK AND TRACE SOLUTIONS MARKET: COMPANY LANDSCAPE
14.1 COMPANY SHARE ANALYSIS: ASIA-PACIFIC
15 SWOT ANALYSIS
16 COMPANY PROFILE
16.1 SAP SE
16.1.1 COMPANY SNAPSHOT
16.1.2 REVENUE ANALYSIS
16.1.3 COMPANY SHARE ANALYSIS
16.1.4 PRODUCT PORTFOLIO
16.1.5 RECENT DEVELOPMENT
16.2 ZEBRA TECHNOLOGIES CORP.
16.2.1 COMPANY SNAPSHOT
16.2.2 REVENUE ANALYSIS
16.2.3 COMPANY SHARE ANALYSIS
16.2.4 PRODUCT PORTFOLIO
16.2.5 RECENT DEVELOPMENT
16.3 TRACELINK INC.
16.3.1 COMPANY SNAPSHOT
16.3.2 COMPANY SHARE ANALYSIS
16.3.3 PRODUCT PORTFOLIO
16.3.4 RECENT DEVELOPMENTS
16.4 VIDEOJET TECHNOLOGIES, INC.
16.4.1 COMPANY SNAPSHOT
16.4.2 COMPANY SHARE ANALYSIS
16.4.3 PRODUCT PORTFOLIO
16.4.4 RECENT DEVELOPMENT
16.5 METTLER TOLEDO
16.5.1 COMPANY SNAPSHOT
16.5.2 REVENUE ANALYSIS
16.5.3 COMPANY SHARE ANALYSIS
16.5.4 PRODUCT PORTFOLIO
16.5.5 RECENT DEVELOPMENT
16.6 ACG
16.6.1 COMPANY SNAPSHOT
16.6.2 PRODUCT PORTFOLIO
16.6.3 RECENT DEVELOPMENTS
16.7 AXYWAY
16.7.1 COMPANY SNAPSHOT
16.7.2 REVENUE ANALYSIS
16.7.3 PRODUCT PORTFOLIO
16.7.4 RECENT DEVELOPMENT
16.8 ANTARES VISION S.P.A.
16.8.1 COMPANY SNAPSHOT
16.8.2 REVENUE ANALYSIS
16.8.3 PRODUCT PORTFOLIO
16.8.4 RECENT DEVELOPMENTS
16.9 ARVATO SYSTEMS
16.9.1 COMPANY SNAPSHOT
16.9.2 PRODUCT PORTFOLIO
16.9.3 RECENT DEVELOPMENT
16.1 DOMINO PRINTING SCIENCES PLC
16.10.1 COMPANY SNAPSHOT
16.10.2 PRODUCT PORTFOLIO
16.10.3 RECENT DEVELOPMENTS
16.11 GRANT-SOFT LTD.
16.11.1 COMPANY SNAPSHOT
16.11.2 PRODUCT PORTFOLIO
16.11.3 RECENT DEVELOPMENT
16.12 IBM CORPORATION
16.12.1 COMPANY SNAPSHOT
16.12.2 REVENUE ANALYSIS
16.12.3 PRODUCT PORTFOLIO
16.12.4 RECENT DEVELOPMENT
16.13 JEKSON VISION
16.13.1 COMPANY SNAPSHOT
16.13.2 PRODUCT PORTFOLIO
16.13.3 RECENT DEVELOPMENTS
16.14 3KEYS
16.14.1 COMPANY SNAPSHOT
16.14.2 REVENUE ANALYSIS
16.14.3 PRODUCT PORTFOLIO
16.14.4 RECENT DEVELOPMENT
16.15 KEVISION SYSTEMS
16.15.1 COMPANY SNAPSHOT
16.15.2 PRODUCT PORTFOLIO
16.15.3 RECENT DEVELOPMENT
16.16 LAETUS GMBH
16.16.1 COMPANY SNAPSHOT
16.16.2 PRODUCT PORTFOLIO
16.16.3 RECENT DEVELOPMENT
16.17 NJM PACKAGING INC.
16.17.1 COMPANY SNAPSHOT
16.17.2 PRODUCT PORTFOLIO
16.17.3 RECENT DEVELOPMENTS
16.18 OPTEL GROUP
16.18.1 COMPANY SNAPSHOT
16.18.2 PRODUCT PORTFOLIO
16.18.3 RECENT DEVELOPMENTS
16.19 PHARMADECURE INC.
16.19.1 COMPANY SNAPSHOT
16.19.2 PRODUCT PORTFOLIO
16.19.3 RECENT DEVELOPMENT
16.2 ROBERT BOSCH MANUFACTURING SOLUTIONS GMBH
16.20.1 COMPANY SNAPSHOT
16.20.2 PRODUCT PORTFOLIO
16.20.3 RECENT DEVELOPMENT
16.21 SEA VISION S.R.L.
16.21.1 COMPANY SNAPSHOT
16.21.2 REVENUE ANALYSIS
16.21.3 PRODUCT PORTFOLIO
16.21.4 RECENT DEVELOPMENT
16.22 SIEMENS
16.22.1 COMPANY SNAPSHOT
16.22.2 REVENUE ANALYSIS
16.22.3 PRODUCT PORTFOLIO
16.22.4 RECENT DEVELOPMENT
16.23 SL CONTROLS LTD
16.23.1 COMPANY SNAPSHOT
16.23.2 PRODUCT PORTFOLIO
16.23.3 RECENT DEVELOPMENT
16.24 SYSTECH
16.24.1 COMPANY SNAPSHOT
16.24.2 PRODUCT PORTFOLIO
16.24.3 RECENT DEVELOPMENTS
16.25 UHLMANN
16.25.1 COMPANY SNAPSHOT
16.25.2 PRODUCT PORTFOLIO
16.25.3 RECENT DEVELOPMENTS
16.26 WIPOTEC-OCS GMBH
16.26.1 COMPANY SNAPSHOT
16.26.2 PRODUCT PORTFOLIO
16.26.3 RECENT DEVELOPMENT
16.27 XYNTEK INCORPORATED
16.27.1 COMPANY SNAPSHOT
16.27.2 PRODUCT PORTFOLIO
16.27.3 RECENT DEVELOPMENT
17 QUESTIONNAIRE
18 RELATED REPORTS
List of Table
TABLE 1 ASIA-PACIFIC TRACK AND TRACE SOLUTIONS MARKET, BY PRODUCTS, 2018-2032 (USD THOUSAND)
TABLE 2 ASIA-PACIFIC SOFTWARE COMPONENTS IN TRACK AND TRACE SOLUTIONS MARKET, BY REGION, 2018-2032 (USD THOUSAND)
TABLE 3 ASIA-PACIFIC SOFTWARE COMPONENTS IN TRACK AND TRACE SOLUTIONS MARKET, BY PRODUCTS, 2018-2032 (USD THOUSAND)
TABLE 4 ASIA-PACIFIC HARDWARE COMPONENTS IN TRACK AND TRACE SOLUTIONS MARKET, BY REGION, 2018-2032 (USD THOUSAND)
TABLE 5 ASIA-PACIFIC HARDWARE COMPONENTS IN TRACK AND TRACE SOLUTIONS MARKET, BY PRODUCTS, 2018-2032 (USD THOUSAND)
TABLE 6 ASIA-PACIFIC STANDALONE PLATFORMS IN TRACK AND TRACE SOLUTIONS MARKET, BY REGION, 2018-2032 (USD THOUSAND)
TABLE 7 ASIA-PACIFIC TRACK AND TRACE SOLUTIONS MARKET, BY SOLUTION, 2018-2032 (USD THOUSAND)
TABLE 8 ASIA-PACIFIC LINE & SITE LEVEL SERIALIZATION IN TRACK AND TRACE SOLUTIONS MARKET, BY REGION, 2018-2032 (USD THOUSAND)
TABLE 9 ASIA-PACIFIC CLOUD ENTERPRISE-LEVEL TRACEABILITY IN TRACK AND TRACE SOLUTIONS MARKET, BY REGION, 2018-2032 (USD THOUSAND)
TABLE 10 ASIA-PACIFIC DISTRIBUTION & WAREHOUSE SOLUTION IN TRACK AND TRACE SOLUTIONS MARKET, BY REGION, 2018-2032 (USD THOUSAND)
TABLE 11 ASIA-PACIFIC SUPPLY CHAIN DATA-SHARING NETWORK IN TRACK AND TRACE SOLUTIONS MARKET, BY REGION, 2018-2032 (USD THOUSAND)
TABLE 12 ASIA-PACIFIC OTHERS IN TRACK AND TRACE SOLUTIONS MARKET, BY REGION, 2018-2032 (USD THOUSAND)
TABLE 13 ASIA-PACIFIC TRACK AND TRACE SOLUTIONS MARKET, BY TECHNOLOGY, 2018-2032 (USD THOUSAND)
TABLE 14 ASIA-PACIFIC 2D BARCODES IN TRACK AND TRACE SOLUTIONS MARKET, BY REGION, 2018-2032(USD THOUSAND)
TABLE 15 ASIA-PACIFIC RADIOFREQUENCY IDENTIFICATION (RFID) IN TRACK AND TRACE SOLUTIONS MARKET, BY REGION, 2018-2032 (USD THOUSAND)
TABLE 16 ASIA-PACIFIC LINEAR/1D BARCODES IN TRACK AND TRACE SOLUTIONS MARKET, BY REGION, 2018-2032 (USD THOUSAND)
TABLE 17 ASIA-PACIFIC TRACK AND TRACE SOLUTIONS MARKET, BY APPLICATION, 2018-2032 (USD THOUSAND)
TABLE 18 ASIA-PACIFIC SERIALIZATION IN TRACK AND TRACE SOLUTIONS MARKET, BY REGION, 2018-2032 (USD THOUSAND)
TABLE 19 ASIA-PACIFIC SERIALIZATION IN TRACK AND TRACE SOLUTIONS MARKET, BY APPLICATION, 2018-2032 (USD THOUSAND)
TABLE 20 ASIA-PACIFIC PRINTING IN TRACK AND TRACE SOLUTIONS MARKET, BY REGION, 2018-2032 (USD THOUSAND)
TABLE 21 ASIA-PACIFIC LABELING & PACKAGING INSPECTION IN TRACK AND TRACE SOLUTIONS MARKET, BY REGION, 2018-2032 (USD THOUSAND)
TABLE 22 ASIA-PACIFIC AGGREGATION IN TRACK AND TRACE SOLUTIONS MARKET, BY REGION, 2018-2032 (USD THOUSAND)
TABLE 23 ASIA-PACIFIC AGGREGATION IN TRACK AND TRACE SOLUTIONS MARKET, BY APPLICATION, 2018-2032 (USD THOUSAND)
TABLE 24 ASIA-PACIFIC TRACKING IN TRACK AND TRACE SOLUTIONS MARKET, BY REGION, 2018-2032 (USD THOUSAND)
TABLE 25 ASIA-PACIFIC TRACING IN TRACK AND TRACE SOLUTIONS MARKET, BY REGION, 2018-2032 (USD THOUSAND)
TABLE 26 ASIA-PACIFIC REPORTING IN TRACK AND TRACE SOLUTIONS MARKET, BY REGION, 2018-2032 (USD THOUSAND)
TABLE 27 ASIA-PACIFIC TRACK AND TRACE SOLUTIONS MARKET, BY END USER, 2018-2032 (USD THOUSAND)
TABLE 28 ASIA-PACIFIC PHARMACEUTICAL & BIOPHARMACEUTICAL COMPANIE IN TRACK AND TRACE SOLUTIONS MARKET, BY REGION, 2018-2032 (USD THOUSAND)
TABLE 29 ASIA-PACIFIC CONSUMER PACKAGED GOODS IN TRACK AND TRACE SOLUTIONS MARKET, BY REGION, 2018-2032 (USD THOUSAND)
TABLE 30 ASIA-PACIFIC LUXURY GOODS IN TRACK AND TRACE SOLUTIONS MARKET, BY REGION, 2018-2032 (USD THOUSAND)
TABLE 31 ASIA-PACIFIC FOOD & BEVERAGE IN TRACK AND TRACE SOLUTIONS MARKET, BY REGION, 2018-2032 (USD THOUSAND)
TABLE 32 ASIA-PACIFIC MEDICAL DEVICE COMPANIES IN TRACK AND TRACE SOLUTIONS MARKET, BY REGION, 2018-2032 (USD THOUSAND)
TABLE 33 ASIA-PACIFIC CONTRACT MANUFACTURING ORGANIZATIONS IN TRACK AND TRACE SOLUTIONS MARKET, BY REGION, 2018-2032 (USD THOUSAND)
TABLE 34 ASIA-PACIFIC REPACKAGERS IN TRACK AND TRACE SOLUTIONS MARKET, BY REGION, 2018-2032 (USD THOUSAND)
TABLE 35 ASIA-PACIFIC COSMETICS COMPANIES IN TRACK AND TRACE SOLUTIONS MARKET, BY REGION, 2018-2032 (USD THOUSAND)
TABLE 36 ASIA-PACIFIC OTHERS IN TRACK AND TRACE SOLUTIONS MARKET, BY REGION, 2018-2032 (USD THOUSAND)
TABLE 37 ASIA-PACIFIC TRACK AND TRACE SOLUTIONS MARKET, BY DISTRIBUTION CHANNEL, 2018-2032 (USD THOUSAND)
TABLE 38 ASIA-PACIFIC DIRECT SALES IN TRACK AND TRACE SOLUTIONS MARKET, BY REGION, 2018-2032(USD THOUSAND)
TABLE 39 ASIA-PACIFIC THIRD-PARTY DISTRIBUTORS IN TRACK AND TRACE SOLUTIONS MARKET, BY REGION, 2018-2032 (USD THOUSAND)
TABLE 40 ASIA-PACIFIC TRACK AND TRACE SOLUTIONS MARKET, BY COUNTRY, 2018-2032 (USD THOUSAND)
TABLE 41 ASIA-PACIFIC TRACK AND TRACE SOLUTIONS MARKET, BY PRODUCTS, 2018-2032 (USD THOUSAND)
TABLE 42 ASIA-PACIFIC SOFTWARE COMPONENTS IN TRACK AND TRACE SOLUTIONS MARKET, BY PRODUCTS, 2018-2032 (USD THOUSAND)
TABLE 43 ASIA-PACIFIC HARDWARE COMPONENTS IN TRACK AND TRACE SOLUTIONS MARKET, BY PRODUCTS, 2018-2032 (USD THOUSAND)
TABLE 44 ASIA-PACIFIC TRACK AND TRACE SOLUTIONS MARKET, BY SOLUTION, 2018-2032 (USD THOUSAND)
TABLE 45 ASIA-PACIFIC TRACK AND TRACE SOLUTIONS MARKET, BY APPLICATION, 2018-2032 (USD THOUSAND)
TABLE 46 ASIA-PACIFIC SERIALIZATION IN TRACK AND TRACE SOLUTIONS MARKET, BY APPLICATION, 2018-2032 (USD THOUSAND)
TABLE 47 ASIA-PACIFIC AGGREGATION IN TRACK AND TRACE SOLUTIONS MARKET, BY APPLICATION, 2018-2032 (USD THOUSAND)
TABLE 48 ASIA-PACIFIC TRACK AND TRACE SOLUTIONS MARKET, BY TECHNOLOGY, 2018-2032 (USD THOUSAND)
TABLE 49 ASIA-PACIFIC TRACK AND TRACE SOLUTIONS MARKET, BY END USER, 2018-2032 (USD THOUSAND)
TABLE 50 ASIA-PACIFIC TRACK AND TRACE SOLUTIONS MARKET, BY DISTRIBUTION CHANNEL, 2018-2032 (USD THOUSAND)
TABLE 51 CHINA TRACK AND TRACE SOLUTIONS MARKET, BY PRODUCTS, 2018-2032 (USD THOUSAND)
TABLE 52 CHINA SOFTWARE COMPONENTS IN TRACK AND TRACE SOLUTIONS MARKET, BY PRODUCTS, 2018-2032 (USD THOUSAND)
TABLE 53 CHINA HARDWARE COMPONENTS IN TRACK AND TRACE SOLUTIONS MARKET, BY PRODUCTS, 2018-2032 (USD THOUSAND)
TABLE 54 CHINA TRACK AND TRACE SOLUTIONS MARKET, BY SOLUTION, 2018-2032 (USD THOUSAND)
TABLE 55 CHINA TRACK AND TRACE SOLUTIONS MARKET, BY APPLICATION, 2018-2032 (USD THOUSAND)
TABLE 56 CHINA SERIALIZATION IN TRACK AND TRACE SOLUTIONS MARKET, BY APPLICATION, 2018-2032 (USD THOUSAND)
TABLE 57 CHINA AGGREGATION IN TRACK AND TRACE SOLUTIONS MARKET, BY APPLICATION, 2018-2032 (USD THOUSAND)
TABLE 58 CHINA TRACK AND TRACE SOLUTIONS MARKET, BY TECHNOLOGY, 2018-2032 (USD THOUSAND)
TABLE 59 CHINA TRACK AND TRACE SOLUTIONS MARKET, BY END USER, 2018-2032 (USD THOUSAND)
TABLE 60 CHINA TRACK AND TRACE SOLUTIONS MARKET, BY DISTRIBUTION CHANNEL, 2018-2032 (USD THOUSAND)
TABLE 61 JAPAN TRACK AND TRACE SOLUTIONS MARKET, BY PRODUCTS, 2018-2032 (USD THOUSAND)
TABLE 62 JAPAN SOFTWARE COMPONENTS IN TRACK AND TRACE SOLUTIONS MARKET, BY PRODUCTS, 2018-2032 (USD THOUSAND)
TABLE 63 JAPAN HARDWARE COMPONENTS IN TRACK AND TRACE SOLUTIONS MARKET, BY PRODUCTS, 2018-2032 (USD THOUSAND)
TABLE 64 JAPAN TRACK AND TRACE SOLUTIONS MARKET, BY SOLUTION, 2018-2032 (USD THOUSAND)
TABLE 65 JAPAN TRACK AND TRACE SOLUTIONS MARKET, BY APPLICATION, 2018-2032 (USD THOUSAND)
TABLE 66 JAPAN SERIALIZATION IN TRACK AND TRACE SOLUTIONS MARKET, BY APPLICATION, 2018-2032 (USD THOUSAND)
TABLE 67 JAPAN AGGREGATION IN TRACK AND TRACE SOLUTIONS MARKET, BY APPLICATION, 2018-2032 (USD THOUSAND)
TABLE 68 JAPAN TRACK AND TRACE SOLUTIONS MARKET, BY TECHNOLOGY, 2018-2032 (USD THOUSAND)
TABLE 69 JAPAN TRACK AND TRACE SOLUTIONS MARKET, BY END USER, 2018-2032 (USD THOUSAND)
TABLE 70 JAPAN TRACK AND TRACE SOLUTIONS MARKET, BY DISTRIBUTION CHANNEL, 2018-2032 (USD THOUSAND)
TABLE 71 INDIA TRACK AND TRACE SOLUTIONS MARKET, BY PRODUCTS, 2018-2032 (USD THOUSAND)
TABLE 72 INDIA SOFTWARE COMPONENTS IN TRACK AND TRACE SOLUTIONS MARKET, BY PRODUCTS, 2018-2032 (USD THOUSAND)
TABLE 73 INDIA HARDWARE COMPONENTS IN TRACK AND TRACE SOLUTIONS MARKET, BY PRODUCTS, 2018-2032 (USD THOUSAND)
TABLE 74 INDIA TRACK AND TRACE SOLUTIONS MARKET, BY SOLUTION, 2018-2032 (USD THOUSAND)
TABLE 75 INDIA TRACK AND TRACE SOLUTIONS MARKET, BY APPLICATION, 2018-2032 (USD THOUSAND)
TABLE 76 INDIA SERIALIZATION IN TRACK AND TRACE SOLUTIONS MARKET, BY APPLICATION, 2018-2032 (USD THOUSAND)
TABLE 77 INDIA AGGREGATION IN TRACK AND TRACE SOLUTIONS MARKET, BY APPLICATION, 2018-2032 (USD THOUSAND)
TABLE 78 INDIA TRACK AND TRACE SOLUTIONS MARKET, BY TECHNOLOGY, 2018-2032 (USD THOUSAND)
TABLE 79 INDIA TRACK AND TRACE SOLUTIONS MARKET, BY END USER, 2018-2032 (USD THOUSAND)
TABLE 80 INDIA TRACK AND TRACE SOLUTIONS MARKET, BY DISTRIBUTION CHANNEL, 2018-2032 (USD THOUSAND)
TABLE 81 SOUTH KOREA TRACK AND TRACE SOLUTIONS MARKET, BY PRODUCTS, 2018-2032 (USD THOUSAND)
TABLE 82 SOUTH KOREA SOFTWARE COMPONENTS IN TRACK AND TRACE SOLUTIONS MARKET, BY PRODUCTS, 2018-2032 (USD THOUSAND)
TABLE 83 SOUTH KOREA HARDWARE COMPONENTS IN TRACK AND TRACE SOLUTIONS MARKET, BY PRODUCTS, 2018-2032 (USD THOUSAND)
TABLE 84 SOUTH KOREA TRACK AND TRACE SOLUTIONS MARKET, BY SOLUTION, 2018-2032 (USD THOUSAND)
TABLE 85 SOUTH KOREA TRACK AND TRACE SOLUTIONS MARKET, BY APPLICATION, 2018-2032 (USD THOUSAND)
TABLE 86 SOUTH KOREA SERIALIZATION IN TRACK AND TRACE SOLUTIONS MARKET, BY APPLICATION, 2018-2032 (USD THOUSAND)
TABLE 87 SOUTH KOREA AGGREGATION IN TRACK AND TRACE SOLUTIONS MARKET, BY APPLICATION, 2018-2032 (USD THOUSAND)
TABLE 88 SOUTH KOREA TRACK AND TRACE SOLUTIONS MARKET, BY TECHNOLOGY, 2018-2032 (USD THOUSAND)
TABLE 89 SOUTH KOREA TRACK AND TRACE SOLUTIONS MARKET, BY END USER, 2018-2032 (USD THOUSAND)
TABLE 90 SOUTH KOREA TRACK AND TRACE SOLUTIONS MARKET, BY DISTRIBUTION CHANNEL, 2018-2032 (USD THOUSAND)
TABLE 91 AUSTRALIA TRACK AND TRACE SOLUTIONS MARKET, BY PRODUCTS, 2018-2032 (USD THOUSAND)
TABLE 92 AUSTRALIA SOFTWARE COMPONENTS IN TRACK AND TRACE SOLUTIONS MARKET, BY PRODUCTS, 2018-2032 (USD THOUSAND)
TABLE 93 AUSTRALIA HARDWARE COMPONENTS IN TRACK AND TRACE SOLUTIONS MARKET, BY PRODUCTS, 2018-2032 (USD THOUSAND)
TABLE 94 AUSTRALIA TRACK AND TRACE SOLUTIONS MARKET, BY SOLUTION, 2018-2032 (USD THOUSAND)
TABLE 95 AUSTRALIA TRACK AND TRACE SOLUTIONS MARKET, BY APPLICATION, 2018-2032 (USD THOUSAND)
TABLE 96 AUSTRALIA SERIALIZATION IN TRACK AND TRACE SOLUTIONS MARKET, BY APPLICATION, 2018-2032 (USD THOUSAND)
TABLE 97 AUSTRALIA AGGREGATION IN TRACK AND TRACE SOLUTIONS MARKET, BY APPLICATION, 2018-2032 (USD THOUSAND)
TABLE 98 AUSTRALIA TRACK AND TRACE SOLUTIONS MARKET, BY TECHNOLOGY, 2018-2032 (USD THOUSAND)
TABLE 99 AUSTRALIA TRACK AND TRACE SOLUTIONS MARKET, BY END USER, 2018-2032 (USD THOUSAND)
TABLE 100 AUSTRALIA TRACK AND TRACE SOLUTIONS MARKET, BY DISTRIBUTION CHANNEL, 2018-2032 (USD THOUSAND)
TABLE 101 SINGAPORE TRACK AND TRACE SOLUTIONS MARKET, BY PRODUCTS, 2018-2032 (USD THOUSAND)
TABLE 102 SINGAPORE SOFTWARE COMPONENTS IN TRACK AND TRACE SOLUTIONS MARKET, BY PRODUCTS, 2018-2032 (USD THOUSAND)
TABLE 103 SINGAPORE HARDWARE COMPONENTS IN TRACK AND TRACE SOLUTIONS MARKET, BY PRODUCTS, 2018-2032 (USD THOUSAND)
TABLE 104 SINGAPORE TRACK AND TRACE SOLUTIONS MARKET, BY SOLUTION, 2018-2032 (USD THOUSAND)
TABLE 105 SINGAPORE TRACK AND TRACE SOLUTIONS MARKET, BY APPLICATION, 2018-2032 (USD THOUSAND)
TABLE 106 SINGAPORE SERIALIZATION IN TRACK AND TRACE SOLUTIONS MARKET, BY APPLICATION, 2018-2032 (USD THOUSAND)
TABLE 107 SINGAPORE AGGREGATION IN TRACK AND TRACE SOLUTIONS MARKET, BY APPLICATION, 2018-2032 (USD THOUSAND)
TABLE 108 SINGAPORE TRACK AND TRACE SOLUTIONS MARKET, BY TECHNOLOGY, 2018-2032 (USD THOUSAND)
TABLE 109 SINGAPORE TRACK AND TRACE SOLUTIONS MARKET, BY END USER, 2018-2032 (USD THOUSAND)
TABLE 110 SINGAPORE TRACK AND TRACE SOLUTIONS MARKET, BY DISTRIBUTION CHANNEL, 2018-2032 (USD THOUSAND)
TABLE 111 THAILAND TRACK AND TRACE SOLUTIONS MARKET, BY PRODUCTS, 2018-2032 (USD THOUSAND)
TABLE 112 THAILAND SOFTWARE COMPONENTS IN TRACK AND TRACE SOLUTIONS MARKET, BY PRODUCTS, 2018-2032 (USD THOUSAND)
TABLE 113 THAILAND HARDWARE COMPONENTS IN TRACK AND TRACE SOLUTIONS MARKET, BY PRODUCTS, 2018-2032 (USD THOUSAND)
TABLE 114 THAILAND TRACK AND TRACE SOLUTIONS MARKET, BY SOLUTION, 2018-2032 (USD THOUSAND)
TABLE 115 THAILAND TRACK AND TRACE SOLUTIONS MARKET, BY APPLICATION, 2018-2032 (USD THOUSAND)
TABLE 116 THAILAND SERIALIZATION IN TRACK AND TRACE SOLUTIONS MARKET, BY APPLICATION, 2018-2032 (USD THOUSAND)
TABLE 117 THAILAND AGGREGATION IN TRACK AND TRACE SOLUTIONS MARKET, BY APPLICATION, 2018-2032 (USD THOUSAND)
TABLE 118 THAILAND TRACK AND TRACE SOLUTIONS MARKET, BY TECHNOLOGY, 2018-2032 (USD THOUSAND)
TABLE 119 THAILAND TRACK AND TRACE SOLUTIONS MARKET, BY END USER, 2018-2032 (USD THOUSAND)
TABLE 120 THAILAND TRACK AND TRACE SOLUTIONS MARKET, BY DISTRIBUTION CHANNEL, 2018-2032 (USD THOUSAND)
TABLE 121 MALAYSIA TRACK AND TRACE SOLUTIONS MARKET, BY PRODUCTS, 2018-2032 (USD THOUSAND)
TABLE 122 MALAYSIA SOFTWARE COMPONENTS IN TRACK AND TRACE SOLUTIONS MARKET, BY PRODUCTS, 2018-2032 (USD THOUSAND)
TABLE 123 MALAYSIA HARDWARE COMPONENTS IN TRACK AND TRACE SOLUTIONS MARKET, BY PRODUCTS, 2018-2032 (USD THOUSAND)
TABLE 124 MALAYSIA TRACK AND TRACE SOLUTIONS MARKET, BY SOLUTION, 2018-2032 (USD THOUSAND)
TABLE 125 MALAYSIA TRACK AND TRACE SOLUTIONS MARKET, BY APPLICATION, 2018-2032 (USD THOUSAND)
TABLE 126 MALAYSIA SERIALIZATION IN TRACK AND TRACE SOLUTIONS MARKET, BY APPLICATION, 2018-2032 (USD THOUSAND)
TABLE 127 MALAYSIA AGGREGATION IN TRACK AND TRACE SOLUTIONS MARKET, BY APPLICATION, 2018-2032 (USD THOUSAND)
TABLE 128 MALAYSIA TRACK AND TRACE SOLUTIONS MARKET, BY TECHNOLOGY, 2018-2032 (USD THOUSAND)
TABLE 129 MALAYSIA TRACK AND TRACE SOLUTIONS MARKET, BY END USER, 2018-2032 (USD THOUSAND)
TABLE 130 MALAYSIA TRACK AND TRACE SOLUTIONS MARKET, BY DISTRIBUTION CHANNEL, 2018-2032 (USD THOUSAND)
TABLE 131 INDONESIA TRACK AND TRACE SOLUTIONS MARKET, BY PRODUCTS, 2018-2032 (USD THOUSAND)
TABLE 132 INDONESIA SOFTWARE COMPONENTS IN TRACK AND TRACE SOLUTIONS MARKET, BY PRODUCTS, 2018-2032 (USD THOUSAND)
TABLE 133 INDONESIA HARDWARE COMPONENTS IN TRACK AND TRACE SOLUTIONS MARKET, BY PRODUCTS, 2018-2032 (USD THOUSAND)
TABLE 134 INDONESIA TRACK AND TRACE SOLUTIONS MARKET, BY SOLUTION, 2018-2032 (USD THOUSAND)
TABLE 135 INDONESIA TRACK AND TRACE SOLUTIONS MARKET, BY APPLICATION, 2018-2032 (USD THOUSAND)
TABLE 136 INDONESIA SERIALIZATION IN TRACK AND TRACE SOLUTIONS MARKET, BY APPLICATION, 2018-2032 (USD THOUSAND)
TABLE 137 INDONESIA AGGREGATION IN TRACK AND TRACE SOLUTIONS MARKET, BY APPLICATION, 2018-2032 (USD THOUSAND)
TABLE 138 INDONESIA TRACK AND TRACE SOLUTIONS MARKET, BY TECHNOLOGY, 2018-2032 (USD THOUSAND)
TABLE 139 INDONESIA TRACK AND TRACE SOLUTIONS MARKET, BY END USER, 2018-2032 (USD THOUSAND)
TABLE 140 INDONESIA TRACK AND TRACE SOLUTIONS MARKET, BY DISTRIBUTION CHANNEL, 2018-2032 (USD THOUSAND)
TABLE 141 PHILIPPINES TRACK AND TRACE SOLUTIONS MARKET, BY PRODUCTS, 2018-2032 (USD THOUSAND)
TABLE 142 PHILIPPINES SOFTWARE COMPONENTS IN TRACK AND TRACE SOLUTIONS MARKET, BY PRODUCTS, 2018-2032 (USD THOUSAND)
TABLE 143 PHILIPPINES HARDWARE COMPONENTS IN TRACK AND TRACE SOLUTIONS MARKET, BY PRODUCTS, 2018-2032 (USD THOUSAND)
TABLE 144 PHILIPPINES TRACK AND TRACE SOLUTIONS MARKET, BY SOLUTION, 2018-2032 (USD THOUSAND)
TABLE 145 PHILIPPINES TRACK AND TRACE SOLUTIONS MARKET, BY APPLICATION, 2018-2032 (USD THOUSAND)
TABLE 146 PHILIPPINES SERIALIZATION IN TRACK AND TRACE SOLUTIONS MARKET, BY APPLICATION, 2018-2032 (USD THOUSAND)
TABLE 147 PHILIPPINES AGGREGATION IN TRACK AND TRACE SOLUTIONS MARKET, BY APPLICATION, 2018-2032 (USD THOUSAND)
TABLE 148 PHILIPPINES TRACK AND TRACE SOLUTIONS MARKET, BY TECHNOLOGY, 2018-2032 (USD THOUSAND)
TABLE 149 PHILIPPINES TRACK AND TRACE SOLUTIONS MARKET, BY END USER, 2018-2032 (USD THOUSAND)
TABLE 150 PHILIPPINES TRACK AND TRACE SOLUTIONS MARKET, BY DISTRIBUTION CHANNEL, 2018-2032 (USD THOUSAND)
TABLE 151 REST OF ASIA-PACIFIC TRACK AND TRACE SOLUTIONS MARKET, BY PRODUCTS, 2018-2032 (USD THOUSAND)
List of Figure
FIGURE 1 ASIA-PACIFIC TRACK AND TRACE SOLUTIONS MARKET: SEGMENTATION
FIGURE 2 ASIA-PACIFIC TRACK AND TRACE SOLUTIONS MARKET: DATA TRIANGULATION
FIGURE 3 ASIA-PACIFIC TRACK AND TRACE SOLUTIONS MARKET: DROC ANALYSIS
FIGURE 4 ASIA-PACIFIC TRACK AND TRACE SOLUTIONS MARKET: ASIA-PACIFIC VS REGIONAL MARKET ANALYSIS
FIGURE 5 ASIA-PACIFIC TRACK AND TRACE SOLUTIONS MARKET: COMPANY RESEARCH ANALYSIS
FIGURE 6 ASIA-PACIFIC TRACK AND TRACE SOLUTIONS MARKET: INTERVIEW DEMOGRAPHICS
FIGURE 7 ASIA-PACIFIC TRACK AND TRACE SOLUTIONS MARKET: MARKET APPLICATION COVERAGE GRID
FIGURE 8 ASIA-PACIFIC TRACK AND TRACE SOLUTIONS MARKET: DBMR MARKET POSITION GRID
FIGURE 9 ASIA-PACIFIC TRACK AND TRACE SOLUTIONS MARKET: VENDOR SHARE ANALYSIS
FIGURE 10 ASIA-PACIFIC TRACK AND TRACE SOLUTIONS MARKET: SEGMENTATION
FIGURE 11 STRINGENT REGULATIONS & STANDARDS FOR THE IMPLEMENTATION OF SERIALIZATION IS EXPECTED TO DRIVE THE ASIA-PACIFIC TRACK AND TRACE SOLUTIONS MARKET IN THE FORECAST PERIOD OF 2025 TO 2032
FIGURE 12 SOFTWARE COMPONENTS SEGMENT IS EXPECTED TO ACCOUNT FOR THE LARGEST SHARE OF THE ASIA-PACIFIC TRACK AND TRACE SOLUTIONS MARKET IN 2025 & 2032
FIGURE 13 DROC ANALYSIS
FIGURE 14 ASIA-PACIFIC TRACK AND TRACE SOLUTIONS MARKET: BY PRODUCTS, 2024
FIGURE 15 ASIA-PACIFIC TRACK AND TRACE SOLUTIONS MARKET: BY PRODUCTS, 2025-2032 (USD THOUSAND)
FIGURE 16 ASIA-PACIFIC TRACK AND TRACE SOLUTIONS MARKET: BY PRODUCTS, CAGR (2025-2032)
FIGURE 17 ASIA-PACIFIC TRACK AND TRACE SOLUTIONS MARKET: BY PRODUCTS, LIFELINE CURVE
FIGURE 18 ASIA-PACIFIC TRACK AND TRACE SOLUTIONS MARKET: BY SOLUTION, 2024
FIGURE 19 ASIA-PACIFIC TRACK AND TRACE SOLUTIONS MARKET: BY SOLUTION, 2025-2032 (USD THOUSAND)
FIGURE 20 ASIA-PACIFIC TRACK AND TRACE SOLUTIONS MARKET: BY SOLUTION, CAGR (2025-2032)
FIGURE 21 ASIA-PACIFIC TRACK AND TRACE SOLUTIONS MARKET: BY SOLUTION, LIFELINE CURVE
FIGURE 22 ASIA-PACIFIC TRACK AND TRACE SOLUTIONS MARKET: BY TECHNOLOGY, 2024
FIGURE 23 ASIA-PACIFIC TRACK AND TRACE SOLUTIONS MARKET: BY TECHNOLOGY, 2025-2032 (USD THOUSAND)
FIGURE 24 ASIA-PACIFIC TRACK AND TRACE SOLUTIONS MARKET: BY TECHNOLOGY, CAGR (2025-2032)
FIGURE 25 ASIA-PACIFIC TRACK AND TRACE SOLUTIONS MARKET: BY TECHNOLOGY, LIFELINE CURVE
FIGURE 26 ASIA-PACIFIC TRACK AND TRACE SOLUTIONS MARKET: BY APPLICATION, 2024
FIGURE 27 ASIA-PACIFIC TRACK AND TRACE SOLUTIONS MARKET: BY APPLICATION, 2025-2032 (USD THOUSAND)
FIGURE 28 ASIA-PACIFIC TRACK AND TRACE SOLUTIONS MARKET: BY APPLICATION, CAGR (2025-2032)
FIGURE 29 ASIA-PACIFIC TRACK AND TRACE SOLUTIONS MARKET: BY APPLICATION, LIFELINE CURVE
FIGURE 30 ASIA-PACIFIC TRACK AND TRACE SOLUTIONS MARKET: BY END USER, 2024
FIGURE 31 ASIA-PACIFIC TRACK AND TRACE SOLUTIONS MARKET: BY END USER, 2025-2032 (USD THOUSAND)
FIGURE 32 ASIA-PACIFIC TRACK AND TRACE SOLUTIONS MARKET: BY END USER, CAGR (2025-2032)
FIGURE 33 ASIA-PACIFIC TRACK AND TRACE SOLUTIONS MARKET: BY END USER, LIFELINE CURVE
FIGURE 34 ASIA-PACIFIC TRACK AND TRACE SOLUTIONS MARKET: BY DISTRIBUTION CHANNEL, 2024
FIGURE 35 ASIA-PACIFIC TRACK AND TRACE SOLUTIONS MARKET: BY DISTRIBUTION CHANNEL, 2025-2032 (USD THOUSAND)
FIGURE 36 ASIA-PACIFIC TRACK AND TRACE SOLUTIONS MARKET: BY DISTRIBUTION CHANNEL, CAGR (2025-2032)
FIGURE 37 ASIA-PACIFIC TRACK AND TRACE SOLUTIONS MARKET: BY DISTRIBUTION CHANNEL, LIFELINE CURVE
FIGURE 38 ASIA-PACIFIC TRACK AND TRACE SOLUTIONS MARKET SNAPSHOT
FIGURE 39 ASIA-PACIFIC TRACK AND TRACE SOLUTIONS MARKET: COMPANY SHARE 2024 (%)
Data collection and base year analysis are done using data collection modules with large sample sizes. The stage includes obtaining market information or related data through various sources and strategies. It includes examining and planning all the data acquired from the past in advance. It likewise envelops the examination of information inconsistencies seen across different information sources. The market data is analysed and estimated using market statistical and coherent models. Also, market share analysis and key trend analysis are the major success factors in the market report. To know more, please request an analyst call or drop down your inquiry.
The key research methodology used by DBMR research team is data triangulation which involves data mining, analysis of the impact of data variables on the market and primary (industry expert) validation. Data models include Vendor Positioning Grid, Market Time Line Analysis, Market Overview and Guide, Company Positioning Grid, Patent Analysis, Pricing Analysis, Company Market Share Analysis, Standards of Measurement, Global versus Regional and Vendor Share Analysis. To know more about the research methodology, drop in an inquiry to speak to our industry experts.
Data Bridge Market Research is a leader in advanced formative research. We take pride in servicing our existing and new customers with data and analysis that match and suits their goal. The report can be customized to include price trend analysis of target brands understanding the market for additional countries (ask for the list of countries), clinical trial results data, literature review, refurbished market and product base analysis. Market analysis of target competitors can be analyzed from technology-based analysis to market portfolio strategies. We can add as many competitors that you require data about in the format and data style you are looking for. Our team of analysts can also provide you data in crude raw excel files pivot tables (Fact book) or can assist you in creating presentations from the data sets available in the report.


