
Asia Pacific Unmanned Ground Vehicle Market
Market Size in USD Billion
 USD
1.82 Billion
USD
3.44 Billion
2025
2033
USD
1.82 Billion
USD
3.44 Billion
2025
2033
| 2026 - 2033 | |
| USD 1.82 Billion | |
| USD 3.44 Billion | |
| % | |
|
Asia-Pacific Unmanned Ground Vehicle Market Size
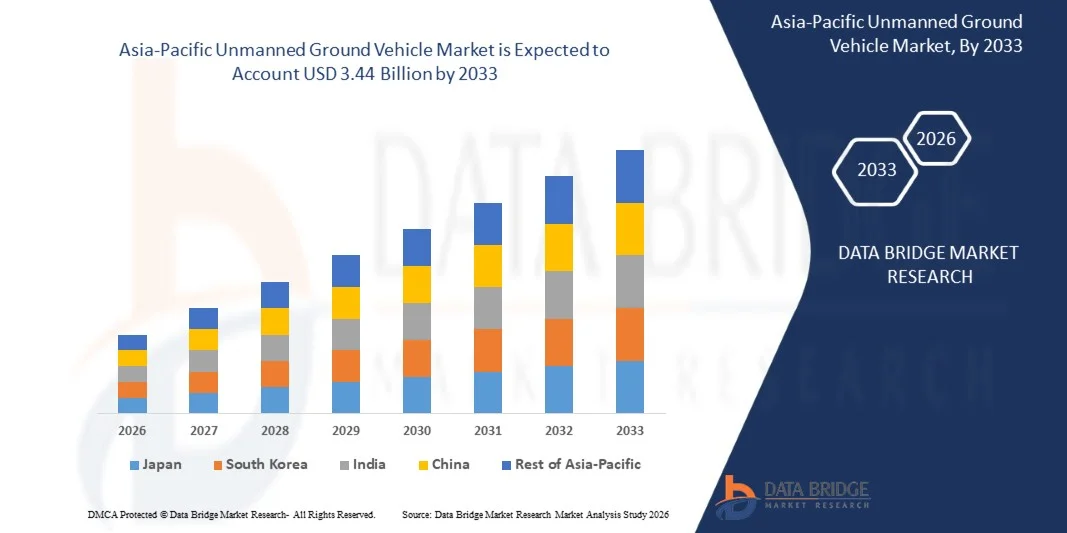
- The Asia-Pacific Unmanned Ground Vehicle Market size was valued at USD 1.82 billion in 2025 and is expected to reach USD 3.44 billion by 2033, at a CAGR of 8.7% during the forecast period
- The Asia-Pacific unmanned ground vehicle (UGV) Market refers to the industry focused on the design, production, and deployment of robotic ground-based systems that operate without an onboard human presence. These vehicles are used for military, commercial, and industrial applications, including surveillance, logistics, explosive ordnance disposal, mining, agriculture, and infrastructure inspection.
Asia-Pacific Unmanned Ground Vehicle Market Analysis
- The Unmanned Ground Vehicle (UGV) market represents a critical segment within the Asia-Pacific defense, security, and industrial automation landscape, supporting applications across military operations, border security, law enforcement, mining, agriculture, and disaster response. UGVs are characterized by remote or autonomous operation, high mobility, and the ability to perform tasks in hazardous or inaccessible environments.
- Market growth is driven by rising defense modernization programs and increasing demand for autonomous and semi-autonomous systems to reduce human risk in combat, surveillance, and explosive ordnance disposal (EOD). Advancements in artificial intelligence, sensors, navigation systems, and communication technologies are accelerating UGV adoption across both defense and commercial sectors.
- The defense and military sector is expected to remain the dominant end-use segment within the UGV market, supported by growing investments in reconnaissance, logistics support, and combat support vehicles. Militaries benefit from UGVs’ ability to enhance situational awareness, improve mission efficiency, and operate continuously under extreme conditions.
- Singapore is projected to lead the Asia-Pacific Unmanned Ground Vehicle Market share 17.95% in 2025 and it is anticipated to the fastest growth 8.9% CAGR, while Japan is anticipated to register the fastest growth during the forecast period. Growth in Japan is supported by increasing defense budgets, indigenous robotics development, and expanding applications in homeland security and industrial automation.
- The SMALL (10–200 lbs) unmanned ground vehicle segment is anticipated to hold the largest market share 35.88% by 2025 due to its lightweight design, high maneuverability, and cost-effectiveness. These UGVs are widely deployed for surveillance, reconnaissance, EOD, and inspection tasks, making them highly versatile across military and commercial applications.
Report Scope and Asia-Pacific Unmanned Ground Vehicle Market Segmentation
|
Attributes |
Asia-Pacific Unmanned Ground Vehicle Market Key Market Insights |
|
Segments Covered |
|
|
Countries Covered |
Asia-Pacific
|
|
Key Market Players |
|
|
Market Opportunities |
|
|
Value Added Data Infosets |
In addition to the market insights such as market value, growth rate, market segments, geographical coverage, market players, and market scenario, the market report curated by the Data Bridge Market Research team includes in-depth expert analysis, import/export analysis, pricing analysis, production consumption analysis, and pestle analysis.. |
Asia-Pacific Unmanned Ground Vehicle Market Trends
“Modular Mission-Payload Designs Unlocking Diversified Application Segments Of UGV”
- Modular mission-payload architectures permit unmanned ground vehicles (UGVs) to be rapidly reconfigured for distinct operational roles—transport, intelligence, surveillance and reconnaissance, casualty evacuation, counter-drone, explosive-ordnance disposal and precision effects—thereby expanding addressable markets across defence and commercial domains. Open-architecture payload interfaces, standardized mounting plates and software abstractions reduce time-to-mission for new capabilities, lower integration overhead for customers, and enable suppliers to scale platform families through mission kits rather than bespoke vehicles.
- In April 2025, Overland AI announced the ULTRA autonomous tactical vehicle that integrates and deploys multiple modular payloads—including unmanned aerial systems and breaching tools—demonstrating a commercial example of modular payload integration intended for tactical ground operations.
- In April 2024, DARPA publicly described progress in RACER Phase 2 (adding heavier platforms and demonstrating autonomy portability across vehicles)—an activity that underpins modular payload concepts by enabling common autonomy and interfaces across different UGV chassis sizes.
Asia-Pacific Unmanned Ground Vehicle Market Dynamics
Driver
Defence Modernization Programs Accelerating Asia-Pacific UGV Procurement Momentum
- Defence modernization programmes worldwide have accelerated procurement of unmanned ground vehicles (UGVs) by creating explicit operational requirements, funding lines and accelerated acquisition pathways that convert experimentation into formal programmes of record. Armed forces are prioritizing UGVs for tasks ranging from logistics and route clearance to reconnaissance and force protection, which in turn drives supplier investment in platform commonality, open architectures and modular mission payloads.
- In February 2025, the French defence procurement agency (DGA) notified an agreement-frame (DROIDE) for terrestrial robotics, establishing an acquisition pathway to bring ground robotic innovations into service through an official framework agreement and facilitating multi-partner cooperation and industry contributions
- In September 2024, the Australian Department of Defence published an item describing deployment and use of a Ground Uncrewed System (GUS) for intelligence, surveillance and reconnaissance tasks, demonstrating operational adoption of UGVs by Australian units and an intent to integrate such systems into routine force activities.
- In April 2024, the United Kingdom Ministry of Defence published a ministerial address and associated materials that emphasized military robotics and autonomous systems as procurement priorities, and described trials and capability demonstrations that will inform future UGV acquisition and integration into UK force structures.
Restraint/Challenge
High Development And Integration Costs Limiting Wider Deployment
- High development and integration costs for unmanned ground vehicles (UGVs) remain a significant restraint on market expansion, as advanced autonomy, ruggedized sensor suites, secure communications architectures and mission-specific payloads require substantial investment in research, testing and system certification. These expenditures limit broader adoption, particularly among agencies and commercial enterprises with constrained capital budgets, and often delay transition from prototype stages to full-scale deployment.
- In February 2024, Reuters reported that investment and procurement in some robotics sectors slowed amid economic and cost pressures, noting firms and purchasers were delaying orders because higher costs and tighter budgets reduced near-term purchasing; the item demonstrates commercial cost sensitivity that affects adoption of advanced robotic platforms.
- In July 2024, Defence Equipment & Support (UK MOD / DE&S) published its Annual Report and Accounts 2023 to 2024, which documents sustainment and procurement pressures across ground platforms and highlights programme risk and cost uncertainty in equipping and supporting new technologies — placing new autonomous s
Asia-Pacific Unmanned Ground Vehicle Market Scope
The Asia-Pacific Unmanned Ground Vehicle Market is segmented into Seven segments based on Size, System, mobility, propulsion, mode of operation, application payload
• By size
On the basis of size, the market is segmented into Micro UGVS (<10 LBS), Small (10 - 200 LBS), Medium (200 - 500 LBS), Large (500 – 1,000 LBS) , Very Large (1,000 – 2,000 LBS) , Extremely Large (>2,000 LBS). In 2026, the small (10–200 LBS) segment is expected to dominate the Asia-Pacific Unmanned Ground Vehicle Market with a 35.51% share and a CAGR of 6.8%, driven by rising demand for lightweight, man-portable systems. These UGVs are widely adopted for reconnaissance, surveillance, explosive ordnance disposal and tactical logistics due to their ease of deployment and lower procurement costs. Growing military emphasis on rapid mobility, urban operations and force protection further supports this segment’s growth.
• By system
On the basis of system, the market is segmented into Payloads, Controller Units, Power System, Navigation System, Chassis System, Communication System, Others. In 2026, the payloads segment is expected to dominate the Asia-Pacific Unmanned Ground Vehicle Market with a 34.19% share and a CAGR of 7.4%, driven by rising demand for modular mission systems. Increasing adoption of advanced sensors, weapon stations, ISR equipment and logistics payloads is enabling UGVs to support diverse operational roles. Defence forces’ focus on open architectures and rapid reconfiguration further accelerates investment in payload technologies.
• By Mobility
On the basis of mobility, the market is segmented into Wheeled, Tracked, Legged, Hybrid, Snake/Articulated Mobility. In 2026, the wheeled segment is expected to dominate the Asia-Pacific Unmanned Ground Vehicle Market with a 53.87% share and a CAGR of 8.7%, driven by its superior speed, mobility, and lower maintenance requirements. Wheeled UGVs are widely used for logistics, reconnaissance, and patrol missions, offering operational flexibility in urban and semi-structured terrains. Growing demand for cost-effective, rapidly deployable ground systems further fuels the segment’s growth.
• By Propulsion
On the basis of Propulsion, the market is segmented into Electric, Hybrid, Diesel/Gasoline Powered, Hydrogen Fuel Cell UGVS, Solar-Assisted UGVS. In 2026, Electric segment is expected to dominate the Asia-Pacific Unmanned Ground Vehicle Market with a 64.13% share and a CAGR of 9.0%, driven by their strong R&D capabilities, extensive production capacity, and established defense contracts. These companies are investing heavily in advanced UGV technologies, modular platforms, and autonomous systems, enabling them to meet growing military and security demands in Asia-Pacific. Strategic collaborations and framework agreements further reinforce their market leadership.
• By Mode of Operation
On the basis of Mode of Operation, the market is segmented into Teleoperated, Tethered, Autonomous. In 2026, the teleoperated segment is expected to dominate the Asia-Pacific Unmanned Ground Vehicle Market with a 66.24% share and a CAGR of 8.3%, driven by the demand for remotely controlled systems that enhance operational safety and precision. These UGVs are widely used for reconnaissance, explosive ordnance disposal, and hazardous environment missions, allowing personnel to operate at a safe distance. Growing military and security applications, along with technological advancements in communication and control systems, further support segment growth.
• By Application
On the basis of Application, the market is segmented into Commercial, Military, Federal Law Enforcement, Law Enforcement. In 2026, the military segment is expected to dominate the Asia-Pacific Unmanned Ground Vehicle Market with a 45.47%share and a CAGR of 9.0%, driven by increasing defense modernization initiatives and rising demand for autonomous and remotely operated systems. UGVs are extensively deployed for reconnaissance, logistics, force protection, and combat support, enhancing operational efficiency and reducing risk to personnel. Growing investments in AI, sensor integration, and modular payloads further accelerate adoption in military applications..
• By Payload
On the basis of Payload, the market is segmented into Light Duty (Less Than 50 Kg), Medium Duty (50–200 Kg), Heavy Duty (200–1,000 Kg), Ultra-Heavy Duty (>1,000 Kg. In 2025 Light Duty (Less Than 50 Kg. In 2026, the Light Duty (less than 50 kg) segment is expected to dominate the Asia-Pacific Unmanned Ground Vehicle Market with a 52.97%share and a CAGR of 8.3%, driven by the growing need for highly portable, easily deployable systems. These UGVs are ideal for reconnaissance, surveillance, and tactical support missions, offering rapid mobility and reduced logistical burden. Increasing adoption by military, law enforcement, and commercial users for flexible, cost-effective operations further fuels market growth.
Asia-Pacific Unmanned Ground Vehicle Market Regional Analysis
Singapore dominates the Asia-Pacific Unmanned Ground Vehicle Market with the largest revenue share of 17.95% in 2026, Singapore’s Asia-Pacific Unmanned Ground Vehicle Market is driven by strong defense spending, advanced military robotics adoption, and emphasis on autonomous surveillance and logistics platforms. High R&D capability, smart city integration, and focus on force modernization support sustained UGV deployment..
Malaysia Asia-Pacific Unmanned Ground Vehicle Market Insight
The Malaysia Asia-Pacific Unmanned Ground Vehicle Market captured over Japan of Asia-Pacific revenue share in 2025 Malaysia’s Asia-Pacific Unmanned Ground Vehicle Market is driven by rising border security needs, modernization of defense forces, and growing use of autonomous systems for surveillance and EOD operations, supported by government investments and increasing focus on smart defense technologies..
Asia-Pacific Unmanned Ground Vehicle Market Share
The Asia-Pacific Unmanned Ground Vehicle Market is primarily led by well-established companies, including:
- General Dynamics Land Systems (U.S.)
- Rheinmetall AG (Germany)
- Elbit Systems Ltd. (Israel)
- Textron Systems (U.S.)
- Thales (France)
- Teledyne FLIR Defense Inc. (U.S.)
- Leonardo S.p.A. (Italy)
- QinetiQ (U.K.)
- ST Engineering (Singapore)
- Peraton (U.S.)
- AeroVironment, Inc. (U.S.)
- Hanwha Group (South Korea)
- HYUNDAI ROTEM COMPANY (South Korea)
- DOK-ING Ltd. (Croatia)
- Roboteam (Israel)
- Israel Aerospace Industries (IAI) (Israel)
- Ghost Robotics (U.S.)
- Milrem AS (Estonia)
- Edgeforce (U.K.)
- ASELSAN A.Ş. (Türkiye)
Latest Developments in Asia-Pacific Unmanned Ground Vehicle Market
- In December 2025, General Dynamics Land Systems (GDLS) announced a successful demonstration of the PERCH loitering munitions launcher co-developed with AeroVironment, showcasing the integration of Switchblade 300 and Switchblade 600 loitering munitions onto armored combat vehicles to enhance beyond-line-of-sight surveillance and lethality capabilities during a demonstration at the U.S. Army’s Machine Assisted Rugged Sapper event.
- In December 2025, – Thales introduced Sonar 76Nano, a new miniaturised acoustic detection system designed to revolutionise underwater battlespace awareness by extending advanced sonar capabilities—including AI-enhanced detection, seabed mapping, and low-probability-of-detection messaging—across a wider range of naval platforms, including uncrewed underwater vehicles, in support of UK and allied maritime security priorities.
- In March 2025, AV, through its subsidiary Telerob, was awarded a major contract to deliver 41 large advanced telemax™ HT300 uncrewed ground vehicles (UGVs) to the German Federal Armed Forces, with initial deliveries starting in summer 2025 and additional orders extending through 2027. Selected after a competitive procurement process, the HT300 is purpose-built for high-risk EOD and counter-IED missions, offering an advanced manipulator arm, exceptional traction, and mobility across complex and unstable terrain. The systems will be manufactured at Telerob’s state-of-the-art facility in Ostfildern, Germany, reinforcing AV’s strategic partnership with the German Armed Forces and enhancing its reputation and market presence in advanced UGV solutions.
SKU-

- Interactive Data Analysis Dashboard
- Company Analysis Dashboard for high growth potential opportunities
- Research Analyst Access for customization & queries
- Competitor Analysis with Interactive dashboard
- Latest News, Updates & Trend analysis
- Harness the Power of Benchmark Analysis for Comprehensive Competitor Tracking
Table of Content
1 INTRODUCTION
1.1 OBJECTIVES OF THE STUDY
1.2 MARKET DEFINITION
1.3 OVERVIEW
1.4 LIMITATIONS
1.5 MARKETS COVERED
2 MARKET SEGMENTATION
2.1 MARKETS COVERED
2.2 GEOGRAPHICAL SCOPE
2.3 YEARS CONSIDERED FOR THE STUDY
2.4 CURRENCY AND PRICING
2.5 DBMR TRIPOD DATA VALIDATION MODEL
2.6 MULTIVARIATE MODELING
2.7 SIZE TIMELINE CURVE
2.8 MARKET APPLICATION COVERAGE GRID
2.9 PRIMARY INTERVIEWS WITH KEY OPINION LEADERS
2.1 DBMR MARKET POSITION GRID
2.11 DBMR VENDOR SHARE ANALYSIS
2.12 SECONDARY SOURCES
2.13 ASSUMPTIONS
3 EXECUTIVE SUMMARY
4 PREMIUM INSIGHT
4.1 PESTEL ANALYSIS
4.2 CASE STUDY ANALYSIS
4.2.1 CASE STUDY: DEPLOYMENT OF THEMIS UNMANNED GROUND VEHICLE AND ITS IMPACT ON MILITARY LOGISTICS AND COMBAT SUPPORT OPERATIONS
4.2.1.1 BACKGROUND AND STRATEGIC CONTEXT
4.2.1.2 OPERATIONAL CHALLENGES PRIOR TO UGV INTEGRATION
4.2.1.2.1 HIGH PERSONNEL RISK IN FRONTLINE AND SUPPORT MISSIONS
4.2.1.2.2 LOGISTICAL CONSTRAINTS IN CONTESTED AND REMOTE TERRAIN
4.2.1.2.3 DEMAND FOR ENHANCED SITUATIONAL AWARENESS
4.2.1.3 TECHNOLOGICAL AND OPERATIONAL MEASURES INTRODUCED
4.2.1.3.1 MODULAR UGV ARCHITECTURE
4.2.1.3.2 REMOTE AND SEMI-AUTONOMOUS OPERATION
4.2.1.3.3 INTEGRATION WITH EXISTING FORCE STRUCTURES
4.2.1.4 IMPACT ON MILITARY OPERATIONS AND LOGISTICS EFFICIENCY
4.2.1.4.1 IMPROVED LOGISTICS CONTINUITY
4.2.1.4.2 REDUCED EXPOSURE OF HUMAN PERSONNEL
4.2.1.4.3 ENHANCED OPERATIONAL FLEXIBILITY
4.2.1.4.4 SUPPORT FOR MULTI-DOMAIN OPERATIONS
4.2.1.5 LIMITATIONS AND LESSONS LEARNED
4.2.1.5.1 DEPENDENCE ON COMMUNICATIONS AND CONTROL SYSTEMS
4.2.1.5.2 CONSTRAINTS ON FULL AUTONOMY IN COMPLEX ENVIRONMENTS
4.2.2 CASE STUDY: MULTIFUNCTIONAL UNMANNED GROUND VEHICLES IN EMERGENCY RESPONSE AND PUBLIC SAFETY OPERATIONS
4.2.2.1 BACKGROUND AND STRATEGIC CONTEXT
4.2.2.2 OPERATIONAL CHALLENGES BEFORE UGV DEPLOYMENT
4.2.2.2.1 HIGH RISK TO FIRST RESPONDERS
4.2.2.2.2 DELAYS IN INCIDENT ASSESSMENT
4.2.2.3 TECHNOLOGICAL MEASURES INTRODUCED
4.2.2.3.1 INTEGRATED SENSORS AND MANIPULATION TOOLS
4.2.2.3.2 REMOTE COMMAND AND CONTROL OPERATIONS
4.2.2.4 IMPACT ON EMERGENCY RESPONSE EFFECTIVENESS
4.2.2.4.1 IMPROVED RESPONDER SAFETY
4.2.2.4.2 FASTER AND MORE INFORMED DECISION-MAKING
4.3 CONSUMER BUYING BEHAVIOUR
4.4 CONSUMER PURCHASE DECISION PROCESS
4.4.1 PROBLEM RECOGNITION
4.4.2 INFORMATION SEARCH
4.4.3 ALTERNATIVE EVALUATION
4.4.4 PURCHASE DECISION
4.4.5 POST-PURCHASE BEHAVIOR
4.4.6 INFLUENCING FACTORS
4.5 KEY STRATEGIC INITIATIVES
4.5.1 INTEGRATION OF UGVS INTO MULTI-DOMAIN DEFENCE AND SECURITY ARCHITECTURES
4.5.1.1 CONVERGENCE OF LAND, AIR, AND COMMAND-AND-CONTROL SYSTEMS
4.5.1.2 INTEROPERABILITY WITH EXISTING MILITARY AND HOMELAND SECURITY ASSETS
4.5.1.3 Coordination of Multimodal Transport Networks
4.5.2 EMPHASIS ON AUTONOMY, ARTIFICIAL INTELLIGENCE AND ADVANCED SENSING
4.5.2.1 ADVANCEMENT OF SEMI-AUTONOMOUS AND AUTONOMOUS NAVIGATION
4.5.2.2 INTEGRATION OF MULTI-SENSOR AND PERCEPTION SYSTEMS
4.5.3 PLATFORM MODULARITY AND MISSION-SPECIFIC CONFIGURABILITY
4.5.3.1 DEVELOPMENT OF MODULAR PAYLOAD AND CHASSIS DESIGNS
4.5.3.2 SUPPORT FOR DUAL-USE AND CIVIL–MILITARY APPLICATIONS
4.5.4 LOCALISATION, DOMESTIC MANUFACTURING AND SUPPLY CHAIN RESILIENCE
4.5.4.1 ALIGNMENT WITH NATIONAL DEFENCE INDUSTRIAL POLICIES
4.5.4.2 STRENGTHENING OF REGIONAL SUPPLY AND MAINTENANCE ECOSYSTEMS
4.5.5 CYBERSECURITY, RELIABILITY AND OPERATIONAL RESILIENCE
4.5.5.1 INTEGRATION OF SECURE COMMUNICATION AND CYBER HARDENING
4.5.5.2 DESIGN FOR HARSH AND CONTESTED ENVIRONMENTS
4.5.6 EXPANSION OF INTERNATIONAL COLLABORATIONS AND DEFENCE PARTNERSHIPS
4.5.6.1 CROSS-BORDER TECHNOLOGY COLLABORATION AND JOINT PROGRAMS
4.5.6.2 PARTICIPATION IN ASIA-PACIFIC DEFENCE MODERNISATION PROGRAMS
4.6 REGIONAL GROWTH OPPORTUNITIES
4.6.1 NORTH AMERICA — ADVANCED DEFENCE DOCTRINE AND TECHNOLOGY LEADERSHIP
4.6.1.1 INSTITUTIONALISATION OF ROBOTIC AND AUTONOMOUS GROUND SYSTEMS
4.6.1.2 BORDER SECURITY, BASE PROTECTION AND HOMELAND APPLICATIONS
4.6.2 EUROPE — MULTINATIONAL COOPERATION AND TERRITORIAL SECURITY
4.6.2.1 COLLECTIVE DEFENCE AND INTEROPERABILITY-DRIVEN DEMAND
4.6.2.2 HEIGHTENED FOCUS ON BORDER SURVEILLANCE AND INFRASTRUCTURE PROTECTION
4.6.3 ASIA–PACIFIC — STRATEGIC TENSIONS AND DUAL-USE EXPANSION
4.6.3.1 BORDER MANAGEMENT AND TERRAIN-INTENSIVE OPERATIONS
4.6.3.2 DISASTER RESPONSE, URBAN SAFETY AND CIVIL APPLICATIONS
4.6.4 MIDDLE EAST — BORDER CONTROL AND CRITICAL ASSET SECURITY
4.6.4.1 PROTECTION OF ENERGY AND STRATEGIC INFRASTRUCTURE
4.6.4.2 LOCAL DEFENCE INDUSTRIAL DEVELOPMENT
4.6.5 CONCLUSION
4.7 TECHNOLOGICAL ADVANCEMENTS
4.7.1 OVERVIEW
4.7.2 AUTONOMOUS NAVIGATION AND ADVANCED SLAM CAPABILITIES
4.7.3 ARTIFICIAL INTELLIGENCE–DRIVEN PERCEPTION AND SENSOR FUSION
4.7.4 EDGE COMPUTING AND ON-BOARD AUTONOMY
4.7.5 SWARMING TECHNOLOGIES AND MULTI-VEHICLE COORDINATION
4.7.6 MODULAR DESIGN AND OPEN-SYSTEM ARCHITECTURES
4.7.7 DIGITAL TWINS, SIMULATION, AND SYNTHETIC TRAINING ENVIRONMENTS
4.7.8 CONCLUSION
4.8 PRICING ANALYSIS
4.9 COMPANY COMPARATIVE ANALYSIS: TOP SELLING MODEL VS PRICE RANGE
4.1 IMPORT EXPORT SCENARIO
4.10.1 COUNTRY-LEVEL PATTERNS
4.10.2 COMPANY-LEVEL TRADE BEHAVIOR
4.11 SUSTAINABILITY INITIATIVES
4.11.1 SUSTAINABILITY DRIVERS IN THE UGV MARKET:
4.11.2 REAL-TIME EXAMPLES: SUSTAINABILITY IN PRACTICE
4.11.2.1 Defense Sector: Hybridization and Fuel Reduction
4.11.2.2 Active Combat Logistics: Resource Optimization
4.11.2.3 Agriculture: Direct Environmental Sustainability Impact
4.11.2.4 Disaster Response & Hazard Mitigation
4.11.3 CROSS-CUTTING SUSTAINABILITY THEMES
4.11.4 STRATEGIC IMPLICATIONS FOR THE UGV MARKET
4.12 TECHNOLOGICAL TRENDS
4.13 SUPPLY CHAIN ANALYSIS
4.13.1 RAW MATERIALS AND FOUNDATIONAL INPUTS
4.13.2 CORE COMPONENT MANUFACTURING
4.13.3 SENSORS, ELECTRONICS, AND SUBSYSTEMS
4.13.4 SOFTWARE, AUTONOMY, AND CONTROL SYSTEMS
4.13.5 SYSTEM INTEGRATION AND FINAL ASSEMBLY
4.13.6 DISTRIBUTION, DEPLOYMENT, AND LIFECYCLE SUPPORT
5 REGULATORY STANDARDS
5.1 DEFENSE AND MILITARY PROCUREMENT FRAMEWORKS
5.1.1 NATIONAL DEFENSE ACQUISITION SYSTEMS
5.1.2 REGULATIONS ON WEAPONIZATION AND AUTONOMOUS ENGAGEMENT
5.2 SAFETY AND OPERATIONAL COMPLIANCE STANDARDS
5.2.1 INTERNATIONAL ROBOTICS AND FUNCTIONAL SAFETY STANDARDS
5.2.2 SECTOR-SPECIFIC OPERATIONAL SAFETY REQUIREMENTS
5.3 COMMUNICATION, SPECTRUM, AND CYBERSECURITY REGULATIONS
5.3.1 RADIOFREQUENCY SPECTRUM GOVERNANCE
5.3.2 CYBERSECURITY AND ENCRYPTION COMPLIANCE
5.4 ARTIFICIAL INTELLIGENCE, AUTONOMY AND ETHICAL GOVERNANCE
5.4.1 INTERNATIONAL AI PRINCIPLES AND HUMAN-CONTROL REQUIREMENTS
5.4.2 NATIONAL AND REGIONAL AI REGULATORY POLICIES
5.5 EXPORT CONTROL AND CROSS-BORDER TRADE REGULATIONS
5.5.1 CONTROL OF DUAL-USE TECHNOLOGIES
5.5.2 SANCTIONS AND MARKET ACCESS LIMITATIONS
5.6 CERTIFICATION, TESTING, AND FIELD DEPLOYMENT STANDARDS
5.6.1 DEFENSE OPERATIONAL TESTING AND EVALUATION
5.6.2 INDUSTRIAL AND COMMERCIAL COMPLIANCE PATHWAYS
5.7 CONCLUSION
6 MARKET OVERVIEW
6.1 DRIVER
6.1.1 DEFENCE MODERNIZATION PROGRAMS ACCELERATING ASIA-PACIFIC UGV PROCUREMENT MOMENTUM
6.1.2 ADVANCEMENTS IN AI AND SENSORS ENABLING HIGHER-AUTONOMY CAPABILITIES
6.1.3 EXPANDING COMMERCIAL ADOPTION ACROSS MINING, AGRICULTURE, AND LOGISTICS
6.1.4 GROWING USAGE OF UNMANNED GROUND VEHICLES IN AREAS AFFECTED BY CBRN ATTACKS
6.2 RESTRAINT
6.2.1 HIGH DEVELOPMENT AND INTEGRATION COSTS LIMITING WIDER DEPLOYMENT
6.2.2 EXPORT CONTROLS AND POLICY RESTRICTIONS CONSTRAINING ASIA-PACIFIC SALES
6.3 OPPORTUNITIES
6.3.1 MODULAR MISSION-PAYLOAD DESIGNS UNLOCKING DIVERSIFIED APPLICATION SEGMENTS OF UGV
6.3.2 EXPANDING ROLE OF UNMANNED SYSTEMS IN MULTI-DOMAIN OPERATIONS
6.3.3 AFTERMARKET SERVICE AND SOFTWARE EXPANDING UGV PROFITABILITY POTENTIAL
6.4 CHALLENGES
6.4.1 CYBERSECURITY VULNERABILITIES CREATING OPERATIONAL AND SAFETY RISKS
6.4.2 RELIABILITY ISSUES IN HARSH, CONTESTED, AND REMOTE ENVIRONMENTS
7 ASIA-PACIFIC UNMANNED GROUND VEHICLE MARKET, BY SIZE
7.1 OVERVIEW
7.2 MICRO UGVS (<10 LBS)
7.3 SMALL (10 - 200 LBS)
7.4 MEDIUM (200 - 500 LBS)
7.5 LARGE (500 – 1,000 LBS)
7.6 VERY LARGE (1,000 – 2,000 LBS)
7.7 EXTREMELY LARGE (>2,000 LBS)
7.8 ASIA-PACIFIC MICRO UGVS IN UNMANNED GROUND VEHICLE MARKET, BY REGION, 2019-2033 (USD THOUSAND)
7.8.1 ASIA-PACIFIC
7.8.2 EUROPE
7.8.3 NORTH AMERICA
7.8.4 SOUTH AMERICA
7.8.5 MIDDLE EAST & AFRICA
7.9 ASIA-PACIFIC SMALL IN UNMANNED GROUND VEHICLE MARKET, BY REGION, 2019-2033 (USD THOUSAND)
7.9.1 ASIA-PACIFIC
7.9.2 EUROPE
7.9.3 NORTH AMERICA
7.9.4 SOUTH AMERICA
7.9.5 MIDDLE EAST & AFRICA
7.1 ASIA-PACIFIC MEDIUM IN UNMANNED GROUND VEHICLE MARKET, BY REGION, 2019-2033 (USD THOUSAND)
7.10.1 ASIA-PACIFIC
7.10.2 EUROPE
7.10.3 NORTH AMERICA
7.10.4 SOUTH AMERICA
7.10.5 MIDDLE EAST & AFRICA
7.11 ASIA-PACIFIC LARGE IN UNMANNED GROUND VEHICLE MARKET, BY REGION, 2019-2033 (USD THOUSAND)
7.11.1 ASIA-PACIFIC
7.11.2 EUROPE
7.11.3 NORTH AMERICA
7.11.4 SOUTH AMERICA
7.11.5 MIDDLE EAST & AFRICA
7.12 ASIA-PACIFIC VERY LARGE IN UNMANNED GROUND VEHICLE MARKET, BY REGION, 2019-2033 (USD THOUSAND)
7.12.1 ASIA-PACIFIC
7.12.2 EUROPE
7.12.3 NORTH AMERICA
7.12.4 SOUTH AMERICA
7.12.5 MIDDLE EAST & AFRICA
7.13 ASIA-PACIFIC EXTREMELY LARGE IN UNMANNED GROUND VEHICLE MARKET, BY REGION, 2019-2033 (USD THOUSAND)
7.13.1 ASIA-PACIFIC
7.13.2 EUROPE
7.13.3 NORTH AMERICA
7.13.4 SOUTH AMERICA
7.13.5 MIDDLE EAST & AFRICA
8 ASIA-PACIFIC UNMANNED GROUND VEHICLE MARKET, BY SYSTEM
8.1 OVERVIEW
8.2 ASIA-PACIFIC UNMANNED GROUND VEHICLE MARKET, BY SYSTEM, 2019-2033 (USD THOUSAND)
8.2.1 PAYLOADS
8.2.2 CONTROLLER UNITS
8.2.3 POWER SYSTEM
8.2.4 NAVIGATION SYSTEM
8.2.5 CHASSIS SYSTEM
8.2.6 COMMUNICATION SYSTEM
8.2.7 OTHERS
8.3 ASIA-PACIFIC PAYLOAD IN UNMANNED GROUND VEHICLE MARKET, BY TYPE, 2019-2033 (USD THOUSAND)
8.3.1 CAMERAS
8.3.2 SENSORS
8.3.3 GPS ANTENNAS
8.3.4 LASERS
8.3.5 RADARS
8.3.6 MOTOR ENCODERS
8.3.7 ARTICULATED ARMS
8.3.8 OTHERS
8.4 ASIA-PACIFIC PAYLOAD IN UNMANNED GROUND VEHICLE MARKET, BY REGION, 2019-2033 (USD THOUSAND)
8.4.1 ASIA-PACIFIC
8.4.2 EUROPE
8.4.3 NORTH AMERICA
8.4.4 SOUTH AMERICA
8.4.5 MIDDLE EAST & AFRICA
8.5 ASIA-PACIFIC CONTROLLER IN UNMANNED GROUND VEHICLE MARKET, BY REGION, 2019-2033 (USD THOUSAND)
8.5.1 ASIA-PACIFIC
8.5.2 EUROPE
8.5.3 NORTH AMERICA
8.5.4 SOUTH AMERICA
8.5.5 MIDDLE EAST & AFRICA
8.6 ASIA-PACIFIC POWER SYSTEM IN UNMANNED GROUND VEHICLE MARKET, BY TYPE, 2019-2033 (USD THOUSAND)
8.6.1 ELECTRIC NON SOLAR RECHARGEABLE BATTERY
8.6.2 SOLAR RECHARGEABLE BATTERY
8.7 ASIA-PACIFIC ELECTRIC NON SOLAR RECHARGABLE IN UNMANNED GROUND VEHICLE MARKET, BY TYPE, 2019-2033 (USD THOUSAND)
8.7.1 LITHIUM ION
8.7.2 LEAD ACID
8.7.3 NICKEL METAL HYDRIDE
8.7.4 NICKEL CADMIUM
8.8 ASIA-PACIFIC POWER SYSTEM IN UNMANNED GROUND VEHICLE MARKET, BY REGION, 2019-2033 (USD THOUSAND)
8.8.1 ASIA-PACIFIC
8.8.2 EUROPE
8.8.3 NORTH AMERICA
8.8.4 SOUTH AMERICA
8.8.5 MIDDLE EAST & AFRICA
8.9 ASIA-PACIFIC NAVIGATION SYSTEM IN UNMANNED GROUND VEHICLE MARKET, BY REGION, 2019-2033 (USD THOUSAND)
8.9.1 ASIA-PACIFIC
8.9.2 EUROPE
8.9.3 NORTH AMERICA
8.9.4 SOUTH AMERICA
8.9.5 MIDDLE EAST & AFRICA
8.1 ASIA-PACIFIC CHASSIS SYSTEM IN UNMANNED GROUND VEHICLE MARKET, BY TYPE, 2019-2033 (USD THOUSAND)
8.10.1 MOTOR
8.10.2 ACTUATOR
8.11 ASIA-PACIFIC CHASSIS SYSTEM IN UNMANNED GROUND VEHICLE MARKET, BY REGION, 2019-2033 (USD THOUSAND)
8.11.1 ASIA-PACIFIC
8.11.2 EUROPE
8.11.3 NORTH AMERICA
8.11.4 SOUTH AMERICA
8.11.5 MIDDLE EAST & AFRICA
8.12 ASIA-PACIFIC COMMUNICATION SYSTEM IN UNMANNED GROUND VEHICLE MARKET, BY TYPE, 2019-2033 (USD THOUSAND)
8.12.1 RF COMMUNICATION
8.12.2 SATELLITE COMMUNICATION
8.12.3 4G/5G COMMUNICATION
8.13 ASIA-PACIFIC COMMUNICATION SYSTEM IN UNMANNED GROUND VEHICLE MARKET, BY REGION, 2019-2033 (USD THOUSAND)
8.13.1 ASIA-PACIFIC
8.13.2 EUROPE
8.13.3 NORTH AMERICA
8.13.4 SOUTH AMERICA
8.13.5 MIDDLE EAST & AFRICA
8.14 ASIA-PACIFIC OTHERS IN UNMANNED GROUND VEHICLE MARKET, BY REGION, 2019-2033 (USD THOUSAND)
8.14.1 ASIA-PACIFIC
8.14.2 EUROPE
8.14.3 NORTH AMERICA
8.14.4 SOUTH AMERICA
8.14.5 MIDDLE EAST & AFRICA
9 ASIA-PACIFIC UNMANNED GROUND VEHICLE MARKET, BY MOBILITY
9.1 OVERVIEW
9.2 ASIA-PACIFIC UNMANNED GROUND VEHICLE MARKET, BY MOBILITY, 2019-2033 (USD THOUSAND)
9.2.1 WHEELED
9.2.2 TRACKED
9.2.3 LEGGED
9.2.4 HYBRID
9.2.5 SNAKE/ARTICULATED MOBILITY
9.3 ASIA-PACIFIC WHEELED IN UNMANNED GROUND VEHICLE MARKET, BY REGION, 2019-2033 (USD THOUSAND)
9.3.1 ASIA-PACIFIC
9.3.2 EUROPE
9.3.3 NORTH AMERICA
9.3.4 SOUTH AMERICA
9.3.5 MIDDLE EAST & AFRICA
9.4 ASIA-PACIFIC TRACKED IN UNMANNED GROUND VEHICLE MARKET, BY REGION, 2019-2033 (USD THOUSAND)
9.4.1 ASIA-PACIFIC
9.4.2 EUROPE
9.4.3 NORTH AMERICA
9.4.4 SOUTH AMERICA
9.4.5 MIDDLE EAST & AFRICA
9.5 ASIA-PACIFIC LEGGED IN UNMANNED GROUND VEHICLE MARKET, BY REGION, 2019-2033 (USD THOUSAND)
9.5.1 ASIA-PACIFIC
9.5.2 EUROPE
9.5.3 NORTH AMERICA
9.5.4 SOUTH AMERICA
9.5.5 MIDDLE EAST & AFRICA
9.6 ASIA-PACIFIC HYBRID IN UNMANNED GROUND VEHICLE MARKET, BY REGION, 2019-2033 (USD THOUSAND)
9.6.1 ASIA-PACIFIC
9.6.2 EUROPE
9.6.3 NORTH AMERICA
9.6.4 SOUTH AMERICA
9.6.5 MIDDLE EAST & AFRICA
9.7 ASIA-PACIFIC SNAKE/ARTICULATED MOBILITY IN UNMANNED GROUND VEHICLE MARKET, BY REGION, 2019-2033 (USD THOUSAND)
9.7.1 ASIA-PACIFIC
9.7.2 EUROPE
9.7.3 NORTH AMERICA
9.7.4 SOUTH AMERICA
9.7.5 MIDDLE EAST & AFRICA
10 ASIA-PACIFIC UNMANNED GROUND VEHICLE MARKET, BY MODE OF OPERATION
10.1 OVERVIEW
10.2 ASIA-PACIFIC UNMANNED GROUND VEHICLE MARKET, BY MODE OF OPERATION, 2019-2033 (USD THOUSAND)
10.2.1 TELEOPERATED
10.2.2 TETHERED
10.2.3 AUTONOMOUS
10.3 ASIA-PACIFIC TELEOPERATED IN UNMANNED GROUND VEHICLE MARKET, BY REGION, 2019-2033 (USD THOUSAND)
10.3.1 ASIA-PACIFIC
10.3.2 EUROPE
10.3.3 NORTH AMERICA
10.3.4 SOUTH AMERICA
10.3.5 MIDDLE EAST & AFRICA
10.4 ASIA-PACIFIC TETHERED IN UNMANNED GROUND VEHICLE MARKET, BY REGION, 2019-2033 (USD THOUSAND)
10.4.1 ASIA-PACIFIC
10.4.2 EUROPE
10.4.3 NORTH AMERICA
10.4.4 SOUTH AMERICA
10.4.5 MIDDLE EAST & AFRICA
10.5 ASIA-PACIFIC AUTONOMOUS IN UNMANNED GROUND VEHICLE MARKET, BY TYPE, 2019-2033 (USD THOUSAND)
10.5.1 SEMI-AUTONOMOUS
10.5.2 FULLY AUTONOMOUS
10.6 ASIA-PACIFIC AUTONOMOUS IN UNMANNED GROUND VEHICLE MARKET, BY REGION, 2019-2033 (USD THOUSAND)
10.6.1 ASIA-PACIFIC
10.6.2 EUROPE
10.6.3 NORTH AMERICA
10.6.4 SOUTH AMERICA
10.6.5 MIDDLE EAST & AFRICA
11 ASIA-PACIFIC UNMANNED GROUND VEHICLE MARKET, BY PAYLOAD
11.1 OVERVIEW
11.2 ASIA-PACIFIC UNMANNED GROUND VEHICLE MARKET, BY PAYLOAD, 2019-2033 (USD THOUSAND)
11.2.1 LIGHT DUTY (LESS THAN 50 KG
11.2.2 MEDIUM DUTY (50–200 KG)
11.2.3 HEAVY DUTY (200–1,000 KG)
11.2.4 ULTRA-HEAVY DUTY (>1,000 KG)
11.3 ASIA-PACIFIC LIGHT DUTY IN UNMANNED GROUND VEHICLE MARKET, BY REGION, 2019-2033 (USD THOUSAND)
11.3.1 ASIA-PACIFIC
11.3.2 EUROPE
11.3.3 NORTH AMERICA
11.3.4 SOUTH AMERICA
11.3.5 MIDDLE EAST & AFRICA
11.4 ASIA-PACIFIC MEDIUM DUTY IN UNMANNED GROUND VEHICLE MARKET, BY REGION, 2019-2033 (USD THOUSAND)
11.4.1 ASIA-PACIFIC
11.4.2 EUROPE
11.4.3 NORTH AMERICA
11.4.4 SOUTH AMERICA
11.4.5 MIDDLE EAST & AFRICA
11.5 ASIA-PACIFIC HEAVY DUTY IN UNMANNED GROUND VEHICLE MARKET, BY REGION, 2019-2033 (USD THOUSAND)
11.5.1 ASIA-PACIFIC
11.5.2 EUROPE
11.5.3 NORTH AMERICA
11.5.4 SOUTH AMERICA
11.5.5 MIDDLE EAST & AFRICA
11.6 ASIA-PACIFIC ULTRA HEAVY DUTY IN UNMANNED GROUND VEHICLE MARKET, BY REGION, 2019-2033 (USD THOUSAND)
11.6.1 ASIA-PACIFIC
11.6.2 EUROPE
11.6.3 NORTH AMERICA
11.6.4 SOUTH AMERICA
11.6.5 MIDDLE EAST & AFRICA
12 ASIA-PACIFIC UNMANNED GROUND VEHICLE MARKET, BY PROPULSION
12.1 OVERVIEW
12.2 ASIA-PACIFIC UNMANNED GROUND VEHICLE MARKET, BY PROPULSION, 2019-2033 (USD THOUSAND)
12.2.1 ELECTRIC
12.2.2 HYBRID
12.2.3 DIESEL/GASOLINE POWERED
12.2.4 HYDROGEN FUEL CELL UGVS
12.2.5 SOLAR-ASSISTED UGVS
12.3 ASIA-PACIFIC ELECTRIC IN UNMANNED GROUND VEHICLE MARKET, BY REGION, 2019-2033 (USD THOUSAND)
12.3.1 ASIA-PACIFIC
12.3.2 EUROPE
12.3.3 NORTH AMERICA
12.3.4 SOUTH AMERICA
12.3.5 MIDDLE EAST & AFRICA
12.4 ASIA-PACIFIC HYBRID IN UNMANNED GROUND VEHICLE MARKET, BY REGION, 2019-2033 (USD THOUSAND)
12.4.1 ASIA-PACIFIC
12.4.2 EUROPE
12.4.3 NORTH AMERICA
12.4.4 SOUTH AMERICA
12.4.5 MIDDLE EAST & AFRICA
12.5 ASIA-PACIFIC DIESEL/GASOLINE POWERED IN UNMANNED GROUND VEHICLE MARKET, BY REGION, 2019-2033 (USD THOUSAND)
12.5.1 ASIA-PACIFIC
12.5.2 EUROPE
12.5.3 NORTH AMERICA
12.5.4 SOUTH AMERICA
12.5.5 MIDDLE EAST & AFRICA
12.6 ASIA-PACIFIC HYDROGEN FUEL CELL UGVS IN UNMANNED GROUND VEHICLE MARKET, BY REGION, 2019-2033 (USD THOUSAND)
12.6.1 ASIA-PACIFIC
12.6.2 EUROPE
12.6.3 NORTH AMERICA
12.6.4 SOUTH AMERICA
12.6.5 MIDDLE EAST & AFRICA
12.7 ASIA-PACIFIC SOLAR ASSISTED UGVS IN UNMANNED GROUND VEHICLE MARKET, BY REGION, 2019-2033 (USD THOUSAND)
12.7.1 ASIA-PACIFIC
12.7.2 EUROPE
12.7.3 NORTH AMERICA
12.7.4 SOUTH AMERICA
12.7.5 MIDDLE EAST & AFRICA
13 ASIA-PACIFIC UNMANNED GROUND VEHICLE MARKET, BY APPLICATION
13.1 OVERVIEW
13.2 ASIA-PACIFIC UNMANNED GROUND VEHICLE MARKET, BY APPLICATION, 2019-2033 (USD THOUSAND)
13.2.1 COMMERCIAL
13.2.2 MILITARY
13.2.3 FEDERAL LAW ENFORCEMENT
13.2.4 LAW ENFORCEMENT
13.3 ASIA-PACIFIC COMMERCIAL IN UNMANNED GROUND VEHICLE MARKET, BY TYPE, 2019-2033 (USD THOUSAND)
13.3.1 FIREFIGHTING
13.3.2 AUTONOMOUS DELIVERY
13.3.3 CBRN
13.3.4 PHYSICAL SECURITY
13.3.5 AGRICULTURE
13.3.6 DOMESTIC
13.3.7 OIL & GAS
13.3.8 WAREHOUSE & LOGISTICS
13.3.9 OTHERS
13.4 ASIA-PACIFIC AGRICULTURE IN UNMANNED GROUND VEHICLE MARKET, BY TYPE, 2019-2033 (USD THOUSAND)
13.4.1 SPRAYING
13.4.2 MOWING
13.4.3 TILLING
13.5 ASIA-PACIFIC OIL & GAS IN UNMANNED GROUND VEHICLE MARKET, BY TYPE, 2019-2033 (USD THOUSAND)
13.5.1 INSPECTION
13.5.2 HAULAGE
13.6 ASIA-PACIFIC WAREHOUSE & LOGISTICS IN UNMANNED GROUND VEHICLE MARKET, BY TYPE, 2019-2033 (USD THOUSAND)
13.6.1 SORTING ROBOTS
13.6.2 PALLET MOVERS
13.7 ASIA-PACIFIC COMMERCIAL IN UNMANNED GROUND VEHICLE MARKET, BY REGION, 2019-2033 (USD THOUSAND)
13.7.1 ASIA-PACIFIC
13.7.2 EUROPE
13.7.3 NORTH AMERICA
13.7.4 SOUTH AMERICA
13.7.5 MIDDLE EAST & AFRICA
13.8 ASIA-PACIFIC MILITARY IN UNMANNED GROUND VEHICLE MARKET, BY TYPE, 2019-2033 (USD THOUSAND)
13.8.1 TRANSPORTATION
13.8.2 INTELLIGENCE, SURVEILLANCE, AND RECONNAISSANCE (ISR)
13.8.3 EXPLOSIVE ORDNANCE DISPOSAL
13.8.4 SEARCH & RESCUE
13.8.5 FIREFIGHTING
13.8.6 COMBAT SUPPORT
13.8.7 MINE CLEARANCE
13.8.8 OTHERS
13.9 ASIA-PACIFIC MILITARY IN UNMANNED GROUND VEHICLE MARKET, BY REGION, 2019-2033 (USD THOUSAND)
13.9.1 ASIA-PACIFIC
13.9.2 EUROPE
13.9.3 NORTH AMERICA
13.9.4 SOUTH AMERICA
13.9.5 MIDDLE EAST & AFRICA
13.1 ASIA-PACIFIC FEDERAL LAW ENFORCEMENT IN UNMANNED GROUND VEHICLE MARKET, BY REGION, 2019-2033 (USD THOUSAND)
13.10.1 ASIA-PACIFIC
13.10.2 EUROPE
13.10.3 NORTH AMERICA
13.10.4 SOUTH AMERICA
13.10.5 MIDDLE EAST & AFRICA
13.11 ASIA-PACIFIC LAW ENFORCEMENT IN UNMANNED GROUND VEHICLE MARKET, BY TYPE, 2019-2033 (USD THOUSAND)
13.11.1 BOMB DISPOSAL UNITS
13.11.2 RIOT CONTROL ROBOTS
13.11.3 URBAN SURVEILLANCE ROBOTS
13.12 ASIA-PACIFIC LAW ENFORCEMENT IN UNMANNED GROUND VEHICLE MARKET, BY REGION, 2019-2033 (USD THOUSAND)
13.12.1 ASIA-PACIFIC
13.12.2 EUROPE
13.12.3 NORTH AMERICA
13.12.4 SOUTH AMERICA
13.12.5 MIDDLE EAST & AFRICA
14 ASIA-PACIFIC UNMANNED GROUND VEHICLE MARKET, BY REGION
14.1 ASIA-PACIFIC
14.1.1 JAPAN
14.1.2 CHINA
14.1.3 SOUTH KOREA
14.1.4 INDIA
14.1.5 AUSTRALIA
14.1.6 SINGAPORE
14.1.7 THAILAND
14.1.8 MALAYSIA
14.1.9 INDONESIA
14.1.10 PHILIPPINES
14.1.11 NEW ZEALAND
14.1.12 VIETNAM
14.1.13 TAIWAN
14.1.14 REST OF ASIA-PACIFIC
15 ASIA-PACIFIC UNMANNED GROUND VEHICLE MARKET
15.1 COMPANY SHARE ANALYSIS: GLOBAL
16 SWOT ANALYSIS
17 COMPANY PROFILE
17.1 GENERAL DYNAMICS LAND SYSTEMS
17.1.1 COMPANY SNAPSHOT
17.1.2 COMPANY SHARE ANALYSIS
17.1.3 PRODUCT PORTFOLIO
17.1.4 RECENT DEVELOPMENT
17.2 RHEINMETALL AG
17.2.1 COMPANY SNAPSHOT
17.2.2 REVENUE ANALYSIS
17.2.3 COMPANY SHARE ANALYSIS
17.2.4 PRODUCT PORTFOLIO
17.2.5 RECENT DEVELOPMENT
17.3 ELBIT SYSTEMS LTD.
17.3.1 COMPANY SNAPSHOT
17.3.2 REVENUE ANALYSIS
17.3.3 COMPANY SHARE ANALYSIS
17.3.4 PRODUCT PORTFOLIO
17.3.5 RECENT DEVELOPMENT
17.4 TEXTRON SYSTEMS
17.4.1 COMPANY SNAPSHOT
17.4.2 COMPANY SHARE ANALYSIS
17.4.3 PRODUCT PORTFOLIO
17.4.4 RECENT DEVELOPMENT
17.5 THALES
17.5.1 COMPANY SNAPSHOT
17.5.2 REVENUE ANALYSIS
17.5.3 COMPANY SHARE ANALYSIS
17.5.4 PRODUCT PORTFOLIO
17.5.5 RECENT DEVELOPMENT
17.6 AEROVIRONMENT, INC
17.6.1 COMPANY SNAPSHOT
17.6.2 REVENUE ANALYSIS
17.6.3 PRODUCT PORTFOLIO
17.6.4 RECENT DEVELOPMENT
17.7 ASELSAN A.Ş.
17.7.1 COMPANY SNAPSHOT
17.7.2 REVENUE ANALYSIS
17.7.3 PRODUCT PORTFOLIO
17.7.4 RECENT DEVELOPMENT
17.8 DOK-ING
17.8.1 COMPANY SNAPSHOT
17.8.2 PRODUCT PORTFOLIO
17.8.3 RECENT DEVELOPMENT
17.9 EDGEFORCE
17.9.1 COMPANY SNAPSHOT
17.9.2 PRODUCT PORTFOLIO
17.9.3 RECENT DEVELOPMENT
17.1 GHOSTROBOTICS.
17.10.1 COMPANY SNAPSHOT
17.10.2 PRODUCT PORTFOLIO
17.10.3 RECENT DEVELOPMENT
17.11 HANWHA AEROSPACE
17.11.1 COMPANY SNAPSHOT
17.11.2 REVENUE ANALYSIS
17.11.3 PRODUCT PORTFOLIO
17.11.4 RECENT DEVELOPMENT
17.12 HYUNDAI ROTEM COMPANY.
17.12.1 COMPANY SNAPSHOT
17.12.2 REVENUE ANALYSIS
17.12.3 PRODUCT PORTFOLIO
17.12.4 RECENT DEVELOPMENT
17.13 IAI
17.13.1 COMPANY SNAPSHOT
17.13.2 PRODUCT PORTFOLIO
17.13.3 RECENT DEVELOPMENT
17.14 LEONARDO S.P.A.
17.14.1 COMPANY SNAPSHOT
17.14.2 REVENUE ANALYSIS
17.14.3 PRODUCT PORTFOLIO
17.14.4 RECENT DEVELOPMENT
17.15 MILREM AS
17.15.1 COMPANY SNAPSHOT
17.15.2 PRODUCT PORTFOLIO
17.15.3 RECENT DEVELOPMENT
17.16 PERATON
17.16.1 COMPANY SNAPSHOT
17.16.2 PRODUCT PORTFOLIO
17.16.3 RECENT DEVELOPMENT
17.17 QINETIQ
17.17.1 COMPANY SNAPSHOT
17.17.2 REVENUE ANALYSIS
17.17.3 PRODUCT PORTFOLIO
17.17.4 RECENT DEVELOPMENT
17.18 ROBOTEAM
17.18.1 COMPANY SNAPSHOT
17.18.2 PRODUCT PORTFOLIO
17.18.3 RECENT DEVELOPMENT
17.19 ST ENGINEERING
17.19.1 COMPANY SNAPSHOT
17.19.2 REVENUE ANALYSIS
17.19.3 PRODUCT PORTFOLIO
17.19.4 RECENT DEVELOPMENT
17.2 TELEDYNE FLIR DEFENSE INC.
17.20.1 COMPANY SNAPSHOT
17.20.2 REVENUE ANALYSIS
17.20.3 PRODUCT PORTFOLIO
17.20.4 RECENT DEVELOPMENT
18 QUESTIONNAIRE
19 RELATED REPORTS
List of Table
TABLE 1 COMPANY COMPARATIVE ANALYSIS
TABLE 2 TECHNOLOGICAL DEVELOPMENT
TABLE 3 ASIA-PACIFIC UNMANNED GROUND VEHICLE MARKET, BY SIZE, 2019-2033 (USD THOUSAND)
TABLE 4 ASIA-PACIFIC MICRO UGVS IN UNMANNED GROUND VEHICLE MARKET, BY REGION, 2019-2033 (USD THOUSAND)
TABLE 5 ASIA-PACIFIC SMALL IN UNMANNED GROUND VEHICLE MARKET, BY REGION, 2019-2033 (USD THOUSAND)
TABLE 6 ASIA-PACIFIC MEDIUM IN UNMANNED GROUND VEHICLE MARKET, BY REGION, 2019-2033 (USD THOUSAND)
TABLE 7 ASIA-PACIFIC LARGE IN UNMANNED GROUND VEHICLE MARKET, BY REGION, 2019-2033 (USD THOUSAND)
TABLE 8 ASIA-PACIFIC VERY LARGE IN UNMANNED GROUND VEHICLE MARKET, BY REGION, 2019-2033 (USD THOUSAND)
TABLE 9 ASIA-PACIFIC EXTREMELY LARGE IN UNMANNED GROUND VEHICLE MARKET, BY REGION, 2019-2033 (USD THOUSAND)
TABLE 10 ASIA-PACIFIC UNMANNED GROUND VEHICLE MARKET, BY SYSTEM, 2019-2033 (USD THOUSAND)
TABLE 11 ASIA-PACIFIC PAYLOAD IN UNMANNED GROUND VEHICLE MARKET, BY TYPE, 2019-2033 (USD THOUSAND)
TABLE 12 ASIA-PACIFIC PAYLOAD IN UNMANNED GROUND VEHICLE MARKET, BY REGION, 2019-2033 (USD THOUSAND)
TABLE 13 ASIA-PACIFIC CONTROLLER IN UNMANNED GROUND VEHICLE MARKET, BY REGION, 2019-2033 (USD THOUSAND)
TABLE 14 ASIA-PACIFIC POWER SYSTEM IN UNMANNED GROUND VEHICLE MARKET, BY TYPE, 2019-2033 (USD THOUSAND)
TABLE 15 ASIA-PACIFIC ELECTRIC NON SOLAR RECHARGABLE IN UNMANNED GROUND VEHICLE MARKET, BY TYPE, 2019-2033 (USD THOUSAND)
TABLE 16 ASIA-PACIFIC POWER SYSTEM IN UNMANNED GROUND VEHICLE MARKET, BY REGION, 2019-2033 (USD THOUSAND)
TABLE 17 ASIA-PACIFIC NAVIGATION SYSTEM IN UNMANNED GROUND VEHICLE MARKET, BY REGION, 2019-2033 (USD THOUSAND)
TABLE 18 ASIA-PACIFIC CHASSIS SYSTEM IN UNMANNED GROUND VEHICLE MARKET, BY TYPE, 2019-2033 (USD THOUSAND)
TABLE 19 ASIA-PACIFIC CHASSIS SYSTEM IN UNMANNED GROUND VEHICLE MARKET, BY REGION, 2019-2033 (USD THOUSAND)
TABLE 20 ASIA-PACIFIC COMMUNICATION SYSTEM IN UNMANNED GROUND VEHICLE MARKET, BY TYPE, 2019-2033 (USD THOUSAND)
TABLE 21 ASIA-PACIFIC COMMUNICATION SYSTEM IN UNMANNED GROUND VEHICLE MARKET, BY REGION, 2019-2033 (USD THOUSAND)
TABLE 22 ASIA-PACIFIC OTHERS IN UNMANNED GROUND VEHICLE MARKET, BY REGION, 2019-2033 (USD THOUSAND)
TABLE 23 ASIA-PACIFIC UNMANNED GROUND VEHICLE MARKET, BY MOBILITY, 2019-2033 (USD THOUSAND)
TABLE 24 ASIA-PACIFIC WHEELED IN UNMANNED GROUND VEHICLE MARKET, BY REGION, 2019-2033 (USD THOUSAND)
TABLE 25 ASIA-PACIFIC TRACKED IN UNMANNED GROUND VEHICLE MARKET, BY REGION, 2019-2033 (USD THOUSAND)
TABLE 26 ASIA-PACIFIC LEGGED IN UNMANNED GROUND VEHICLE MARKET, BY REGION, 2019-2033 (USD THOUSAND)
TABLE 27 ASIA-PACIFIC HYBRID IN UNMANNED GROUND VEHICLE MARKET, BY REGION, 2019-2033 (USD THOUSAND)
TABLE 28 ASIA-PACIFIC SNAKE/ARTICULATED MOBILITY IN UNMANNED GROUND VEHICLE MARKET, BY REGION, 2019-2033 (USD THOUSAND)
TABLE 29 ASIA-PACIFIC UNMANNED GROUND VEHICLE MARKET, BY MODE OF OPERATION, 2019-2033 (USD THOUSAND)
TABLE 30 ASIA-PACIFIC TELEOPERATED IN UNMANNED GROUND VEHICLE MARKET, BY REGION, 2019-2033 (USD THOUSAND)
TABLE 31 ASIA-PACIFIC TETHERED IN UNMANNED GROUND VEHICLE MARKET, BY REGION, 2019-2033 (USD THOUSAND)
TABLE 32 ASIA-PACIFIC AUTONOMOUS IN UNMANNED GROUND VEHICLE MARKET, BY TYPE, 2019-2033 (USD THOUSAND)
TABLE 33 ASIA-PACIFIC AUTONOMOUS IN UNMANNED GROUND VEHICLE MARKET, BY REGION, 2019-2033 (USD THOUSAND)
TABLE 34 ASIA-PACIFIC UNMANNED GROUND VEHICLE MARKET, BY PAYLOAD, 2019-2033 (USD THOUSAND)
TABLE 35 ASIA-PACIFIC LIGHT DUTY IN UNMANNED GROUND VEHICLE MARKET, BY REGION, 2019-2033 (USD THOUSAND)
TABLE 36 ASIA-PACIFIC MEDIUM DUTY IN UNMANNED GROUND VEHICLE MARKET, BY REGION, 2019-2033 (USD THOUSAND)
TABLE 37 ASIA-PACIFIC HEAVY DUTY IN UNMANNED GROUND VEHICLE MARKET, BY REGION, 2019-2033 (USD THOUSAND)
TABLE 38 ASIA-PACIFIC ULTRA HEAVY DUTY IN UNMANNED GROUND VEHICLE MARKET, BY REGION, 2019-2033 (USD THOUSAND)
TABLE 39 ASIA-PACIFIC UNMANNED GROUND VEHICLE MARKET, BY PROPULSION, 2019-2033 (USD THOUSAND)
TABLE 40 ASIA-PACIFIC ELECTRIC IN UNMANNED GROUND VEHICLE MARKET, BY REGION, 2019-2033 (USD THOUSAND)
TABLE 41 ASIA-PACIFIC HYBRID IN UNMANNED GROUND VEHICLE MARKET, BY REGION, 2019-2033 (USD THOUSAND)
TABLE 42 ASIA-PACIFIC DIESEL/GASOLINE POWERED IN UNMANNED GROUND VEHICLE MARKET, BY REGION, 2019-2033 (USD THOUSAND)
TABLE 43 ASIA-PACIFIC HYDROGEN FUEL CELL UGVS IN UNMANNED GROUND VEHICLE MARKET, BY REGION, 2019-2033 (USD THOUSAND)
TABLE 44 ASIA-PACIFIC SOLAR ASSISTED UGVS IN UNMANNED GROUND VEHICLE MARKET, BY REGION, 2019-2033 (USD THOUSAND)
TABLE 45 ASIA-PACIFIC UNMANNED GROUND VEHICLE MARKET, BY APPLICATION, 2019-2033 (USD THOUSAND)
TABLE 46 ASIA-PACIFIC COMMERCIAL IN UNMANNED GROUND VEHICLE MARKET, BY TYPE, 2019-2033 (USD THOUSAND)
TABLE 47 ASIA-PACIFIC AGRICULTURE IN UNMANNED GROUND VEHICLE MARKET, BY TYPE, 2019-2033 (USD THOUSAND)
TABLE 48 ASIA-PACIFIC OIL & GAS IN UNMANNED GROUND VEHICLE MARKET, BY TYPE, 2019-2033 (USD THOUSAND)
TABLE 49 ASIA-PACIFIC WAREHOUSE & LOGISTICS IN UNMANNED GROUND VEHICLE MARKET, BY TYPE, 2019-2033 (USD THOUSAND)
TABLE 50 ASIA-PACIFIC COMMERCIAL IN UNMANNED GROUND VEHICLE MARKET, BY REGION, 2019-2033 (USD THOUSAND)
TABLE 51 ASIA-PACIFIC MILITARY IN UNMANNED GROUND VEHICLE MARKET, BY TYPE, 2019-2033 (USD THOUSAND)
TABLE 52 ASIA-PACIFIC MILITARY IN UNMANNED GROUND VEHICLE MARKET, BY REGION, 2019-2033 (USD THOUSAND)
TABLE 53 ASIA-PACIFIC FEDERAL LAW ENFORCEMENT IN UNMANNED GROUND VEHICLE MARKET, BY REGION, 2019-2033 (USD THOUSAND)
TABLE 54 ASIA-PACIFIC LAW ENFORCEMENT IN UNMANNED GROUND VEHICLE MARKET, BY TYPE, 2019-2033 (USD THOUSAND)
TABLE 55 ASIA-PACIFIC LAW ENFORCEMENT IN UNMANNED GROUND VEHICLE MARKET, BY REGION, 2019-2033 (USD THOUSAND)
TABLE 56 ASIA-PACIFIC
TABLE 57 ASIA-PACIFIC UNMANNED GROUND VEHICLE MARKET, BY COUNTRY, 2019-2033 (USD THOUSAND)
TABLE 58 ASIA-PACIFIC
TABLE 59 ASIA-PACIFIC UNMANNED GROUND VEHICLE MARKET, BY SIZE, 2019-2033 (USD THOUSAND)
TABLE 60 ASIA-PACIFIC UNMANNED GROUND VEHICLE MARKET, BY SYSTEM, 2019-2033 (USD THOUSAND)
TABLE 61 ASIA-PACIFIC PAYLOAD IN UNMANNED GROUND VEHICLE MARKET, BY TYPE, 2019-2033 (USD THOUSAND)
TABLE 62 ASIA-PACIFIC POWER SYSTEM IN UNMANNED GROUND VEHICLE MARKET, BY TYPE, 2019-2033 (USD THOUSAND)
TABLE 63 ASIA-PACIFIC ELECTRIC NON SOLAR RECHARGABLE IN UNMANNED GROUND VEHICLE MARKET, BY TYPE, 2019-2033 (USD THOUSAND)
TABLE 64 ASIA-PACIFIC CHASSIS SYSTEM IN UNMANNED GROUND VEHICLE MARKET, BY TYPE, 2019-2033 (USD THOUSAND)
TABLE 65 ASIA-PACIFIC COMMUNICATION SYSTEM IN UNMANNED GROUND VEHICLE MARKET, BY TYPE, 2019-2033 (USD THOUSAND)
TABLE 66 ASIA-PACIFIC UNMANNED GROUND VEHICLE MARKET, BY MOBILITY, 2019-2033 (USD THOUSAND)
TABLE 67 ASIA-PACIFIC UNMANNED GROUND VEHICLE MARKET, BY MODE OF OPERATION, 2019-2033 (USD THOUSAND)
TABLE 68 ASIA-PACIFIC AUTONOMOUS IN UNMANNED GROUND VEHICLE MARKET, BY TYPE, 2019-2033 (USD THOUSAND)
TABLE 69 ASIA-PACIFIC UNMANNED GROUND VEHICLE MARKET, BY PAYLOAD, 2019-2033 (USD THOUSAND)
TABLE 70 ASIA-PACIFIC UNMANNED GROUND VEHICLE MARKET, BY PROPULSION, 2019-2033 (USD THOUSAND)
TABLE 71 ASIA-PACIFIC UNMANNED GROUND VEHICLE MARKET, BY APPLICATION, 2019-2033 (USD THOUSAND)
TABLE 72 ASIA-PACIFIC COMMERCIAL IN UNMANNED GROUND VEHICLE MARKET, BY TYPE, 2019-2033 (USD THOUSAND)
TABLE 73 ASIA-PACIFIC AGRICULTURE IN UNMANNED GROUND VEHICLE MARKET, BY TYPE, 2019-2033 (USD THOUSAND)
TABLE 74 ASIA-PACIFIC OIL & GAS IN UNMANNED GROUND VEHICLE MARKET, BY TYPE, 2019-2033 (USD THOUSAND)
TABLE 75 ASIA-PACIFIC WAREHOUSE & LOGISTICS IN UNMANNED GROUND VEHICLE MARKET, BY TYPE, 2019-2033 (USD THOUSAND)
TABLE 76 ASIA-PACIFIC MILITARY IN UNMANNED GROUND VEHICLE MARKET, BY TYPE, 2019-2033 (USD THOUSAND)
TABLE 77 ASIA-PACIFIC LAW ENFORCEMENT IN UNMANNED GROUND VEHICLE MARKET, BY TYPE, 2019-2033 (USD THOUSAND)
TABLE 78 JAPAN UNMANNED GROUND VEHICLE MARKET, BY SIZE, 2019-2033 (USD THOUSAND)
TABLE 79 JAPAN UNMANNED GROUND VEHICLE MARKET, BY SYSTEM, 2019-2033 (USD THOUSAND)
TABLE 80 JAPAN PAYLOAD IN UNMANNED GROUND VEHICLE MARKET, BY TYPE, 2019-2033 (USD THOUSAND)
TABLE 81 JAPAN POWER SYSTEM IN UNMANNED GROUND VEHICLE MARKET, BY POWER SYSTEM, 2019-2033 (USD THOUSAND)
TABLE 82 JAPAN ELECTRIC NON SOLAR RECHARGABLE BATTERY IN UNMANNED GROUND VEHICLE MARKET, BY POWER SYSTEM, 2019-2033 (USD THOUSAND)
TABLE 83 JAPAN CHASSIS IN UNMANNED GROUND VEHICLE MARKET, BY TYPE, 2019-2033 (USD THOUSAND)
TABLE 84 JAPAN COMMUNICATION SYSTEM IN UNMANNED GROUND VEHICLE MARKET, BY TYPE, 2019-2033 (USD THOUSAND)
TABLE 85 JAPAN UNMANNED GROUND VEHICLE MARKET, BY MOBILITY, 2019-2033 (USD THOUSAND)
TABLE 86 JAPAN UNMANNED GROUND VEHICLE MARKET, BY MODE OF OPERATION, 2019-2033 (USD THOUSAND)
TABLE 87 JAPAN AUTONOMOUS IN UNMANNED GROUND VEHICLE MARKET, BY TYPE, 2019-2033 (USD THOUSAND)
TABLE 88 JAPAN UNMANNED GROUND VEHICLE MARKET, BY PAYLOAD, 2019-2033 (USD THOUSAND)
TABLE 89 JAPAN UNMANNED GROUND VEHICLE MARKET, BY PROPULSION, 2019-2033 (USD THOUSAND)
TABLE 90 JAPAN UNMANNED GROUND VEHICLE MARKET, BY APPLICATION, 2019-2033 (USD THOUSAND)
TABLE 91 JAPAN COMMERCIAL IN UNMANNED GROUND VEHICLE MARKET, BY TYPE, 2019-2033 (USD THOUSAND)
TABLE 92 JAPAN AGRICULTURE IN UNMANNED GROUND VEHICLE MARKET, BY TYPE, 2019-2033 (USD THOUSAND)
TABLE 93 JAPAN OIL & GAS IN UNMANNED GROUND VEHICLE MARKET, BY TYPE, 2019-2033 (USD THOUSAND)
TABLE 94 JAPAN WAREHOUSE & LOGISTICS IN UNMANNED GROUND VEHICLE MARKET, BY TYPE, 2019-2033 (USD THOUSAND)
TABLE 95 JAPAN MILITARY IN UNMANNED GROUND VEHICLE MARKET, BY TYPE, 2019-2033 (USD THOUSAND)
TABLE 96 JAPAN LAW ENFORCEMENT IN UNMANNED GROUND VEHICLE MARKET, BY TYPE, 2019-2033 (USD THOUSAND)
TABLE 97 CHINA UNMANNED GROUND VEHICLE MARKET, BY SIZE, 2019-2033 (USD THOUSAND)
TABLE 98 CHINA UNMANNED GROUND VEHICLE MARKET, BY SYSTEM, 2019-2033 (USD THOUSAND)
TABLE 99 CHINA PAYLOAD IN UNMANNED GROUND VEHICLE MARKET, BY TYPE, 2019-2033 (USD THOUSAND)
TABLE 100 CHINA POWER SYSTEM IN UNMANNED GROUND VEHICLE MARKET, BY POWER SYSTEM, 2019-2033 (USD THOUSAND)
TABLE 101 CHINA ELECTRIC NON SOLAR RECHARGABLE BATTERY IN UNMANNED GROUND VEHICLE MARKET, BY POWER SYSTEM, 2019-2033 (USD THOUSAND)
TABLE 102 CHINA CHASSIS IN UNMANNED GROUND VEHICLE MARKET, BY TYPE, 2019-2033 (USD THOUSAND)
TABLE 103 CHINA COMMUNICATION SYSTEM IN UNMANNED GROUND VEHICLE MARKET, BY TYPE, 2019-2033 (USD THOUSAND)
TABLE 104 CHINA UNMANNED GROUND VEHICLE MARKET, BY MOBILITY, 2019-2033 (USD THOUSAND)
TABLE 105 CHINA UNMANNED GROUND VEHICLE MARKET, BY MODE OF OPERATION, 2019-2033 (USD THOUSAND)
TABLE 106 CHINA AUTONOMOUS IN UNMANNED GROUND VEHICLE MARKET, BY TYPE, 2019-2033 (USD THOUSAND)
TABLE 107 CHINA UNMANNED GROUND VEHICLE MARKET, BY PAYLOAD, 2019-2033 (USD THOUSAND)
TABLE 108 CHINA UNMANNED GROUND VEHICLE MARKET, BY PROPULSION, 2019-2033 (USD THOUSAND)
TABLE 109 CHINA UNMANNED GROUND VEHICLE MARKET, BY APPLICATION, 2019-2033 (USD THOUSAND)
TABLE 110 CHINA COMMERCIAL IN UNMANNED GROUND VEHICLE MARKET, BY TYPE, 2019-2033 (USD THOUSAND)
TABLE 111 CHINA AGRICULTURE IN UNMANNED GROUND VEHICLE MARKET, BY TYPE, 2019-2033 (USD THOUSAND)
TABLE 112 CHINA OIL & GAS IN UNMANNED GROUND VEHICLE MARKET, BY TYPE, 2019-2033 (USD THOUSAND)
TABLE 113 CHINA WAREHOUSE & LOGISTICS IN UNMANNED GROUND VEHICLE MARKET, BY TYPE, 2019-2033 (USD THOUSAND)
TABLE 114 CHINA MILITARY IN UNMANNED GROUND VEHICLE MARKET, BY TYPE, 2019-2033 (USD THOUSAND)
TABLE 115 CHINA LAW ENFORCEMENT IN UNMANNED GROUND VEHICLE MARKET, BY TYPE, 2019-2033 (USD THOUSAND)
TABLE 116 SOUTH KOREAUNMANNED GROUND VEHICLE MARKET, BY SIZE, 2019-2033 (USD THOUSAND)
TABLE 117 SOUTH KOREAUNMANNED GROUND VEHICLE MARKET, BY SYSTEM, 2019-2033 (USD THOUSAND)
TABLE 118 SOUTH KOREAPAYLOAD IN UNMANNED GROUND VEHICLE MARKET, BY TYPE, 2019-2033 (USD THOUSAND)
TABLE 119 SOUTH KOREAPOWER SYSTEM IN UNMANNED GROUND VEHICLE MARKET, BY POWER SYSTEM, 2019-2033 (USD THOUSAND)
TABLE 120 SOUTH KOREAELECTRIC NON SOLAR RECHARGABLE BATTERY IN UNMANNED GROUND VEHICLE MARKET, BY POWER SYSTEM, 2019-2033 (USD THOUSAND)
TABLE 121 SOUTH KOREA CASSIS IN UNMANNED GROUND VEHICLE MARKET, BY TYPE, 2019-2033 (USD THOUSAND)
TABLE 122 SOUTH KOREACOMMUNICATION SYSTEM IN UNMANNED GROUND VEHICLE MARKET, BY TYPE, 2019-2033 (USD THOUSAND)
TABLE 123 SOUTH KOREAUNMANNED GROUND VEHICLE MARKET, BY MOBILITY, 2019-2033 (USD THOUSAND)
TABLE 124 SOUTH KOREAUNMANNED GROUND VEHICLE MARKET, BY MODE OF OPERATION, 2019-2033 (USD THOUSAND)
TABLE 125 SOUTH KOREA AUTONOMOUS IN UNMANNED GROUND VEHICLE MARKET, BY TYPE, 2019-2033 (USD THOUSAND)
TABLE 126 SOUTH KOREAUNMANNED GROUND VEHICLE MARKET, BY PAYLOAD, 2019-2033 (USD THOUSAND)
TABLE 127 SOUTH KOREAUNMANNED GROUND VEHICLE MARKET, BY PROPULSION, 2019-2033 (USD THOUSAND)
TABLE 128 SOUTH KOREAUNMANNED GROUND VEHICLE MARKET, BY APPLICATION, 2019-2033 (USD THOUSAND)
TABLE 129 SOUTH KOREACOMMERCIAL IN UNMANNED GROUND VEHICLE MARKET, BY TYPE, 2019-2033 (USD THOUSAND)
TABLE 130 SOUTH KOREAAGRICULTURE IN UNMANNED GROUND VEHICLE MARKET, BY TYPE, 2019-2033 (USD THOUSAND)
TABLE 131 SOUTH KOREAOIL & GAS IN UNMANNED GROUND VEHICLE MARKET, BY TYPE, 2019-2033 (USD THOUSAND)
TABLE 132 SOUTH KOREAWAREHOUSE & LOGISTICS IN UNMANNED GROUND VEHICLE MARKET, BY TYPE, 2019-2033 (USD THOUSAND)
TABLE 133 SOUTH KOREA MILITARY IN UNMANNED GROUND VEHICLE MARKET, BY TYPE, 2019-2033 (USD THOUSAND)
TABLE 134 SOUTH KOREALAW ENFORCEMENT IN UNMANNED GROUND VEHICLE MARKET, BY TYPE, 2019-2033 (USD THOUSAND)
TABLE 135 INDIA UNMANNED GROUND VEHICLE MARKET, BY SIZE, 2019-2033 (USD THOUSAND)
TABLE 136 INDIA UNMANNED GROUND VEHICLE MARKET, BY SYSTEM, 2019-2033 (USD THOUSAND)
TABLE 137 INDIA PAYLOAD IN UNMANNED GROUND VEHICLE MARKET, BY TYPE, 2019-2033 (USD THOUSAND)
TABLE 138 INDIA POWER SYSTEM IN UNMANNED GROUND VEHICLE MARKET, BY POWER SYSTEM, 2019-2033 (USD THOUSAND)
TABLE 139 INDIA ELECTRIC NON SOLAR RECHARGABLE BATTERY IN UNMANNED GROUND VEHICLE MARKET, BY POWER SYSTEM, 2019-2033 (USD THOUSAND)
TABLE 140 INDIA CHASSIS IN UNMANNED GROUND VEHICLE MARKET, BY TYPE, 2019-2033 (USD THOUSAND)
TABLE 141 INDIA COMMUNICATION SYSTEM IN UNMANNED GROUND VEHICLE MARKET, BY TYPE, 2019-2033 (USD THOUSAND)
TABLE 142 INDIA UNMANNED GROUND VEHICLE MARKET, BY MOBILITY, 2019-2033 (USD THOUSAND)
TABLE 143 INDIA UNMANNED GROUND VEHICLE MARKET, BY MODE OF OPERATION, 2019-2033 (USD THOUSAND)
TABLE 144 INDIA AUTONOMOUS IN UNMANNED GROUND VEHICLE MARKET, BY TYPE, 2019-2033 (USD THOUSAND)
TABLE 145 INDIA UNMANNED GROUND VEHICLE MARKET, BY PAYLOAD, 2019-2033 (USD THOUSAND)
TABLE 146 INDIA UNMANNED GROUND VEHICLE MARKET, BY PROPULSION, 2019-2033 (USD THOUSAND)
TABLE 147 INDIA UNMANNED GROUND VEHICLE MARKET, BY APPLICATION, 2019-2033 (USD THOUSAND)
TABLE 148 INDIA COMMERCIAL IN UNMANNED GROUND VEHICLE MARKET, BY TYPE, 2019-2033 (USD THOUSAND)
TABLE 149 INDIA AGRICULTURE IN UNMANNED GROUND VEHICLE MARKET, BY TYPE, 2019-2033 (USD THOUSAND)
TABLE 150 INDIA OIL & GAS IN UNMANNED GROUND VEHICLE MARKET, BY TYPE, 2019-2033 (USD THOUSAND)
TABLE 151 INDIA WAREHOUSE & LOGISTICS IN UNMANNED GROUND VEHICLE MARKET, BY TYPE, 2019-2033 (USD THOUSAND)
TABLE 152 INDIA MILITARY IN UNMANNED GROUND VEHICLE MARKET, BY TYPE, 2019-2033 (USD THOUSAND)
TABLE 153 INDIA LAW ENFORCEMENT IN UNMANNED GROUND VEHICLE MARKET, BY TYPE, 2019-2033 (USD THOUSAND)
TABLE 154 AUSTRALIA UNMANNED GROUND VEHICLE MARKET, BY SIZE, 2019-2033 (USD THOUSAND)
TABLE 155 AUSTRALIA UNMANNED GROUND VEHICLE MARKET, BY SYSTEM, 2019-2033 (USD THOUSAND)
TABLE 156 AUSTRALIA PAYLOAD IN UNMANNED GROUND VEHICLE MARKET, BY TYPE, 2019-2033 (USD THOUSAND)
TABLE 157 AUSTRALIA POWER SYSTEM IN UNMANNED GROUND VEHICLE MARKET, BY POWER SYSTEM, 2019-2033 (USD THOUSAND)
TABLE 158 AUSTRALIA ELECTRIC NON SOLAR RECHARGABLE BATTERY IN UNMANNED GROUND VEHICLE MARKET, BY POWER SYSTEM, 2019-2033 (USD THOUSAND)
TABLE 159 AUSTRALIA CHASSIS IN UNMANNED GROUND VEHICLE MARKET, BY TYPE, 2019-2033 (USD THOUSAND)
TABLE 160 AUSTRALIA COMMUNICATION SYSTEM IN UNMANNED GROUND VEHICLE MARKET, BY TYPE, 2019-2033 (USD THOUSAND)
TABLE 161 AUSTRALIA UNMANNED GROUND VEHICLE MARKET, BY MOBILITY, 2019-2033 (USD THOUSAND)
TABLE 162 AUSTRALIA UNMANNED GROUND VEHICLE MARKET, BY MODE OF OPERATION, 2019-2033 (USD THOUSAND)
TABLE 163 AUSTRALIA AUTONOMOUS IN UNMANNED GROUND VEHICLE MARKET, BY TYPE, 2019-2033 (USD THOUSAND)
TABLE 164 AUSTRALIA UNMANNED GROUND VEHICLE MARKET, BY PAYLOAD, 2019-2033 (USD THOUSAND)
TABLE 165 AUSTRALIA UNMANNED GROUND VEHICLE MARKET, BY PROPULSION, 2019-2033 (USD THOUSAND)
TABLE 166 AUSTRALIA UNMANNED GROUND VEHICLE MARKET, BY APPLICATION, 2019-2033 (USD THOUSAND)
TABLE 167 AUSTRALIA COMMERCIAL IN UNMANNED GROUND VEHICLE MARKET, BY TYPE, 2019-2033 (USD THOUSAND)
TABLE 168 AUSTRALIA AGRICULTURE IN UNMANNED GROUND VEHICLE MARKET, BY TYPE, 2019-2033 (USD THOUSAND)
TABLE 169 AUSTRALIA OIL & GAS IN UNMANNED GROUND VEHICLE MARKET, BY TYPE, 2019-2033 (USD THOUSAND)
TABLE 170 AUSTRALIA WAREHOUSE & LOGISTICS IN UNMANNED GROUND VEHICLE MARKET, BY TYPE, 2019-2033 (USD THOUSAND)
TABLE 171 AUSTRALIA MILITARY IN UNMANNED GROUND VEHICLE MARKET, BY TYPE, 2019-2033 (USD THOUSAND)
TABLE 172 AUSTRALIA LAW ENFORCEMENT IN UNMANNED GROUND VEHICLE MARKET, BY TYPE, 2019-2033 (USD THOUSAND)
TABLE 173 SINGAPORE UNMANNED GROUND VEHICLE MARKET, BY SIZE, 2019-2033 (USD THOUSAND)
TABLE 174 SINGAPORE UNMANNED GROUND VEHICLE MARKET, BY SYSTEM, 2019-2033 (USD THOUSAND)
TABLE 175 SINGAPORE PAYLOAD IN UNMANNED GROUND VEHICLE MARKET, BY TYPE, 2019-2033 (USD THOUSAND)
TABLE 176 SINGAPORE POWER SYSTEM IN UNMANNED GROUND VEHICLE MARKET, BY POWER SYSTEM, 2019-2033 (USD THOUSAND)
TABLE 177 SINGAPORE ELECTRIC NON SOLAR RECHARGABLE BATTERY IN UNMANNED GROUND VEHICLE MARKET, BY POWER SYSTEM, 2019-2033 (USD THOUSAND)
TABLE 178 SINGAPORE CHASSIS IN UNMANNED GROUND VEHICLE MARKET, BY TYPE, 2019-2033 (USD THOUSAND)
TABLE 179 SINGAPORE COMMUNICATION SYSTEM IN UNMANNED GROUND VEHICLE MARKET, BY TYPE, 2019-2033 (USD THOUSAND)
TABLE 180 SINGAPORE UNMANNED GROUND VEHICLE MARKET, BY MOBILITY, 2019-2033 (USD THOUSAND)
TABLE 181 SINGAPORE UNMANNED GROUND VEHICLE MARKET, BY MODE OF OPERATION, 2019-2033 (USD THOUSAND)
TABLE 182 SINGAPORE AUTONOMOUS IN UNMANNED GROUND VEHICLE MARKET, BY TYPE, 2019-2033 (USD THOUSAND)
TABLE 183 SINGAPORE UNMANNED GROUND VEHICLE MARKET, BY PAYLOAD, 2019-2033 (USD THOUSAND)
TABLE 184 SINGAPORE UNMANNED GROUND VEHICLE MARKET, BY PROPULSION, 2019-2033 (USD THOUSAND)
TABLE 185 SINGAPORE UNMANNED GROUND VEHICLE MARKET, BY APPLICATION, 2019-2033 (USD THOUSAND)
TABLE 186 SINGAPORE COMMERCIAL IN UNMANNED GROUND VEHICLE MARKET, BY TYPE, 2019-2033 (USD THOUSAND)
TABLE 187 SINGAPORE AGRICULTURE IN UNMANNED GROUND VEHICLE MARKET, BY TYPE, 2019-2033 (USD THOUSAND)
TABLE 188 SINGAPORE OIL & GAS IN UNMANNED GROUND VEHICLE MARKET, BY TYPE, 2019-2033 (USD THOUSAND)
TABLE 189 SINGAPORE WAREHOUSE & LOGISTICS IN UNMANNED GROUND VEHICLE MARKET, BY TYPE, 2019-2033 (USD THOUSAND)
TABLE 190 SINGAPORE MILITARY IN UNMANNED GROUND VEHICLE MARKET, BY TYPE, 2019-2033 (USD THOUSAND)
TABLE 191 SINGAPORE LAW ENFORCEMENT IN UNMANNED GROUND VEHICLE MARKET, BY TYPE, 2019-2033 (USD THOUSAND)
TABLE 192 THAILAND UNMANNED GROUND VEHICLE MARKET, BY SIZE, 2019-2033 (USD THOUSAND)
TABLE 193 THAILAND UNMANNED GROUND VEHICLE MARKET, BY SYSTEM, 2019-2033 (USD THOUSAND)
TABLE 194 THAILAND PAYLOAD IN UNMANNED GROUND VEHICLE MARKET, BY TYPE, 2019-2033 (USD THOUSAND)
TABLE 195 THAILAND POWER SYSTEM IN UNMANNED GROUND VEHICLE MARKET, BY POWER SYSTEM, 2019-2033 (USD THOUSAND)
TABLE 196 THAILAND ELECTRIC NON SOLAR RECHARGABLE BATTERY IN UNMANNED GROUND VEHICLE MARKET, BY POWER SYSTEM, 2019-2033 (USD THOUSAND)
TABLE 197 THAILAND CHASSIS IN UNMANNED GROUND VEHICLE MARKET, BY TYPE, 2019-2033 (USD THOUSAND)
TABLE 198 THAILAND COMMUNICATION SYSTEM IN UNMANNED GROUND VEHICLE MARKET, BY TYPE, 2019-2033 (USD THOUSAND)
TABLE 199 THAILAND UNMANNED GROUND VEHICLE MARKET, BY MOBILITY, 2019-2033 (USD THOUSAND)
TABLE 200 THAILAND UNMANNED GROUND VEHICLE MARKET, BY MODE OF OPERATION, 2019-2033 (USD THOUSAND)
TABLE 201 THAILAND AUTONOMOUS IN UNMANNED GROUND VEHICLE MARKET, BY TYPE, 2019-2033 (USD THOUSAND)
TABLE 202 THAILAND UNMANNED GROUND VEHICLE MARKET, BY PAYLOAD, 2019-2033 (USD THOUSAND)
TABLE 203 THAILAND UNMANNED GROUND VEHICLE MARKET, BY PROPULSION, 2019-2033 (USD THOUSAND)
TABLE 204 THAILAND UNMANNED GROUND VEHICLE MARKET, BY APPLICATION, 2019-2033 (USD THOUSAND)
TABLE 205 THAILAND COMMERCIAL IN UNMANNED GROUND VEHICLE MARKET, BY TYPE, 2019-2033 (USD THOUSAND)
TABLE 206 THAILAND AGRICULTURE IN UNMANNED GROUND VEHICLE MARKET, BY TYPE, 2019-2033 (USD THOUSAND)
TABLE 207 THAILAND OIL & GAS IN UNMANNED GROUND VEHICLE MARKET, BY TYPE, 2019-2033 (USD THOUSAND)
TABLE 208 THAILAND WAREHOUSE & LOGISTICS IN UNMANNED GROUND VEHICLE MARKET, BY TYPE, 2019-2033 (USD THOUSAND)
TABLE 209 THAILAND MILITARY IN UNMANNED GROUND VEHICLE MARKET, BY TYPE, 2019-2033 (USD THOUSAND)
TABLE 210 THAILAND LAW ENFORCEMENT IN UNMANNED GROUND VEHICLE MARKET, BY TYPE, 2019-2033 (USD THOUSAND)
TABLE 211 MALAYSIA UNMANNED GROUND VEHICLE MARKET, BY SIZE, 2019-2033 (USD THOUSAND)
TABLE 212 MALAYSIA UNMANNED GROUND VEHICLE MARKET, BY SYSTEM, 2019-2033 (USD THOUSAND)
TABLE 213 MALAYSIA PAYLOAD IN UNMANNED GROUND VEHICLE MARKET, BY TYPE, 2019-2033 (USD THOUSAND)
TABLE 214 MALAYSIA POWER SYSTEM IN UNMANNED GROUND VEHICLE MARKET, BY POWER SYSTEM, 2019-2033 (USD THOUSAND)
TABLE 215 MALAYSIA ELECTRIC NON SOLAR RECHARGABLE BATTERY IN UNMANNED GROUND VEHICLE MARKET, BY POWER SYSTEM, 2019-2033 (USD THOUSAND)
TABLE 216 MALAYSIA CHASSIS IN UNMANNED GROUND VEHICLE MARKET, BY TYPE, 2019-2033 (USD THOUSAND)
TABLE 217 MALAYSIA COMMUNICATION SYSTEM IN UNMANNED GROUND VEHICLE MARKET, BY TYPE, 2019-2033 (USD THOUSAND)
TABLE 218 MALAYSIA UNMANNED GROUND VEHICLE MARKET, BY MOBILITY, 2019-2033 (USD THOUSAND)
TABLE 219 MALAYSIA UNMANNED GROUND VEHICLE MARKET, BY MODE OF OPERATION, 2019-2033 (USD THOUSAND)
TABLE 220 MALAYSIA AUTONOMOUS IN UNMANNED GROUND VEHICLE MARKET, BY TYPE, 2019-2033 (USD THOUSAND)
TABLE 221 MALAYSIA UNMANNED GROUND VEHICLE MARKET, BY PAYLOAD, 2019-2033 (USD THOUSAND)
TABLE 222 MALAYSIA UNMANNED GROUND VEHICLE MARKET, BY PROPULSION, 2019-2033 (USD THOUSAND)
TABLE 223 MALAYSIA UNMANNED GROUND VEHICLE MARKET, BY APPLICATION, 2019-2033 (USD THOUSAND)
TABLE 224 MALAYSIA COMMERCIAL IN UNMANNED GROUND VEHICLE MARKET, BY TYPE, 2019-2033 (USD THOUSAND)
TABLE 225 MALAYSIA AGRICULTURE IN UNMANNED GROUND VEHICLE MARKET, BY TYPE, 2019-2033 (USD THOUSAND)
TABLE 226 MALAYSIA OIL & GAS IN UNMANNED GROUND VEHICLE MARKET, BY TYPE, 2019-2033 (USD THOUSAND)
TABLE 227 MALAYSIA WAREHOUSE & LOGISTICS IN UNMANNED GROUND VEHICLE MARKET, BY TYPE, 2019-2033 (USD THOUSAND)
TABLE 228 MALAYSIA MILITARY IN UNMANNED GROUND VEHICLE MARKET, BY TYPE, 2019-2033 (USD THOUSAND)
TABLE 229 MALAYSIA LAW ENFORCEMENT IN UNMANNED GROUND VEHICLE MARKET, BY TYPE, 2019-2033 (USD THOUSAND)
TABLE 230 INDONESIA UNMANNED GROUND VEHICLE MARKET, BY SIZE, 2019-2033 (USD THOUSAND)
TABLE 231 INDONESIA UNMANNED GROUND VEHICLE MARKET, BY SYSTEM, 2019-2033 (USD THOUSAND)
TABLE 232 INDONESIA PAYLOAD IN UNMANNED GROUND VEHICLE MARKET, BY TYPE, 2019-2033 (USD THOUSAND)
TABLE 233 INDONESIA POWER SYSTEM IN UNMANNED GROUND VEHICLE MARKET, BY POWER SYSTEM, 2019-2033 (USD THOUSAND)
TABLE 234 INDONESIA ELECTRIC NON SOLAR RECHARGABLE BATTERY IN UNMANNED GROUND VEHICLE MARKET, BY POWER SYSTEM, 2019-2033 (USD THOUSAND)
TABLE 235 INDONESIA CHASSIS IN UNMANNED GROUND VEHICLE MARKET, BY TYPE, 2019-2033 (USD THOUSAND)
TABLE 236 INDONESIA COMMUNICATION SYSTEM IN UNMANNED GROUND VEHICLE MARKET, BY TYPE, 2019-2033 (USD THOUSAND)
TABLE 237 INDONESIA UNMANNED GROUND VEHICLE MARKET, BY MOBILITY, 2019-2033 (USD THOUSAND)
TABLE 238 INDONESIA UNMANNED GROUND VEHICLE MARKET, BY MODE OF OPERATION, 2019-2033 (USD THOUSAND)
TABLE 239 INDONESIA AUTONOMOUS IN UNMANNED GROUND VEHICLE MARKET, BY TYPE, 2019-2033 (USD THOUSAND)
TABLE 240 INDONESIA UNMANNED GROUND VEHICLE MARKET, BY PAYLOAD, 2019-2033 (USD THOUSAND)
TABLE 241 INDONESIA UNMANNED GROUND VEHICLE MARKET, BY PROPULSION, 2019-2033 (USD THOUSAND)
TABLE 242 INDONESIA UNMANNED GROUND VEHICLE MARKET, BY APPLICATION, 2019-2033 (USD THOUSAND)
TABLE 243 INDONESIA COMMERCIAL IN UNMANNED GROUND VEHICLE MARKET, BY TYPE, 2019-2033 (USD THOUSAND)
TABLE 244 INDONESIA AGRICULTURE IN UNMANNED GROUND VEHICLE MARKET, BY TYPE, 2019-2033 (USD THOUSAND)
TABLE 245 INDONESIA OIL & GAS IN UNMANNED GROUND VEHICLE MARKET, BY TYPE, 2019-2033 (USD THOUSAND)
TABLE 246 INDONESIA WAREHOUSE & LOGISTICS IN UNMANNED GROUND VEHICLE MARKET, BY TYPE, 2019-2033 (USD THOUSAND)
TABLE 247 INDONESIA MILITARY IN UNMANNED GROUND VEHICLE MARKET, BY TYPE, 2019-2033 (USD THOUSAND)
TABLE 248 INDONESIA LAW ENFORCEMENT IN UNMANNED GROUND VEHICLE MARKET, BY TYPE, 2019-2033 (USD THOUSAND)
TABLE 249 PHILIPPINES UNMANNED GROUND VEHICLE MARKET, BY SIZE, 2019-2033 (USD THOUSAND)
TABLE 250 PHILIPPINES UNMANNED GROUND VEHICLE MARKET, BY SYSTEM, 2019-2033 (USD THOUSAND)
TABLE 251 PHILIPPINES PAYLOAD IN UNMANNED GROUND VEHICLE MARKET, BY TYPE, 2019-2033 (USD THOUSAND)
TABLE 252 PHILIPPINES POWER SYSTEM IN UNMANNED GROUND VEHICLE MARKET, BY POWER SYSTEM, 2019-2033 (USD THOUSAND)
TABLE 253 PHILIPPINES ELECTRIC NON SOLAR RECHARGABLE BATTERY IN UNMANNED GROUND VEHICLE MARKET, BY POWER SYSTEM, 2019-2033 (USD THOUSAND)
TABLE 254 PHILIPPINES CHASSIS IN UNMANNED GROUND VEHICLE MARKET, BY TYPE, 2019-2033 (USD THOUSAND)
TABLE 255 PHILIPPINES COMMUNICATION SYSTEM IN UNMANNED GROUND VEHICLE MARKET, BY TYPE, 2019-2033 (USD THOUSAND)
TABLE 256 PHILIPPINES UNMANNED GROUND VEHICLE MARKET, BY MOBILITY, 2019-2033 (USD THOUSAND)
TABLE 257 PHILIPPINES UNMANNED GROUND VEHICLE MARKET, BY MODE OF OPERATION, 2019-2033 (USD THOUSAND)
TABLE 258 PHILIPPINES AUTONOMOUS IN UNMANNED GROUND VEHICLE MARKET, BY TYPE, 2019-2033 (USD THOUSAND)
TABLE 259 PHILIPPINES UNMANNED GROUND VEHICLE MARKET, BY PAYLOAD, 2019-2033 (USD THOUSAND)
TABLE 260 PHILIPPINES UNMANNED GROUND VEHICLE MARKET, BY PROPULSION, 2019-2033 (USD THOUSAND)
TABLE 261 PHILIPPINES UNMANNED GROUND VEHICLE MARKET, BY APPLICATION, 2019-2033 (USD THOUSAND)
TABLE 262 PHILIPPINES COMMERCIAL IN UNMANNED GROUND VEHICLE MARKET, BY TYPE, 2019-2033 (USD THOUSAND)
TABLE 263 PHILIPPINES AGRICULTURE IN UNMANNED GROUND VEHICLE MARKET, BY TYPE, 2019-2033 (USD THOUSAND)
TABLE 264 PHILIPPINES OIL & GAS IN UNMANNED GROUND VEHICLE MARKET, BY TYPE, 2019-2033 (USD THOUSAND)
TABLE 265 PHILIPPINES WAREHOUSE & LOGISTICS IN UNMANNED GROUND VEHICLE MARKET, BY TYPE, 2019-2033 (USD THOUSAND)
TABLE 266 PHILIPPINES MILITARY IN UNMANNED GROUND VEHICLE MARKET, BY TYPE, 2019-2033 (USD THOUSAND)
TABLE 267 PHILIPPINES LAW ENFORCEMENT IN UNMANNED GROUND VEHICLE MARKET, BY TYPE, 2019-2033 (USD THOUSAND)
TABLE 268 NEW ZEALAND UNMANNED GROUND VEHICLE MARKET, BY SIZE, 2019-2033 (USD THOUSAND)
TABLE 269 NEW ZEALAND UNMANNED GROUND VEHICLE MARKET, BY SYSTEM, 2019-2033 (USD THOUSAND)
TABLE 270 NEW ZEALAND PAYLOAD IN UNMANNED GROUND VEHICLE MARKET, BY TYPE, 2019-2033 (USD THOUSAND)
TABLE 271 NEW ZEALAND POWER SYSTEM IN UNMANNED GROUND VEHICLE MARKET, BY POWER SYSTEM, 2019-2033 (USD THOUSAND)
TABLE 272 NEW ZEALAND ELECTRIC NON SOLAR RECHARGABLE BATTERY IN UNMANNED GROUND VEHICLE MARKET, BY POWER SYSTEM, 2019-2033 (USD THOUSAND)
TABLE 273 NEW ZEALAND CHASSIS IN UNMANNED GROUND VEHICLE MARKET, BY TYPE, 2019-2033 (USD THOUSAND)
TABLE 274 NEW ZEALAND COMMUNICATION SYSTEM IN UNMANNED GROUND VEHICLE MARKET, BY TYPE, 2019-2033 (USD THOUSAND)
TABLE 275 NEW ZEALAND UNMANNED GROUND VEHICLE MARKET, BY MOBILITY, 2019-2033 (USD THOUSAND)
TABLE 276 NEW ZEALAND UNMANNED GROUND VEHICLE MARKET, BY MODE OF OPERATION, 2019-2033 (USD THOUSAND)
TABLE 277 NEW ZEALAND AUTONOMOUS IN UNMANNED GROUND VEHICLE MARKET, BY TYPE, 2019-2033 (USD THOUSAND)
TABLE 278 NEW ZEALAND UNMANNED GROUND VEHICLE MARKET, BY PAYLOAD, 2019-2033 (USD THOUSAND)
TABLE 279 NEW ZEALAND UNMANNED GROUND VEHICLE MARKET, BY PROPULSION, 2019-2033 (USD THOUSAND)
TABLE 280 NEW ZEALAND UNMANNED GROUND VEHICLE MARKET, BY APPLICATION, 2019-2033 (USD THOUSAND)
TABLE 281 NEW ZEALAND COMMERCIAL IN UNMANNED GROUND VEHICLE MARKET, BY TYPE, 2019-2033 (USD THOUSAND)
TABLE 282 NEW ZEALAND AGRICULTURE IN UNMANNED GROUND VEHICLE MARKET, BY TYPE, 2019-2033 (USD THOUSAND)
TABLE 283 NEW ZEALAND OIL & GAS IN UNMANNED GROUND VEHICLE MARKET, BY TYPE, 2019-2033 (USD THOUSAND)
TABLE 284 NEW ZEALAND WAREHOUSE & LOGISTICS IN UNMANNED GROUND VEHICLE MARKET, BY TYPE, 2019-2033 (USD THOUSAND)
TABLE 285 NEW ZEALAND MILITARY IN UNMANNED GROUND VEHICLE MARKET, BY TYPE, 2019-2033 (USD THOUSAND)
TABLE 286 NEW ZEALAND LAW ENFORCEMENT IN UNMANNED GROUND VEHICLE MARKET, BY TYPE, 2019-2033 (USD THOUSAND)
TABLE 287 VIETNAM UNMANNED GROUND VEHICLE MARKET, BY SIZE, 2019-2033 (USD THOUSAND)
TABLE 288 VIETNAM UNMANNED GROUND VEHICLE MARKET, BY SYSTEM, 2019-2033 (USD THOUSAND)
TABLE 289 VIETNAM PAYLOAD IN UNMANNED GROUND VEHICLE MARKET, BY TYPE, 2019-2033 (USD THOUSAND)
TABLE 290 VIETNAM POWER SYSTEM IN UNMANNED GROUND VEHICLE MARKET, BY POWER SYSTEM, 2019-2033 (USD THOUSAND)
TABLE 291 VIETNAM ELECTRIC NON SOLAR RECHARGABLE BATTERY IN UNMANNED GROUND VEHICLE MARKET, BY POWER SYSTEM, 2019-2033 (USD THOUSAND)
TABLE 292 VIETNAM CHASSIS IN UNMANNED GROUND VEHICLE MARKET, BY TYPE, 2019-2033 (USD THOUSAND)
TABLE 293 VIETNAM COMMUNICATION SYSTEM IN UNMANNED GROUND VEHICLE MARKET, BY TYPE, 2019-2033 (USD THOUSAND)
TABLE 294 VIETNAM UNMANNED GROUND VEHICLE MARKET, BY MOBILITY, 2019-2033 (USD THOUSAND)
TABLE 295 VIETNAM UNMANNED GROUND VEHICLE MARKET, BY MODE OF OPERATION, 2019-2033 (USD THOUSAND)
TABLE 296 VIETNAM AUTONOMOUS IN UNMANNED GROUND VEHICLE MARKET, BY TYPE, 2019-2033 (USD THOUSAND)
TABLE 297 VIETNAM UNMANNED GROUND VEHICLE MARKET, BY PAYLOAD, 2019-2033 (USD THOUSAND)
TABLE 298 VIETNAM UNMANNED GROUND VEHICLE MARKET, BY PROPULSION, 2019-2033 (USD THOUSAND)
TABLE 299 VIETNAM UNMANNED GROUND VEHICLE MARKET, BY APPLICATION, 2019-2033 (USD THOUSAND)
TABLE 300 VIETNAM COMMERCIAL IN UNMANNED GROUND VEHICLE MARKET, BY TYPE, 2019-2033 (USD THOUSAND)
TABLE 301 VIETNAM AGRICULTURE IN UNMANNED GROUND VEHICLE MARKET, BY TYPE, 2019-2033 (USD THOUSAND)
TABLE 302 VIETNAM OIL & GAS IN UNMANNED GROUND VEHICLE MARKET, BY TYPE, 2019-2033 (USD THOUSAND)
TABLE 303 VIETNAM WAREHOUSE & LOGISTICS IN UNMANNED GROUND VEHICLE MARKET, BY TYPE, 2019-2033 (USD THOUSAND)
TABLE 304 VIETNAM MILITARY IN UNMANNED GROUND VEHICLE MARKET, BY TYPE, 2019-2033 (USD THOUSAND)
TABLE 305 VIETNAM LAW ENFORCEMENT IN UNMANNED GROUND VEHICLE MARKET, BY TYPE, 2019-2033 (USD THOUSAND)
TABLE 306 TAIWAN UNMANNED GROUND VEHICLE MARKET, BY SIZE, 2019-2033 (USD THOUSAND)
TABLE 307 TAIWAN UNMANNED GROUND VEHICLE MARKET, BY SYSTEM, 2019-2033 (USD THOUSAND)
TABLE 308 TAIWAN PAYLOAD IN UNMANNED GROUND VEHICLE MARKET, BY TYPE, 2019-2033 (USD THOUSAND)
TABLE 309 TAIWAN POWER SYSTEM IN UNMANNED GROUND VEHICLE MARKET, BY POWER SYSTEM, 2019-2033 (USD THOUSAND)
TABLE 310 TAIWAN ELECTRIC NON SOLAR RECHARGABLE BATTERY IN UNMANNED GROUND VEHICLE MARKET, BY POWER SYSTEM, 2019-2033 (USD THOUSAND)
TABLE 311 TAIWAN CHASSIS IN UNMANNED GROUND VEHICLE MARKET, BY TYPE, 2019-2033 (USD THOUSAND)
TABLE 312 TAIWAN COMMUNICATION SYSTEM IN UNMANNED GROUND VEHICLE MARKET, BY TYPE, 2019-2033 (USD THOUSAND)
TABLE 313 TAIWAN UNMANNED GROUND VEHICLE MARKET, BY MOBILITY, 2019-2033 (USD THOUSAND)
TABLE 314 TAIWAN UNMANNED GROUND VEHICLE MARKET, BY MODE OF OPERATION, 2019-2033 (USD THOUSAND)
TABLE 315 TAIWAN AUTONOMOUS IN UNMANNED GROUND VEHICLE MARKET, BY TYPE, 2019-2033 (USD THOUSAND)
TABLE 316 TAIWAN UNMANNED GROUND VEHICLE MARKET, BY PAYLOAD, 2019-2033 (USD THOUSAND)
TABLE 317 TAIWAN UNMANNED GROUND VEHICLE MARKET, BY PROPULSION, 2019-2033 (USD THOUSAND)
TABLE 318 TAIWAN UNMANNED GROUND VEHICLE MARKET, BY APPLICATION, 2019-2033 (USD THOUSAND)
TABLE 319 TAIWAN COMMERCIAL IN UNMANNED GROUND VEHICLE MARKET, BY TYPE, 2019-2033 (USD THOUSAND)
TABLE 320 TAIWAN AGRICULTURE IN UNMANNED GROUND VEHICLE MARKET, BY TYPE, 2019-2033 (USD THOUSAND)
TABLE 321 TAIWAN OIL & GAS IN UNMANNED GROUND VEHICLE MARKET, BY TYPE, 2019-2033 (USD THOUSAND)
TABLE 322 TAIWAN WAREHOUSE & LOGISTICS IN UNMANNED GROUND VEHICLE MARKET, BY TYPE, 2019-2033 (USD THOUSAND)
TABLE 323 TAIWAN MILITARY IN UNMANNED GROUND VEHICLE MARKET, BY TYPE, 2019-2033 (USD THOUSAND)
TABLE 324 TAIWAN LAW ENFORCEMENT IN UNMANNED GROUND VEHICLE MARKET, BY TYPE, 2019-2033 (USD THOUSAND)
TABLE 325 REST OF ASIA-PACIFIC UNMANNED GROUND VEHICLE MARKET, BY SIZE, 2019-2033 (USD THOUSAND)
TABLE 326 REST OF ASIA-PACIFIC UNMANNED GROUND VEHICLE MARKET, BY SYSTEM, 2019-2033 (USD THOUSAND)
TABLE 327 REST OF ASIA-PACIFIC PAYLOAD IN UNMANNED GROUND VEHICLE MARKET, BY TYPE, 2019-2033 (USD THOUSAND)
TABLE 328 REST OF ASIA-PACIFIC POWER SYSTEM IN UNMANNED GROUND VEHICLE MARKET, BY POWER SYSTEM, 2019-2033 (USD THOUSAND)
TABLE 329 REST OF ASIA-PACIFIC ELECTRIC NON SOLAR RECHARGABLE BATTERY IN UNMANNED GROUND VEHICLE MARKET, BY POWER SYSTEM, 2019-2033 (USD THOUSAND)
TABLE 330 REST OF ASIA-PACIFIC CHASSIS IN UNMANNED GROUND VEHICLE MARKET, BY TYPE, 2019-2033 (USD THOUSAND)
TABLE 331 REST OF ASIA-PACIFIC COMMUNICATION SYSTEM IN UNMANNED GROUND VEHICLE MARKET, BY TYPE, 2019-2033 (USD THOUSAND)
TABLE 332 REST OF ASIA-PACIFIC UNMANNED GROUND VEHICLE MARKET, BY MOBILITY, 2019-2033 (USD THOUSAND)
TABLE 333 REST OF ASIA-PACIFIC UNMANNED GROUND VEHICLE MARKET, BY MODE OF OPERATION, 2019-2033 (USD THOUSAND)
TABLE 334 REST OF ASIA-PACIFIC AUTONOMOUS IN UNMANNED GROUND VEHICLE MARKET, BY TYPE, 2019-2033 (USD THOUSAND)
TABLE 335 REST OF ASIA-PACIFIC UNMANNED GROUND VEHICLE MARKET, BY PAYLOAD, 2019-2033 (USD THOUSAND)
TABLE 336 REST OF ASIA-PACIFIC UNMANNED GROUND VEHICLE MARKET, BY PROPULSION, 2019-2033 (USD THOUSAND)
TABLE 337 REST OF ASIA-PACIFIC UNMANNED GROUND VEHICLE MARKET, BY APPLICATION, 2019-2033 (USD THOUSAND)
TABLE 338 REST OF ASIA-PACIFIC COMMERCIAL IN UNMANNED GROUND VEHICLE MARKET, BY TYPE, 2019-2033 (USD THOUSAND)
TABLE 339 REST OF ASIA-PACIFIC AGRICULTURE IN UNMANNED GROUND VEHICLE MARKET, BY TYPE, 2019-2033 (USD THOUSAND)
TABLE 340 REST OF ASIA-PACIFIC OIL & GAS IN UNMANNED GROUND VEHICLE MARKET, BY TYPE, 2019-2033 (USD THOUSAND)
TABLE 341 REST OF ASIA-PACIFIC WAREHOUSE & LOGISTICS IN UNMANNED GROUND VEHICLE MARKET, BY TYPE, 2019-2033 (USD THOUSAND)
TABLE 342 REST OF ASIA-PACIFIC MILITARY IN UNMANNED GROUND VEHICLE MARKET, BY TYPE, 2019-2033 (USD THOUSAND)
TABLE 343 REST OF ASIA-PACIFIC LAW ENFORCEMENT IN UNMANNED GROUND VEHICLE MARKET, BY TYPE, 2019-2033 (USD THOUSAND)
List of Figure
FIGURE 1 ASIA-PACIFIC UNMANNED GROUND VEHICLE MARKET
FIGURE 2 ASIA-PACIFIC UNMANNED GROUND VEHICLE MARKET: DATA TRIANGULATION
FIGURE 3 ASIA-PACIFIC UNMANNED GROUND VEHICLE MARKET: DROC ANALYSIS
FIGURE 4 ASIA-PACIFIC UNMANNED GROUND VEHICLE MARKET: ASIA-PACIFIC VS REGIONAL MARKET ANALYSIS
FIGURE 5 ASIA-PACIFIC UNMANNED GROUND VEHICLE MARKET: COMPANY RESEARCH ANALYSIS
FIGURE 6 ASIA-PACIFIC UNMANNED GROUND VEHICLE MARKET: MULTIVARIATE MODELLING
FIGURE 7 UNMANNED GROUND VEHICLE MARKET: MARKET APPLICATION COVERAGE GRID
FIGURE 8 ASIA-PACIFIC UNMANNED GROUND VEHICLE MARKET: INTERVIEW DEMOGRAPHICS
FIGURE 9 ASIA-PACIFIC UNMANNED GROUND VEHICLE MARKET: DBMR MARKET POSITION GRID
FIGURE 10 ASIA-PACIFIC UNMANNED GROUND VEHICLE MARKET: VENDOR SHARE ANALYSIS
FIGURE 11 EXECUTIVE SUMMARY
FIGURE 12 ASIA-PACIFIC UNMANNED GROUND VEHICLE MARKET: SEGMENTATION
FIGURE 13 STRATEGIC DECISIONS
FIGURE 14 SIX SEGMENTS COMPRISE THE ASIA-PACIFIC UNMANNED GROUND VEHICLE MARKET, BY SIZE
FIGURE 15 ASIA-PACIFIC IS EXPECTED TO BE THE DOMINANT AND FASTEST GROWING REGION IN THE ASIA-PACIFIC UNMANNED GROUND VEHICLE MARKET IN THE FORECAST PERIOD OF 2026 TO 2033
FIGURE 16 DEFENSE MODERNIZATION PROGRAMS ACCELERATING ASIA-PACIFIC UGV PROCUREMENT MOMENTUM IS EXPECTED TO DRIVE THE ASIA-PACIFIC UNMANNED GROUND VEHICLE MARKET DURING THE FORECAST PERIOD OF 2026 TO 2033
FIGURE 17 SMALL (10 - 200 LBS) SEGMENT IS EXPECTED TO ACCOUNT FOR THE LARGEST SHARE OF THE ASIA-PACIFIC UNMANNED GROUND VEHICLE MARKET IN 2026 & 2033
FIGURE 18 ASIA-PACIFIC IS THE FASTEST-GROWING REGION FOR THE ASIA-PACIFIC UNMANNED GROUND VEHICLE MARKET IN THE FORECAST PERIOD OF 2026 TO 2033
FIGURE 19 ASIA-PACIFIC UNMANNED GROUND VEHICLE MARKET, 2025-2033, AVERAGE SELLING PRICE (USD PER UNIT)
FIGURE 20 SWOT ANALYSIS
FIGURE 21 ASIA-PACIFIC UNMANNED GROUND VEHICLE MARKET, BY SIZE, 2025
FIGURE 22 ASIA-PACIFIC UNMANNED GROUND VEHICLE MARKET, BY SYSTEM, 2025
FIGURE 23 ASIA-PACIFIC UNMANNED GROUND VEHICLE MARKET, BY MOBILITY, 2025
FIGURE 24 ASIA-PACIFIC UNMANNED GROUND VEHICLE MARKET, BY MODE OF OPERATION, 2025
FIGURE 25 ASIA-PACIFIC UNMANNED GROUND VEHICLE MARKET, BY SIZE, 2025
FIGURE 26 ASIA-PACIFIC UNMANNED GROUND VEHICLE MARKET, BY PROPULSION, 2025
FIGURE 27 ASIA-PACIFIC UNMANNED GROUND VEHICLE MARKET, BY APPLICATION, 2025
FIGURE 28 ASIA-PACIFIC UNMANNED GROUND VEHICLE MARKET, SNAPSHOT (2025)
FIGURE 29 ASIA-PACIFIC UNMANNED GROUND VEHICLE MARKET: COMPANY SHARE 2025 (%)
Data collection and base year analysis are done using data collection modules with large sample sizes. The stage includes obtaining market information or related data through various sources and strategies. It includes examining and planning all the data acquired from the past in advance. It likewise envelops the examination of information inconsistencies seen across different information sources. The market data is analysed and estimated using market statistical and coherent models. Also, market share analysis and key trend analysis are the major success factors in the market report. To know more, please request an analyst call or drop down your inquiry.
The key research methodology used by DBMR research team is data triangulation which involves data mining, analysis of the impact of data variables on the market and primary (industry expert) validation. Data models include Vendor Positioning Grid, Market Time Line Analysis, Market Overview and Guide, Company Positioning Grid, Patent Analysis, Pricing Analysis, Company Market Share Analysis, Standards of Measurement, Global versus Regional and Vendor Share Analysis. To know more about the research methodology, drop in an inquiry to speak to our industry experts.
Data Bridge Market Research is a leader in advanced formative research. We take pride in servicing our existing and new customers with data and analysis that match and suits their goal. The report can be customized to include price trend analysis of target brands understanding the market for additional countries (ask for the list of countries), clinical trial results data, literature review, refurbished market and product base analysis. Market analysis of target competitors can be analyzed from technology-based analysis to market portfolio strategies. We can add as many competitors that you require data about in the format and data style you are looking for. Our team of analysts can also provide you data in crude raw excel files pivot tables (Fact book) or can assist you in creating presentations from the data sets available in the report.


