
Global Lidar Market
Market Size in USD Billion
 USD
3.83 Billion
USD
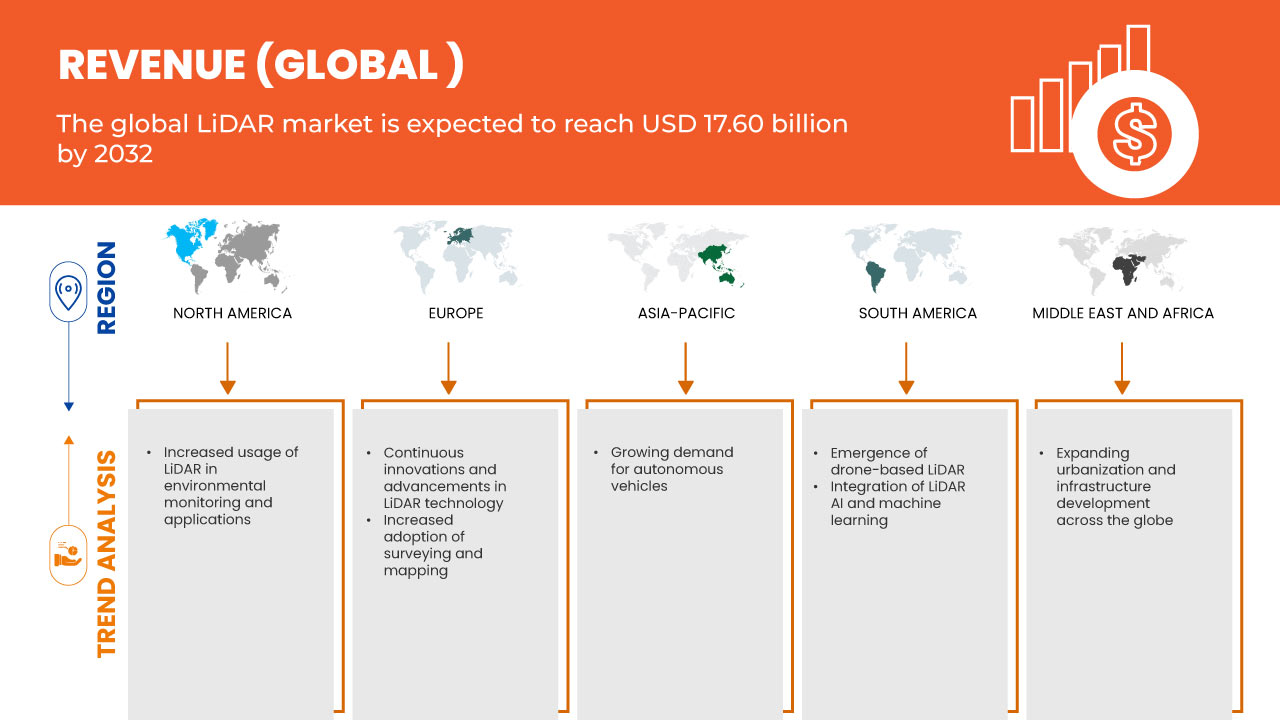
17.60 Billion
2024
2032
USD
3.83 Billion
USD
17.60 Billion
2024
2032
| 2025 - 2032 | |
| USD 3.83 Billion | |
| USD 17.60 Billion | |
| % | |
|
LiDAR Market Analysis
LiDAR (Light Detection and Ranging) analysis involves using laser light to measure distances to the Earth's surface, producing highly accurate 3D models of environments. LiDAR systems emit laser pulses and measure the time it takes for them to return after reflecting off objects. This data helps create detailed topographical maps, identify vegetation, model infrastructure, and monitor environmental changes. LiDAR is widely used in applications like forestry, urban planning, archaeology, and disaster management. By processing the reflected signals, LiDAR analysis generates high-resolution point clouds, which can be used for terrain modeling, contour mapping, and vegetation classification.
LiDAR Market Size
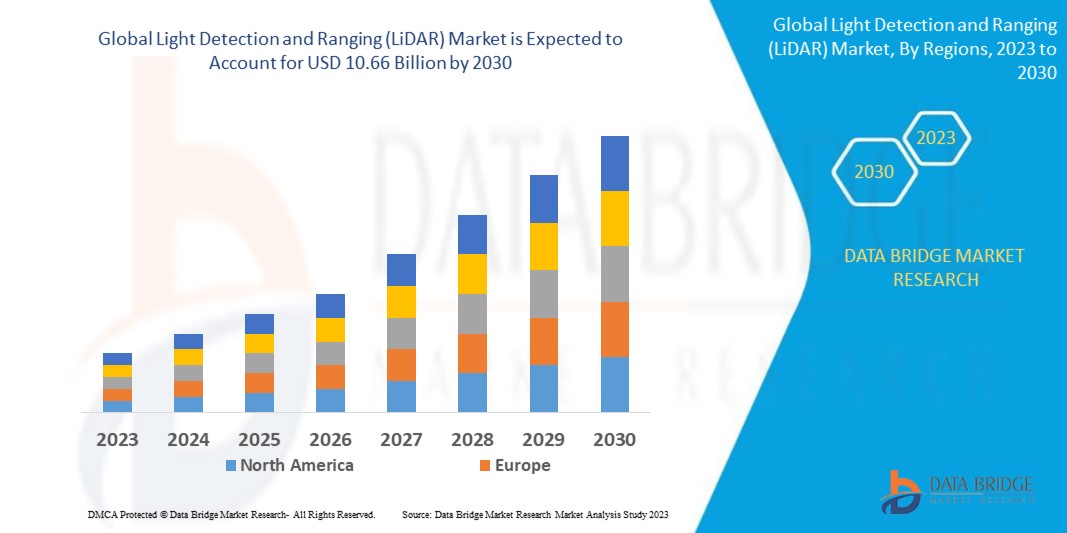
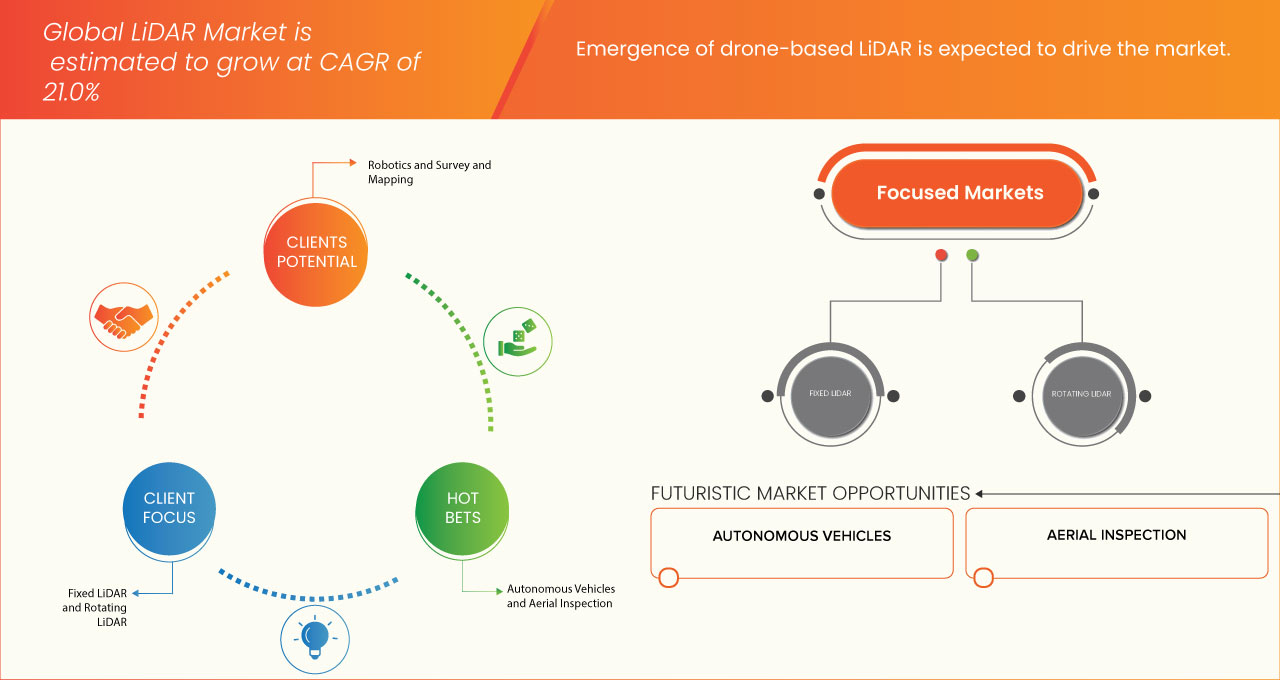
Global LiDAR market size was valued at USD 3.83 billion in 2024 and is projected to reach USD 17.60 billion by 2032, with a CAGR of 21.0% during the forecast period of 2025 to 2032. In addition to the insights on market scenarios such as market value, growth rate, segmentation, geographical coverage, and major players, the market reports curated by the Data Bridge Market Research also include import export analysis, production capacity overview, production consumption analysis, price trend analysis, climate change scenario, supply chain analysis, value chain analysis, raw material/consumables overview, vendor selection criteria, PESTLE Analysis, Porter Analysis, and regulatory framework.
LiDAR Market Trends
“Increasing Demand for Accurate 3D Mapping Technologies”
The increasing demand for accurate 3D mapping technologies is a key driver in the global LiDAR market. Industries such as urban planning, construction, agriculture, and environmental monitoring require precise topographical data to improve decision-making and efficiency. LiDAR provides high-resolution 3D models that enable detailed mapping of terrain, infrastructure, and vegetation. This rising trend in technology is especially valuable for applications like flood modeling, autonomous vehicles, and geological surveys, where precision is critical. As industries increasingly adopt digital twin technologies and smart city initiatives, the need for accurate and efficient 3D mapping solutions continues to grow, fueling LiDAR market trend.
Report Scope and Market Segmentation
|
Attributes |
LiDAR Key Market Insights |
|
Segments Covered |
|
|
Countries Covered |
U.S., Canada, Mexico, China, Japan, South Korea, India, Thailand, Malaysia, Indonesia, Vietnam, Taiwan, Philippines, Singapore, Australia, Rest of Asia-Pacific, Germany, France, U.K., Italy, Spain, Russia, Turkey, Netherlands, Belgium, Sweden, Poland, Switzerland, Rest of Europe. Brazil, Argentina, Rest of South America, Saudi Arabia, U.A.E, South Africa, Egypt, Israel, and Rest of Middle East and Africa |
|
Key Market Players |
Innoviz Technologies Ltd (Israel), SICK AG (Germany), Hesai Group. (China), Quanergy Solutions, Inc. (U.S.), Cepton, Inc. (U.S.), Génération Robots (France), Teledyne Optech China), Aeva Inc. (U.S.), AEye, Inc. (U.S.), Trimble Inc. (U.S.) |
|
Market Opportunities |
|
|
Value Added Data Infosets |
In addition to the insights on market scenarios such as market value, growth rate, segmentation, geographical coverage, and major players, the market reports curated by the Data Bridge Market Research also include import export analysis, production capacity overview, production consumption analysis, price trend analysis, climate change scenario, supply chain analysis, value chain analysis, raw material/consumables overview, vendor selection criteria, PESTLE Analysis, Porter Analysis, and regulatory framework. |
LiDAR Market Definition
LiDAR (Light Detection and Ranging) is a remote sensing technology that uses laser pulses to measure distances between a sensor and objects on the Earth's surface. By emitting rapid laser beams and recording the time it takes for the pulses to reflect back, LiDAR generates highly accurate, detailed 3D data. This data, known as a point cloud, provides precise measurements of surface topography, vegetation, infrastructure, and more. LiDAR is widely used in industries like mapping, forestry, archaeology, and environmental monitoring due to its ability to capture high-resolution spatial data in a variety of settings, including both land and aerial surveys.
LiDAR Market Dynamics
Drivers
- Growing Demand for Autonomous Vehicles
The growing demand for Autonomous Vehicles (AVs) is one of the key factors driving the increased adoption of LiDAR technology. LiDAR plays a critical role in enabling self-driving vehicles to perceive their environment accurately, making it an essential component for autonomous vehicle systems. As the automotive industry moves toward fully autonomous transportation, LiDAR’s ability to provide high-resolution, 360-degree 3D mapping and real-time environmental data is crucial for ensuring safety and reliability.
LiDAR sensors emit laser pulses to measure distances and create precise 3D maps of the surroundings, allowing autonomous vehicles to detect obstacles, road signs, pedestrians, and other vehicles, even in challenging conditions such as low light or poor weather. This level of precision and depth perception helps autonomous systems navigate complex environments safely, making LiDAR a preferred choice for self-driving car manufacturers. In contrast to traditional camera-based or radar-based sensors, LiDAR provides much more detailed and accurate spatial information, crucial for making split-second decisions in dynamic environments.
The increasing demand for autonomous vehicles is also driving innovation in LiDAR technology. To meet the needs of the automotive sector, there has been significant progress in reducing the size, cost, and complexity of LiDAR systems. Solid-state LiDAR, for example, offers a more affordable and durable alternative to traditional rotating LiDAR systems, which is critical for widespread adoption in consumer vehicles. Additionally, advancements in LiDAR’s integration with other sensors, such as radar and cameras, are enabling better performance and more seamless operation in autonomous systems.
As the global push for autonomous vehicles intensifies, driven by the promise of enhanced safety, efficiency, and convenience, LiDAR technology will remain at the forefront of the development of self-driving cars, helping accelerate the realization of a fully autonomous transportation future.
For instance,
- In October 2024, according to an article published by Medium, LiDAR's ability to create accurate 3D maps and detect obstacles in real time is essential for the safe operation of self-driving vehicles. As autonomous vehicle technology progresses, LiDAR becomes crucial for navigation, decision-making, and collision avoidance, making it a key enabler of fully autonomous transportation systems
Increased Usage of LiDAR in Environmental Monitoring and Applications
The increased usage of LiDAR technology in environmental monitoring and applications is transforming the way we understand and manage natural resources, ecosystems, and environmental risks. LiDAR’s ability to capture highly detailed, accurate 3D data makes it invaluable for a wide range of environmental applications, including forestry management, flood modeling, coastal monitoring, and habitat mapping.
One of the most significant applications of LiDAR in environmental monitoring is in forestry management. LiDAR technology allows for precise mapping of forest canopies, tree height, density, and biomass, helping foresters assess forest health and manage timber resources more effectively. LiDAR can also be used to create detailed topographical maps of forested areas, identifying potential risks like landslides or erosion, and supporting conservation efforts by mapping wildlife habitats.
In flood risk management, LiDAR provides high-resolution data that helps in creating accurate flood models. By capturing detailed elevation data, LiDAR allows scientists to predict flood patterns, assess potential flooding zones, and develop flood mitigation strategies. It is particularly useful in areas with complex terrain, where traditional methods might struggle to obtain accurate data.
LiDAR is also increasingly used in coastal and marine studies. It can help map shorelines, monitor coastal erosion, and assess the health of marine ecosystems such as coral reefs. The ability to capture detailed data underwater and along coastlines is essential for understanding and protecting these vulnerable environments. Additionally, LiDAR is valuable in climate change research, helping to monitor environmental changes over time, such as ice melt in polar regions or deforestation in tropical forests.
As environmental concerns continue to grow, the ability of LiDAR to provide accurate, real-time data is crucial for monitoring, conserving, and managing the environment, making it an essential tool in sustainable resource management and environmental protection.
For instance,
- In April 2023, according to an article published by Neuvition, Inc., the growing use of LiDAR technology in environmental monitoring and management is highlighted. LiDAR's high-resolution 3D mapping enables detailed analysis of landscapes, vegetation, and topography, making it essential for tracking ecological health, detecting environmental changes, and managing natural resources, positioning it as a key tool for sustainable practices.
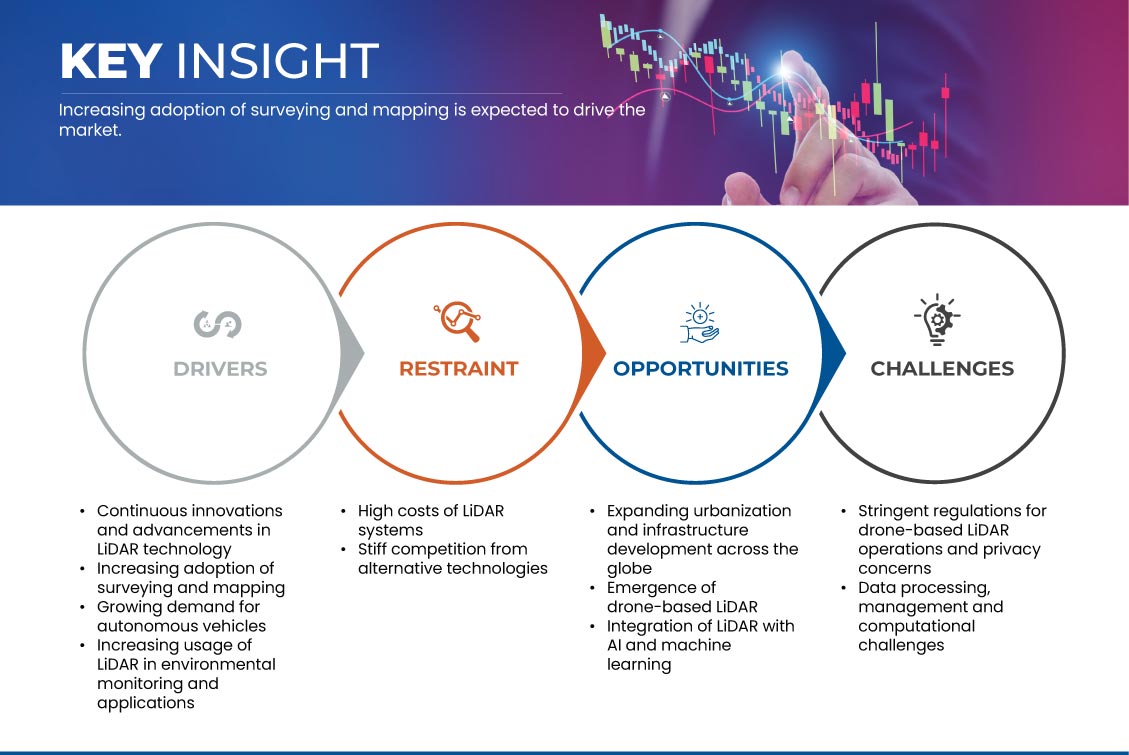
Opportunities
- Expanding Urbanization and Infrastructure Development Across the Globe
The accelerating trend of urbanization and infrastructure development across the globe presents a wealth of opportunities for the global LiDAR (Light Detection and Ranging) market. As cities continue to grow, evolve, and modernize, the need for accurate, efficient, and scalable solutions to monitor and manage urban environments has never been greater. LiDAR technology, with its ability to capture high-resolution, three-dimensional data of landscapes, infrastructure, and buildings, is emerging as a key enabler in urban planning, construction, and infrastructure management.
As urbanization intensifies, cities are becoming more complex, with an increasing demand for smarter, more efficient solutions to tackle challenges like traffic congestion, waste management, and energy consumption. LiDAR technology plays a pivotal role in urban planning by providing highly detailed and accurate 3D models of cities. These models help urban planners visualize existing infrastructure, plan for new developments, and optimize the use of space. In the context of smart cities, LiDAR can assist in the creation of intelligent systems that monitor everything from transportation flows to public utilities, contributing to more sustainable and livable urban environments.
Infrastructure development is a crucial aspect of urbanization, with governments and private entities investing heavily in the construction and maintenance of roads, bridges, buildings, and utilities. LiDAR technology is indispensable in this regard, offering precise, high-resolution data for site surveys, topographic mapping, and structural inspections. LiDAR-equipped drones, for instance, can quickly and accurately map construction sites, allowing for more efficient project planning, reducing costs, and minimizing errors. Additionally, LiDAR’s ability to detect structural changes and potential hazards in existing infrastructure allows for proactive maintenance and repairs, ensuring that critical assets remain safe and functional.
As the demand for accurate, real-time data increases, the global LiDAR market is expected to grow substantially. The integration of LiDAR with AI, machine learning, and autonomous technologies will further expand its applications, driving market adoption across sectors such as transportation, construction, and energy. This trend presents significant opportunities for companies providing LiDAR-based solutions, from hardware manufacturers to software developers.
For instance,
- In June 2024, according to an article by ResearchGate GmbH, LiDAR technology is used for urban geophysical surveys, such as mapping underground utilities and monitoring structural integrity. It helps in creating detailed 3D models of urban landscapes, which aid in infrastructure planning, flood modeling, and urban development, ensuring more accurate and efficient decision-making in city management
Emergence of Drone-Based LiDAR
The emergence of drone-based LiDAR technology, coupled with the accelerating trends of urbanization and global infrastructure development, has created immense opportunities for the global LiDAR market. As cities expand and infrastructure projects grow in scale and complexity, the demand for precise, efficient, and cost-effective data collection solutions is increasing. Drone-based LiDAR is positioning itself as a transformative tool across various sectors, including infrastructure development, surveying, environmental monitoring, and agriculture.
In the rapidly developing global infrastructure landscape, drone-based LiDAR plays a pivotal role by providing highly accurate, real-time 3D mapping. During construction, LiDAR-equipped drones can capture topographical data, ensuring that projects are planned with precision. This reduces the likelihood of errors during construction, optimizes material use, and helps adhere to strict timelines. Additionally, LiDAR drones support infrastructure monitoring by regularly scanning assets like roads, bridges, and pipelines. They can detect structural issues, such as cracks or deformations, before they become critical, enabling preventive maintenance and saving significant repair costs. In areas with complex or hard-to-reach infrastructure, drones make it possible to collect data quickly, minimizing the need for manual inspections.
LiDAR-equipped drones are also transforming traditional surveying methods. Land surveys that once took days or weeks can now be completed in a fraction of the time. Drones can cover vast areas, collecting precise data that would otherwise require extensive manpower and expensive equipment. For instance, in mining or construction, drones generate accurate 3D models for site planning and volume measurements, ensuring projects stay on track. In environmental monitoring, drone-based LiDAR allows for efficient tracking of changes in landscapes, such as erosion, deforestation, or land-use shifts. It also aids in flood risk assessments and conservation efforts by providing detailed elevation data, which is crucial for understanding water flow and ecosystem health.
In agriculture, drone-based LiDAR is revolutionizing land management. LiDAR-equipped drones help monitor crop health, assess irrigation needs, and detect early signs of pest infestations. The technology provides detailed, high-resolution data on soil topography and crop canopy structure, enabling farmers to make better-informed decisions and optimize their farming practices. LiDAR can also assist in precision agriculture by identifying the most efficient use of resources, reducing waste, and enhancing crop yields.
For instance,
- In August 2023, According to an article by MDPI, drone-based LiDAR is used for mapping and monitoring forest canopies, offering precise data on tree height, canopy structure, and vegetation density. This technology aids in ecological studies, forest management, and conservation efforts, providing critical insights into biodiversity, biomass estimation, and forest health
Restraints/Challenges
- High Costs of LiDAR Systems
The high costs of LiDAR (Light Detection and Ranging) systems are a significant barrier to their widespread adoption, despite their numerous applications in industries such as autonomous vehicles, construction, agriculture, and environmental monitoring. These systems are known for providing highly accurate, high-resolution 3D mapping, but their expense remains a challenge for many businesses and organizations seeking to incorporate LiDAR into their operations.
There are several reasons for the high costs associated with LiDAR systems. First, the technology itself requires specialized components such as laser scanners, GPS units, and high-performance sensors, which are expensive to manufacture. LiDAR sensors use advanced laser beams to measure distances and capture data, and the precision required for accurate results adds to the complexity of production. Additionally, the integration of these sensors with advanced software for data processing and analysis increases the overall system cost.
Second, the research and development (R&D) needed to improve LiDAR technology also contributes to its high price. Companies invest heavily in developing more compact, efficient, and accurate systems, which often requires significant upfront capital. While newer LiDAR technologies, such as solid-state LiDAR, are expected to drive down costs over time, the initial investment in cutting-edge technology remains high.
Furthermore, operational costs associated with LiDAR systems, such as training personnel to operate the equipment and processing the large amounts of data generated, add to the total expense. A single LiDAR scanning mission can generate terabytes of data, which requires specialized software and computing power for analysis, further driving up costs.
Despite these challenges, the prices of LiDAR systems are gradually decreasing as technological advancements make the components more affordable. As competition within the market increases and demand rises, it is expected that LiDAR will become more accessible, enabling broader use across industries.
For Instance
- In March 2022, according to a blog published by Queensland Drones, LiDAR mapping, while offering advantages over photogrammetry, remains expensive due to high equipment and software costs. UAV-mounted LiDAR systems cost around USD 2,500 per day, compared to USD 30,000 for manned aircraft systems
Stringent Regulations for Drone-Based LiDAR Operations and Privacy Concerns
Material properties, particularly viscosity, play a crucial role in determining the efficiency and quality of the extrusion process. Viscosity, a measure of a material's resistance to flow, directly influences how materials behave under the high-pressure and high-temperature conditions typical of extrusion. Understanding and controlling viscosity is essential for optimizing the extrusion process, ensuring consistent product quality, and achieving desired mechanical properties.
In the context of polymer extrusion, viscosity affects the flow rate and uniformity of the molten material as it is forced through the die. Materials with high viscosity require greater force to push through the die, which can increase energy consumption and wear on the extrusion machinery. Conversely, materials with low viscosity flow more easily but may not provide the necessary structural integrity for certain applications. Therefore, achieving an optimal viscosity is critical for balancing processing efficiency and product performance.
The rheological behavior of materials, which includes viscosity, also impacts the thermal and mechanical properties of the extruded products. For instance, variations in viscosity can lead to inconsistent wall thickness, surface defects, and internal stresses within the extruded profiles. These defects can compromise the strength, durability, and aesthetic qualities of the final product. By precisely controlling the viscosity, manufacturers can enhance the dimensional accuracy and surface finish of the extruded materials, resulting in higher quality products.
Furthermore, viscosity influences the mixing and blending of additives and fillers within the base material. In applications where multiple components are combined to achieve specific properties, such as reinforced composites or multi-layered structures, the compatibility and dispersion of these components depend on the material's viscosity. Properly managed viscosity ensures a homogeneous mixture, preventing issues like phase separation or uneven distribution of fillers, which can degrade the material's overall performance.
Advanced extrusion technologies often incorporate real-time monitoring and control systems to manage viscosity and other critical parameters. These systems enable dynamic adjustments to processing conditions, such as temperature and screw speed, to maintain optimal viscosity throughout the extrusion process. This level of control enhances productivity, reduces material waste, and ensures consistent quality.
For instance,
- In July 2021, according to an article by Vidhi Centre, privacy concerns surrounding drone operations in India, highlighting the challenges of collecting sensitive data through aerial surveillance. It emphasizes the need for stricter regulations to protect individuals' privacy while balancing the benefits of drone technology, especially in sectors like mapping, agriculture, and infrastructure development
Impact and Current Market Scenario of Raw Material Shortage and Shipping Delays
Data Bridge Market Research offers a high-level analysis of the market and delivers information by keeping in account the impact and current market environment of raw material shortage and shipping delays. This translates into assessing strategic possibilities, creating effective action plans, and assisting businesses in making important decisions.
Apart from the standard report, we also offer in-depth analysis of the procurement level from forecasted shipping delays, distributor mapping by region, commodity analysis, production analysis, price mapping trends, sourcing, category performance analysis, supply chain risk management solutions, advanced benchmarking, and other services for procurement and strategic support.
Expected Impact of Economic Slowdown on the Pricing and Availability of Products
When economic activity slows, industries begin to suffer. The forecasted effects of the economic downturn on the pricing and accessibility of the products are taken into account in the market insight reports and intelligence services provided by DBMR. With this, our clients can typically keep one step ahead of their competitors, project their sales and revenue, and estimate their profit and loss expenditures.
LiDAR Market Scope
The market is segmented on the basis of type and application. The growth amongst these segments will help you analyze meagre growth segments in the industries and provide the users with a valuable market overview and market insights to help them make strategic decisions for identifying core market applications.
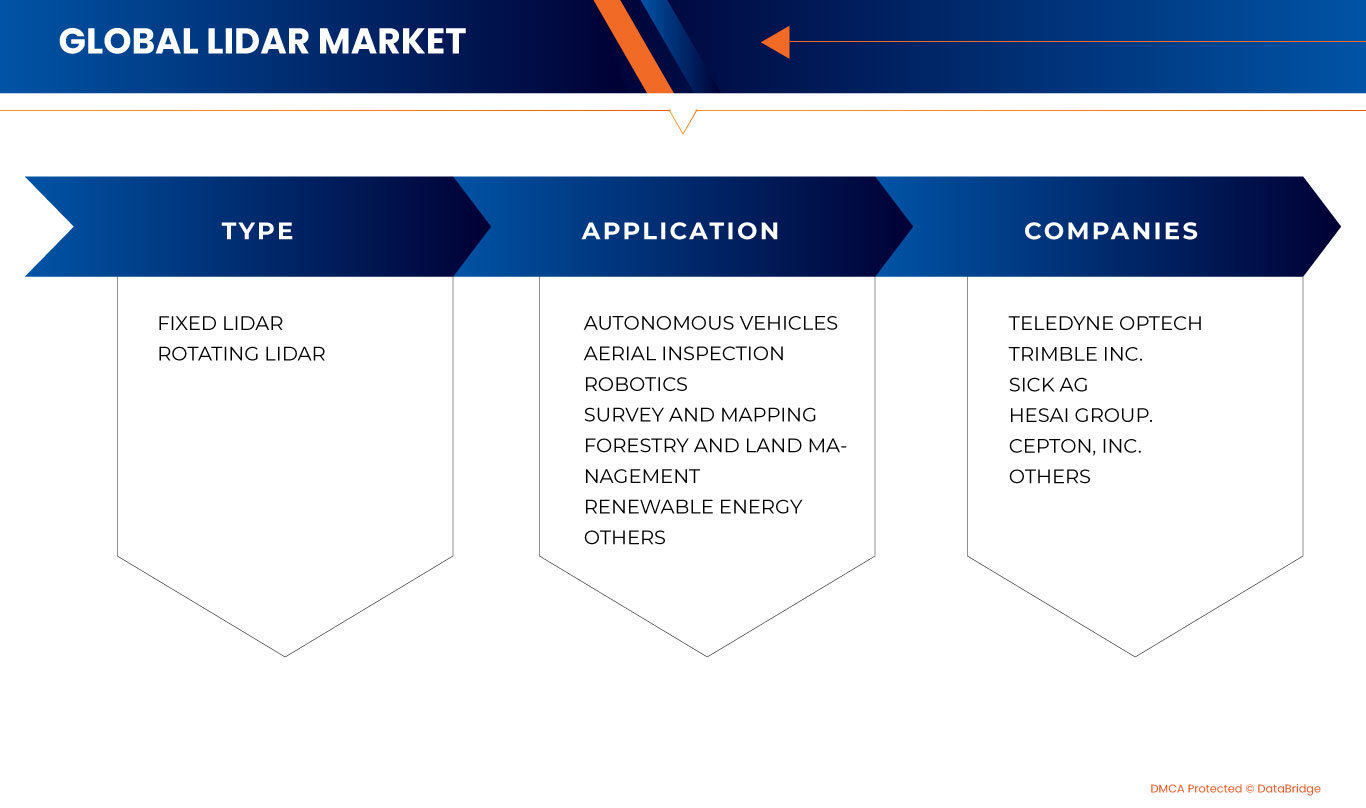
Type
- Fixed LiDAR
- Rotating LiDAR
- Other
Application
- Autonomous Vehicles
- Aerial Inspection
- Robotics
- Survey and Mapping
- Forestry and Land Management
- Renewable Energy
- Others
LiDAR Market Regional Analysis
The market is analyzed and market size insights and trends are provided by type and application.
The countries covered in the market are U.S., Canada, Mexico, China, Japan, South Korea, India, Thailand, Malaysia, Indonesia, Vietnam, Taiwan, Philippines, Singapore, Australia, Rest of Asia-Pacific, Germany, France, U.K., Italy, Spain, Russia, Turkey, Netherlands, Belgium, Sweden, Poland, Switzerland, Rest of Europe. Brazil, Argentina, Rest of South America, Saudi Arabia, U.A.E, South Africa, Egypt, Israel, and Rest of Middle East and Africa.
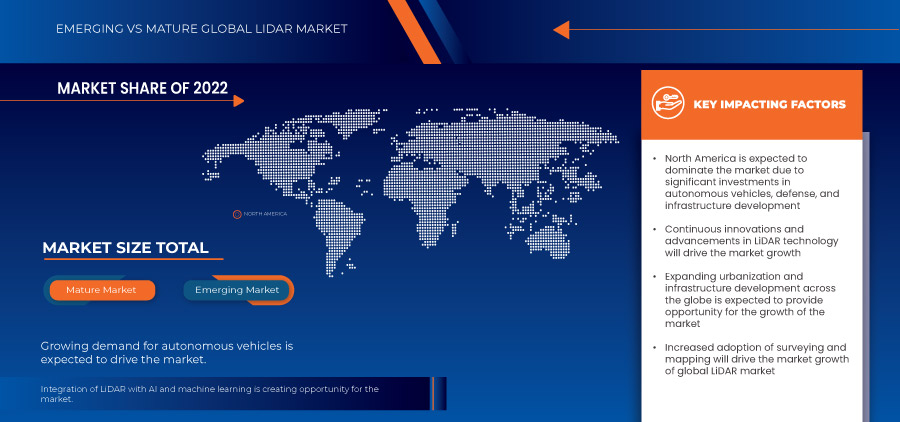
North America dominates the global LiDAR market due to advanced technological infrastructure, high adoption across industries like aerospace, defense, and automotive, and strong investments in autonomous vehicles and Geographic Information Systems (GIS).
Asia-Pacific is emerging in the global LiDAR market due to rapid industrialization, increasing investments in smart cities, autonomous vehicles, infrastructure development, and growing demand for accurate mapping and environmental monitoring solutions.
The country section of the report also provides individual market impacting factors and changes in regulation in the market domestically that impacts the current and future trends of the market. Data points like down-stream and upstream value chain analysis, technical trends and porter's five forces analysis, case studies are some of the pointers used to forecast the market scenario for individual countries. Also, the presence and availability of global brands and their challenges faced due to large or scarce competition from local and domestic brands, impact of domestic tariffs and trade routes are considered while providing forecast analysis of the country data.
LiDAR Market Share
The market competitive landscape provides details by competitors. Details included are company overview, company financials, revenue generated, market potential, investment in research and development, new market initiatives, global presence, production sites and facilities, production capacities, company strengths and weaknesses, product launch, product width and breadth, application dominance. The above data points provided are only related to the companies' focus related to market.
LiDAR Market Leaders Operating in the Market Are:
- Innoviz Technologies Ltd (Israel)
- SICK AG (Germany)
- Hesai Group. (China)
- Quanergy Solutions, Inc. (U.S.)
- Cepton, Inc. (U.S.)
- Génération Robots (France)
- Teledyne Optech China)
- Aeva Inc. (U.S.)
- AEye, Inc. (U.S.)
- Trimble Inc. (U.S.)
Latest Developments in Global LiDAR Market
- In July 2024, Cepton, Inc. announced a definitive agreement to be acquired by Koito Manufacturing Co., Ltd., a long-time collaborator, and strategic partner. Following the completion of the acquisition, Cepton will operate as a privately held indirect subsidiary of Koito, maintaining its headquarters in San Jose, California. This partnership builds on their history of developing high-performance LiDAR solutions for automotive and smart infrastructure applications. The acquisition is expected to enhance LiDAR adoption in mass-market applications, leveraging Koito's manufacturing capabilities and Cepton's technological expertise
- In May 2024, Cepton, Inc. introduced StudioViz, a proprietary end-to-end LiDAR simulation platform, aimed at accelerating the development of advanced driver-assistance systems (ADAS) and autonomous vehicles (AVs). StudioViz enables OEMs and developers to simulate LiDAR integration scenarios, test sensor placements, and refine perception algorithms without the need for extensive physical testing. This tool provides high-fidelity 3D point cloud visualizations and scenario-building capabilities, reducing costs and complexity in real-world testing by recreating diverse environmental conditions virtually
- In June 2021, eledyne Optech and Teledyne CARIS, both Teledyne Technologies companies, have announced the launch of the next-generation bathymetric LiDAR, the CZMIL SuperNova. This innovative system offers unmatched depth performance and the highest green laser point density in its class, featuring SmartSpacing technology for efficient point distribution, real-time processing to reduce post-processing time, and configurable modes tailored for various water environments
- In November 2023, Aeva secured a production win with Nikon Corporation to supply its micron-precise LiDAR-on-Chip technology for Nikon's industrial metrology and quality control products. The multi-year agreement will integrate Aeva’s technology into Nikon’s automated inspection solutions for automotive, aerospace, and renewable energy sectors, with production starting in late 2024 and product availability in 2025
- In June 2024, Innoviz Technologies has partnered with a major OEM to develop a new short-range LiDAR solution for Level 4 (L4) autonomous vehicles. This collaboration focuses on enhancing the vehicle's ability to perceive its environment at close ranges, contributing to more precise and reliable navigation for fully autonomous driving
SKU-

- Interactive Data Analysis Dashboard
- Company Analysis Dashboard for high growth potential opportunities
- Research Analyst Access for customization & queries
- Competitor Analysis with Interactive dashboard
- Latest News, Updates & Trend analysis
- Harness the Power of Benchmark Analysis for Comprehensive Competitor Tracking
Table of Content
1 INTRODUCTION
1.1 OBJECTIVES OF THE STUDY
1.2 MARKET DEFINITION
1.3 OVERVIEW
1.4 LIMITATIONS
1.5 MARKETS COVERED
2 MARKET SEGMENTATION
2.1 MARKETS COVERED
2.2 GEOGRAPHICAL SCOPE
2.3 YEARS CONSIDERED FOR THE STUDY
2.4 CURRENCY AND PRICING
2.5 DBMR TRIPOD DATA VALIDATION MODEL
2.6 MULTIVARIATE MODELING
2.7 PRIMARY INTERVIEWS WITH KEY OPINION LEADERS
2.8 DBMR MARKET POSITION GRID
2.9 MARKET APPLICATION COVERAGE GRID
2.1 DBMR VENDOR SHARE ANALYSIS
2.11 SECONDARY SOURCES
2.12 ASSUMPTIONS
3 EXECUTIVE SUMMARY
4 PREMIUM INSIGHTS
5 MARKET OVERVIEW
5.1 DRIVERS
5.1.1 CONTINUOUS INNOVATIONS AND ADVANCEMENTS IN LIDAR TECHNOLOGY
5.1.2 INCREASING ADOPTION OF SURVEYING AND MAPPING
5.1.3 GROWING DEMAND FOR AUTONOMOUS VEHICLES
5.1.4 INCREASING USAGE OF LIDAR IN ENVIRONMENTAL MONITORING AND APPLICATIONS
5.2 RESTRAINTS
5.2.1 HIGH COSTS OF LIDAR SYSTEMS
5.2.2 STIFF COMPETITION FROM ALTERNATIVE TECHNOLOGIES
5.3 OPPORTUNITIES
5.3.1 EXPANDING URBANIZATION AND INFRASTRUCTURE DEVELOPMENT ACROSS THE GLOBE
5.3.2 EMERGENCE OF DRONE-BASED LIDAR
5.3.3 INTEGRATION OF LIDAR WITH AI AND MACHINE LEARNING
5.4 CHALLENGES
5.4.1 STRINGENT REGULATIONS FOR DRONE-BASED LIDAR OPERATIONS AND PRIVACY CONCERNS
5.4.2 DATA PROCESSING, MANAGEMENT AND COMPUTATIONAL CHALLENGES
6 GLOBAL LIDAR MARKET, BY TYPE
6.1 OVERVIEW
6.2 FIXED LIDAR
6.3 ROTATING LIDAR
7 GLOBAL LIDAR MARKET, BY APPLICATION
7.1 OVERVIEW
7.2 AUTONOMOUS VEHICLES
7.3 AERIAL INSPECTION
7.4 ROBOTICS
7.5 SURVEY AND MAPPING
7.6 FORESTRY AND LAND MANAGEMENT
7.7 RENEWABLE ENERGY
7.8 OTHERS
8 GLOBAL LIDAR MARKET, BY REGION
8.1 OVERVIEW
8.2 GLOBAL
8.3 NORTH AMERICA
8.3.1 U.S.
8.3.2 CANADA
8.3.3 MEXICO
8.4 ASIA-PACIFIC
8.4.1 CHINA
8.4.2 JAPAN
8.4.3 SOUTH KOREA
8.4.4 INDIA
8.4.5 THAILAND
8.4.6 MALAYSIA
8.4.7 INDONESIA
8.4.8 VIETNAM
8.4.9 TAIWAN
8.4.10 PHILIPPINES
8.4.11 SINGAPORE
8.4.12 AUSTRALIA
8.4.13 REST OF ASIA-PACIFIC
8.5 EUROPE
8.5.1 GERMANY
8.5.2 FRANCE
8.5.3 U.K.
8.5.4 ITALY
8.5.5 SPAIN
8.5.6 RUSSIA
8.5.7 TURKEY
8.5.8 NETHERLANDS
8.5.9 BELGIUM
8.5.10 SWEDEN
8.5.11 POLAND
8.5.12 SWITZERLAND
8.5.13 REST OF EUROPE
8.6 MIDDLE EAST AND AFRICA
8.6.1 SAUDI ARABIA
8.6.2 U.A.E.
8.6.3 SOUTH AFRICA
8.6.4 EGYPT
8.6.5 ISRAEL
8.6.6 REST OF MIDDLE EAST AND AFRICA
8.7 SOUTH AMERICA
8.7.1 BRAZIL
8.7.2 ARGENTINA
8.7.3 REST OF SOUTH AMERICA
9 GLOBAL LIDAR MARKET: COMPANY LANDSCAPE
9.1 COMPANY SHARE ANALYSIS: GLOBAL
9.2 COMPANY SHARE ANALYSIS: EUROPE
9.3 COMPANY SHARE ANALYSIS: ASIA-PACIFIC
9.4 COMPANY SHARE ANALYSIS: NORTH AMERICA
10 SWOT ANALYSIS
11 COMPANY PROFILES
11.1 TELEDYNE GEOSPATIAL
11.1.1 COMPANY SNAPSHOT
11.1.2 REVENUE ANALYSIS
11.1.3 COMPANY SHARE ANALYSIS
11.1.4 PRODUCT PORTFOLIO
11.1.5 RECENT DEVELOPMENT
11.2 TRIMBLE INC
11.2.1 COMPANY SNAPSHOT
11.2.2 REVENUE ANALYSIS
11.2.3 COMPANY SHARE ANALYSIS
11.2.4 PRODUCT PORTFOLIO
11.2.5 RECENT DEVELOPMENT
11.3 SICK AG
11.3.1 COMPANY SNAPSHOT
11.3.2 COMPANY SHARE ANALYSIS
11.3.3 PRODUCT PORTFOLIO
11.3.4 RECENT DEVELOPMENT
11.4 HESAI GROUP
11.4.1 COMPANY SNAPSHOT
11.4.2 REVENUE ANALYSIS
11.4.3 COMPANY SHARE ANALYSIS
11.4.4 PRODUCT PORTFOLIO
11.4.5 RECENT DEVELOPMENT
11.5 AEVA INC
11.5.1 COMPANY SNAPSHOT
11.5.2 REVENUE ANALYSIS
11.5.3 PRODUCT PORTFOLIO
11.5.4 RECENT DEVELOPMENT
11.6 AEYE, INC.
11.6.1 COMPANY SNAPSHOT
11.6.2 REVENUE ANALYSIS
11.6.3 PRODUCT PORTFOLIO
11.6.4 RECENT DEVELOPMENT
11.7 CEPTON, INC.
11.7.1 COMPANY SNAPSHOT
11.7.2 REVENUE ANALYSIS
11.7.3 PRODUCT PORTFOLIO
11.7.4 RECENT DEVELOPMENT
11.8 GÉNÉRATION ROBOTS
11.8.1 COMPANY SNAPSHOT
11.8.2 PRODUCT PORTFOLIO
11.8.3 RECENT DEVELOPMENT
11.9 INNOVIZ TECHNOLOGIES LTD
11.9.1 COMPANY SNAPSHOT
11.9.2 REVENUE ANALYSIS
11.9.3 PRODUCT PORTFOLIO
11.9.4 RECENT DEVELOPMENT
11.1 QUSNERGY SOLUTIONS, INC.
11.10.1 COMPANY SNAPSHOT
11.10.2 PRODUCT PORTFOLIO
11.10.3 RECENT DEVELOPMENT
12 QUESTIONNAIRE
13 RELATED REPORTS
List of Table
TABLE 1 GLOBAL LIDAR MARKET, BY TYPE, 2018-2032 (USD THOUSAND)
TABLE 2 GLOBAL FIXED LIDAR IN LIDAR MARKET, BY REGION, 2018-2032 (USD THOUSAND)
TABLE 3 GLOBAL ROTATING LIDAR IN LIDAR MARKET, BY REGION, 2018-2032 (USD THOUSAND)
TABLE 4 GLOBAL LIDAR MARKET, BY APPLICATION, 2024, 2018-2032 (USD THOUSAND)
TABLE 5 GLOBAL AUTONOMOUS VEHICLES IN LIDAR MARKET, BY REGION, 2018-2032 (USD THOUSAND)
TABLE 6 GLOBAL AERIAL INSPECTION IN LIDAR MARKET, BY REGION, 2018-2032 (USD THOUSAND)
TABLE 7 GLOBAL ROBOTICS IN LIDAR MARKET, BY REGION, 2018-2032 (USD THOUSAND)
TABLE 8 GLOBAL SURVEY AND MAPPING IN LIDAR MARKET, BY REGION, 2018-2032 (USD THOUSAND)
TABLE 9 GLOBAL FORESTRY AND LAND MANAGEMENT IN LIDAR MARKET, BY REGION, 2018-2032 (USD THOUSAND)
TABLE 10 GLOBAL RENEWABLE ENERGY IN LIDAR MARKET, BY REGION, 2018-2032 (USD THOUSAND)
TABLE 11 GLOBAL OTHERS IN LIDAR MARKET, BY REGION, 2018-2032 (USD THOUSAND)
TABLE 12 GLOBAL LIDAR MARKET, BY REGION, 2018-2032 (USD THOUSAND)
TABLE 13 NORTH AMERICA LIDAR MARKET, BY COUNTRY, 2018-2032 (USD THOUSAND)
TABLE 14 NORTH AMERICA LIDAR MARKET, BY TYPE, 2018-2032 (USD THOUSAND)
TABLE 15 NORTH AMERICA LIDAR MARKET, BY APPLICATION, 2018-2032 (USD THOUSAND)
TABLE 16 U.S. LIDAR MARKET, BY TYPE, 2018-2032 (USD THOUSAND)
TABLE 17 U.S. LIDAR MARKET, BY APPLICATION, 2018-2032 (USD THOUSAND)
TABLE 18 CANADA LIDAR MARKET, BY TYPE, 2018-2032 (USD THOUSAND)
TABLE 19 CANADA LIDAR MARKET, BY APPLICATION, 2018-2032 (USD THOUSAND)
TABLE 20 MEXICO LIDAR MARKET, BY TYPE, 2018-2032 (USD THOUSAND)
TABLE 21 MEXICO LIDAR MARKET, BY APPLICATION, 2018-2032 (USD THOUSAND)
TABLE 22 ASIA-PACIFIC LIDAR MARKET, BY COUNTRY, 2018-2032 (USD THOUSAND)
TABLE 23 ASIA-PACIFIC LIDAR MARKET, BY TYPE, 2018-2032 (USD THOUSAND)
TABLE 24 ASIA-PACIFIC LIDAR MARKET, BY APPLICATION, 2018-2032 (USD THOUSAND)
TABLE 25 CHINA LIDAR MARKET, BY TYPE, 2018-2032 (USD THOUSAND)
TABLE 26 CHINA LIDAR MARKET, BY APPLICATION, 2018-2032 (USD THOUSAND)
TABLE 27 JAPAN LIDAR MARKET, BY TYPE, 2018-2032 (USD THOUSAND)
TABLE 28 JAPAN LIDAR MARKET, BY APPLICATION, 2018-2032 (USD THOUSAND)
TABLE 29 SOUTH KOREA LIDAR MARKET, BY TYPE, 2018-2032 (USD THOUSAND)
TABLE 30 SOUTH KOREA LIDAR MARKET, BY APPLICATION, 2018-2032 (USD THOUSAND)
TABLE 31 INDIA LIDAR MARKET, BY TYPE, 2018-2032 (USD THOUSAND)
TABLE 32 INDIA LIDAR MARKET, BY APPLICATION, 2018-2032 (USD THOUSAND)
TABLE 33 THAILAND LIDAR MARKET, BY TYPE, 2018-2032 (USD THOUSAND)
TABLE 34 THAILAND LIDAR MARKET, BY APPLICATION, 2018-2032 (USD THOUSAND)
TABLE 35 MALAYSIA LIDAR MARKET, BY TYPE, 2018-2032 (USD THOUSAND)
TABLE 36 MALAYSIA LIDAR MARKET, BY APPLICATION, 2018-2032 (USD THOUSAND)
TABLE 37 INDONESIA LIDAR MARKET, BY TYPE, 2018-2032 (USD THOUSAND)
TABLE 38 INDONESIA LIDAR MARKET, BY APPLICATION, 2018-2032 (USD THOUSAND)
TABLE 39 VIETNAM LIDAR MARKET, BY TYPE, 2018-2032 (USD THOUSAND)
TABLE 40 VIETNAM LIDAR MARKET, BY APPLICATION, 2018-2032 (USD THOUSAND)
TABLE 41 TAIWAN LIDAR MARKET, BY TYPE, 2018-2032 (USD THOUSAND)
TABLE 42 TAIWAN LIDAR MARKET, BY APPLICATION, 2018-2032 (USD THOUSAND)
TABLE 43 PHILIPPINES LIDAR MARKET, BY TYPE, 2018-2032 (USD THOUSAND)
TABLE 44 PHILIPPINES LIDAR MARKET, BY APPLICATION, 2018-2032 (USD THOUSAND)
TABLE 45 SINGAPORE LIDAR MARKET, BY TYPE, 2018-2032 (USD THOUSAND)
TABLE 46 SINGAPORE LIDAR MARKET, BY APPLICATION, 2018-2032 (USD THOUSAND)
TABLE 47 AUSTRALIA LIDAR MARKET, BY TYPE, 2018-2032 (USD THOUSAND)
TABLE 48 AUSTRALIA LIDAR MARKET, BY APPLICATION, 2018-2032 (USD THOUSAND)
TABLE 49 REST OF ASIA-PACIFIC LIDAR MARKET, BY TYPE, 2018-2032 (USD THOUSAND)
TABLE 50 EUROPE LIDAR MARKET, BY COUNTRY, 2018-2032 (USD THOUSAND)
TABLE 51 EUROPE LIDAR MARKET, BY TYPE, 2018-2032 (USD THOUSAND)
TABLE 52 EUROPE LIDAR MARKET, BY APPLICATION, 2018-2032 (USD THOUSAND)
TABLE 53 GERMANY LIDAR MARKET, BY TYPE, 2018-2032 (USD THOUSAND)
TABLE 54 GERMANY LIDAR MARKET, BY APPLICATION, 2018-2032 (USD THOUSAND)
TABLE 55 FRANCE LIDAR MARKET, BY TYPE, 2018-2032 (USD THOUSAND)
TABLE 56 FRANCE LIDAR MARKET, BY APPLICATION, 2018-2032 (USD THOUSAND)
TABLE 57 U.K. LIDAR MARKET, BY TYPE, 2018-2032 (USD THOUSAND)
TABLE 58 U.K. LIDAR MARKET, BY APPLICATION, 2018-2032 (USD THOUSAND)
TABLE 59 ITALY LIDAR MARKET, BY TYPE, 2018-2032 (USD THOUSAND)
TABLE 60 ITALY LIDAR MARKET, BY APPLICATION, 2018-2032 (USD THOUSAND)
TABLE 61 SPAIN LIDAR MARKET, BY TYPE, 2018-2032 (USD THOUSAND)
TABLE 62 SPAIN LIDAR MARKET, BY APPLICATION, 2018-2032 (USD THOUSAND)
TABLE 63 RUSSIA LIDAR MARKET, BY TYPE, 2018-2032 (USD THOUSAND)
TABLE 64 RUSSIA LIDAR MARKET, BY APPLICATION, 2018-2032 (USD THOUSAND)
TABLE 65 TURKEY LIDAR MARKET, BY TYPE, 2018-2032 (USD THOUSAND)
TABLE 66 TURKEY LIDAR MARKET, BY APPLICATION, 2018-2032 (USD THOUSAND)
TABLE 67 NETHERLANDS LIDAR MARKET, BY TYPE, 2018-2032 (USD THOUSAND)
TABLE 68 NETHERLANDS LIDAR MARKET, BY APPLICATION, 2018-2032 (USD THOUSAND)
TABLE 69 BELGIUM LIDAR MARKET, BY TYPE, 2018-2032 (USD THOUSAND)
TABLE 70 BELGIUM LIDAR MARKET, BY APPLICATION, 2018-2032 (USD THOUSAND)
TABLE 71 SWEDEN LIDAR MARKET, BY TYPE, 2018-2032 (USD THOUSAND)
TABLE 72 SWEDEN LIDAR MARKET, BY APPLICATION, 2018-2032 (USD THOUSAND)
TABLE 73 POLAND LIDAR MARKET, BY TYPE, 2018-2032 (USD THOUSAND)
TABLE 74 POLAND LIDAR MARKET, BY APPLICATION, 2018-2032 (USD THOUSAND)
TABLE 75 SWITZERLAND LIDAR MARKET, BY TYPE, 2018-2032 (USD THOUSAND)
TABLE 76 SWITZERLAND LIDAR MARKET, BY APPLICATION, 2018-2032 (USD THOUSAND)
TABLE 77 REST OF EUROPE LIDAR MARKET, BY TYPE, 2018-2032 (USD THOUSAND)
TABLE 78 MIDDLE EAST AND AFRICA LIDAR MARKET, BY COUNTRY, 2018-2032 (USD THOUSAND)
TABLE 79 MIDDLE EAST AND AFRICA LIDAR MARKET, BY TYPE, 2018-2032 (USD THOUSAND)
TABLE 80 MIDDLE EAST AND AFRICA LIDAR MARKET, BY APPLICATION, 2018-2032 (USD THOUSAND)
TABLE 81 SAUDI ARABIA LIDAR MARKET, BY TYPE, 2018-2032 (USD THOUSAND)
TABLE 82 SAUDI ARABIA LIDAR MARKET, BY APPLICATION, 2018-2032 (USD THOUSAND)
TABLE 83 U.A.E. LIDAR MARKET, BY TYPE, 2018-2032 (USD THOUSAND)
TABLE 84 U.A.E. LIDAR MARKET, BY APPLICATION, 2018-2032 (USD THOUSAND)
TABLE 85 SOUTH AFRICA LIDAR MARKET, BY TYPE, 2018-2032 (USD THOUSAND)
TABLE 86 SOUTH AFRICA LIDAR MARKET, BY APPLICATION, 2018-2032 (USD THOUSAND)
TABLE 87 EGYPT LIDAR MARKET, BY TYPE, 2018-2032 (USD THOUSAND)
TABLE 88 EGYPT LIDAR MARKET, BY APPLICATION, 2018-2032 (USD THOUSAND)
TABLE 89 ISRAEL LIDAR MARKET, BY TYPE, 2018-2032 (USD THOUSAND)
TABLE 90 ISRAEL LIDAR MARKET, BY APPLICATION, 2018-2032 (USD THOUSAND)
TABLE 91 REST OF MIDDLE EAST AND AFRICA LIDAR MARKET, BY TYPE, 2018-2032 (USD THOUSAND)
TABLE 92 SOUTH AMERICA LIDAR MARKET, BY COUNTRY, 2018-2032 (USD THOUSAND)
TABLE 93 SOUTH AMERICA LIDAR MARKET, BY TYPE, 2018-2032 (USD THOUSAND)
TABLE 94 SOUTH AMERICA LIDAR MARKET, BY APPLICATION, 2018-2032 (USD THOUSAND)
TABLE 95 BRAZIL LIDAR MARKET, BY TYPE, 2018-2032 (USD THOUSAND)
TABLE 96 BRAZIL LIDAR MARKET, BY APPLICATION, 2018-2032 (USD THOUSAND)
TABLE 97 ARGENTINA LIDAR MARKET, BY TYPE, 2018-2032 (USD THOUSAND)
TABLE 98 ARGENTINA LIDAR MARKET, BY APPLICATION, 2018-2032 (USD THOUSAND)
TABLE 99 REST OF SOUTH AMERICA LIDAR MARKET, BY TYPE, 2018-2032 (USD THOUSAND)
List of Figure
FIGURE 1 GLOBAL LIDAR MARKET
FIGURE 2 GLOBAL LIDAR MARKET: DATA TRIANGULATION
FIGURE 3 GLOBAL LIDAR MARKET: DROC ANALYSIS
FIGURE 4 GLOBAL LIDAR MARKET: GLOBAL VS REGIONAL MARKET ANALYSIS
FIGURE 5 GLOBAL LIDAR MARKET: COMPANY RESEARCH ANALYSIS
FIGURE 6 GLOBAL LIDAR MARKET: MULTIVARIATE MODELLING
FIGURE 7 GLOBAL LIDAR MARKET: INTERVIEW DEMOGRAPHICS
FIGURE 8 GLOBAL LIDAR MARKET: DBMR MARKET POSITION GRID
FIGURE 9 GLOBAL LIDAR MARKET: MARKET APPLICATION COVERAGE GRID
FIGURE 10 GLOBAL LIDAR MARKET: VENDOR SHARE ANALYSIS
FIGURE 11 GLOBAL LIDAR MARKET: SEGMENTATION
FIGURE 12 TWO SEGMENTS COMPRISE THE GLOBAL LIDAR MARKET, BY TYPE
FIGURE 13 GLOBAL LIDAR MARKET:-STRATEGIC DECISIONS
FIGURE 14 GLOBAL LIDAR MARKET EXECUTIVE SUMMARY
FIGURE 15 CONTINUOUS INNOVATIONS AND ADVANCEMENTS IN LIDAR TECHNOLOGY ARE EXPECTED TO DRIVE THE GLOBAL LIDAR MARKET IN THE FORECAST PERIOD
FIGURE 16 THE FIXED LIDAR SEGMENT IS EXPECTED TO ACCOUNT FOR THE LARGEST SHARE OF THE GLOBAL LIDAR MARKET IN 2025 AND 2032
FIGURE 17 NORTH AMERICA IS EXPECTED TO DOMINATE THE GLOBAL LIDAR MARKET, AND ASIA-PACIFIC IS EXPECTED TO GROW WITH THE HIGHEST CAGR IN THE FORECAST PERIOD
FIGURE 18 DRIVERS, RESTRAINTS, OPPORTUNITIES, AND CHALLENGES FOR GLOBAL LIDAR MARKET
FIGURE 19 GLOBAL LIDAR MARKET: BY TYPE, 2024
FIGURE 20 GLOBAL LIDAR MARKET: BY APPLICATION, 2024
FIGURE 21 GLOBAL LIDAR MARKET: SNAPSHOT (2024)
FIGURE 22 NORTH AMERICA LIDAR MARKET: SNAPSHOT (2024)
FIGURE 23 ASIA-PACIFIC LIDAR MARKET: SNAPSHOT (2024)
FIGURE 24 EUROPE LIDAR MARKET: SNAPSHOT (2024)
FIGURE 25 MIDDLE EAST AND AFRICA LIDAR MARKET: SNAPSHOT (2024)
FIGURE 26 SOUTH AMERICA LIDAR MARKET: SNAPSHOT (2024)
FIGURE 27 GLOBAL LIDAR MARKET: COMPANY SHARE 2024 (%)
FIGURE 28 EUROPE LIDAR MARKET: COMPANY SHARE 2024 (%)
FIGURE 29 ASIA-PACIFC LIDAR MARKET: COMPANY SHARE 2024 (%)
FIGURE 30 NORTH AMERICA LIDAR MARKET: COMPANY SHARE 2024 (%)
Global Lidar Market, Supply Chain Analysis and Ecosystem Framework
To support market growth and help clients navigate the impact of geopolitical shifts, DBMR has integrated in-depth supply chain analysis into its Global Lidar Market research reports. This addition empowers clients to respond effectively to global changes affecting their industries. The supply chain analysis section includes detailed insights such as Global Lidar Market consumption and production by country, price trend analysis, the impact of tariffs and geopolitical developments, and import and export trends by country and HSN code. It also highlights major suppliers with data on production capacity and company profiles, as well as key importers and exporters. In addition to research, DBMR offers specialized supply chain consulting services backed by over a decade of experience, providing solutions like supplier discovery, supplier risk assessment, price trend analysis, impact evaluation of inflation and trade route changes, and comprehensive market trend analysis.
Data collection and base year analysis are done using data collection modules with large sample sizes. The stage includes obtaining market information or related data through various sources and strategies. It includes examining and planning all the data acquired from the past in advance. It likewise envelops the examination of information inconsistencies seen across different information sources. The market data is analysed and estimated using market statistical and coherent models. Also, market share analysis and key trend analysis are the major success factors in the market report. To know more, please request an analyst call or drop down your inquiry.
The key research methodology used by DBMR research team is data triangulation which involves data mining, analysis of the impact of data variables on the market and primary (industry expert) validation. Data models include Vendor Positioning Grid, Market Time Line Analysis, Market Overview and Guide, Company Positioning Grid, Patent Analysis, Pricing Analysis, Company Market Share Analysis, Standards of Measurement, Global versus Regional and Vendor Share Analysis. To know more about the research methodology, drop in an inquiry to speak to our industry experts.
Data Bridge Market Research is a leader in advanced formative research. We take pride in servicing our existing and new customers with data and analysis that match and suits their goal. The report can be customized to include price trend analysis of target brands understanding the market for additional countries (ask for the list of countries), clinical trial results data, literature review, refurbished market and product base analysis. Market analysis of target competitors can be analyzed from technology-based analysis to market portfolio strategies. We can add as many competitors that you require data about in the format and data style you are looking for. Our team of analysts can also provide you data in crude raw excel files pivot tables (Fact book) or can assist you in creating presentations from the data sets available in the report.


