
Europe Aesthetic And Cosmetic Surgery Devices Market
Market Size in USD Billion
 USD
1.06 Billion
USD
1.90 Billion
2025
2033
USD
1.06 Billion
USD
1.90 Billion
2025
2033
| 2026 - 2033 | |
| USD 1.06 Billion | |
| USD 1.90 Billion | |
| % | |
|
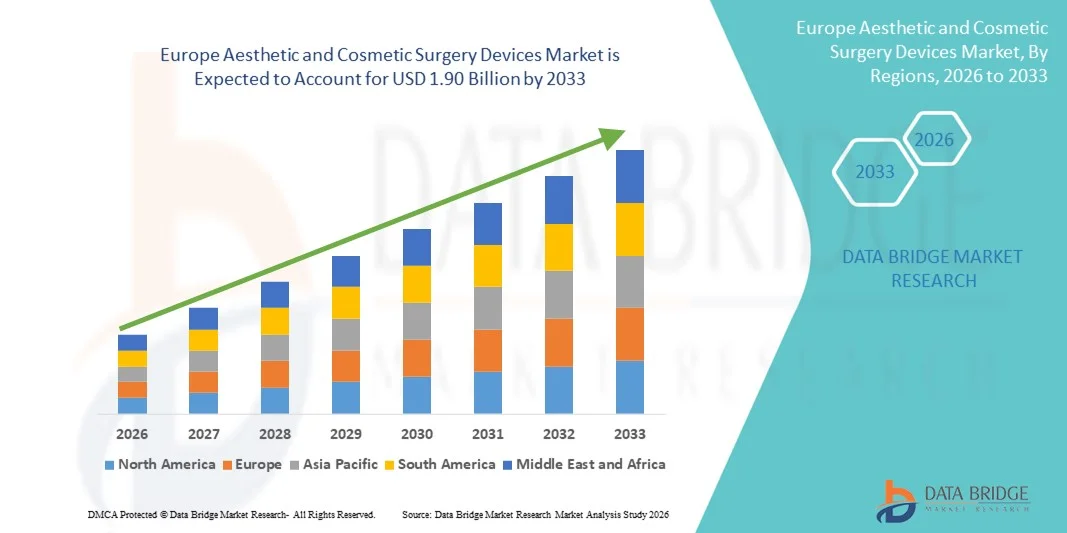
What is the Europe Aesthetic and Cosmetic Surgery Devices Market Size and Overview?
- The Europe aesthetic and cosmetic surgery devices market size was valued at USD 1.06 billion in 2025 and is expected to reach USD 1.90 billion by 2033, at a CAGR of 7.6% during the forecast period
- The market growth is largely fueled by advancements in aesthetic and cosmetic technologies, rising adoption of minimally invasive and non‑surgical procedures, and increasing consumer demand for aesthetic enhancements across both clinical and cosmetic practice settings
- Furthermore, expanding awareness of aesthetic treatments, greater disposable incomes, and an aging population focused on appearance enhancement are driving the uptake of advanced devices in dermatology clinics, hospitals, and medical spas throughout Europe. These converging factors are accelerating the demand for sophisticated, safe, and effective cosmetic surgery solutions, thereby significantly boosting the industry’s growth
Market Size & Forecast
- Europe Market Value (2025):USD 1.06 billion
- Expected Market Value (2033):USD 1.90 billion
- Forecast CAGR (2025 –2033): 7.6%
Europe Aesthetic and Cosmetic Surgery Devices Market Analysis
- Aesthetic and cosmetic surgery devices, including breast implants, body implants, and custom-made implants, are becoming increasingly vital in Europe’s healthcare and beauty sectors due to their ability to provide safe, effective, and personalized solutions for reconstructive and cosmetic procedures
- The escalating demand for these devices is primarily fueled by rising consumer awareness of cosmetic procedures, increasing disposable incomes, and the growing preference for minimally invasive and tailored implant solutions
- Germany dominated the market with the largest revenue share of 28.7% in 2025, characterized by advanced healthcare infrastructure, high adoption of cosmetic procedures, and a strong presence of leading device manufacturers offering innovative breast and body implant solutions
- France is expected to be the fastest-growing country in the market during the forecast period, driven by increasing medical tourism, growing urban populations, and rising demand for aesthetic enhancements in clinics, hospitals, and dermatology centers
- The breast implant/mammary implant segment dominated the market with a share of 41.2% in 2025, driven by its high demand for both reconstructive and cosmetic purposes, established safety standards, and strong adoption across clinics and hospitals throughout Europe
Report Scope and Europe Aesthetic and Cosmetic Surgery Devices Market Segmentation
|
Attributes |
Europe Aesthetic and Cosmetic Surgery Devices Key Market Insights |
|
Segments Covered |
|
|
Countries Covered |
Europe
|
|
Key Market Players |
|
|
Market Opportunities |
|
|
Value Added Data Infosets |
|
What is the Key Trend in the Europe Aesthetic and Cosmetic Surgery Devices Market?
Rising Demand for Minimally Invasive and Custom Solutions
- A significant and accelerating trend in the European aesthetic and cosmetic surgery devices market is the growing adoption of minimally invasive procedures and personalized implant solutions, which provide safer and faster recovery compared to traditional surgical methods
- For instance, the Motiva Ergonomix breast implant allows for customized shaping and minimal incision surgery, giving patients a tailored cosmetic outcome. Similarly, Polytech’s custom body implants offer precise anatomical matching for reconstructive and aesthetic purposes
- The seamless integration of digital imaging, 3D scanning, and planning software with implant design facilitates highly personalized procedures. Through a single preoperative planning platform, surgeons can simulate results and select the most suitable implant type and size, creating a unified workflow for aesthetic enhancements
- This trend towards safer, patient-specific, and technologically advanced devices is fundamentally reshaping expectations in cosmetic surgery. Consequently, companies such as Establishment Labs are developing implants and devices with integrated planning software and customizable features to meet evolving patient demands
- The demand for aesthetic and cosmetic surgery devices that offer minimally invasive and customized solutions is growing rapidly across clinics, hospitals, and dermatology centers, as patients increasingly prioritize safety, effectiveness, and personalized results
- For instance, the increasing use of hybrid implants combining polymers and biomaterials enables better biocompatibility and long-term durability, attracting both surgeons and patients seeking reliable options
- In addition, the adoption of connected surgical devices with data-tracking capabilities allows clinics to monitor outcomes and optimize procedures, enhancing patient confidence and clinic reputation
Europe Aesthetic and Cosmetic Surgery Devices Market Dynamics
Driver
Increasing Demand Due to Growing Cosmetic Awareness and Disposable Income
- The rising awareness of aesthetic procedures among consumers, coupled with increasing disposable incomes in European countries, is a significant driver for the heightened demand for cosmetic surgery devices
- For instance, in March 2025, Polytech announced the expansion of its custom implant offerings in Germany and France, targeting both reconstructive and cosmetic procedures, expected to boost device adoption across clinics and hospitals
- As patients become more conscious of physical appearance and the benefits of minimally invasive procedures, aesthetic devices provide predictable and high-quality outcomes, making them a preferred choice over traditional methods
- Furthermore, the increasing prevalence of medical tourism in France, Italy, and Spain is making advanced cosmetic surgery devices essential for clinics catering to international patients, offering safe and reliable treatment solutions
- The availability of user-friendly devices, comprehensive training for surgeons, and advancements in implant design are key factors propelling the adoption of aesthetic and cosmetic surgery devices across hospitals, dermatology centers, and private clinics
- For instance, Germany’s growing elderly population is driving demand for reconstructive and rejuvenation procedures, further boosting device adoption in hospitals and specialized clinics
- In addition, partnerships between device manufacturers and dermatology chains in the U.K. and Italy are expanding access to high-quality implants and training programs, accelerating market growth
Restraint/Challenge
Regulatory Compliance and High Device Cost
- The stringent regulatory standards and certification requirements for medical devices across Europe pose a significant challenge to faster market penetration, as compliance delays product launches
- For instance, delays in CE marking approval for certain custom implants have made some clinics hesitant to adopt newer technologies immediately
- Addressing these regulatory hurdles through proactive approvals, clinical validation, and adherence to EU medical device regulations is crucial for building trust among healthcare providers. In addition, the high cost of advanced implants and equipment compared to conventional options can be a barrier for price-sensitive clinics or smaller hospitals
- While device prices are gradually becoming more competitive, premium implants and advanced surgical equipment still carry a significant cost, which may restrict adoption, particularly for smaller clinics or emerging markets within Europe
- Overcoming these challenges through regulatory compliance, cost optimization, and clinician training programs will be vital for sustained growth in the European aesthetic and cosmetic surgery devices market
- For instance, some clinics in Spain and Portugal delay adoption of newer implant technologies due to budget constraints, despite proven clinical benefits
- In addition, potential complications or adverse reactions, though rare, can impact clinician confidence and patient perception, making post-market surveillance and proper training essential for market expansion
Europe Aesthetic and Cosmetic Surgery Devices Market Scope
The market is segmented on the basis of type, raw material, end user, and distribution channel.
- By Type
On the basis of type, the market is segmented into breast implant/mammary implants, implants for the body, and custom-made implants. The breast implant/mammary implant segment dominated the market with the largest revenue share of 41.2% in 2025, driven by strong demand for both reconstructive and cosmetic purposes. These implants are widely used in hospitals and clinics across Germany, France, and the U.K., owing to their established safety standards and predictable outcomes. Breast implants offer both aesthetic enhancement and post-surgical reconstruction, increasing their adoption in medical and cosmetic settings. The segment also benefits from innovations such as textured surfaces, cohesive gels, and ergonomic designs that improve patient comfort and satisfaction. Leading manufacturers focus on advanced breast implants due to their higher adoption and visibility among patients seeking elective cosmetic procedures. Surgeons often prefer breast implants for their reliability, versatility, and broad clinical acceptance, which sustains the segment’s dominant position in Europe.
The custom-made implants segment is anticipated to witness the fastest growth rate of 19.8% from 2026 to 2033, fueled by increasing demand for personalized and patient-specific solutions. Custom implants allow precise anatomical matching for reconstructive and cosmetic procedures, enhancing patient outcomes and satisfaction. Clinics and dermatology centers increasingly prefer custom solutions for complex cases requiring tailored implants. Technological advancements such as 3D scanning and printing enable the production of high-precision implants, further driving adoption. The growth is also supported by rising awareness of aesthetic enhancements and the desire for unique, patient-focused results. Patients increasingly value the combination of safety, personalization, and minimal invasiveness, making custom implants a fast-growing subsegment in Europe.
- By Raw Material
On the basis of raw material, the market is segmented into polymers, metals, and biomaterials. The polymers segment dominated the market with the largest revenue share of 46% in 2025, owing to their lightweight nature, biocompatibility, and versatility across breast and body implants. Polymer-based implants are widely adopted in Germany, France, and Italy due to their predictable performance, low risk of rejection, and ease of customization. Surgeons favor polymer implants for both aesthetic and reconstructive procedures, as they allow a range of shapes, sizes, and textures to match patient anatomy. Continuous innovations in polymer technology, including cohesive gels and soft-touch surfaces, enhance the natural feel and durability of implants. Polymer implants also enable minimally invasive implantation techniques, reducing recovery time and increasing patient satisfaction. The segment’s dominance is sustained by the combination of clinical acceptance, safety, and design flexibility.
The biomaterials segment is expected to witness the fastest growth rate of 18.5% from 2026 to 2033, driven by increasing use in custom and reconstructive implants. Biomaterials offer superior biocompatibility and can integrate with surrounding tissues, making them ideal for complex procedures. Hospitals and clinics across France, the U.K., and Spain are increasingly adopting biomaterial implants due to their safety profile and enhanced performance. Technological advancements such as bioengineered scaffolds and tissue-friendly coatings further fuel adoption. Rising patient awareness of safer and longer-lasting implants is encouraging the shift toward biomaterials. The ability to reduce complications and improve aesthetic outcomes is a key factor propelling the rapid growth of this segment.
- By End User
On the basis of end user, the market is segmented into clinics, hospitals, dermatology clinics, and others. The hospitals segment dominated the market with the largest revenue share of 39% in 2025, driven by the availability of advanced surgical facilities, skilled surgeons, and adoption of high-end implants for both reconstructive and cosmetic procedures. Hospitals in Germany, France, and Italy offer integrated services including preoperative planning, surgery, and postoperative care, enhancing patient trust and satisfaction. The dominance of hospitals is supported by their ability to handle complex procedures and the availability of advanced imaging and planning tools. Hospitals also benefit from collaborations with leading device manufacturers to access the latest implants and technologies. Patient confidence in hospital procedures further strengthens the adoption of aesthetic and cosmetic surgery devices. The segment remains dominant due to infrastructure, clinical expertise, and high patient inflow.
The clinics segment is expected to witness the fastest growth rate of 20.3% from 2026 to 2033, fueled by the rise of specialized aesthetic and dermatology clinics offering minimally invasive procedures. Clinics across the U.K., Spain, and France are increasingly adopting advanced implants and devices to meet growing patient demand. Clinics provide a convenient, personalized experience and often focus on elective procedures, making them attractive to patients seeking cosmetic enhancements. The trend toward outpatient and minimally invasive treatments drives the need for efficient and portable devices. Partnerships with implant manufacturers for training and product access further support rapid adoption. The segment’s growth is enhanced by rising awareness, shorter procedure times, and patient preference for clinic-based treatments.
- By Distribution Channel
On the basis of distribution channel, the market is segmented into direct tender and retail pharmacies. The direct tender segment dominated the market with the largest revenue share of 52% in 2025, driven by large-scale procurement by hospitals, government institutions, and clinics. Direct tender agreements with manufacturers ensure consistent supply, access to the latest implants, and competitive pricing for high-volume buyers. Hospitals and clinics in Germany, France, and Italy prefer direct procurement for bulk requirements and long-term contracts. The segment also allows manufacturers to provide training, support, and maintenance services, strengthening relationships with key healthcare providers. Direct tender provides reliability, cost efficiency, and assured access to premium products, sustaining its market dominance. Manufacturers also leverage direct tenders to introduce new implants and devices in large healthcare networks.
The retail pharmacies segment is expected to witness the fastest growth rate of 17.9% from 2026 to 2033, driven by increasing availability of over-the-counter aesthetic devices and non-invasive solutions. Pharmacies in the U.K., Spain, and France provide patients with access to home-use devices, injectable kits, and minor cosmetic tools. Rising awareness of self-care, non-surgical treatments, and convenient access to devices contributes to this growth. The retail channel allows patients to explore products without hospital visits, enhancing adoption among younger demographics. Partnerships between pharmacies and device manufacturers for promotions, training, and product launches further boost market penetration. The segment’s growth reflects consumer preference for accessibility, convenience, and preventive aesthetic care.
Europe Aesthetic and Cosmetic Surgery Devices Market Regional Analysis
- Germany dominated the market with the largest revenue share of 28.7% in 2025, characterized by advanced healthcare infrastructure, high adoption of cosmetic procedures, and a strong presence of leading device manufacturers offering innovative breast and body implant solutions
- Patients and clinics in the region highly value safety, efficacy, and predictable outcomes, as well as the availability of minimally invasive and personalized implant solutions that improve recovery time and overall satisfaction
- This widespread adoption is further supported by high disposable incomes, a well-informed patient population, and growing medical tourism, establishing Germany as a key market for both hospitals and aesthetic clinics offering reconstructive and cosmetic procedures
The Germany Aesthetic and Cosmetic Surgery Devices Market Insight
The Germany market captured the largest revenue share of 28.7% in 2025, fueled by advanced healthcare infrastructure, high adoption of cosmetic procedures, and a strong presence of leading device manufacturers offering innovative breast, body, and custom-made implants. German patients and clinics value safety, high-quality outcomes, and the availability of minimally invasive solutions. The integration of digital planning tools, 3D imaging, and custom implant design is increasingly prevalent in hospitals and specialized clinics. Rising investments in training programs for surgeons and increasing patient focus on aesthetic enhancements further drive growth. Germany remains a hub for both domestic and international patients seeking high-quality reconstructive and cosmetic treatments.
France Aesthetic and Cosmetic Surgery Devices Market Insight
The France market is expected to be the fastest-growing country during the forecast period, driven by rising medical tourism, increasing awareness of aesthetic procedures, and growing demand for minimally invasive implants. Clinics, hospitals, and dermatology centers in France are adopting advanced breast and body implants to meet the needs of domestic and international patients. Technological advancements in implant materials, such as polymers and biomaterials, support patient safety and improve outcomes. French patients increasingly prioritize shorter recovery times and personalized solutions, fueling adoption. Investments in clinic infrastructure, combined with surgeon training programs, are further supporting rapid growth.
U.K. Aesthetic and Cosmetic Surgery Devices Market Insight
The U.K. market is anticipated to grow at a noteworthy CAGR during the forecast period, driven by increasing demand for cosmetic enhancements, higher disposable incomes, and a growing preference for minimally invasive procedures. Awareness campaigns and accessibility to advanced aesthetic procedures encourage adoption across hospitals and dermatology clinics. Clinics focus on patient-centric approaches, offering customized implants and high-quality post-operative care. Partnerships with device manufacturers for training and supply of implants further enhance market penetration. Rising interest in non-surgical procedures and outpatient cosmetic services is also boosting adoption in both urban and suburban areas.
Italy Aesthetic and Cosmetic Surgery Devices Market Insight
The Italy market is gaining momentum due to increasing cosmetic awareness, expanding medical tourism, and rising investments in aesthetic clinics. Italian hospitals and specialized centers are adopting advanced breast, body, and custom-made implants to cater to domestic and international patients. Integration of 3D imaging and digital planning platforms ensures precise outcomes and enhances patient satisfaction. Patients are increasingly seeking minimally invasive solutions with faster recovery times, driving device demand. Continuous innovation by local and international manufacturers is supporting market growth. Italy’s strong focus on aesthetic procedures and patient experience is reinforcing adoption across hospitals and clinics.
Which are the Top Companies in Europe Aesthetic and Cosmetic Surgery Devices Market?
The Europe Aesthetic and Cosmetic Surgery Devices industry is primarily led by well-established companies, including:
- FOTONA d.o.o. (Slovenia)
- POLYTECH Health & Aesthetics GmbH (Germany)
- TEOXANE (Switzerland)
- Lumenis Be Ltd. (Israel)
- Sientra, Inc. (U.S.)
- GC Aesthetics (Ireland)
- Laboratoires VIVACY (France)
- Sinclair Pharma (U.K.)
- Alma Lasers (Israel)
- Asclepion Laser Technologies GmbH (Germany)
- IBSA Institut Biochimique SA (Switzerland)
- Innoaesthetics S.L. (Spain)
- Merz Aesthetics (Germany)
- Allergan Aesthetics (U.S.)
- GALDERMA (Switzerland)
- Syneron Candela Ltd. (U.S.)
- BTL Industries Ltd. (Czech Republic)
- Cutera, Inc. (U.S.)
What are the Recent Developments in Europe Aesthetic and Cosmetic Surgery Devices Market?
- In January 2025, Merz Aesthetics launched Ultherapy PRIME® in the EMEA region at the 2025 IMCAS World Congress, introducing an advanced non‑invasive skin lifting device with customizable treatment capabilities. The launch in Frankfurt, Germany showcased next‑generation ultrasound technology designed to improve collagen stimulation and regenerative aesthetics, reinforcing Merz’s leadership in non‑surgical lifting solutions across Europe
- In November 2023, TÜV SÜD released the world’s first certificate for an aesthetic product under Annex XVI of the EU MDR a hyaluronic acid‑based dermal filler. This certification marked a crucial regulatory advancement for injectable aesthetic products beyond traditional medical‑purpose devices, helping broaden compliant product availability and safety assurance for European consumers
- In May 2023, Establishment Labs announced CE mark approval for its advanced minimally invasive surgical tools (including Motiva Injector, Motiva Inflatable Balloon, and Motiva Channel Dissector). This regulatory clearance under the European MDR enabled the company to market its next‑generation tools designed to improve outcomes in aesthetic breast procedures across Europe, highlighting ongoing innovation in surgical device technology
- In February 2023, Neauvia became the first medical aesthetics business to attain CE marking under the EU Medical Device Regulation (MDR) for its range of facial dermal fillers. The new MDR certification represents a stricter regulatory standard than the previous directive, ensuring higher safety and performance compliance for aesthetic devices sold in Europe. This milestone positioned Neauvia as a pioneer in a more rigorously regulated European aesthetics market and boosted confidence among practitioners using these dermal fillers
- In March 2021, the South Korea‑based dermal filler Artgaon received CE mark certification and targeted the European aesthetic market. Although manufactured outside Europe, Artgaon’s CE certification demonstrates Europe’s role as a key regulated market for high‑quality injectable aesthetic products and highlights early adoption of advanced filler technology in the region
SKU-

- Interactive Data Analysis Dashboard
- Company Analysis Dashboard for high growth potential opportunities
- Research Analyst Access for customization & queries
- Competitor Analysis with Interactive dashboard
- Latest News, Updates & Trend analysis
- Harness the Power of Benchmark Analysis for Comprehensive Competitor Tracking
Data collection and base year analysis are done using data collection modules with large sample sizes. The stage includes obtaining market information or related data through various sources and strategies. It includes examining and planning all the data acquired from the past in advance. It likewise envelops the examination of information inconsistencies seen across different information sources. The market data is analysed and estimated using market statistical and coherent models. Also, market share analysis and key trend analysis are the major success factors in the market report. To know more, please request an analyst call or drop down your inquiry.
The key research methodology used by DBMR research team is data triangulation which involves data mining, analysis of the impact of data variables on the market and primary (industry expert) validation. Data models include Vendor Positioning Grid, Market Time Line Analysis, Market Overview and Guide, Company Positioning Grid, Patent Analysis, Pricing Analysis, Company Market Share Analysis, Standards of Measurement, Global versus Regional and Vendor Share Analysis. To know more about the research methodology, drop in an inquiry to speak to our industry experts.
Data Bridge Market Research is a leader in advanced formative research. We take pride in servicing our existing and new customers with data and analysis that match and suits their goal. The report can be customized to include price trend analysis of target brands understanding the market for additional countries (ask for the list of countries), clinical trial results data, literature review, refurbished market and product base analysis. Market analysis of target competitors can be analyzed from technology-based analysis to market portfolio strategies. We can add as many competitors that you require data about in the format and data style you are looking for. Our team of analysts can also provide you data in crude raw excel files pivot tables (Fact book) or can assist you in creating presentations from the data sets available in the report.


