
Europe Agricultural Sprayers Market
Market Size in USD Million
 USD
4,751.10 Million
USD
7,073.20 Million
2021
2029
USD
4,751.10 Million
USD
7,073.20 Million
2021
2029
| 2022 - 2029 | |
| USD 4,751.10 Million | |
| USD 7,073.20 Million | |
| % | |
|
Market Analysis and Size
Farming has seen significant advancements in terms of farm mechanisation, irrigation techniques, and the ease with which credit is available over the years. The demand for agricultural sprayers has increased due to increased farmer awareness, a shift toward using modern agricultural techniques, and increased production of various crop types in the agricultural sprayers market.
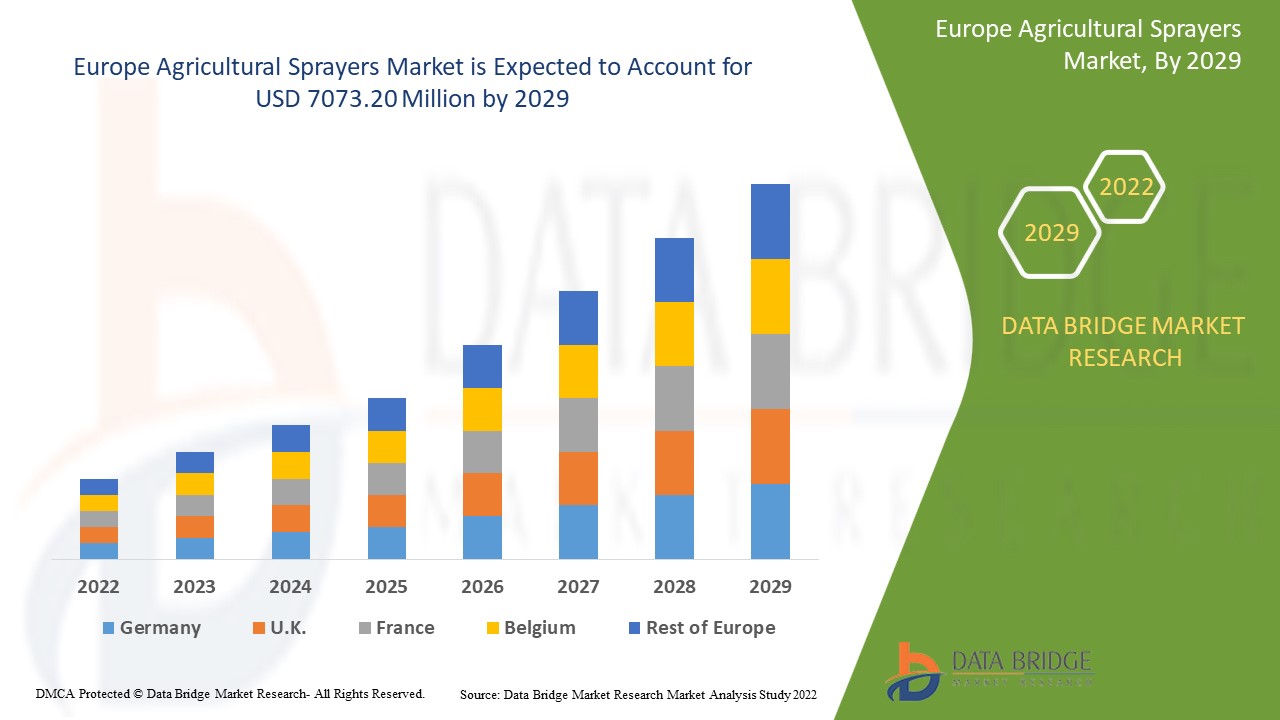
Data Bridge Market Research analyses that the agricultural sprayers market was valued at USD 4,751.10 million is expected to reach the value of USD 7073.20 million by 2029, at a CAGR of 5.1% during the forecast period of 2022-2029.
Market Definition
Agricultural sprayers are pieces of equipment used to apply liquid substances to plants or crops. Herbicides, fertilizers, and pesticides are examples of such chemicals. Agricultural sprayers can also be used to irrigate crops and protect them from pests. Agricultural sprayers make it easier for farmers to apply liquid substances than traditional watering methods, and they can cover a large crop field in a short period of time.
|
Report Metric |
Details |
|
Forecast Period |
2022 to 2029 |
|
Base Year |
2021 |
|
Historic Years |
2020 (Customizable to 2019 - 2014) |
|
Quantitative Units |
Revenue in USD Million, Volumes in Units, Pricing in USD |
|
Segments Covered |
By Type (Self-Propelled, Tractor-Mounted, Trailed, Aerial and Others), Energy Source (Fuel-Based, Electricity & Battery Driven, Solar and Manual), Capacity (Ultra-Low Volume, Low Volume and High Volume), Farm Size (Large, Medium and Small), Technology (Hydraulic Nozzle Spray Technology (Hydraulic Spray Systems), Air-Assisted Electrostatic Spray Technology, Variable Rate Technology (VRT) and Others), Crop Type (Cereals, Oilseed, Fruits & Vegetables and Others) |
|
Countries Covered |
Germany, Sweden, Poland, Denmark, Italy, U.K., France, Spain, Netherland, Belgium, Switzerland, Turkey, Russia, Rest of Europe |
|
Market Players Covered |
DTN (US), Farmers Edge Inc. (Canada), Taranis (US), Eurofins Scientific (Luxembourg), AgriWebb (Australia), Monsanto Company (US), Bayer AG (Germany), Deere & Company. (US), Accenture (Ireland), Syngenta Crop Protection AG (Switzerland), AgGateway (US), CropX inc. (US), Farmers Business Network (US), BASF SE (Germany), DigitalGlobe (US) |
|
Opportunities |
|
Agricultural Sprayers Market Dynamics
This section deals with understanding the market drivers, advantages, opportunities, restraints and challenges. All of this is discussed in detail below:
- Farmers shifts towards advanced agricultural techniques
The rising demand for agricultural sprayers and the emerging economy are propelling the market forward. The need for farming sprayers has increased due to increased farmer awareness, a shift toward using modern agricultural techniques, and increased crop production of various crop types.
- Growing use of precision farming technique
Agricultural sprayer manufacturers are increasingly focused on improving farmers' capabilities and knowledge in order to make them more productive and competitive in the market. Furthermore, the growing use of precision farming techniques has increased the ability of sprayer manufacturers to make agricultural steps more efficient and predictable.
Opportunity
Various technological advancements are taking place in the farming industry. Farmers can now engage in effective weed management practices due to increased demand for advanced technical solutions, modern technology, and agriculture. Farmers' increased awareness of equipment such as sprayers fuels the global sprayers market's growth. Furthermore, modern agricultural techniques such as precision farming assist growers in increasing revenue from agribusinesses. Precision farming aids in obtaining accurate information about the application of irrigation water, liquid fertilizers, nutrients, herbicides, and pesticides on the field, reducing resource waste. Farmers can improve crop fertility, productivity, profitability, and sustainability by using mapping software, variable rate technology (VRT), yield mapping, and other modern farming techniques.
Restraints
These are some of the common issues associated with agricultural mechanization that may limit the growth of the agricultural sprayers market. Increasing fuel prices limits equipment usage and demand, creating challenges for the agricultural sprayers market during the aforementioned forecast period.
This agricultural sprayers market report provides details of new recent developments, trade regulations, import-export analysis, production analysis, value chain optimization, market share, impact of domestic and localized market players, analyses opportunities in terms of emerging revenue pockets, changes in market regulations, strategic market growth analysis, market size, category market growths, application niches and dominance, product approvals, product launches, geographic expansions, technological innovations in the market. To gain more info on the agricultural sprayers market contact Data Bridge Market Research for an Analyst Brief, our team will help you take an informed market decision to achieve market growth.
COVID-19 Impact on Agricultural Sprayers Market
The COVID-19 pandemic has had a minor impact on the agricultural sprayer supply chain. Movement restrictions and illnesses are causing labour shortages and a decrease in the supply of new sprayers to customers because the companies' manufacturing units were closed, new sprayer unit production was hampered in the first and second quarters of the year. However, production is expected to resume on a regular basis following a reduction in government barriers such as lockdowns and trade bans. Companies have begun to open their manufacturing units after taking all necessary precautions, such as regular temperature checks, the use of PPE equipment, and a limited number of employees.
Recent Development
- In the trailed sprayer market, Horsch MaschinenGmbH introduced a new model, the Leeb12 TD, in 2019. The model has a large capacity of 12,000 litres and an innovative tandem axle and tank system.
- CNH industrial NV, through its subsidiary Case iH, introduced the Patriot 250 Extreme in March 2018, which features a PWM system that automatically regulates the product pump, achieving greater precision and stability in application rates during speed variations.
Europe Agricultural Sprayers Market Scope
The agricultural sprayers market is segmented on the basis of type, energy source, capacity, farm size, technology and crop type. The growth amongst these segments will help you analyze meagre growth segments in the industries and provide the users with a valuable market overview and market insights to help them make strategic decisions for identifying core market applications.
Type
- Self-propelled
- Tractor-mounted
- Trailed
- Aerial
- Others
On the basis of type, the Europe agricultural sprayers market is segmented into self-propelled, tractor-mounted, trailed, aerial and others.
Energy source
- Fuel-based
- Electricity & battery driven
- Solar
- Manual
On the basis of energy source, the Europe agricultural sprayers market is segmented into fuel-based, electricity & battery driven, solar and manual.
Capacity
- Ultra-low volume
- Low volume
- High volume
On the basis of capacity, the Europe agricultural sprayers market is segmented into ultra-low volume, low volume and high volume.
Farm size
- Large
- Medium
- Small
On the basis of farm size, the Europe agricultural sprayers market is segmented into large, medium and small.
Technology
- Hydraulic nozzle spray technology (hydraulic spray systems)
- Air-assisted electrostatic spray technology
- Variable rate technology (VRT)
- Others
On the basis of technology, the Europe agricultural sprayers market is segmented into hydraulic nozzle spray technology (hydraulic spray systems), air-assisted electrostatic spray technology, variable rate technology (VRT) and others.
Crop type
- Cereals
- Oilseed
- Fruits & vegetables
- Others
On the basis of crop type, the Europe agricultural sprayers market is segmented into cereals, oilseed, fruits & vegetables and others.
Agricultural Sprayers Market Regional Analysis/Insights
The agricultural sprayers market is analyzed and market size insights and trends are provided by country type, energy source, capacity, farm size, technology and crop type as referenced above.
The countries covered in the agricultural sprayers market report are Germany, Sweden, Poland, Denmark, Italy, U.K., France, Spain, Netherland, Belgium, Switzerland, Turkey, Russia, Rest of Europe
The country section of the report also provides individual market impacting factors and changes in market regulation that impact the current and future trends of the market. Data points like down-stream and upstream value chain analysis, technical trends and porter's five forces analysis, case studies are some of the pointers used to forecast the market scenario for individual countries. Also, the presence and availability of Europe brands and their challenges faced due to large or scarce competition from local and domestic brands, impact of domestic tariffs and trade routes are considered while providing forecast analysis of the country data.
Competitive Landscape and Agricultural Sprayers Market Share Analysis
The agricultural sprayers market competitive landscape provides details by competitor. Details included are company overview, company financials, revenue generated, market potential, investment in research and development, new market initiatives, Europe presence, production sites and facilities, production capacities, company strengths and weaknesses, product launch, product width and breadth, application dominance. The above data points provided are only related to the companies' focus related to agricultural sprayers market.
Some of the major players operating in the agricultural sprayers market are:
- DTN (US)
- Farmers Edge Inc. (Canada)
- Taranis (US)
- Eurofins Scientific (Luxembourg)
- AgriWebb (Australia)
- Monsanto Company (US)
- Bayer AG (Germany)
- Deere & Company. (US)
- Accenture (Ireland)
- Syngenta Crop Protection AG (Switzerland)
- AgGateway (US)
- CropX inc. (US)
- Farmers Business Network (US)
- BASF SE (Germany)
- DigitalGlobe (US)
SKU-

- Interactive Data Analysis Dashboard
- Company Analysis Dashboard for high growth potential opportunities
- Research Analyst Access for customization & queries
- Competitor Analysis with Interactive dashboard
- Latest News, Updates & Trend analysis
- Harness the Power of Benchmark Analysis for Comprehensive Competitor Tracking
Table of Content
1 INTRODUCTION
1.1 OBJECTIVES OF THE STUDY
1.2 MARKET DEFINITION
1.3 OVERVIEW OF EUROPE AGRICULTURAL SPRAYERS MARKET
1.4 LIMITATIONS
1.5 MARKETS COVERED
2 MARKET SEGMENTATION
2.1 MARKETS COVERED
2.2 GEOGRAPHICAL SCOPE
2.3 YEARS CONSIDERED FOR THE STUDY
2.4 CURRENCY AND PRICING
2.5 DBMR TRIPOD DATA VALIDATION MODEL
2.6 MULTIVARIATE MODELLING
2.7 TYPE LIFELINE CURVE
2.8 PRIMARY INTERVIEWS WITH KEY OPINION LEADERS
2.9 DBMR MARKET POSITION GRID
2.1 VENDOR SHARE ANALYSIS
2.11 SECONDARY SOURCES
2.12 ASSUMPTIONS
3 EXECUTIVE SUMMARY
4 PREMIUM INSIGHTS
4.1 EXEL INDUSTRIES BRAND SHARE ANALYSIS: EUROPE
4.2 COMPONENTS OF AGRICULTURAL SPRAYERS IN THE EUROPE AGRICULTURAL SPRAYERS MARKET
5 REGULATORY FRAMEWORK AND EVOLUTION
5.1 EVOLUTION
6 MARKET OVERVIEW
6.1 DRIVERS
6.1.1 INCREASING PRODUCTION OF AGRICULTURAL EQUIPMENT ACROSS THE WORLD
6.1.2 PROMOTION OF MODERN AGRICULTURAL TECHNIQUES THROUGH GOVERNMENT SUPPORT
6.1.3 AIR-ASSISTED ELECTROSTATIC SPRAYING AND ITS IMPACT TO AGRICULTURE
6.1.4 SAFETY BENEFITS OFFERED BY AGRICULTURAL SPRAYERS
6.2 RESTRAINTS
6.2.1 PROBLEMS ASSOCIATED WITH AGRICULTURAL MECHANIZATION
6.2.2 AGRICULTURAL EQUIPMENT & ENVIRONMENTAL IMPACT
6.3 OPPORTUNITIES
6.3.1 USE OF UNMANNED AERIAL VEHICLES (UAV’S) IN AGRICULTURAL SPRAYING
6.3.2 INNOVATIONS IN AGRICULTURAL SPRAYING EQUIPMENT INDUSTRY
6.3.3 OPPORTUNITIES ASSOCIATED WITH MANUALLY OPERATED AGRICULTURAL SPRAYERS
6.4 CHALLENGES
6.4.1 INCREASING FUEL PRICES
6.4.2 CHALLENGES ASSOCIATED WITH THE PRODUCTION OF AGRICULTURAL EQUIPMENT
7 COVID-19 IMPACT ON AGRICULTURE SPRAYERS MARKET
7.1 AFTERMATH OF COVID-19 AND GOVERNMENT INITIATIVES TO BOOST UP THE MARKET
7.2 STRATEGIC DECISION FOR MANUFACTURERS AFTER COVID-19 TO GAIN COMPETITIVE MARKET SHARE
7.3 PRICE IMPACT
7.4 IMPACT ON DEMAND
7.5 IMPACT ON SUPPLY CHAIN
7.6 CONCLUSION
8 EUROPE AGRICULTURAL SPRAYERS MARKET, BY TYPE
8.1 OVERVIEW
8.2 TRACTOR-MOUNTED
8.3 SELF-PROPELLED
8.3.1 MEDIUM HP
8.3.2 HIGH HP
8.3.3 LOW HP
8.4 TRAILED
8.5 AERIAL
8.6 OTHERS
9 EUROPE AGRICULTURAL SPRAYERS MARKET, BY ENERGY SOURCE
9.1 OVERVIEW
9.2 FUEL-BASED
9.3 ELECTRIC & BATTERY DRIVEN
9.4 MANUAL
9.5 SOLAR
10 EUROPE AGRICULTURAL SPRAYERS MARKET, BY CAPACITY
10.1 OVERVIEW
10.2 HIGH VOLUME
10.2.1 <3,500 L
10.2.2 4,000-6,000
10.2.3 >6,000
10.3 LOW VOLUME
10.4 ULTRA-LOW VOLUME
11 EUROPE AGRICULTURAL SPRAYERS MARKET, BY FARM SIZE
11.1 OVERVIEW
11.2 SMALL
11.3 LARGE
11.4 MEDIUM
12 EUROPE AGRICULTURAL SPRAYERS MARKET, BY TECHNOLOGY
12.1 OVERVIEW
12.2 HYDRAULIC NOZZLE SPRAY TECHNOLOGY (HYDRAULIC SPRAY SYSTEMS)
12.3 VARIABLE RATE TECHNOLOGY (VRT)
12.4 AIR-ASSISTED ELECTROSTATIC SPRAY TECHNOLOGY
12.5 OTHERS
13 EUROPE AGRICULTURAL SPRAYERS MARKET, BY CROP TYPE
13.1 OVERVIEW
13.2 FRUITS & VEGETABLES
13.3 CEREALS
13.4 OILSEED
13.5 OTHERS
14 EUROPE AGRICULTURAL SPRAYERS MARKET, BY REGION
14.1 EUROPE
14.1.1 FRANCE
14.1.2 GERMANY
14.1.3 ITALY
14.1.4 SPAIN
14.1.5 RUSSIA
14.1.6 U.K
14.1.7 NETHERLANDS
14.1.8 TURKEY
14.1.9 BELGIUM
14.1.10 SWITZERLAND
14.1.11 REST OF EUROPE
15 EUROPE AGRICULTURAL SPRAYERS MARKET: COMPANY LANDSCAPE
15.1 COMPANY SHARE ANALYSIS: EUROPE
16 SWOT
17 COMPANY PROFILES
17.1 DEERE & COMPANY
17.1.1 COMPANY SNAPSHOT
17.1.2 REVENUE ANALYSIS
17.1.3 COMPANY SHARE ANALYSIS
17.1.4 PRODUCT PORTFOLIO
17.1.5 PRODUCT PORTFOLIO (PLA SA)
17.1.6 RECENT DEVELOPMENTS
17.2 CNH INDUSTRIAL N.V.
17.2.1 COMPANY SNAPSHOT
17.2.2 REVENUE ANALYSIS
17.2.3 COMPANY SHARE ANALYSIS
17.2.4 PRODUCT PORTFOLIO
17.2.5 RECENT DEVELOPMENTS
17.3 EXEL INDUSTRIES
17.3.1 COMPANY SNAPSHOT
17.3.2 REVENUE ANALYSIS
17.3.3 COMPANY SHARE ANALYSIS
17.3.4 PRODUCT PORTFOLIO
17.3.5 RECENT DEVELOPMENTS
17.4 KUBOTA CORPORATION
17.4.1 COMPANY SNAPSHOT
17.4.2 REVENUE ANALYSIS
17.4.3 COMPANY SHARE ANALYSIS
17.4.4 PRODUCT PORTFOLIO
17.4.5 RECENT DEVELOPMENTS
17.5 AGCO CORPORATION
17.5.1 COMPANY SNAPSHOT
17.5.2 REVENUE ANALYSIS
17.5.3 COMPANY SHARE ANALYSIS
17.5.4 PRODUCT PORTFOLIO
17.5.5 RECENT DEVELOPMENTS
17.6 YAMAHA MOTOR CO., LTD.
17.6.1 COMPANY SNAPSHOT
17.6.2 REVENUE ANALYSIS
17.6.3 PRODUCT PORTFOLIO
17.6.4 RECENT DEVELOPMENTS
17.7 DJI
17.7.1 COMPANY SNAPSHOT
17.7.2 PRODUCT PORTFOLIO
17.7.3 RECENT DEVELOPMENTS
17.8 AMAZONEN-WERKE H. DREYER GMBH & CO. KG
17.8.1 COMPANY SNAPSHOT
17.8.2 PRODUCT PORTFOLIO
17.8.3 RECENT DEVELOPMENTS
17.9 AG SPRAY EQUIPMENT, INC.
17.9.1 COMPANY SNAPSHOT
17.9.2 PRODUCT PORTFOLIO
17.9.3 RECENT DEVELOPMENT
17.1 ANDREAS STIHL AG & CO. KG
17.10.1 COMPANY SNAPSHOT
17.10.2 REVENUE ANALYSIS
17.10.3 PRODUCT PORTFOLIO
17.10.4 RECENT DEVELOPMENTS
17.11 ASPEE
17.11.1 COMPANY SNAPSHOT
17.11.2 PRODUCT PORTFOLIO
17.11.3 RECENT DEVELOPMENT
17.12 BATEMAN SPRAYERS
17.12.1 COMPANY SNAPSHOT
17.12.2 PRODUCT PORTFOLIO
17.12.3 RECENT DEVELOPMENTS
17.13 BUCHER INDUSTRIES AG
17.13.1 COMPANY SNAPSHOT
17.13.2 REVENUE ANALYSIS
17.13.3 PRODUCT PORTFOLIO
17.13.4 RECENT DEVELOPMENTS
17.14 BUHLER INDUSTRIES INC.
17.14.1 COMPANY SNAPSHOT
17.14.2 REVENUE ANALYSIS
17.14.3 PRODUCT PORTFOLIO
17.14.4 RECENT DEVELOPMENTS
17.15 DEMCO PRODUCTS
17.15.1 COMPANY SNAPSHOT
17.15.2 PRODUCT PORTFOLIO
17.15.3 RECENT DEVELOPMENTS
17.16 GREAT PLAINS MANUFACTURING, INC.
17.16.1 COMPANY SNAPSHOT
17.16.2 PRODUCT PORTFOLIO
17.16.3 RECENT DEVELOPMENT
17.17 HERBERT DAMMANN GMBH
17.17.1 COMPANY SNAPSHOT
17.17.2 PRODUCT PORTFOLIO
17.17.3 RECENT DEVELOPMENT
17.18 HOUSEHAM SPRAYERS LTD
17.18.1 COMPANY SNAPSHOT
17.18.2 PRODUCT PORTFOLIO
17.18.3 RECENT DEVELOPMENTS
17.19 HORSCH MASCHINEN GMBH
17.19.1 COMPANY SNAPSHOT
17.19.2 PRODUCT PORTFOLIO
17.19.3 RECENT DEVELOPMENTS
17.2 HUSTLER EQUIPMENT
17.20.1 COMPANY SNAPSHOT
17.20.2 PRODUCT PORTFOLIO
17.20.3 RECENT DEVELOPMENT
17.21 JACTO
17.21.1 COMPANY SNAPSHOT
17.21.2 PRODUCT PORTFOLIO
17.21.3 RECENT DEVELOPMENTS
17.22 JB EQUIPMENT INC.
17.22.1 COMPANY SNAPSHOT
17.22.2 PRODUCT PORTFOLIO
17.22.3 RECENT DEVELOPMENT
17.23 MAHINDRA & MAHINDRA LTD.
17.23.1 COMPANY SNAPSHOT
17.23.2 REVENUE ANALYSIS
17.23.3 PRODUCT PORTFOLIO
17.23.4 RECENT DEVELOPMENTS
17.24 PMT SPRAY PUMP
17.24.1 COMPANY SNAPSHOT
17.24.2 PRODUCT PORTFOLIO
17.24.3 RECENT DEVELOPMENT
17.25 RAZ SPRAYERS
17.25.1 COMPANY SNAPSHOT
17.25.2 PRODUCT PORTFOLIO
17.25.3 RECENT DEVELOPMENT
17.26 REDDICK EQUIPMENT COMPANY OF NC, LLC
17.26.1 COMPANY SNAPSHOT
17.26.2 PRODUCT PORTFOLIO
17.26.3 RECENT DEVELOPMENT
17.27 SAM SPRAYERS
17.27.1 COMPANY SNAPSHOT
17.27.2 PRODUCT PORTFOLIO
17.27.3 RECENT DEVELOPMENT
17.28 SONU AGRO ENGINEERING
17.28.1 COMPANY SNAPSHOT
17.28.2 PRODUCT PORTFOLIO
17.28.3 RECENT DEVELOPMENT
17.29 STAHLY APPLICATORS INC.
17.29.1 COMPANY SNAPSHOT
17.29.2 PRODUCT PORTFOLIO
17.29.3 RECENT DEVELOPMENT
17.3 TAIZHOU JIANGNAN AGRICULTURAL MACHINERY FACTORY
17.30.1 COMPANY SNAPSHOT
17.30.2 PRODUCT PORTFOLIO
17.30.3 RECENT DEVELOPMENT
17.31 USHA INTERNATIONAL LTD.
17.31.1 COMPANY SNAPSHOT
17.31.2 PRODUCT PORTFOLIO
17.31.3 RECENT DEVELOPMENT
18 QUESTIONNAIRE
19 RELATED REPORTS
List of Table
LIST OF TABLES
TABLE 1 INTERNATIONAL EXPORTS OF AGRICULTURAL MACHINERY PER CATEGORY IN 2018
TABLE 2 EUROPE AGRICULTURAL SPRAYERS MARKET, BY TYPE, 2018-2027 (USD MILLION)
TABLE 3 EUROPE TRACTOR-MOUNTED IN AGRICULTURAL SPRAYERS MARKET, BY REGION, 2018-2027 (USD MILLION)
TABLE 4 EUROPE SELF PROPELLED IN AGRICULTURAL SPRAYERS MARKET, BY REGION, 2018-2027 (USD MILLION)
TABLE 5 EUROPE SELF-PROPELLED IN AGRICULTURAL SPRAYERS MARKET, BY TYPE, 2018-2027 (USD MILLION)
TABLE 6 EUROPE TRAILED IN AGRICULTURAL SPRAYERS MARKET, BY REGION, 2018-2027 (USD MILLION))
TABLE 7 EUROPE AERIAL IN AGRICULTURAL SPRAYERS MARKET, BY REGION, 2018-2027 (USD MILLION)
TABLE 8 EUROPE OTHERS IN AGRICULTURAL SPRAYERS MARKET, BY REGION, 2018-2027 (USD MILLION)
TABLE 9 EUROPE AGRICULTURAL SPRAYERS MARKET, BY ENERGY SOURCE, 2018-2027 (USD MILLION)
TABLE 10 EUROPE FUEL-BASED IN AGRICULTURAL SPRAYERS MARKET, BY REGION, 2018-2027 (USD MILLION)
TABLE 11 EUROPE ELECTRIC & BATTERY DRIVEN IN AGRICULTURAL SPRAYERS MARKET, BY REGION, 2018-2027 (USD MILLION)
TABLE 12 EUROPE MANUAL IN AGRICULTURAL SPRAYERS MARKET, BY REGION, 2018-2027 (USD MILLION)
TABLE 13 EUROPE SOLAR IN AGRICULTURAL SPRAYERS MARKET, BY REGION, 2018-2027 (USD MILLION)
TABLE 14 EUROPE AGRICULTURAL SPRAYERS MARKET, BY CAPACITY, 2018-2027 (USD MILLION)
TABLE 15 EUROPE HIGH VOLUME IN AGRICULTURAL SPRAYERS MARKET, BY REGION, 2018-2027 (USD MILLION)
TABLE 16 EUROPE HIGH VOLUME IN AGRICULTURAL SPRAYERS MARKET, BY CAPACITY, 2018-2027 (USD MILLION)
TABLE 17 EUROPE LOW VOLUME IN AGRICULTURAL SPRAYERS MARKET, BY REGION, 2018-2027 (USD MILLION)
TABLE 18 EUROPE ULTRA-LOW VOLUME IN AGRICULTURAL SPRAYERS MARKET, BY REGION, 2018-2027 (USD MILLION)
TABLE 19 EUROPE AGRICULTURAL SPRAYERS MARKET, BY FARM SIZE, 2018-2027 (USD MILLION)
TABLE 20 EUROPE SMALL IN AGRICULTURAL SPRAYERS MARKET, BY REGION, 2018-2027 (USD MILLION)
TABLE 21 EUROPE LARGE IN AGRICULTURAL SPRAYERS MARKET, BY REGION, 2018-2027 (USD MILLION)
TABLE 22 EUROPE MEDIUM IN AGRICULTURAL SPRAYERS MARKET, BY REGION, 2018-2027 (USD MILLION)
TABLE 23 EUROPE AGRICULTURAL SPRAYERS MARKET, BY TECHNOLOGY, 2018-2027 (USD MILLION)
TABLE 24 EUROPE HYDRAULIC NOZZLE SPRAY TECHNOLOGY (HYDRAULIC SPRAY SYSTEMS) IN AGRICULTURAL SPRAYERS MARKET, BY REGION, 2018-2027 (USD MILLION)
TABLE 25 EUROPE VARIABLE RATE TECHNOLOGY (VRT) IN AGRICULTURAL SPRAYERS MARKET, BY REGION, 2018-2027 (USD MILLION)
TABLE 26 EUROPE AIR-ASSISTED ELECTROSTATIC SPRAY TECHNOLOGY IN AGRICULTURAL SPRAYERS MARKET, BY REGION, 2018-2027 (USD MILLION)
TABLE 27 EUROPE OTHERS IN AGRICULTURAL SPRAYERS MARKET, BY REGION, 2018-2027 (USD MILLION)
TABLE 28 EUROPE AGRICULTURAL SPRAYERS MARKET, BY CROP TYPE, 2018-2027 (USD MILLION)
TABLE 29 EUROPE FRUITS & VEGETABLES IN AGRICULTURAL SPRAYERS MARKET, BY REGION, 2018-2027 (USD MILLION)
TABLE 30 EUROPE CEREALS IN AGRICULTURAL SPRAYERS MARKET, BY REGION, 2018-2027 (USD MILLION)
TABLE 31 EUROPE OILSEED IN AGRICULTURAL SPRAYERS MARKET, BY REGION, 2018-2027 (USD MILLION)
TABLE 32 EUROPE OTHERS IN AGRICULTURAL SPRAYERS MARKET, BY REGION, 2018-2027 (USD MILLION)
TABLE 33 EUROPE AGRICULTURAL SPRAYER MARKET, BY COUNTRY, 2018-2027 (USD MILLION)
TABLE 34 EUROPE AGRICULTURAL SPRAYER MARKET, BY TYPE, 2018-2027 (USD MILLION)
TABLE 35 EUROPE SELF-PROPELLED IN AGRICULTURAL SPRAYER MARKET, BY TYPE, 2018-2027 (USD MILLION)
TABLE 36 EUROPE AGRICULTURAL SPRAYER MARKET, BY ENERGY SOURCE, 2018-2027 (USD MILLION)
TABLE 37 EUROPE AGRICULTURAL SPRAYER MARKET, BY CAPACITY, 2018-2027 (USD MILLION)
TABLE 38 EUROPE AGRICULTURAL SPRAYER MARKET, BY CAPACITY, 2018-2027 (USD MILLION)
TABLE 39 EUROPE AGRICULTURAL SPRAYER MARKET, BY FARM SIZE, 2018-2027 (USD MILLION)
TABLE 40 EUROPE AGRICULTURAL SPRAYER MARKET, BY TECHNOLOGY, 2018-2027 (USD MILLION)
TABLE 41 EUROPE AGRICULTURAL SPRAYER MARKET, BY CROP TYPE, 2018-2027 (USD MILLION)
TABLE 42 FRANCE AGRICULTURAL SPRAYER MARKET, BY TYPE, 2018-2027 (USD MILLION)
TABLE 43 FRANCE SELF-PROPELLED IN AGRICULTURAL SPRAYER MARKET, BY TYPE, 2018-2027 (USD MILLION)
TABLE 44 FRANCE AGRICULTURAL SPRAYER MARKET, BY ENERGY SOURCE, 2018-2027 (USD MILLION)
TABLE 45 FRANCE AGRICULTURAL SPRAYER MARKET, BY CAPACITY, 2018-2027 (USD MILLION)
TABLE 46 FRANCE AGRICULTURAL SPRAYER MARKET, BY CAPACITY, 2018-2027 (USD MILLION)
TABLE 47 FRANCE AGRICULTURAL SPRAYER MARKET, BY FARM SIZE, 2018-2027 (USD MILLION)
TABLE 48 FRANCE AGRICULTURAL SPRAYER MARKET, BY TECHNOLOGY, 2018-2027 (USD MILLION)
TABLE 49 FRANCE AGRICULTURAL SPRAYER MARKET, BY CROP TYPE, 2018-2027 (USD MILLION)
TABLE 50 GERMANY AGRICULTURAL SPRAYER MARKET, BY TYPE, 2018-2027 (USD MILLION)
TABLE 51 GERMANY SELF-PROPELLED IN AGRICULTURAL SPRAYER MARKET, BY TYPE, 2018-2027 (USD MILLION)
TABLE 52 GERMANY AGRICULTURAL SPRAYER MARKET, BY ENERGY SOURCE, 2018-2027 (USD MILLION)
TABLE 53 GERMANY AGRICULTURAL SPRAYER MARKET, BY CAPACITY, 2018-2027 (USD MILLION)
TABLE 54 GERMANY AGRICULTURAL SPRAYER MARKET, BY CAPACITY, 2018-2027 (USD MILLION)
TABLE 55 GERMANY AGRICULTURAL SPRAYER MARKET, BY FARM SIZE, 2018-2027 (USD MILLION)
TABLE 56 GERMANY AGRICULTURAL SPRAYER MARKET, BY TECHNOLOGY, 2018-2027 (USD MILLION)
TABLE 57 GERMANY AGRICULTURAL SPRAYER MARKET, BY CROP TYPE, 2018-2027 (USD MILLION)
TABLE 58 ITALY AGRICULTURAL SPRAYER MARKET, BY TYPE, 2018-2027 (USD MILLION)
TABLE 59 ITALY SELF-PROPELLED IN AGRICULTURAL SPRAYER MARKET, BY TYPE, 2018-2027 (USD MILLION)
TABLE 60 ITALY AGRICULTURAL SPRAYER MARKET, BY ENERGY SOURCE, 2018-2027 (USD MILLION)
TABLE 61 ITALY AGRICULTURAL SPRAYER MARKET, BY CAPACITY, 2018-2027 (USD MILLION)
TABLE 62 ITALY AGRICULTURAL SPRAYER MARKET, BY CAPACITY, 2018-2027 (USD MILLION)
TABLE 63 ITALY AGRICULTURAL SPRAYER MARKET, BY FARM SIZE, 2018-2027 (USD MILLION)
TABLE 64 ITALY AGRICULTURAL SPRAYER MARKET, BY TECHNOLOGY, 2018-2027 (USD MILLION)
TABLE 65 ITALY AGRICULTURAL SPRAYER MARKET, BY CROP TYPE, 2018-2027 (USD MILLION)
TABLE 66 SPAIN AGRICULTURAL SPRAYER MARKET, BY TYPE, 2018-2027 (USD MILLION)
TABLE 67 SPAIN SELF-PROPELLED IN AGRICULTURAL SPRAYER MARKET, BY TYPE, 2018-2027 (USD MILLION)
TABLE 68 SPAIN AGRICULTURAL SPRAYER MARKET, BY ENERGY SOURCE, 2018-2027 (USD MILLION)
TABLE 69 SPAIN AGRICULTURAL SPRAYER MARKET, BY CAPACITY, 2018-2027 (USD MILLION)
TABLE 70 SPAIN AGRICULTURAL SPRAYER MARKET, BY CAPACITY, 2018-2027 (USD MILLION)
TABLE 71 SPAIN AGRICULTURAL SPRAYER MARKET, BY FARM SIZE, 2018-2027 (USD MILLION)
TABLE 72 SPAIN AGRICULTURAL SPRAYER MARKET, BY TECHNOLOGY, 2018-2027 (USD MILLION)
TABLE 73 SPAIN AGRICULTURAL SPRAYER MARKET, BY CROP TYPE, 2018-2027 (USD MILLION)
TABLE 74 RUSSIA AGRICULTURAL SPRAYER MARKET, BY TYPE, 2018-2027 (USD MILLION)
TABLE 75 RUSSIA SELF-PROPELLED IN AGRICULTURAL SPRAYER MARKET, BY TYPE, 2018-2027 (USD MILLION)
TABLE 76 RUSSIA AGRICULTURAL SPRAYER MARKET, BY ENERGY SOURCE, 2018-2027 (USD MILLION)
TABLE 77 RUSSIA AGRICULTURAL SPRAYER MARKET, BY CAPACITY, 2018-2027 (USD MILLION)
TABLE 78 RUSSIA AGRICULTURAL SPRAYER MARKET, BY CAPACITY, 2018-2027 (USD MILLION)
TABLE 79 RUSSIA AGRICULTURAL SPRAYER MARKET, BY FARM SIZE, 2018-2027 (USD MILLION)
TABLE 80 RUSSIA AGRICULTURAL SPRAYER MARKET, BY TECHNOLOGY, 2018-2027 (USD MILLION)
TABLE 81 RUSSIA AGRICULTURAL SPRAYER MARKET, BY CROP TYPE, 2018-2027 (USD MILLION)
TABLE 82 U.K AGRICULTURAL SPRAYER MARKET, BY TYPE, 2018-2027 (USD MILLION)
TABLE 83 U.K SELF-PROPELLED IN AGRICULTURAL SPRAYER MARKET, BY TYPE, 2018-2027 (USD MILLION)
TABLE 84 U.K AGRICULTURAL SPRAYER MARKET, BY ENERGY SOURCE, 2018-2027 (USD MILLION)
TABLE 85 U.K AGRICULTURAL SPRAYER MARKET, BY CAPACITY, 2018-2027 (USD MILLION)
TABLE 86 U.K AGRICULTURAL SPRAYER MARKET, BY CAPACITY, 2018-2027 (USD MILLION)
TABLE 87 U.K AGRICULTURAL SPRAYER MARKET, BY FARM SIZE, 2018-2027 (USD MILLION)
TABLE 88 U.K AGRICULTURAL SPRAYER MARKET, BY TECHNOLOGY, 2018-2027 (USD MILLION)
TABLE 89 U.K AGRICULTURAL SPRAYER MARKET, BY CROP TYPE, 2018-2027 (USD MILLION)
TABLE 90 NETHERLANDS AGRICULTURAL SPRAYER MARKET, BY TYPE, 2018-2027 (USD MILLION)
TABLE 91 NETHERLANDS SELF-PROPELLED IN AGRICULTURAL SPRAYER MARKET, BY TYPE, 2018-2027 (USD MILLION)
TABLE 92 NETHERLANDS AGRICULTURAL SPRAYER MARKET, BY ENERGY SOURCE, 2018-2027 (USD MILLION)
TABLE 93 NETHERLANDS AGRICULTURAL SPRAYER MARKET, BY CAPACITY, 2018-2027 (USD MILLION)
TABLE 94 NETHERLANDS AGRICULTURAL SPRAYER MARKET, BY CAPACITY, 2018-2027 (USD MILLION)
TABLE 95 NETHERLANDS AGRICULTURAL SPRAYER MARKET, BY FARM SIZE, 2018-2027 (USD MILLION)
TABLE 96 NETHERLANDS AGRICULTURAL SPRAYER MARKET, BY TECHNOLOGY, 2018-2027 (USD MILLION)
TABLE 97 NETHERLANDS AGRICULTURAL SPRAYER MARKET, BY CROP TYPE, 2018-2027 (USD MILLION)
TABLE 98 TURKEY AGRICULTURAL SPRAYER MARKET, BY TYPE, 2018-2027 (USD MILLION)
TABLE 99 TURKEY SELF-PROPELLED IN AGRICULTURAL SPRAYER MARKET, BY TYPE, 2018-2027 (USD MILLION)
TABLE 100 TURKEY AGRICULTURAL SPRAYER MARKET, BY ENERGY SOURCE, 2018-2027 (USD MILLION)
TABLE 101 TURKEY AGRICULTURAL SPRAYER MARKET, BY CAPACITY, 2018-2027 (USD MILLION)
TABLE 102 TURKEY AGRICULTURAL SPRAYER MARKET, BY CAPACITY, 2018-2027 (USD MILLION)
TABLE 103 TURKEY AGRICULTURAL SPRAYER MARKET, BY FARM SIZE, 2018-2027 (USD MILLION)
TABLE 104 TURKEY AGRICULTURAL SPRAYER MARKET, BY TECHNOLOGY, 2018-2027 (USD MILLION)
TABLE 105 TURKEY AGRICULTURAL SPRAYER MARKET, BY CROP TYPE, 2018-2027 (USD MILLION)
TABLE 106 BELGIUM AGRICULTURAL SPRAYER MARKET, BY TYPE, 2018-2027 (USD MILLION)
TABLE 107 BELGIUM SELF-PROPELLED IN AGRICULTURAL SPRAYER MARKET, BY TYPE, 2018-2027 (USD MILLION)
TABLE 108 BELGIUM AGRICULTURAL SPRAYER MARKET, BY ENERGY SOURCE, 2018-2027 (USD MILLION)
TABLE 109 BELGIUM AGRICULTURAL SPRAYER MARKET, BY CAPACITY, 2018-2027 (USD MILLION)
TABLE 110 BELGIUM AGRICULTURAL SPRAYER MARKET, BY CAPACITY, 2018-2027 (USD MILLION)
TABLE 111 BELGIUM AGRICULTURAL SPRAYER MARKET, BY FARM SIZE, 2018-2027 (USD MILLION)
TABLE 112 BELGIUM AGRICULTURAL SPRAYER MARKET, BY TECHNOLOGY, 2018-2027 (USD MILLION)
TABLE 113 BELGIUM AGRICULTURAL SPRAYER MARKET, BY CROP TYPE, 2018-2027 (USD MILLION)
TABLE 114 SWITZERLAND AGRICULTURAL SPRAYER MARKET, BY TYPE, 2018-2027 (USD MILLION)
TABLE 115 SWITZERLAND SELF-PROPELLED IN AGRICULTURAL SPRAYER MARKET, BY TYPE, 2018-2027 (USD MILLION)
TABLE 116 SWITZERLAND AGRICULTURAL SPRAYER MARKET, BY ENERGY SOURCE, 2018-2027 (USD MILLION)
TABLE 117 SWITZERLAND AGRICULTURAL SPRAYER MARKET, BY CAPACITY, 2018-2027 (USD MILLION)
TABLE 118 SWITZERLAND AGRICULTURAL SPRAYER MARKET, BY CAPACITY, 2018-2027 (USD MILLION)
TABLE 119 SWITZERLAND AGRICULTURAL SPRAYER MARKET, BY FARM SIZE, 2018-2027 (USD MILLION)
TABLE 120 SWITZERLAND AGRICULTURAL SPRAYER MARKET, BY TECHNOLOGY, 2018-2027 (USD MILLION)
TABLE 121 SWITZERLAND AGRICULTURAL SPRAYER MARKET, BY CROP TYPE, 2018-2027 (USD MILLION)
TABLE 122 REST OF EUROPE AGRICULTURAL SPRAYER MARKET, BY TYPE, 2018-2027 (USD MILLION)
List of Figure
LIST OF FIGURES
FIGURE 1 EUROPE AGRICULTURAL SPRAYERS MARKET: SEGMENTATION
FIGURE 2 EUROPE AGRICULTURAL SPRAYERS MARKET: DATA TRIANGULATION
FIGURE 3 EUROPE AGRICULTURAL SPRAYERS MARKET: DROC ANALYSIS
FIGURE 4 EUROPE AGRICULTURAL SPRAYERS MARKET: EUROPE VS REGIONAL MARKET ANALYSIS
FIGURE 5 EUROPE AGRICULTURAL SPRAYERS MARKET: COMPANY RESEARCH ANALYSIS
FIGURE 6 EUROPE AGRICULTURAL SPRAYERS MARKET: INTERVIEW DEMOGRAPHICS
FIGURE 7 EUROPE AGRICULTURAL SPRAYERS MARKET: DBMR MARKET POSITION GRID
FIGURE 8 EUROPE AGRICULTURAL SPRAYERS MARKET: VENDOR SHARE ANALYSIS
FIGURE 9 EUROPE AGRICULTURAL SPRAYERS MARKET: SEGMENTATION
FIGURE 10 INCREASING PRODUCTION OF AGRICULTURAL EQUIPMETS ACROSS THE WORLD IS DRIVING THE EUROPE AGRICULTURAL SPRAYERS MARKET IN THE FORECAST PERIOD OF 2020 TO 2027
FIGURE 11 TRACTOR-MOUNTED SEGMENT IS EXPECTED TO ACCOUNT FOR THE LARGEST SHARE OF THE EUROPE AGRICULTURAL SPRAYERS MARKET IN 2020 & 2027
FIGURE 12 EUROPE AGRICULTURAL SPRAYERS MARKET: EXEL INDUSTRIES BRAND SHARE 2019 (%)
FIGURE 13 DRIVERS, RESTRAINTS, OPPORTUNITIES AND CHALLENGES OF EUROPE AGRICULTURAL SPRAYERS MARKET
FIGURE 14 INTERNATIONAL TRADE IN AGRICULTURAL MACHINERY, IN 2018
FIGURE 15 EUROPE FUEL PRICE CHANGES, 2005-2018 (USD/LITRE)
FIGURE 1 ASIA-PACIFIC IS THE FASTEST GROWING MARKET FOR AGRICULTURAL SPRAYERS MANUFACTURERS IN THE FORECAST PERIOD OF 2020 TO 2027
FIGURE 2 EUROPE AGRICULTURAL SPRAYERS MARKET: BY TYPE, 2019
FIGURE 3 EUROPE AGRICULTURAL SPRAYERS MARKET: BY ENERGY SOURCE, 2019
FIGURE 4 EUROPE AGRICULTURAL SPRAYERS MARKET: BY CAPACITY, 2019
FIGURE 5 EUROPE AGRICULTURAL SPRAYERS MARKET: BY FARM SIZE, 2019
FIGURE 6 EUROPE AGRICULTURAL SPRAYERS MARKET: BY TECHNOLOGY, 2019
FIGURE 7 EUROPE AGRICULTURAL SPRAYERS MARKET: BY CROP TYPE, 2019
FIGURE 8 EUROPE SUNFLOWER SEED MARKET: SNAPSHOT (2019)
FIGURE 9 EUROPE SUNFLOWER SEEDSMARKET: BY COUNTRY (2019)
FIGURE 10 EUROPE SUNFLOWER SEEDSMARKET: BY COUNTRY (2020&2027)
FIGURE 11 EUROPE SUNFLOWER SEEDSMARKET: BY COUNTRY (2019&2027)
FIGURE 12 EUROPE SUNFLOWER SEEDSMARKET: BY CATEGORY (2020&2027)
FIGURE 13 EUROPE AGRICULTURAL SPRAYERS MARKET: COMPANY SHARE 2019 (%)
Data collection and base year analysis are done using data collection modules with large sample sizes. The stage includes obtaining market information or related data through various sources and strategies. It includes examining and planning all the data acquired from the past in advance. It likewise envelops the examination of information inconsistencies seen across different information sources. The market data is analysed and estimated using market statistical and coherent models. Also, market share analysis and key trend analysis are the major success factors in the market report. To know more, please request an analyst call or drop down your inquiry.
The key research methodology used by DBMR research team is data triangulation which involves data mining, analysis of the impact of data variables on the market and primary (industry expert) validation. Data models include Vendor Positioning Grid, Market Time Line Analysis, Market Overview and Guide, Company Positioning Grid, Patent Analysis, Pricing Analysis, Company Market Share Analysis, Standards of Measurement, Global versus Regional and Vendor Share Analysis. To know more about the research methodology, drop in an inquiry to speak to our industry experts.
Data Bridge Market Research is a leader in advanced formative research. We take pride in servicing our existing and new customers with data and analysis that match and suits their goal. The report can be customized to include price trend analysis of target brands understanding the market for additional countries (ask for the list of countries), clinical trial results data, literature review, refurbished market and product base analysis. Market analysis of target competitors can be analyzed from technology-based analysis to market portfolio strategies. We can add as many competitors that you require data about in the format and data style you are looking for. Our team of analysts can also provide you data in crude raw excel files pivot tables (Fact book) or can assist you in creating presentations from the data sets available in the report.


