
Europe Invisible Orthodontics Market
Market Size in USD Billion
 USD
1.94 Billion
USD
4.56 Billion
2025
2033
USD
1.94 Billion
USD
4.56 Billion
2025
2033
| 2026 - 2033 | |
| USD 1.94 Billion | |
| USD 4.56 Billion | |
| % | |
|
Europe Invisible Orthodontics Market Overview
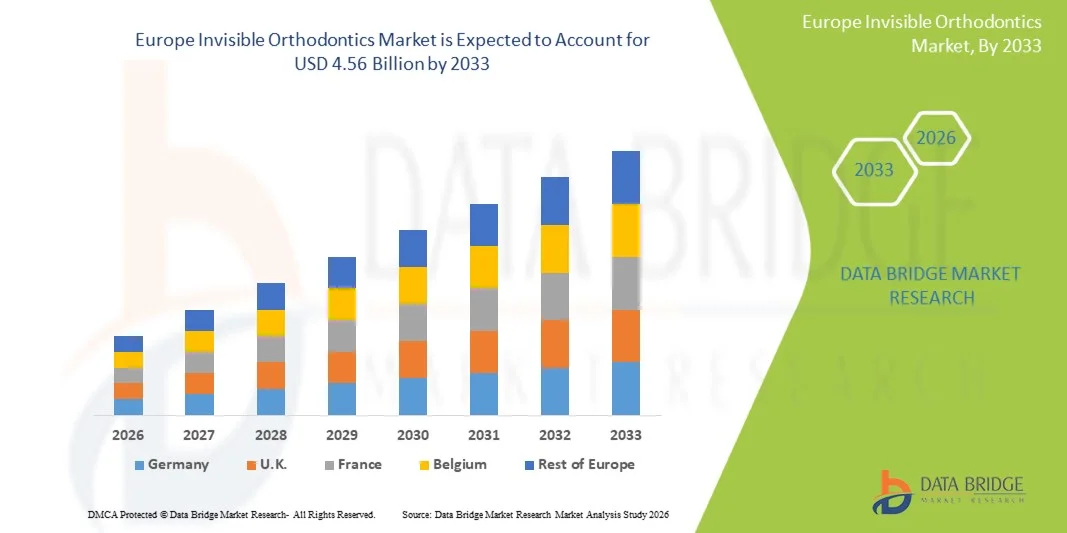
The Europe invisible orthodontics market was valued at USD 1.94 billion in 2025 and is projected to reach USD 4.56 billion by 2033, growing at a CAGR of 11.30% from 2026 to 2033. The market is witnessing steady expansion driven by rising demand for aesthetic dental treatments, increasing prevalence of malocclusion and misaligned teeth, and growing awareness of advanced orthodontic solutions such as clear aligners. Expanding adoption of digital dentistry, including 3D scanning and CAD/CAM-based treatment planning, is further supporting market growth across key European countries.
The increasing preference for minimally invasive and nearly invisible dental correction options, combined with higher disposable incomes and a strong focus on oral aesthetics, is accelerating the shift from traditional metal braces to clear aligner systems. In addition, supportive reimbursement frameworks in certain European healthcare systems, along with the rapid expansion of private dental clinics and specialist orthodontic chains, are boosting accessibility. Technological advancements in materials and treatment customization, along with growing orthodontic demand among both teenagers and adults, are further strengthening market penetration across the region.
Key Market Trends & Insights
- Germany dominated the Europe invisible orthodontics market with the largest revenue share of 34.12% in 2025, supported by advanced dental infrastructure, high adoption of digital dentistry, and strong demand for aesthetic orthodontic treatments.
- The Products segment led the market with a 71.6% share in 2025, driven by widespread adoption of clear aligners, retainers, and digitally customized orthodontic appliances across dental and orthodontic clinics.
- United Kingdom is expected to be the fastest-growing country in Europe at a CAGR of 7.4% from 2026 to 2033, fueled by rising cosmetic dentistry demand, expanding private dental clinic networks, and strong adoption of clear aligner brands.
- Services are the fastest-growing products and services, projected to register a CAGR of 7.2%, reflecting the surge in demand for orthodontic consultation, digital treatment planning, remote monitoring, and follow-up care services.
- The Teenagers segment dominated the age group category with a 46.38% revenue share in 2025, led by high prevalence of malocclusion during adolescence and early orthodontic intervention programs across European countries
- Malocclusion accounted for 52.7% of the market, preferred by its high prevalence across all age groups in Europe.
- The Crowding segment is the fastest-growing application category, with a CAGR of 7.3%, driven by increasing cases of dental overcrowding due to genetic factors and lifestyle-related oral health issues.
Market Size & Forecast
- Global Market Value (2025): USD 1.94 Billion
- Expected Market Value (2033): USD 4.56 Billion
- Forecast CAGR (2026–2033): 11.30%
- Leading Country in 2025: Germany
- Fastest Growing Country: United Kingdom
Report Scope and Europe Invisible Orthodontics Market Segmentation
|
Attributes |
Europe Invisible Orthodontics Key Market Insights |
|
Segments Covered |
|
|
Countries Covered |
Europe · Germany · France · U.K. · Netherlands · Switzerland · Belgium · Russia · Italy · Spain · Turkey · Rest of Europe |
|
Key Market Players |
· Align Technology, Inc. (U.S.) · Straumann Group (Switzerland) · 3M (U.S.) · Dentsply Sirona Inc. (U.S.) · Envista Holdings Corporation (U.S.) · Henry Schein, Inc. (U.S.) · SmileDirectClub, Inc. (U.S.) · Institut Straumann AG (Switzerland) · Planmeca Oy (Finland) · GC Corporation (Japan) · Shofu Inc. (Japan) · Ormco Corporation (U.S.) · American Orthodontics Corporation (U.S.) · TP Orthodontics, Inc. (U.S.) · DB Orthodontics Limited (U.K.) · Great Lakes Dental Technologies (U.S.) · BioHorizons, Inc. (U.S.) · Angelalign Technology Inc. (China) · Modern Dental Group Limited (Hong Kong) · Ivoclar Vivadent AG (Liechtenstein) |
|
Market Opportunities |
· Expansion of teledentistry and remote orthodontic monitoring platforms · Rising medical tourism for cosmetic dentistry · Increasing partnerships between global aligner manufacturers and local dental clinic chains |
|
Value Added Data Infosets |
In addition to the insights on market scenarios such as market value, growth rate, segmentation, geographical coverage, and major players, the market reports curated by the Data Bridge Market Research also include in-depth expert analysis, patient epidemiology, pipeline analysis, pricing analysis, and regulatory framework. |
Europe Invisible Orthodontics Market Trends
Trend: Growth in Digital Dentistry & Aesthetic Orthodontics
The Europe invisible orthodontics market is experiencing rapid transformation due to the widespread integration of digital dentistry tools such as 3D intraoral scanners, CAD/CAM design systems, and AI-powered treatment planning software. These technologies are significantly improving diagnostic accuracy, treatment predictability, and customization of clear aligners for individual patients. At the same time, rising aesthetic consciousness among adults and young professionals is driving strong demand for nearly invisible orthodontic solutions over conventional metal braces. The growing popularity of remote monitoring platforms and cloud-connected orthodontic workflows is also enabling more efficient treatment tracking and reducing the need for frequent clinic visits. For instance, Invisalign’s digital treatment ecosystem is widely adopted across European dental clinics to provide end-to-end virtual planning, progress tracking, and customized aligner adjustments for patients.
Europe Invisible Orthodontics Market Dynamics
Key Market Driver: Rising Demand for Aesthetic Dental Treatments
The increasing preference for aesthetically appealing dental correction methods is a major driver of the Europe invisible orthodontics market, as patients prioritize appearance, comfort, and convenience during treatment. Clear aligners are becoming the preferred choice due to their removability, reduced discomfort, and ability to maintain oral hygiene more effectively than traditional braces. The expansion of private dental clinics and specialist orthodontic practices across European countries is further improving access to advanced treatment options. In addition, growing awareness campaigns around oral health and cosmetic dentistry are encouraging early-stage orthodontic interventions among teenagers and adults.
For instance, Align Technology’s Invisalign network and similar provider ecosystems have expanded across countries such as Germany, the United Kingdom, and France, enabling wider adoption of digitally guided orthodontic treatments in urban and semi-urban regions.
Key Restraint/Challenge: High Treatment Costs and Limited Insurance Coverage
Despite strong growth, the market faces challenges due to the high cost of clear aligner treatments, which often makes them less accessible compared to traditional metal braces. Multiple treatment stages, repeated aligner replacements, and frequent dental consultations increase the total cost burden for patients over the entire treatment cycle. In many European healthcare systems, orthodontic coverage is limited or restricted to specific age groups, leaving adult patients to bear most of the expenses out-of-pocket. This cost sensitivity can slow adoption rates, particularly in lower-income segments or regions with less developed private dental infrastructure.
For instance, in several European private orthodontic clinics, full clear aligner treatment plans can require significantly higher investment than conventional fixed braces, which limits penetration among price-conscious patients despite strong aesthetic demand.
Key Market Opportunity: Expansion of AI-Driven Customization and Teledentistry
The increasing adoption of artificial intelligence and teledentistry is creating substantial growth opportunities in the Europe invisible orthodontics market by enabling more precise, efficient, and scalable treatment delivery. AI-based software can analyze 3D dental scans to predict tooth movement patterns, optimize aligner sequencing, and reduce overall treatment duration. Teledentistry platforms further enhance accessibility by allowing remote consultations, virtual progress tracking, and digital adjustments without requiring frequent in-person visits. This is particularly beneficial in improving access to orthodontic care in smaller cities and semi-urban areas where specialist availability is limited. For instance, companies such as SmileDirectClub and Invisalign have introduced digital-first orthodontic ecosystems in Europe that combine AI simulation tools with remote monitoring capabilities to improve patient engagement and treatment efficiency.
Europe Invisible Orthodontics Market Scope
The Europe invisible orthodontics market is segmented on the basis of products and services, age group, application, end user, and distribution channel.
- By Products and Services
On the basis of products and services, the Europe invisible orthodontics market is segmented into products and services. The Products segment dominated the market with the largest revenue share of 71.6% in 2025, owing to the widespread adoption of clear aligners, retainers, and digitally customized orthodontic appliances across dental and orthodontic clinics. These products are highly preferred due to their aesthetic appeal, comfort, and compatibility with digital treatment planning systems such as 3D scanning and CAD/CAM technologies. Continuous innovation in aligner materials, improved transparency, and enhanced durability are further strengthening product adoption. High patient demand for non-invasive and removable orthodontic solutions is also supporting dominance. In addition, strong penetration of global aligner brands and expansion of clinic-based distribution networks across Europe is reinforcing growth. Increasing integration of AI-based treatment design is further improving product precision and efficiency.
The Services segment is expected to register the fastest growth at a CAGR of 7.2% from 2026 to 2033, driven by rising demand for orthodontic consultation, digital treatment planning, remote monitoring, and follow-up care services. Service-based orthodontic delivery is gaining traction due to increasing adoption of teledentistry and AI-powered diagnostic platforms. Patients are increasingly opting for subscription-based and bundled treatment models that include continuous monitoring and adjustment services. Dental clinics are also offering comprehensive treatment packages combining products and services for better patient outcomes. Growing use of cloud-based orthodontic platforms is improving service accessibility and efficiency. Rising demand for personalized treatment support and post-treatment retention services is further accelerating this segment.
- By Age Group
On the basis of age group, the Europe invisible orthodontics market is segmented into adults, teenagers, and children. The Teenagers segment dominated the market with the largest share of 46.38% in 2025, driven by high prevalence of malocclusion during adolescence and early orthodontic intervention programs across European countries. Teenagers are highly responsive to aesthetic treatment options such as clear aligners, especially in urban populations with strong awareness of dental appearance. School-based dental screening programs and parental investment in early correction are further supporting demand. The availability of flexible and less visible aligner systems makes treatment more acceptable among younger patients. Increasing orthodontic consultations during puberty-related dental development stages is strengthening segment dominance. Strong presence of orthodontic clinics in Europe ensures early diagnosis and treatment adoption.
The Adults segment is expected to witness the fastest growth at a CAGR of 7.1% from 2026 to 2033, driven by rising focus on cosmetic dentistry, professional appearance, and improved affordability of aligner treatments. Adults are increasingly opting for orthodontic correction due to delayed treatment during childhood and increased awareness of oral health benefits. Flexible treatment options and discreet aligner systems are making orthodontics more suitable for working professionals. Expansion of private dental insurance and financing options is further improving accessibility. Growing demand for smile correction and aesthetic enhancement is strongly supporting adoption. Increasing availability of short-duration aligner treatments is also contributing to segment growth.
- By Application
On the basis of application, the Europe invisible orthodontics market is segmented into malocclusion, crowding, excessive spacing, and others. The Malocclusion segment dominated the market with the largest share of 52.7% in 2025, driven by its high prevalence across all age groups in Europe. Malocclusion cases often require long-term orthodontic correction, making clear aligners a preferred solution due to their precision and comfort. Early diagnosis through routine dental check-ups is increasing treatment initiation rates. Advanced digital planning tools allow accurate correction of complex misalignments. Rising awareness of oral health and functional benefits of corrected bite alignment is further supporting demand. Strong clinical focus on preventive orthodontics is reinforcing dominance of this segment.
The Crowding segment is expected to register the fastest growth at a CAGR of 7.3% from 2026 to 2033, driven by increasing cases of dental overcrowding due to genetic factors and lifestyle-related oral health issues. Crowding is highly suitable for clear aligner-based correction, boosting adoption among both teenagers and adults. Improved treatment predictability using AI-based simulation tools is enhancing clinical confidence. Rising demand for aesthetic smile alignment is also accelerating treatment uptake. Expansion of orthodontic awareness campaigns is increasing early intervention rates. Continuous innovation in aligner sequencing and staging is further supporting segment growth.
- By End User
On the basis of end user, the Europe invisible orthodontics market is segmented into hospitals, dental clinics, orthodontic clinics, and others. The Orthodontic Clinics segment dominated the market with the largest share of 44.8% in 2025, owing to the high concentration of specialized orthodontists and advanced treatment infrastructure. These clinics offer dedicated orthodontic services including aligner fitting, digital scanning, and continuous monitoring. High patient trust and specialized expertise make orthodontic clinics the primary treatment destination. Increasing adoption of AI-driven orthodontic planning tools is further improving treatment outcomes. Strong presence of private orthodontic chains across Europe supports market dominance. Growing patient preference for specialized care over general dental services is reinforcing this segment.
The Dental Clinics segment is expected to register the fastest growth at a CAGR of 7.0% from 2026 to 2033, driven by expanding service offerings and integration of orthodontic treatments into general dental care. Dental clinics are increasingly investing in digital dentistry tools to offer aligner-based treatments. Rising patient convenience and accessibility are boosting clinic visits. Partnerships with aligner manufacturers are enabling bundled treatment solutions. Increasing awareness of aesthetic dentistry is expanding patient inflow. Growth in urban dental service networks is further supporting this segment’s expansion.
- By Distribution Channel
On the basis of distribution channel, the Europe invisible orthodontics market is segmented into direct sales and third-party distributors. The Direct Sales segment dominated the market with the largest share of 66.9% in 2025, driven by strong presence of leading aligner manufacturers and direct-to-clinic supply models. Companies prefer direct engagement with orthodontic clinics to ensure treatment quality and brand control. Digital platforms for treatment ordering and monitoring are strengthening direct distribution efficiency. High-margin sales and faster delivery cycles are further supporting dominance. Increasing integration of AI-based ordering systems is improving workflow efficiency. Strong manufacturer-clinic partnerships across Europe are reinforcing this segment.
The Third-Party Distributors segment is expected to register the fastest growth at a CAGR of 7.2% from 2026 to 2033, driven by expansion into semi-urban and smaller dental markets. Distributors help improve product availability and reduce logistical complexities. Growing demand from independent dental clinics is boosting distributor networks. Rising penetration of aligner brands in emerging European regions is further supporting growth. Cost-effective supply chain solutions are increasing adoption. Expansion of regional dental supply chains is also accelerating this segment.
Europe Invisible Orthodontics Market Regional Analysis
Germany dominated the Europe invisible orthodontics market with the largest revenue share of 34.12% in 2025, supported by advanced dental infrastructure, high adoption of digital dentistry, and strong demand for aesthetic orthodontic treatments. The country also benefits from high patient awareness regarding dental aesthetics, strong disposable income levels, and widespread availability of customized clear aligner solutions. Increasing integration of 3D scanning, CAD/CAM systems, and AI-based treatment planning platforms continues to strengthen Germany’s leadership position in the European market.
The Germany Invisible Orthodontics Market Insight
The Germany invisible orthodontics market is witnessing strong growth due to advanced dental healthcare infrastructure, high adoption of digital dentistry technologies, and strong demand for aesthetic orthodontic treatments. The country benefits from a large base of specialized orthodontic clinics and widespread use of clear aligner systems supported by 3D scanning and CAD/CAM workflows. Increasing patient awareness regarding dental aesthetics and strong disposable income levels are further accelerating treatment adoption. In addition, continuous innovation in aligner materials and growing integration of AI-based treatment planning solutions are improving precision and efficiency in orthodontic care delivery across Germany.
United Kingdom Invisible Orthodontics Market Insight
The United Kingdom invisible orthodontics market is expanding steadily due to rising demand for cosmetic dentistry, strong penetration of private dental clinics, and increasing adoption of clear aligner treatments. The country has a well-developed dental care system with growing use of digital orthodontic technologies such as intraoral scanning and AI-driven treatment planning. Rising aesthetic awareness among adults and teenagers is significantly boosting aligner adoption. Furthermore, increasing availability of flexible payment plans and teledentistry-based monitoring solutions is improving treatment accessibility and patient engagement across the UK.
France Invisible Orthodontics Market Insight
The France invisible orthodontics market is growing due to increasing focus on dental aesthetics, expanding orthodontic clinic networks, and rising adoption of clear aligner systems. French dental practitioners are increasingly integrating digital dentistry tools such as CAD/CAM systems and 3D imaging for improved treatment accuracy. Growing awareness of oral health and cosmetic appearance among younger populations is driving demand for invisible orthodontic solutions. In addition, supportive private dental care expansion and rising preference for minimally invasive treatments are further strengthening market growth in France.
Italy Invisible Orthodontics Market Insight
The Italy invisible orthodontics market is witnessing steady growth driven by rising demand for aesthetic dental treatments and increasing adoption of clear aligners among adults and teenagers. The country benefits from a strong presence of private dental clinics and growing use of digital orthodontic technologies for customized treatment planning. Increasing awareness of dental aesthetics and improved affordability of aligner-based treatments are supporting market expansion. Moreover, continuous innovation in orthodontic materials and rising patient preference for discreet treatment options are further boosting adoption in Italy.
Europe Invisible Orthodontics Market Share
The Europe invisible orthodontics industry is primarily led by well-established companies, including:
- Align Technology, Inc. (U.S.)
- Straumann Group (Switzerland)
- 3M (U.S.)
- Dentsply Sirona Inc. (U.S.)
- Envista Holdings Corporation (U.S.)
- Henry Schein, Inc. (U.S.)
- SmileDirectClub, Inc. (U.S.)
- Institut Straumann AG (Switzerland)
- Planmeca Oy (Finland)
- GC Corporation (Japan)
- Shofu Inc. (Japan)
- Ormco Corporation (U.S.)
- American Orthodontics Corporation (U.S.)
- TP Orthodontics, Inc. (U.S.)
- DB Orthodontics Limited (U.K.)
- Great Lakes Dental Technologies (U.S.)
- BioHorizons, Inc. (U.S.)
- Angelalign Technology Inc. (China)
- Modern Dental Group Limited (Hong Kong)
- Ivoclar Vivadent AG (Liechtenstein)
Latest Developments in Europe Invisible Orthodontics Market
- In February 2026, DentalMonitoring secured €84 million in funding to expand its AI-based remote orthodontic monitoring platform across Europe and global markets. The platform allows orthodontists to track patient treatment progress remotely using smartphone-based scanning and AI-driven analysis. This reduces the need for frequent in-clinic visits while improving treatment compliance and outcomes. The funding will support expansion across European dental practices and further development of teledentistry solutions
- In April 2025, Align Technology expanded the availability of the Invisalign Palatal Expander System across European and UK markets following regulatory approval. The system is a 3D-printed orthodontic device designed for correcting narrow upper jaw conditions in growing patients. It integrates with Invisalign’s digital treatment ecosystem to support early orthodontic intervention and comprehensive treatment planning. The expansion enhances access to advanced pediatric orthodontic solutions across Europe
- In March 2025, Align Technology launched AI-powered Align X-ray Insights in Europe and the United Kingdom to enhance digital orthodontic diagnostics and workflow efficiency. The platform uses artificial intelligence to analyze dental radiographs and assist clinicians in identifying oral conditions more accurately and efficiently. It integrates with Align Technology’s broader digital ecosystem, including Invisalign clear aligners and iTero scanners, enabling seamless treatment planning. The solution improves diagnostic speed, reduces manual workload, and enhances patient communication in orthodontic clinics
- In November 2024, Align Technology received CE Mark approval in Europe for the Invisalign Palatal Expander System, enabling its use across European markets under EU medical device regulations. The system is designed for early orthodontic intervention in growing patients, addressing skeletal and dental expansion needs while integrating with Invisalign First clear aligners. This approval expands Align Technology’s pediatric orthodontic portfolio and strengthens its presence in the European invisible orthodontics market by supporting digitally driven early treatment planning. It also reflects growing regulatory acceptance of advanced 3D-printed orthodontic devices in Europe
- In February 2023, Align Technology launched Invisalign Smile Architect in Europe, a digital treatment planning platform integrating orthodontic and restorative dentistry workflows. The platform enables clinicians to design facially driven treatment plans that combine clear aligner therapy with restorative procedures. It enhances treatment precision and supports minimally invasive dentistry approaches across European dental clinics. The solution strengthens digital workflow integration and improves coordination between orthodontic and restorative specialists
SKU-

- Interactive Data Analysis Dashboard
- Company Analysis Dashboard for high growth potential opportunities
- Research Analyst Access for customization & queries
- Competitor Analysis with Interactive dashboard
- Latest News, Updates & Trend analysis
- Harness the Power of Benchmark Analysis for Comprehensive Competitor Tracking
Data collection and base year analysis are done using data collection modules with large sample sizes. The stage includes obtaining market information or related data through various sources and strategies. It includes examining and planning all the data acquired from the past in advance. It likewise envelops the examination of information inconsistencies seen across different information sources. The market data is analysed and estimated using market statistical and coherent models. Also, market share analysis and key trend analysis are the major success factors in the market report. To know more, please request an analyst call or drop down your inquiry.
The key research methodology used by DBMR research team is data triangulation which involves data mining, analysis of the impact of data variables on the market and primary (industry expert) validation. Data models include Vendor Positioning Grid, Market Time Line Analysis, Market Overview and Guide, Company Positioning Grid, Patent Analysis, Pricing Analysis, Company Market Share Analysis, Standards of Measurement, Global versus Regional and Vendor Share Analysis. To know more about the research methodology, drop in an inquiry to speak to our industry experts.
Data Bridge Market Research is a leader in advanced formative research. We take pride in servicing our existing and new customers with data and analysis that match and suits their goal. The report can be customized to include price trend analysis of target brands understanding the market for additional countries (ask for the list of countries), clinical trial results data, literature review, refurbished market and product base analysis. Market analysis of target competitors can be analyzed from technology-based analysis to market portfolio strategies. We can add as many competitors that you require data about in the format and data style you are looking for. Our team of analysts can also provide you data in crude raw excel files pivot tables (Fact book) or can assist you in creating presentations from the data sets available in the report.


