
Europe Lanolin Market
Market Size in USD Million
 USD
281.70 Million
USD
422.59 Million
2024
2032
USD
281.70 Million
USD
422.59 Million
2024
2032
| 2025 - 2032 | |
| USD 281.70 Million | |
| USD 422.59 Million | |
| % | |
|
Lanolin Market Analysis
Europe lanolin market is highly fragmented, with numerous Europe and local players. Furthermore, the market is expected to witness increased consumer awareness of organic ingredients in various personal care products, as well as key firms' rapid expansion of distribution channels, which will alter market dynamics throughout the forecast period. At the moment, the industry is characterized by a large number of new entrants looking for ways to enter the local market.
Europe Lanolin Market Size
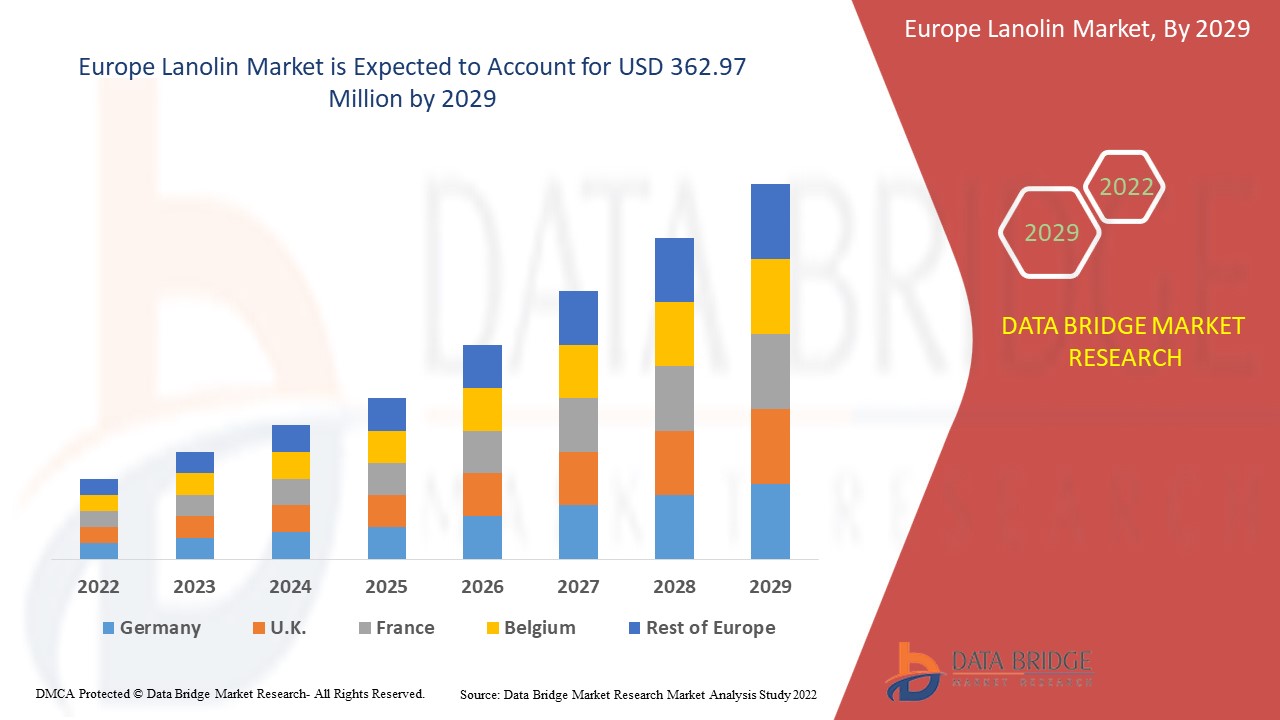
Europe lanolin market size was valued at USD 281.70 million in 2024 and is projected to reach USD 422.59 million by 2032, with a CAGR of 5.20% during the forecast period of 2025 to 2032.
Report Scope and Market Segmentation
|
Attributes |
Lanolin Key Market Insights |
|
Segmentation |
|
|
Countries Covered |
Germany, France, Italy, U.K., Belgium, Spain, Russia, Turkey, Netherlands, Switzerland, Rest of Europe |
|
Key Market Players |
Global seven agency (U.S.), SOLVAY (Belgium), Halocarbon, LLC (U.S.), BASF SE(Germany), Nippon Fine Chemical (Japan), Croda International Plc (UK), Zhejiang Garden Biochemical High-tech Co., Ltd., (Japan), The Lubrizol Corporation (U.S.), Dupont (U.S.), FENCHEM (U.S.), Wellman Advanced Materials (U.S.), Tallow Products Pty Ltd., (U.S.), Nanjing Duoyuan Biochemistry Co.,Ltd. (China), Heessoils (Germany), Zhonglan Industry Co.,Ltd. (China) and Charkit Chemical Company LLC (U.S.) |
|
Market Opportunities |
|
Lanolin Market Definition
Lanolin is a wax that is produced by the sebaceous glands of wool-bearing animals. Wool grease, wool wax, and wool yolk are other names for it. Lanolin is derived from a variety of domestic sheep breeds raised solely for their wool. It is commonly used to prevent or treat itching, dry skin, and other skin irritations caused by a variety of conditions, such as radiation therapy skin burns, diaper rash, and others.
Lanolin Market Dynamics
Drivers
- High adoption rate from various end user sectors
Increased end-use sectors such as personal care and cosmetics, baby care goods, and pharmaceuticals are the primary drivers driving market expansion. Lanolin is used in industries other than pharmaceuticals and cosmetics. Lanolin's potential applications have grown as a result of its use in critical industrial processes. Furthermore, major cosmetics and personal care companies are increasingly using lanolin oils and wax to increase total product value and sensory appeal. These oils increase suppleness, cleanse the skin, and moisturize the body's various parts. Lanolin has exceptional properties, including excellent biocompatibility, because it is very similar to the oils produced by human skin. As a result, lanolin is in high demand across a wide range of industries.
- High prevalence of bio-based lubricants among end users
Several end-use sectors that use lubricants have shown signs of shifting away from mineral oil-based lubricants to bio-based lubricants, which is encouraging. This trend shows that the industrial sector has a high demand for lanolin as a lubricant in many applications. The growing awareness of natural resource depletion, particularly of mineral oil, drives up demand, which is bolstered further by the economic feasibility of using lanolin. As a result, increased interest in bio-based lubricants accelerates overall market growth. Furthermore, the rapid expansion of distribution channels by the market's key players will accelerate the lanolin market's growth rate.
Opportunities
- Key manufacturers are focusing on product expansions
Growing consumer awareness of organic ingredients in various personal care products expands profitable opportunities for market players in the forecast period of 2025 to 2032. Furthermore, key businesses are focusing on introducing private labels, professional product launches, and the research of new ingredients in order to attract a larger consumer base, which will further expand the lanolin market's future growth.
Restraints/ Challenges
- Side effects and complications in refining process
The various side effects associated with lanolin will impede the growth of the lanolin market. The complicated refining procedure and the possibility of contaminants remaining in the end product can pose a significant health risk to humans. This factor will put pressure on the lanolin market's growth rate.
This lanolin market report provides details of new recent developments, trade regulations, import-export analysis, production analysis, value chain optimization, market share, impact of domestic and localized market players, analyses opportunities in terms of emerging revenue pockets, changes in market regulations, strategic market growth analysis, market size, category market growths, application niches and dominance, product approvals, product launches, geographic expansions, technological innovations in the market. To gain more info on the lanolin market contact Data Bridge Market Research for an Analyst Brief, our team will help you take an informed market decision to achieve market growth.
Impact and Current Market Scenario of Raw Material Shortage and Shipping Delays
Data Bridge Market Research offers a high-level analysis of the market and delivers information by keeping in account the impact and current market environment of raw material shortage and shipping delays. This translates into assessing strategic possibilities, creating effective action plans, and assisting businesses in making important decisions.
Apart from the standard report, we also offer in-depth analysis of the procurement level from forecasted shipping delays, distributor mapping by region, commodity analysis, production analysis, price mapping trends, sourcing, category performance analysis, supply chain risk management solutions, advanced benchmarking, and other services for procurement and strategic support.
Expected Impact of Economic Slowdown on the Pricing and Availability of Products
When economic activity slows, industries begin to suffer. The forecasted effects of the economic downturn on the pricing and accessibility of the products are taken into account in the market insight reports and intelligence services provided by DBMR. With this, our clients can typically keep one step ahead of their competitors, project their sales and revenue, and estimate their profit and loss expenditures.
Lanolin Market Scope
The lanolin market is segmented on the basis of type, composition, product, derivative and end-user. The growth amongst these segments will help you analyze meagre growth segments in the industries and provide the users with a valuable market overview and market insights to help them make strategic decisions for identifying core market applications.
Type
- Hydrous
- Anhydrous
Composition
- Natural Composition
- Chemical Composition
Product
- Fatty Acid
- Alcohols
- Others
Derivative
- Lanolin Alcohol
- Cholesterin
- Acetylated Lanolin
- Ethoxylated Lanolin
- Isopropyl Lanolate
- Lanolin Wax
- Laneth
- Lanogene
- Lanosterols
- Quaternium 33
- Peg-75
- Lanolin Fatty Acid
- Technical Wool Grease
- Crude Wool Grease
- Lanolin Oil
- Others
End-User
- Pharmaceuticals
- Personal Care and Cosmetics
- Industrial
- Baby Care
- Animal Care
- Others
Lanolin Market Regional Analysis
The lanolin market is analyzed and market size insights and trends are provided by country, type, composition, product, derivative and end-user as referenced above.
The countries covered in the lanolin market report are Germany, France, U.K., Netherlands, Switzerland, Belgium, Russia, Italy, Spain, Turkey and rest of Europe in Europe.
Germany dominates the Europe Lanolin market because of the increasing awareness of bio-based and natural based products among the customers along with the high utilization of anhydrous type within the region during the forecast period of 2025-2032.
The country section of the report also provides individual market impacting factors and changes in market regulation that impact the current and future trends of the market. Data points like down-stream and upstream value chain analysis, technical trends and porter's five forces analysis, case studies are some of the pointers used to forecast the market scenario for individual countries. Also, the presence and availability of global brands and their challenges faced due to large or scarce competition from local and domestic brands, impact of domestic tariffs and trade routes are considered while providing forecast analysis of the country data.
Lanolin Market Share
The lanolin market competitive landscape provides details by competitor. Details included are company overview, company financials, revenue generated, market potential, investment in research and development, new market initiatives, Europe presence, production sites and facilities, production capacities, company strengths and weaknesses, product launch, product width and breadth, application dominance. The above data points provided are only related to the companies' focus related to lanolin market.
Lanolin Market Leaders Operating in the Market Are:
- Europe seven agency (U.S.)
- SOLVAY (Belgium)
- Halocarbon, LLC (U.S.)
- BASF SE (Germany)
- Nippon Fine Chemical (Japan)
- Croda International Plc (U.K.)
- Zhejiang Garden Biochemical High-tech Co., Ltd., (Japan)
- The Lubrizol Corporation (U.S.)
- Dupont (U.S.)
- FENCHEM (U.S.)
- Wellman Advanced Materials (U.S.)
- Tallow Products Pty Ltd., (U.S.)
- Nanjing Duoyuan Biochemistry Co., Ltd. (China)
- Heessoils (Germany)
- Zhonglan Industry Co.,Ltd. (China)
- Charkit Chemical Company LLC (U.S.)
SKU-

- Interactive Data Analysis Dashboard
- Company Analysis Dashboard for high growth potential opportunities
- Research Analyst Access for customization & queries
- Competitor Analysis with Interactive dashboard
- Latest News, Updates & Trend analysis
- Harness the Power of Benchmark Analysis for Comprehensive Competitor Tracking
Europe Lanolin Market, Supply Chain Analysis and Ecosystem Framework
To support market growth and help clients navigate the impact of geopolitical shifts, DBMR has integrated in-depth supply chain analysis into its Europe Lanolin Market research reports. This addition empowers clients to respond effectively to global changes affecting their industries. The supply chain analysis section includes detailed insights such as Europe Lanolin Market consumption and production by country, price trend analysis, the impact of tariffs and geopolitical developments, and import and export trends by country and HSN code. It also highlights major suppliers with data on production capacity and company profiles, as well as key importers and exporters. In addition to research, DBMR offers specialized supply chain consulting services backed by over a decade of experience, providing solutions like supplier discovery, supplier risk assessment, price trend analysis, impact evaluation of inflation and trade route changes, and comprehensive market trend analysis.
Data collection and base year analysis are done using data collection modules with large sample sizes. The stage includes obtaining market information or related data through various sources and strategies. It includes examining and planning all the data acquired from the past in advance. It likewise envelops the examination of information inconsistencies seen across different information sources. The market data is analysed and estimated using market statistical and coherent models. Also, market share analysis and key trend analysis are the major success factors in the market report. To know more, please request an analyst call or drop down your inquiry.
The key research methodology used by DBMR research team is data triangulation which involves data mining, analysis of the impact of data variables on the market and primary (industry expert) validation. Data models include Vendor Positioning Grid, Market Time Line Analysis, Market Overview and Guide, Company Positioning Grid, Patent Analysis, Pricing Analysis, Company Market Share Analysis, Standards of Measurement, Global versus Regional and Vendor Share Analysis. To know more about the research methodology, drop in an inquiry to speak to our industry experts.
Data Bridge Market Research is a leader in advanced formative research. We take pride in servicing our existing and new customers with data and analysis that match and suits their goal. The report can be customized to include price trend analysis of target brands understanding the market for additional countries (ask for the list of countries), clinical trial results data, literature review, refurbished market and product base analysis. Market analysis of target competitors can be analyzed from technology-based analysis to market portfolio strategies. We can add as many competitors that you require data about in the format and data style you are looking for. Our team of analysts can also provide you data in crude raw excel files pivot tables (Fact book) or can assist you in creating presentations from the data sets available in the report.


