
Gcc Bubble Tea Market
Market Size in USD Million
 USD
155.40 Million
USD
277.91 Million
2024
2032
USD
155.40 Million
USD
277.91 Million
2024
2032
| 2025 - 2032 | |
| USD 155.40 Million | |
| USD 277.91 Million | |
| % | |
|
Bubble Tea Market Size
- The GCC bubble Tea market was valued at USD 155.40 million in 2024 and is expected to reach USD 277.91 million by 2032
- During the forecast period of 2025 to 2032 the market is likely to grow at a CAGR of 7.8%, primarily driven by the increase in popularity of the dish sushi
- This growth is driven by factors such as rising GCC popularity of Japanese cuisine, health-conscious consumers, sushi demand, cultural influence, urbanization, convenience, innovation, and tourism
Bubble Tea Market Analysis
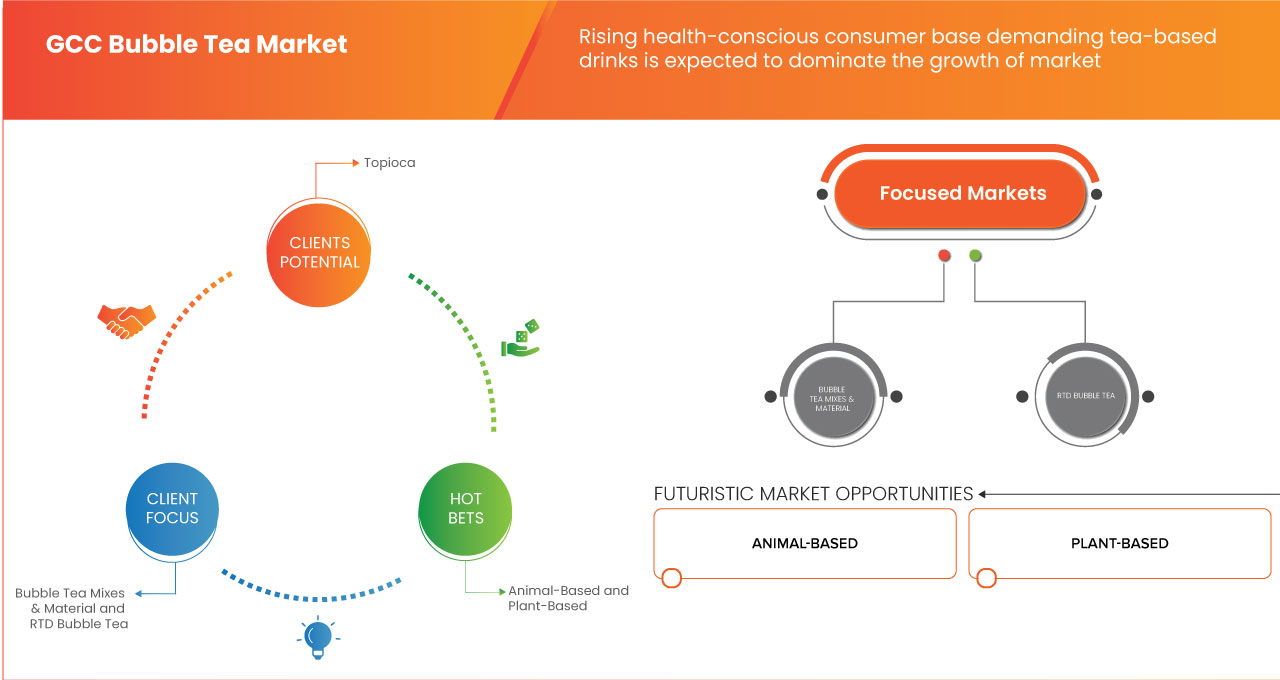
“Growing Demand for Healthier and Functional Bubble Tea Variants”
- A notable trend in the GCC bubble tea market is the increasing demand for healthier and functional bubble tea options, driven by rising health consciousness among consumers
- Many bubble tea brands are introducing low-sugar, dairy-free, and nutrient-enriched variants to cater to individuals seeking guilt-free indulgence without compromising on taste
- The use of alternative sweeteners, plant-based milk options, and added functional ingredients like collagen and probiotics is gaining traction, aligning with the region’s preference for wellness-focused beverages
- This shift in consumer preferences is encouraging market players to innovate and expand their product offerings, fueling the growth of the bubble tea market in the GCC region
Report Scope and Bubble tea Market Segmentation
|
Attributes |
Bubble tea Key Market Insights |
|
Segments Covered |
|
|
Countries Covered |
GCC
|
|
Key Market Players |
Chatime UAE. (U.A.E), HAPPY BUBBLES BOBA (U.A.E), KAWAIIBOBA (U.A.E), booba (U.A.E), Happy Lemon (Taiwan), Bubble Cha (U.A.E), DEKITATE (Qatar), Sharetea (U.A.E), KOI Thé (Singapore) |
|
Market Opportunities |
|
|
Value Added Data Infosets |
In addition to the insights on market scenarios such as market value, growth rate, segmentation, geographical coverage, and major players, the market reports curated by the Data Bridge Market Research also include import export analysis, production capacity overview, production consumption analysis, price trend analysis, climate change scenario, supply chain analysis, value chain analysis, raw material/consumables overview, vendor selection criteria, PESTLE Analysis, Porter Analysis, and regulatory framework. |
Bubble tea Market Trends
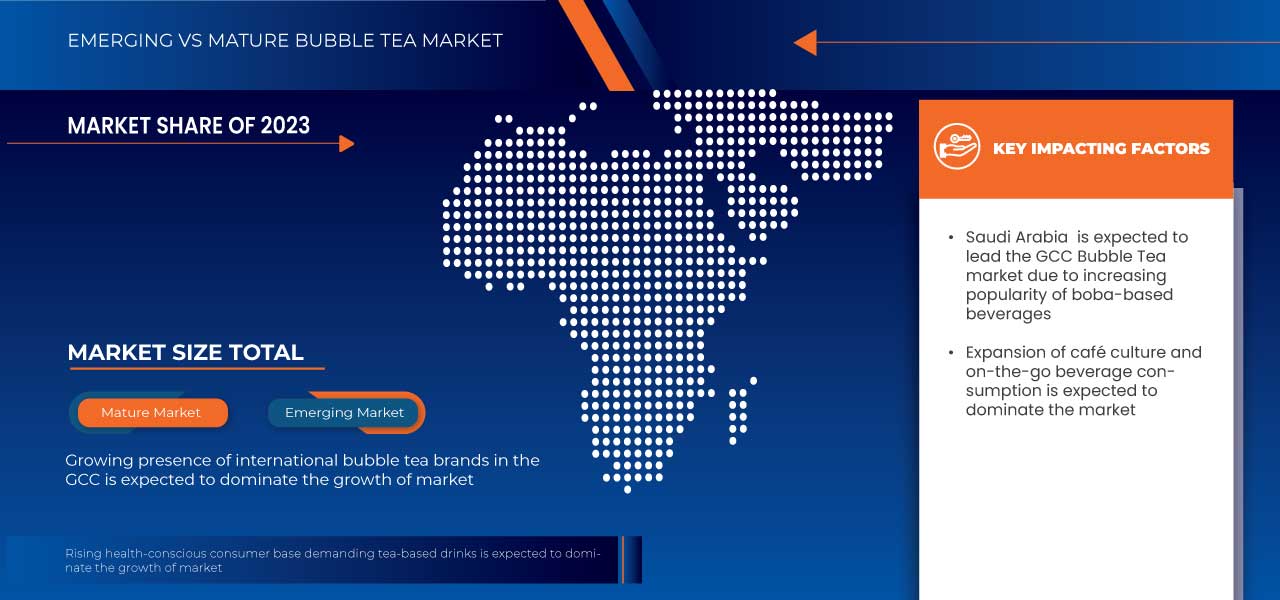
“Increasing Popularity of Boba-Based Beverages”
- One prominent trend in the GCC bubble tea market is the increasing popularity of boba-based beverages
- Bubble tea, with its diverse flavors, toppings, and textures, appeals to a broad consumer base. GCC consumers, especially younger demographics, are increasingly seeking out experiential dining and drinking options, making bubble tea an attractive choice
- For instance, In April 2024, TeaJoy Ltd published an article which stated, bubble tea’s popularity among young people is skyrocketing due to its vibrant aesthetics, unique textures, and customizable flavors. Social media platforms like Instagram and TikTok have amplified its appeal, with visually striking drinks driving engagement and encouraging more consumers to try boba-based beverages
- Aesthetic presentations, colorful drinks, and engaging branding have made bubble tea highly shareable, encouraging more consumers to try it. Influencers and food bloggers frequently feature new bubble tea brands, creating a viral effect that strengthens demand
Bubble tea Market Dynamics
Driver
“Expansion of Café Culture and on-the-Go Beverage Consumption”
- Urbanization, rising disposable incomes, and increased socialization habits have contributed to a surge in café-goers seeking novel and refreshing beverage options
- Young consumers, in particular, are drawn to aesthetically pleasing and customizable drinks, making bubble tea an ideal choice. The presence of international bubble tea chains and local specialty cafés has further popularized this trend, leading to increased awareness and availability of the product
For instance,
- In March 2024, As per ITP Media Group, Qatar-based bubble tea brand Tabi Boba is expanding across the GCC, inviting franchise applications from investors and entrepreneurs to capitalize on the growing bubble tea trend in the region
- In July 2024, Barns Franchise published an article which stated, Saudi Arabia's Barns Cafe, boasting over 750 outlets, launched a global franchise website in July 2024 to facilitate international expansion, reflecting the region's growing café culture and demand for diverse beverage options
- In February 2025, as per Insider Inc, Starbucks announced plans to open 500 new stores in the Middle East over five years, creating 5,000 jobs, underscoring the region's expanding café culture and the growing demand for on-the-go beverages
- With busy lifestyles and a growing preference for convenience, consumers in the GCC region are increasingly opting for quick, portable, and refreshing drinks
- Bubble tea’s versatility, with options for dairy-free, fruit-based, or caffeine-infused varieties, makes it a suitable choice for diverse consumer preferences
- The expansion of café culture and the increasing demand for on-the-go beverages are pivotal factors propelling the GCC bubble tea market. As consumer preferences continue to evolve, the market is expected to witness sustained growth, with innovation in flavors and health-conscious options further enhancing its appeal in the region
Opportunity
“Development of Dairy-Free and Plant-Based Bubble Tea Options”
- As health consciousness continues to rise, consumers are increasingly seeking dairy-free and plant-based alternatives in their beverages. This shift in preference is driven by lactose intolerance, vegan lifestyles, and growing awareness of the environmental impact of dairy production. The bubble tea market can significantly benefit from this trend by offering innovative and delicious dairy-free and plant-based options
- Plant-based milk alternatives like almond, soy, oat, and coconut milk are gaining traction as substitutes for traditional milk-based bubble teas. Introducing such options not only caters to the dietary preferences of health-conscious consumers but also broadens the customer base by attracting those who might have otherwise avoided bubble tea due to lactose intolerance or dietary restrictions
For instance,
- In a recent article by Go Dairy Free highlighted that Boba Guys, a prominent bubble tea chain, has embraced this shift by offering almond milk and oat milk as alternatives to traditional dairy. They have ensured that their dairy-free menu caters to vegan consumers without compromising on taste or quality
- Boba Moo has introduced a vegan and lactose-free instant bubble tea made with coconut milk. This product caters to consumers seeking convenient, plant-based beverage options without compromising on the traditional bubble tea experience
- Sharetea states they acknowledges the growing vegan trend by providing plain tea or fruity bubble tea options that are dairy-free. They also offer plant-based milk alternatives in their fresh milk tea category, catering to the preferences of health-conscious consumers
- By tapping into the growing demand for dairy-free and plant-based beverages, bubble tea vendors can solidify their market presence, meet evolving consumer expectations, and capitalize on the lucrative trend of sustainable and health-oriented product offerings
Restraint/Challenge
“High Cost of Premium Ingredients and Imported Raw Materials”
- Bubble tea relies on high-quality ingredients such as tapioca pearls, flavored syrups, tea leaves, milk, and fruit purees, many of which are not produced locally in the GCC region. The dependency on imports from countries like Taiwan, Thailand, and China significantly increases the cost due to shipping expenses, import duties, and fluctuating foreign exchange rates. Additionally, the stringent food safety regulations in GCC countries require imported ingredients to meet high quality and certification standards, further elevating procurement costs
For instance,
- In November 2023, alpen capital published an article which stated, the region's food industry faces challenges such as supply chain disruptions, rising costs, and raw material quality issues due to changing weather patterns and logistical hurdles
- As per Dubai SME, Dubai's F&B manufacturing sector heavily relies on imported raw materials, leading to increased production costs due to fluctuating global prices and supply chain vulnerabilities
- The high cost of premium ingredients and imported raw materials poses a significant challenge to the growth of the GCC bubble tea market. To mitigate this issue, businesses may need to explore local sourcing alternatives, negotiate better import deals, or introduce cost-effective variations to maintain affordability while ensuring quality and consumer satisfaction
Bubble Tea Market Scope
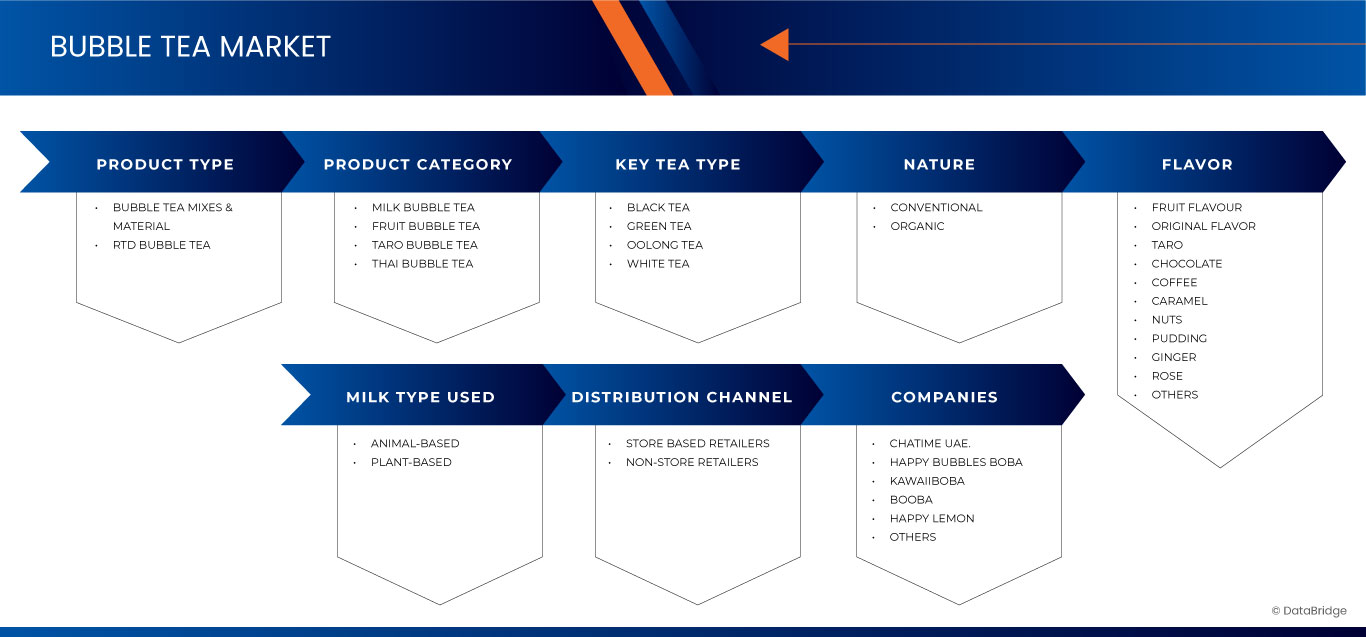
The market is segmented on the basis on product type, product category, key tea type, nature, flavor, milk type used, and distribution channel.
|
Segmentation |
Sub-Segmentation |
|
By Type |
|
|
By Product Category |
|
|
By Key Tea Type |
|
|
By Nature |
|
|
By Flavor |
|
|
By Milk Type Used |
|
|
By Distribution Channel |
Store Based Retailers
Non-Store Retailers
|
Bubble tea Market Regional Analysis
“Saudi Arabia is the Dominant Country in the Bubble tea Market”
- Saudi Arabia has the largest population in the GCC, providing a broad consumer base, especially among youth who are highly influenced by global food and beverage trends like bubble tea
- A growing café culture and rising number of local and international bubble tea outlets in cities like Riyadh and Jeddah support market dominance
- Higher disposable incomes and a strong appetite for premium beverages fuel demand for innovative and specialty drinks such as bubble tea
- The popularity of bubble tea in urban malls and social settings aligns well with Saudi Arabia’s modern lifestyle and retail environment
“Saudi Arabia is Projected to Register the Highest Growth Rate”
- Demand is expected to grow at a faster pace due to the increasing preference for healthier beverage options like fruit-infused and low-sugar bubble teas
- Social media trends among Saudi youth continue to drive interest in bubble tea, making it a “must-try” experience and fueling rapid consumption
- The expansion of both domestic and international bubble tea brands across Saudi Arabia contributes to wider accessibility and customer reach
- A growing tourism sector and a diverse expat population add to the market’s consumer base and openness to global beverage trends
Bubble Tea Market Share
The market competitive landscape provides details by competitor. Details included are company overview, company financials, revenue generated, market potential, investment in research and development, new market initiatives, GCC presence, production sites and facilities, production capacities, company strengths and weaknesses, product launch, product width and breadth, application dominance. The above data points provided are only related to the companies' focus related to market.
The Major Market Leaders Operating in the Market Are:
- Chatime UAE. (U.A.E)
- HAPPY BUBBLES BOBA (U.A.E)
- KAWAIIBOBA (U.A.E)
- booba (U.A.E)
- Happy Lemon (Taiwan)
Latest Developments in GCC Bubble tea Market
- In November 2024, Kawaii Boba Tea Shop has officially opened its first physical store in Dhahran, Saudi Arabia, located inside Noodlez restaurant in the Doha district. To celebrate, an exclusive launch event was held, where guests sampled signature drinks like Boba Milk Tea made with handmade Saudi date pearls. This marks a significant milestone in bringing locally inspired, healthier bubble tea to the community. The store’s unique offerings include fresh, handmade boba pearls crafted from Saudi dates, offering a distinctive twist on traditional bubble tea
- In September 2024, Kawaii Boba Tea Shop has partnered with Noodlez to expand its presence in the Eastern Province of Saudi Arabia, bringing handcrafted boba tea to Dammam, Dhahran, and Khobar. With over 14 Noodlez locations, this collaboration allows Kawaii Boba to serve its unique boba drinks, made with handmade Saudi date-infused pearls, to a larger audience. The partnership offers a variety of traditional and fruity flavors, making it more convenient for customers in the region to enjoy their favorite boba teas. Kawaii Boba also remains committed to supporting individuals with special needs, creating an inclusive and welcoming environment
SKU-

- Interactive Data Analysis Dashboard
- Company Analysis Dashboard for high growth potential opportunities
- Research Analyst Access for customization & queries
- Competitor Analysis with Interactive dashboard
- Latest News, Updates & Trend analysis
- Harness the Power of Benchmark Analysis for Comprehensive Competitor Tracking
Table of Content
1 INTRODUCTION
1.1 OBJECTIVES OF THE STUDY
1.2 MARKET DEFINITION
1.3 OVERVIEW
1.4 LIMITATIONS
1.5 MARKETS COVERED
2 MARKET SEGMENTATION
2.1 MARKETS COVERED
2.2 YEARS CONSIDERED FOR THE STUDY
2.3 CURRENCY AND PRICING
2.4 DBMR TRIPOD DATA VALIDATION MODEL
2.5 MULTIVARIATE MODELING
2.6 PRIMARY INTERVIEWS WITH KEY OPINION LEADERS
2.7 DBMR MARKET POSITION GRID
2.8 DBMR VENDOR SHARE ANALYSIS
2.9 SECONDARY SOURCES
2.1 ASSUMPTIONS
3 EXECUTIVE SUMMARY
4 PREMIUM INSIGHTS
4.1 IMPORT EXPORT SCENARIO
4.2 PRICING ANALYSIS
4.3 PRODUCTION CAPACITY OF KEY MANUFACTURERS
4.4 SUPPLY CHAIN ANALYSIS
4.4.1 RAW MATERIAL SOURCING
4.4.2 MANUFACTURING AND PROCESSING
4.4.3 DISTRIBUTION AND LOGISTICS
4.4.4 RETAIL AND SALES CHANNELS
4.4.5 CONSUMER EXPERIENCE AND FEEDBACK LOOP
4.4.6 CONCLUSION
4.4.7 IMPORTANCE OF LOGISTICS SERVICE PROVIDERS
4.5 BRAND OUTLOOK
4.5.1 PRODUCT VS BRAND OVERVIEW
4.5.2 PRODUCT OVERVIEW
4.5.3 BRAND OVERVIEW
4.5.4 CONCLUSION
4.6 CLIMATE CHANGE SCENARIO
4.6.1 ENVIRONMENTAL CONCERNS
4.6.2 INDUSTRY RESPONSE
4.6.3 GOVERNMENT’S ROLE
4.6.4 ANALYST RECOMMENDATIONS
4.6.5 CONCLUSION
4.7 FACTORS INFLUENCING PURCHASING DECISION OF CUSTOMERS
4.7.1 TASTE, FLAVOR VARIETY, AND CUSTOMIZATION
4.7.2 PRICING AND PERCEIVED VALUE
4.7.3 BRAND REPUTATION AND QUALITY PERCEPTION
4.7.4 HEALTH AND DIETARY PREFERENCES
4.7.5 CONVENIENCE AND ACCESSIBILITY
4.7.6 SOCIAL MEDIA INFLUENCE AND DIGITAL MARKETING
4.7.7 CULTURAL AND DEMOGRAPHIC PREFERENCES
4.7.8 SUSTAINABILITY AND ETHICAL CONSIDERATIONS
4.7.9 CONCLUSION
4.8 IMPACT OF ECONOMIC SLOWDOWN
4.8.1 IMPACT ON PRICE
4.8.2 IMPACT ON SUPPLY CHAIN
4.8.3 IMPACT ON SHIPMENT
4.8.4 IMPACT ON COMPANY’S STRATEGIC DECISIONS
4.8.5 CONCLUSION
4.9 MARKETING STRATEGIES ADOPTED BY KEY MARKET PLAYERS
4.9.1 DIGITAL AND SOCIAL MEDIA MARKETING
4.9.2 PRODUCT DIVERSIFICATION AND INNOVATION
4.9.3 LOCALIZATION AND CULTURAL ADAPTATION
4.9.4 CUSTOMER LOYALTY AND ENGAGEMENT PROGRAMS
4.9.5 FRANCHISE EXPANSION AND STRATEGIC PARTNERSHIPS
4.1 NEW PRODUCT LAUNCH STRATEGY
4.10.1 DIFFERENTIAL PRODUCT OFFERING
4.10.2 MEETING CONSUMER REQUIREMENTS
4.10.3 PACKAGE DESIGNING
4.10.4 PRICING ANALYSIS
4.10.5 PRODUCT POSITIONING
4.10.6 NEW FORMULATION AND LINE EXTENSION
4.11 NEW PRODUCT LAUNCHES
4.12 PRIVATE LABEL VS. BRAND ANALYSIS
4.12.1 PRIVATE LABEL
4.12.2 BRAND
4.12.3 CONCLUSION
4.13 PROMOTIONAL ACTIVITIES
4.13.1 LEVERAGING SOCIAL MEDIA PLATFORMS
4.13.2 ENGAGING CONTENT CREATION
4.13.3 STRATEGIC PARTNERSHIPS AND COLLABORATIONS
4.13.4 PARTICIPATING IN COMMUNITY EVENTS
4.13.5 IMPLEMENTING LOYALTY PROGRAMS
4.13.6 UTILIZING SEASONAL PACKAGING
4.13.7 EXPANDING PRODUCT OFFERINGS
4.13.8 OFFERING COMPLEMENTARY FOOD ITEMS
4.14 SHOPPING BEHAVIOUR AND DYNAMICS
4.14.1 RECOMMENDATIONS FROM FAMILY AND FRIENDS
4.14.2 RESEARCH-DRIVEN DECISIONS
4.14.3 IMPULSIVE BUYING PATTERNS
4.14.4 ADVERTISING INFLUENCE
4.14.5 CONCLUSION
5 REGULATORY FRAMEWORK AND GUIDELINES
6 MARKET OVERVIEW
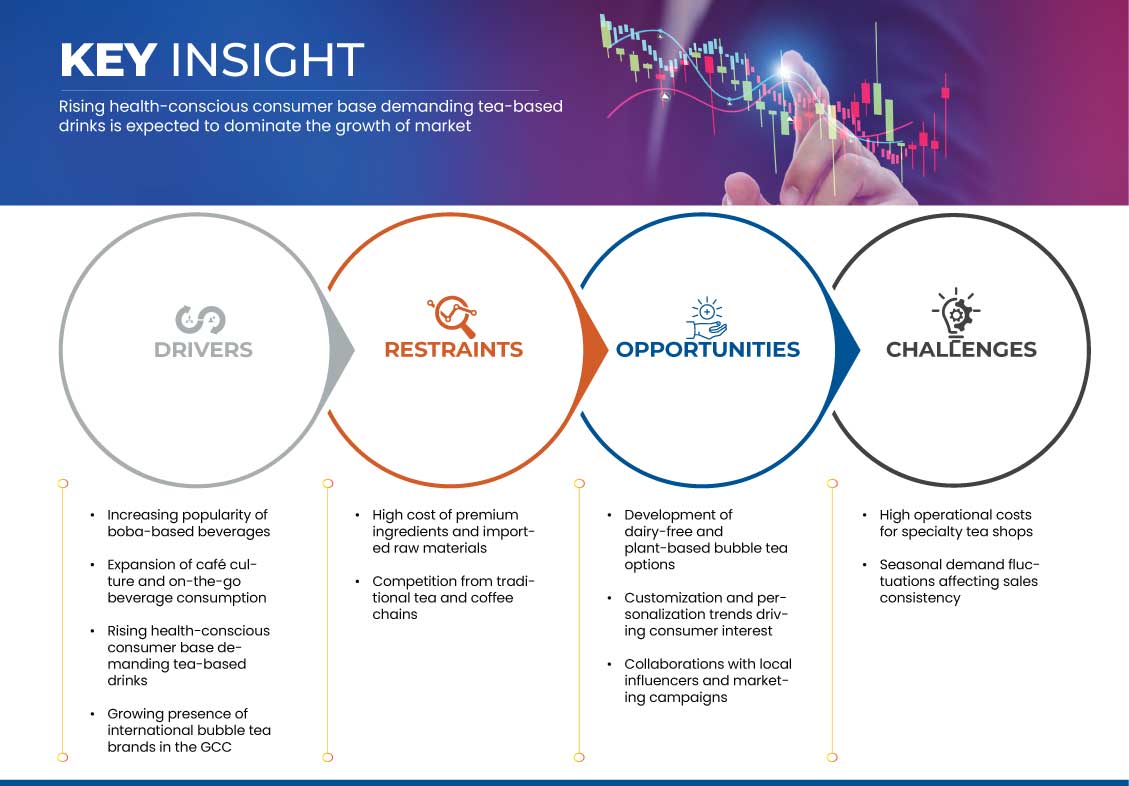
6.1 DRIVERS
6.1.1 INCREASING POPULARITY OF BOBA-BASED BEVERAGES
6.1.2 EXPANSION OF CAFÉ CULTURE AND ON-THE-GO BEVERAGE CONSUMPTION
6.1.3 RISING HEALTH-CONSCIOUS CONSUMER BASE DEMANDING TEA-BASED DRINKS
6.1.4 GROWING PRESENCE OF INTERNATIONAL BUBBLE TEA BRANDS IN THE GCC
6.2 RESTRAINTS
6.2.1 HIGH COST OF PREMIUM INGREDIENTS AND IMPORTED RAW MATERIALS
6.2.2 COMPETITION FROM TRADITIONAL TEA AND COFFEE CHAINS
6.3 OPPORTUNITIES
6.3.1 DEVELOPMENT OF DAIRY-FREE AND PLANT-BASED BUBBLE TEA OPTIONS
6.3.2 CUSTOMIZATION AND PERSONALIZATION TRENDS DRIVING CONSUMER INTEREST
6.3.3 COLLABORATIONS WITH LOCAL INFLUENCERS AND MARKETING CAMPAIGNS
6.4 CHALLENGES
6.4.1 HIGH OPERATIONAL COSTS FOR SPECIALTY TEA SHOPS
6.4.2 SEASONAL DEMAND FLUCTUATIONS AFFECTING SALES CONSISTENCY
7 GCC BUBBLE TEA MARKET, BY PRODUCT TYPE
7.1 OVERVIEW
7.2 BUBBLE TEA MIXES & MATERIAL
7.3 RTD BUBBLE TEA
8 GCC BUBBLE TEA MARKET, BY PRODUCT CATEGORY
8.1 OVERVIEW
8.2 MILK BUBBLE TEA
8.3 FRUIT BUBBLE TEA
8.4 TARO BUBBLE TEA
8.5 THAI BUBBLE TEA
9 GCC BUBBLE TEA MARKET, BY KEY TEA TYPE
9.1 OVERVIEW
9.2 BLACK TEA
9.3 GREEN TEA
9.4 OOLONG TEA
9.5 WHITE TEA
10 GCC BUBBLE TEA MARKET, BY NATURE
10.1 OVERVIEW
10.2 CONVENTIONAL
10.3 ORGANIC
11 GCC BUBBLE TEA MARKET, BY FLAVOR
11.1 OVERVIEW
11.2 FRUIT FLAVOUR
11.3 ORIGINAL FLAVOR
11.4 TARO
11.5 CHOCOLATE
11.6 COFFEE
11.7 CARAMEL
11.8 NUTS
11.9 PUDDING
11.1 GINGER
11.11 ROSE
11.12 OTHERS
12 GCC BUBBLE TEA MARKET, BY MILK TYPE USED
12.1 OVERVIEW
12.2 ANIMAL-BASED
12.3 PLANT-BASED
13 GCC BUBBLE TEA MARKET, BY DISTRIBUTION CHANNEL
13.1 OVERVIEW
13.2 STORE BASED RETAILERS
13.3 NON-STORE RETAILERS
14 GCC BUBBLE TEA MARKET BY COUNTRY
14.1 GCC
14.2 SAUDI ARABIA
14.3 U.A.E.
14.4 QATAR
14.5 KUWAIT
14.6 OMAN
14.7 BAHRAIN
15 GCC BUBBLE TEA MARKET: COMPANY LANDSCAPE
15.1 COMPANY SHARE ANALYSIS: GCC
16 SWOT ANALYSIS
17 COMPANY PROFILE
17.1 CHATIME UAE.
17.1.1 COMPANY SNAPSHOT
17.1.2 PRODUCT PORTFOLIO
17.1.3 RECENT DEVELOPMENT
17.2 HAPPYBUBBLESBOBA
17.2.1 COMPANY SNAPSHOT
17.2.2 PRODUCT PORTFOLIO
17.2.3 RECENT DEVELOPMENT
17.3 BOOBA
17.3.1 COMPANY SNAPSHOT
17.3.2 PRODUCT PORTFOLIO
17.3.3 RECENT DEVELOPMENT
17.4 KAWAII BOBA
17.4.1 COMPANY SNAPSHOT
17.4.2 PRODUCT PORTFOLIO
17.4.3 RECENT DEVELOPMENT
17.5 HAPPY LEMON
17.5.1 COMPANY SNAPSHOT
17.5.2 PRODUCT PORTFOLIO
17.5.3 RECENT DEVELOPMENT
17.6 BUBBLE CHA
17.6.1 COMPANY SNAPSHOT
17.6.2 PRODUCT PORTFOLIO
17.6.3 RECENT DEVELOPMENT
17.7 DEKITATE
17.7.1 COMPANY SNAPSHOT
17.7.2 PRODUCT PORTFOLIO
17.7.3 RECENT DEVELOPMENT
17.8 KOI THÉ
17.8.1 COMPANY SNAPSHOT
17.8.2 PRODUCT PORTFOLIO
17.8.3 RECENT DEVELOPMENT
17.9 SHARETEA
17.9.1 COMPANY SNAPSHOT
17.9.2 PRODUCT PORTFOLIO
17.9.3 RECENT DEVELOPMENT
18 QUESTIONNAIRE
19 RELATED REPORTS
List of Table
TABLE 1 PRODUCTION CAPACITY OF KEY MANUFACTURERS
TABLE 2 BRAND COMPARATIVE ANALYSIS OF GCC BUBBLE TEA MARKET
TABLE 3 REGULATORY FRAMEWORK AND GUIDELINES
TABLE 4 GCC BUBBLE TEA MARKET, BY PRODUCT TYPE, 2018-2032 (USD THOUSAND)
TABLE 5 GCC BUBBLE TEA MIXES & MATERIAL IN BUBBLE TEA MARKET, BY TYPE, 2018-2032 (USD THOUSAND)
TABLE 6 GCC BUBBLE TEA TOPPINGS IN BUBBLE TEA MARKET, BY TYPE, 2018-2032 (USD THOUSAND)
TABLE 7 GCC TOPIOCA IN BUBBLE TEA MARKET, BY TYPE, 2018-2032 (USD THOUSAND)
TABLE 8 GCC BUBBLE TEA MIXES & MATERIAL IN BUBBLE TEA MARKET, BY PRODUCT CATEGORY, 2018-2032 (USD THOUSAND)
TABLE 9 GCC BUBBLE TEA MIXES & MATERIAL IN BUBBLE TEA MARKET, BY KEY TEA TYPE, 2018-2032 (USD THOUSAND)
TABLE 10 GCC BUBBLE TEA MIXES & MATERIAL IN BUBBLE TEA MARKET, BY NATURE, 2018-2032 (USD THOUSAND)
TABLE 11 GCC RTD BUBBLE TEA IN BUBBLE TEA MARKET, BY PRODUCT CATEGORY, 2018-2032 (USD THOUSAND)
TABLE 12 GCC RTD BUBBLE TEA IN BUBBLE TEA MARKET, BY KEY TEA TYPE, 2018-2032 (USD THOUSAND)
TABLE 13 GCC RTD BUBBLE TEA IN BUBBLE TEA MARKET, BY NATURE, 2018-2032 (USD THOUSAND)
TABLE 14 GCC BUBBLE TEA MARKET, BY PRODUCT CATEGORY, 2018-2032 (USD THOUSAND)
TABLE 15 GCC BUBBLE TEA MARKET, BY KEY TEA TYPE, 2018-2032 (USD THOUSAND)
TABLE 16 GCC BUBBLE TEA MARKET, BY NATURE, 2018-2032 (USD THOUSAND)
TABLE 17 GCC BUBBLE TEA MARKET, BY FLAVOR, 2018-2032 (USD THOUSAND)
TABLE 18 GCC FRUIT FLAVOUR IN BUBBLE TEA MARKET, BY TYPE, 2018-2032 (USD THOUSAND)
TABLE 19 GCC BUBBLE TEA MARKET, BY MILK TYPE USED, 2018-2032 (USD THOUSAND)
TABLE 20 GCC PLANT-BASED IN BUBBLE TEA MARKET, BY SOURCE, 2018-2032 (USD THOUSAND)
TABLE 21 GCC BUBBLE TEA MARKET, BY DISTRIBUTION CHANNEL, 2018-2032 (USD THOUSAND)
TABLE 22 GCC STORE-BASED RETAILERS IN BUBBLE TEA MARKET, BY TYPE, 2018-2032 (USD THOUSAND)
TABLE 23 GCC NON-STORE RETAILERS IN BUBBLE TEA MARKET, BY TYPE, 2018-2032 (USD THOUSAND)
TABLE 24 GCC BUBBLE TEA MARKET, BY COUNTRY, 2018-2032 (USD THOUSAND)
TABLE 25 SAUDI ARABIA BUBBLE TEA MARKET, BY PRODUCT TYPE, 2018-2032 (USD THOUSAND)
TABLE 26 SAUDI ARABIA BUBBLE TEA MIXES & MATERIAL IN BUBBLE TEA MARKET, BY TYPE, 2018-2032 (USD THOUSAND)
TABLE 27 SAUDI ARABIA BUBBLE TEA TOPPINGS IN BUBBLE TEA MARKET, BY TYPE, 2018-2032 (USD THOUSAND)
TABLE 28 SAUDI ARABIA TOPIOCA IN BUBBLE TEA MARKET, BY TYPE, 2018-2032 (USD THOUSAND)
TABLE 29 SAUDI ARABIA BUBBLE TEA MIXES & MATERIAL IN BUBBLE TEA MARKET, BY PRODUCT CATEGORY, 2018-2032 (USD THOUSAND)
TABLE 30 SAUDI ARABIA BUBBLE TEA MIXES & MATERIAL IN BUBBLE TEA MARKET, BY KEY TEA TYPE, 2018-2032 (USD THOUSAND)
TABLE 31 SAUDI ARABIA BUBBLE TEA MIXES & MATERIAL IN BUBBLE TEA MARKET, BY NATURE, 2018-2032 (USD THOUSAND)
TABLE 32 SAUDI ARABIA RTD BUBBLE TEA IN BUBBLE TEA MARKET, BY PRODUCT CATEGORY, 2018-2032 (USD THOUSAND)
TABLE 33 SAUDI ARABIA RTD BUBBLE TEA IN BUBBLE TEA MARKET, BY KEY TEA TYPE, 2018-2032 (USD THOUSAND)
TABLE 34 SAUDI ARABIA RTD BUBBLE TEA IN BUBBLE TEA MARKET, BY NATURE, 2018-2032 (USD THOUSAND)
TABLE 35 SAUDI ARABIA BUBBLE TEA MARKET, BY PRODUCT CATEGORY, 2018-2032 (USD THOUSAND)
TABLE 36 SAUDI ARABIA BUBBLE TEA MARKET, BY KEY TEA TYPE, 2018-2032 (USD THOUSAND)
TABLE 37 SAUDI ARABIA BUBBLE TEA MARKET, BY NATURE, 2018-2032 (USD THOUSAND)
TABLE 38 SAUDI ARABIA BUBBLE TEA MARKET, BY FLAVOR, 2018-2032 (USD THOUSAND)
TABLE 39 SAUDI ARABIA FRUIT FLAVOUR IN BUBBLE TEA MARKET, BY TYPE, 2018-2032 (USD THOUSAND)
TABLE 40 SAUDI ARABIA BUBBLE TEA MARKET, BY MILK TYPE USED, 2018-2032 (USD THOUSAND)
TABLE 41 SAUDI ARABIA PLANT-BASED IN BUBBLE TEA MARKET, BY SOURCE, 2018-2032 (USD THOUSAND)
TABLE 42 SAUDI ARABIA BUBBLE TEA MARKET, BY DISTRIBUTION CHANNEL, 2018-2032 (USD THOUSAND)
TABLE 43 SAUDI ARABIA STORE-BASED RETAILERS IN BUBBLE TEA MARKET, BY TYPE, 2018-2032 (USD THOUSAND)
TABLE 44 SAUDI ARABIA NON-STORE RETAILERS IN BUBBLE TEA MARKET, BY TYPE, 2018-2032 (USD THOUSAND)
TABLE 45 U.A.E. BUBBLE TEA MARKET, BY PRODUCT TYPE, 2018-2032 (USD THOUSAND)
TABLE 46 U.A.E. BUBBLE TEA MIXES & MATERIAL IN BUBBLE TEA MARKET, BY TYPE, 2018-2032 (USD THOUSAND)
TABLE 47 U.A.E. BUBBLE TEA TOPPINGS IN BUBBLE TEA MARKET, BY TYPE, 2018-2032 (USD THOUSAND)
TABLE 48 U.A.E. TOPIOCA IN BUBBLE TEA MARKET, BY TYPE, 2018-2032 (USD THOUSAND)
TABLE 49 U.A.E. BUBBLE TEA MIXES & MATERIAL IN BUBBLE TEA MARKET, BY PRODUCT CATEGORY, 2018-2032 (USD THOUSAND)
TABLE 50 U.A.E. BUBBLE TEA MIXES & MATERIAL IN BUBBLE TEA MARKET, BY KEY TEA TYPE, 2018-2032 (USD THOUSAND)
TABLE 51 U.A.E. BUBBLE TEA MIXES & MATERIAL IN BUBBLE TEA MARKET, BY NATURE, 2018-2032 (USD THOUSAND)
TABLE 52 U.A.E. RTD BUBBLE TEA IN BUBBLE TEA MARKET, BY PRODUCT CATEGORY, 2018-2032 (USD THOUSAND)
TABLE 53 U.A.E. RTD BUBBLE TEA IN BUBBLE TEA MARKET, BY KEY TEA TYPE, 2018-2032 (USD THOUSAND)
TABLE 54 U.A.E. RTD BUBBLE TEA IN BUBBLE TEA MARKET, BY NATURE, 2018-2032 (USD THOUSAND)
TABLE 55 U.A.E. BUBBLE TEA MARKET, BY PRODUCT CATEGORY, 2018-2032 (USD THOUSAND)
TABLE 56 U.A.E. BUBBLE TEA MARKET, BY KEY TEA TYPE, 2018-2032 (USD THOUSAND)
TABLE 57 U.A.E. BUBBLE TEA MARKET, BY NATURE, 2018-2032 (USD THOUSAND)
TABLE 58 U.A.E. BUBBLE TEA MARKET, BY FLAVOR, 2018-2032 (USD THOUSAND)
TABLE 59 U.A.E. FRUIT FLAVOUR IN BUBBLE TEA MARKET, BY TYPE, 2018-2032 (USD THOUSAND)
TABLE 60 U.A.E. BUBBLE TEA MARKET, BY MILK TYPE USED, 2018-2032 (USD THOUSAND)
TABLE 61 U.A.E. PLANT-BASED IN BUBBLE TEA MARKET, BY SOURCE, 2018-2032 (USD THOUSAND)
TABLE 62 U.A.E. BUBBLE TEA MARKET, BY DISTRIBUTION CHANNEL, 2018-2032 (USD THOUSAND)
TABLE 63 U.A.E. STORE-BASED RETAILERS IN BUBBLE TEA MARKET, BY TYPE, 2018-2032 (USD THOUSAND)
TABLE 64 U.A.E. NON-STORE RETAILERS IN BUBBLE TEA MARKET, BY TYPE, 2018-2032 (USD THOUSAND)
TABLE 65 QATAR BUBBLE TEA MARKET, BY PRODUCT TYPE, 2018-2032 (USD THOUSAND)
TABLE 66 QATAR BUBBLE TEA MIXES & MATERIAL IN BUBBLE TEA MARKET, BY TYPE, 2018-2032 (USD THOUSAND)
TABLE 67 QATAR BUBBLE TEA TOPPINGS IN BUBBLE TEA MARKET, BY TYPE, 2018-2032 (USD THOUSAND)
TABLE 68 QATAR TOPIOCA IN BUBBLE TEA MARKET, BY TYPE, 2018-2032 (USD THOUSAND)
TABLE 69 QATAR BUBBLE TEA MIXES & MATERIAL IN BUBBLE TEA MARKET, BY PRODUCT CATEGORY, 2018-2032 (USD THOUSAND)
TABLE 70 QATAR BUBBLE TEA MIXES & MATERIAL IN BUBBLE TEA MARKET, BY KEY TEA TYPE, 2018-2032 (USD THOUSAND)
TABLE 71 QATAR BUBBLE TEA MIXES & MATERIAL IN BUBBLE TEA MARKET, BY NATURE, 2018-2032 (USD THOUSAND)
TABLE 72 QATAR RTD BUBBLE TEA IN BUBBLE TEA MARKET, BY PRODUCT CATEGORY, 2018-2032 (USD THOUSAND)
TABLE 73 QATAR RTD BUBBLE TEA IN BUBBLE TEA MARKET, BY KEY TEA TYPE, 2018-2032 (USD THOUSAND)
TABLE 74 QATAR RTD BUBBLE TEA IN BUBBLE TEA MARKET, BY NATURE, 2018-2032 (USD THOUSAND)
TABLE 75 QATAR BUBBLE TEA MARKET, BY PRODUCT CATEGORY, 2018-2032 (USD THOUSAND)
TABLE 76 QATAR BUBBLE TEA MARKET, BY KEY TEA TYPE, 2018-2032 (USD THOUSAND)
TABLE 77 QATAR BUBBLE TEA MARKET, BY NATURE, 2018-2032 (USD THOUSAND)
TABLE 78 QATAR BUBBLE TEA MARKET, BY FLAVOR, 2018-2032 (USD THOUSAND)
TABLE 79 QATAR FRUIT FLAVOUR IN BUBBLE TEA MARKET, BY TYPE, 2018-2032 (USD THOUSAND)
TABLE 80 QATAR BUBBLE TEA MARKET, BY MILK TYPE USED, 2018-2032 (USD THOUSAND)
TABLE 81 QATAR PLANT-BASED IN BUBBLE TEA MARKET, BY SOURCE, 2018-2032 (USD THOUSAND)
TABLE 82 QATAR BUBBLE TEA MARKET, BY DISTRIBUTION CHANNEL, 2018-2032 (USD THOUSAND)
TABLE 83 QATAR STORE-BASED RETAILERS IN BUBBLE TEA MARKET, BY TYPE, 2018-2032 (USD THOUSAND)
TABLE 84 QATAR NON-STORE RETAILERS IN BUBBLE TEA MARKET, BY TYPE, 2018-2032 (USD THOUSAND)
TABLE 85 KUWAIT BUBBLE TEA MARKET, BY PRODUCT TYPE, 2018-2032 (USD THOUSAND)
TABLE 86 KUWAIT BUBBLE TEA MIXES & MATERIAL IN BUBBLE TEA MARKET, BY TYPE, 2018-2032 (USD THOUSAND)
TABLE 87 KUWAIT BUBBLE TEA TOPPINGS IN BUBBLE TEA MARKET, BY TYPE, 2018-2032 (USD THOUSAND)
TABLE 88 KUWAIT TOPIOCA IN BUBBLE TEA MARKET, BY TYPE, 2018-2032 (USD THOUSAND)
TABLE 89 KUWAIT BUBBLE TEA MIXES & MATERIAL IN BUBBLE TEA MARKET, BY PRODUCT CATEGORY, 2018-2032 (USD THOUSAND)
TABLE 90 KUWAIT BUBBLE TEA MIXES & MATERIAL IN BUBBLE TEA MARKET, BY KEY TEA TYPE, 2018-2032 (USD THOUSAND)
TABLE 91 KUWAIT BUBBLE TEA MIXES & MATERIAL IN BUBBLE TEA MARKET, BY NATURE, 2018-2032 (USD THOUSAND)
TABLE 92 KUWAIT RTD BUBBLE TEA IN BUBBLE TEA MARKET, BY PRODUCT CATEGORY, 2018-2032 (USD THOUSAND)
TABLE 93 KUWAIT RTD BUBBLE TEA IN BUBBLE TEA MARKET, BY KEY TEA TYPE, 2018-2032 (USD THOUSAND)
TABLE 94 KUWAIT RTD BUBBLE TEA IN BUBBLE TEA MARKET, BY NATURE, 2018-2032 (USD THOUSAND)
TABLE 95 KUWAIT BUBBLE TEA MARKET, BY PRODUCT CATEGORY, 2018-2032 (USD THOUSAND)
TABLE 96 KUWAIT BUBBLE TEA MARKET, BY KEY TEA TYPE, 2018-2032 (USD THOUSAND)
TABLE 97 KUWAIT BUBBLE TEA MARKET, BY NATURE, 2018-2032 (USD THOUSAND)
TABLE 98 KUWAIT BUBBLE TEA MARKET, BY FLAVOR, 2018-2032 (USD THOUSAND)
TABLE 99 KUWAIT FRUIT FLAVOUR IN BUBBLE TEA MARKET, BY TYPE, 2018-2032 (USD THOUSAND)
TABLE 100 KUWAIT BUBBLE TEA MARKET, BY MILK TYPE USED, 2018-2032 (USD THOUSAND)
TABLE 101 KUWAIT PLANT-BASED IN BUBBLE TEA MARKET, BY SOURCE, 2018-2032 (USD THOUSAND)
TABLE 102 KUWAIT BUBBLE TEA MARKET, BY DISTRIBUTION CHANNEL, 2018-2032 (USD THOUSAND)
TABLE 103 KUWAIT STORE BASED RETAILERS IN BUBBLE TEA MARKET, BY TYPE, 2018-2032 (USD THOUSAND)
TABLE 104 KUWAIT NON-STORE RETAILERS IN BUBBLE TEA MARKET, BY TYPE, 2018-2032 (USD THOUSAND)
TABLE 105 OMAN BUBBLE TEA MARKET, BY PRODUCT TYPE, 2018-2032 (USD THOUSAND)
TABLE 106 OMAN BUBBLE TEA MIXES & MATERIAL IN BUBBLE TEA MARKET, BY TYPE, 2018-2032 (USD THOUSAND)
TABLE 107 OMAN BUBBLE TEA TOPPINGS IN BUBBLE TEA MARKET, BY TYPE, 2018-2032 (USD THOUSAND)
TABLE 108 OMAN TOPIOCA IN BUBBLE TEA MARKET, BY TYPE, 2018-2032 (USD THOUSAND)
TABLE 109 OMAN BUBBLE TEA MIXES & MATERIAL IN BUBBLE TEA MARKET, BY PRODUCT CATEGORY, 2018-2032 (USD THOUSAND)
TABLE 110 OMAN BUBBLE TEA MIXES & MATERIAL IN BUBBLE TEA MARKET, BY KEY TEA TYPE, 2018-2032 (USD THOUSAND)
TABLE 111 OMAN BUBBLE TEA MIXES & MATERIAL IN BUBBLE TEA MARKET, BY NATURE, 2018-2032 (USD THOUSAND)
TABLE 112 OMAN RTD BUBBLE TEA IN BUBBLE TEA MARKET, BY PRODUCT CATEGORY, 2018-2032 (USD THOUSAND)
TABLE 113 OMAN RTD BUBBLE TEA IN BUBBLE TEA MARKET, BY KEY TEA TYPE, 2018-2032 (USD THOUSAND)
TABLE 114 OMAN RTD BUBBLE TEA IN BUBBLE TEA MARKET, BY NATURE, 2018-2032 (USD THOUSAND)
TABLE 115 OMAN BUBBLE TEA MARKET, BY PRODUCT CATEGORY, 2018-2032 (USD THOUSAND)
TABLE 116 OMAN BUBBLE TEA MARKET, BY KEY TEA TYPE, 2018-2032 (USD THOUSAND)
TABLE 117 OMAN BUBBLE TEA MARKET, BY NATURE, 2018-2032 (USD THOUSAND)
TABLE 118 OMAN BUBBLE TEA MARKET, BY FLAVOR, 2018-2032 (USD THOUSAND)
TABLE 119 OMAN FRUIT FLAVOUR IN BUBBLE TEA MARKET, BY TYPE, 2018-2032 (USD THOUSAND)
TABLE 120 OMAN BUBBLE TEA MARKET, BY MILK TYPE USED, 2018-2032 (USD THOUSAND)
TABLE 121 OMAN PLANT-BASED IN BUBBLE TEA MARKET, BY SOURCE, 2018-2032 (USD THOUSAND)
TABLE 122 OMAN BUBBLE TEA MARKET, BY DISTRIBUTION CHANNEL, 2018-2032 (USD THOUSAND)
TABLE 123 OMAN STORE BASED RETAILERS IN BUBBLE TEA MARKET, BY TYPE, 2018-2032 (USD THOUSAND)
TABLE 124 OMAN NON-STORE RETAILERS IN BUBBLE TEA MARKET, BY TYPE, 2018-2032 (USD THOUSAND)
TABLE 125 BAHRAIN BUBBLE TEA MARKET, BY PRODUCT TYPE, 2018-2032 (USD THOUSAND)
TABLE 126 BAHRAIN BUBBLE TEA MIXES & MATERIAL IN BUBBLE TEA MARKET, BY TYPE, 2018-2032 (USD THOUSAND)
TABLE 127 BAHRAIN BUBBLE TEA TOPPINGS IN BUBBLE TEA MARKET, BY TYPE, 2018-2032 (USD THOUSAND)
TABLE 128 BAHRAIN TOPIOCA IN BUBBLE TEA MARKET, BY TYPE, 2018-2032 (USD THOUSAND)
TABLE 129 BAHRAIN BUBBLE TEA MIXES & MATERIAL IN BUBBLE TEA MARKET, BY PRODUCT CATEGORY, 2018-2032 (USD THOUSAND)
TABLE 130 BAHRAIN BUBBLE TEA MIXES & MATERIAL IN BUBBLE TEA MARKET, BY KEY TEA TYPE, 2018-2032 (USD THOUSAND)
TABLE 131 BAHRAIN BUBBLE TEA MIXES & MATERIAL IN BUBBLE TEA MARKET, BY NATURE, 2018-2032 (USD THOUSAND)
TABLE 132 BAHRAIN RTD BUBBLE TEA IN BUBBLE TEA MARKET, BY PRODUCT CATEGORY, 2018-2032 (USD THOUSAND)
TABLE 133 BAHRAIN RTD BUBBLE TEA IN BUBBLE TEA MARKET, BY KEY TEA TYPE, 2018-2032 (USD THOUSAND)
TABLE 134 BAHRAIN RTD BUBBLE TEA IN BUBBLE TEA MARKET, BY NATURE, 2018-2032 (USD THOUSAND)
TABLE 135 BAHRAIN BUBBLE TEA MARKET, BY PRODUCT CATEGORY, 2018-2032 (USD THOUSAND)
TABLE 136 BAHRAIN BUBBLE TEA MARKET, BY KEY TEA TYPE, 2018-2032 (USD THOUSAND)
TABLE 137 BAHRAIN BUBBLE TEA MARKET, BY NATURE, 2018-2032 (USD THOUSAND)
TABLE 138 BAHRAIN BUBBLE TEA MARKET, BY FLAVOR, 2018-2032 (USD THOUSAND)
TABLE 139 BAHRAIN FRUIT FLAVOUR IN BUBBLE TEA MARKET, BY TYPE, 2018-2032 (USD THOUSAND)
TABLE 140 BAHRAIN BUBBLE TEA MARKET, BY MILK TYPE USED, 2018-2032 (USD THOUSAND)
TABLE 141 BAHRAIN PLANT-BASED IN BUBBLE TEA MARKET, BY SOURCE, 2018-2032 (USD THOUSAND)
TABLE 142 BAHRAIN BUBBLE TEA MARKET, BY DISTRIBUTION CHANNEL, 2018-2032 (USD THOUSAND)
TABLE 143 BAHRAIN STORE BASED RETAILERS IN BUBBLE TEA MARKET, BY TYPE, 2018-2032 (USD THOUSAND)
TABLE 144 BAHRAIN NON-STORE RETAILERS IN BUBBLE TEA MARKET, BY TYPE, 2018-2032 (USD THOUSAND)
List of Figure
FIGURE 1 GCC BUBBLE TEA MARKET
FIGURE 2 GCC BUBBLE TEA MARKET: DATA TRIANGULATION
FIGURE 3 GCC BUBBLE TEA MARKET: DROC ANALYSIS
FIGURE 4 GCC BUBBLE TEA MARKET: GLOBAL VS REGIONAL MARKET ANALYSIS
FIGURE 5 GCC BUBBLE TEA MARKET: COMPANY RESEARCH ANALYSIS
FIGURE 6 GCC BUBBLE TEA MARKET: MULTIVARIATE MODELLING
FIGURE 7 GCC BUBBLE TEA MARKET: INTERVIEW DEMOGRAPHICS
FIGURE 8 GCC BUBBLE TEA MARKET: DBMR MARKET POSITION GRID
FIGURE 9 GCC BUBBLE TEA MARKET: VENDOR SHARE ANALYSIS
FIGURE 10 GCC BUBBLE TEA MARKET: SEGMENTATION
FIGURE 11 EXECUTIVE SUMMARY
FIGURE 12 TWO SEGMENTS COMPRISE THE GCC BUBBLE TEA MARKET, BY PRODUCT TYPE
FIGURE 13 STRATEGIC DECISIONS
FIGURE 14 INCREASING POPULARITY OF BOBA-BASED BEVERAGES IS EXPECTED TO DRIVE THE GCC BUBBLE TEA MARKET IN THE FORECAST PERIOD (2025-2032)
FIGURE 15 THE BUBBLE TEA MIXES & MATERIAL IS EXPECTED TO ACCOUNT FOR THE LARGEST SHARE OF THE GCC BUBBLE TEA MARKET IN 2025 AND 2032
FIGURE 16 IMPORT EXPORT SCENARIO (USD THOUSAND)
FIGURE 17 GCC BUBBLE TEA MARKET, 2024-2032, AVERAGE SELLING PRICE (USD/UNIT)
FIGURE 18 SUPPLY CHAIN ANALYSIS
FIGURE 19 DRIVERS, RESTRAINTS, OPPORTUNITIES, AND CHALLENGES OF THE GCC BUBBLE TEA MARKET
FIGURE 20 LACTOSE INTOLERANCE: GCC COUNTRIES
FIGURE 21 YOUTH ENGAGEMENT ON VARIOUS PLATFORMS IN SAUDI ARABIA
FIGURE 22 GCC BUBBLE TEA MARKET: BY PRODUCT TYPE, 2024
FIGURE 23 GCC BUBBLE TEA MARKET: BY PRODUCT CATEGORY, 2024
FIGURE 24 GCC BUBBLE TEA MARKET: BY KEY TEA TYPE, 2024
FIGURE 25 GCC BUBBLE TEA MARKET: BY NATURE, 2024
FIGURE 26 GCC BUBBLE TEA MARKET: BY FLAVOR, 2024
FIGURE 27 GCC BUBBLE TEA MARKET: BY MILK TYPE USED, 2024
FIGURE 28 GCC BUBBLE TEA MARKET: BY DISTRIBUTION CHANNEL, 2024
FIGURE 29 GCC BUBBLE TEA MARKET: SNAPSHOT (2024)
FIGURE 30 GCC BUBBLE TEA MARKET: COMPANY SHARE 2024 (%)
Gcc Bubble Tea Market, Supply Chain Analysis and Ecosystem Framework
To support market growth and help clients navigate the impact of geopolitical shifts, DBMR has integrated in-depth supply chain analysis into its Gcc Bubble Tea Market research reports. This addition empowers clients to respond effectively to global changes affecting their industries. The supply chain analysis section includes detailed insights such as Gcc Bubble Tea Market consumption and production by country, price trend analysis, the impact of tariffs and geopolitical developments, and import and export trends by country and HSN code. It also highlights major suppliers with data on production capacity and company profiles, as well as key importers and exporters. In addition to research, DBMR offers specialized supply chain consulting services backed by over a decade of experience, providing solutions like supplier discovery, supplier risk assessment, price trend analysis, impact evaluation of inflation and trade route changes, and comprehensive market trend analysis.
Data collection and base year analysis are done using data collection modules with large sample sizes. The stage includes obtaining market information or related data through various sources and strategies. It includes examining and planning all the data acquired from the past in advance. It likewise envelops the examination of information inconsistencies seen across different information sources. The market data is analysed and estimated using market statistical and coherent models. Also, market share analysis and key trend analysis are the major success factors in the market report. To know more, please request an analyst call or drop down your inquiry.
The key research methodology used by DBMR research team is data triangulation which involves data mining, analysis of the impact of data variables on the market and primary (industry expert) validation. Data models include Vendor Positioning Grid, Market Time Line Analysis, Market Overview and Guide, Company Positioning Grid, Patent Analysis, Pricing Analysis, Company Market Share Analysis, Standards of Measurement, Global versus Regional and Vendor Share Analysis. To know more about the research methodology, drop in an inquiry to speak to our industry experts.
Data Bridge Market Research is a leader in advanced formative research. We take pride in servicing our existing and new customers with data and analysis that match and suits their goal. The report can be customized to include price trend analysis of target brands understanding the market for additional countries (ask for the list of countries), clinical trial results data, literature review, refurbished market and product base analysis. Market analysis of target competitors can be analyzed from technology-based analysis to market portfolio strategies. We can add as many competitors that you require data about in the format and data style you are looking for. Our team of analysts can also provide you data in crude raw excel files pivot tables (Fact book) or can assist you in creating presentations from the data sets available in the report.


