
Global Amusement Parks Market
Market Size in USD Billion
 USD
66.20 Billion
USD
91.29 Billion
2024
2032
USD
66.20 Billion
USD
91.29 Billion
2024
2032
| 2025 - 2032 | |
| USD 66.20 Billion | |
| USD 91.29 Billion | |
| % | |
Amusement Parks Market Size
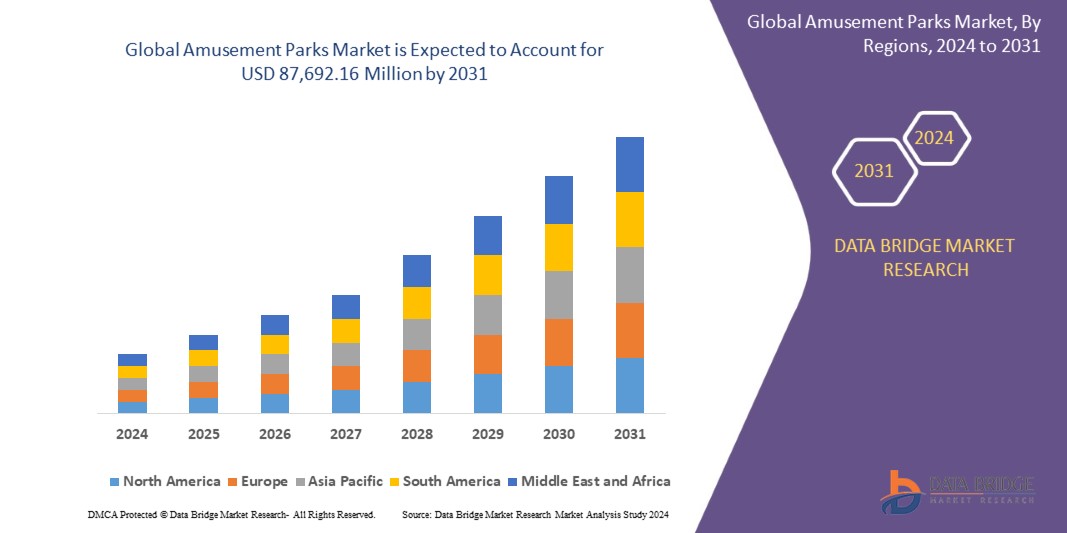
- The global amusement parks market was valued at USD 66.20 billion in 2024 and is expected to reach USD 91.29 billion by 2032
- During the forecast period of 2025 to 2032 the market is likely to grow at a CAGR of 4.10%, primarily driven by expansion of theme-based parks
- This growth is driven by factors such as tourism growth, seasonal events and immersive experiences
Amusement Parks Market Analysis
- Amusement parks are entertainment venues that offer a variety of attractions, including rides, shows, and themed experiences, designed to provide leisure and recreation for visitors. These parks integrate advanced technology, immersive storytelling, and innovative infrastructure to enhance visitor engagement and operational efficiency
- The industry is expanding due to rising disposable income, increasing global tourism, and significant investments in innovative park infrastructure. As demand for experiential entertainment grows, amusement parks are adopting advanced technologies and new attractions to improve visitor satisfaction and drive footfall
- The adoption of AR, VR, AI, and IoT is reshaping amusement parks by enabling personalized experiences, real-time crowd management, and improved operational efficiency
- For instance, Universal Studios has integrated cutting-edge technology into attractions such as Super Nintendo World, enhancing visitor interaction and engagement
- The amusement park market is set for sustained growth, fueled by advancements in themed entertainment, smart park technologies, and sustainability initiatives. Increasing demand for personalized experiences, seamless operations, and eco-friendly attractions will continue to drive market expansion, with operators focusing on innovation to stay competitive
Report Scope and Amusement Parks Market Segmentation
|
Attributes |
Amusement Parks Key Market Insights |
|
Segments Covered |
|
|
Countries Covered |
North America
Europe
Asia-Pacific
Middle East and Africa
South America
|
|
Key Market Players |
|
|
Market Opportunities |
|
|
Value Added Data Infosets |
In addition to the insights on market scenarios such as market value, growth rate, segmentation, geographical coverage, and major players, the market reports curated by the Data Bridge Market Research also include in-depth expert analysis, pricing analysis, brand share analysis, consumer survey, demography analysis, supply chain analysis, value chain analysis, raw material/consumables overview, vendor selection criteria, PESTLE Analysis, Porter Analysis, and regulatory framework. |
Amusement Parks Market Trends
“Increasing Adoption of Intellectual Property (IP)-Based Attractions”
- One prominent trend in the global amusement parks market is the increasing adoption of intellectual property (IP)-based attractions where parks integrate popular franchises from movies, TV shows, and video games to enhance visitor engagement
- This trend is fueled by the growing demand for immersive storytelling and brand-driven experiences, leading entertainment giants to invest in franchise-themed expansions that attract dedicated fan bases
- For instance, Warner Bros has developed The Wizarding World of Harry Potter across multiple locations, offering an authentic, immersive experience with themed rides, shops, and interactive wands
- As consumers seek more personalized and immersive entertainment, theme parks are evolving to provide technology-driven experiences, interactive attractions, and expanded IP-based lands that strengthen visitor loyalty
- This shift is expected to accelerate innovation in theme park design and storytelling, ensuring long-term growth and sustained visitor interest in an increasingly competitive market
Amusement Parks Market Dynamics
Driver
“Rising Global Tourism Growth”
- The rising global tourism industry is a key driver of growth in the amusement parks market. As international travel rebounds and more countries position themselves as entertainment destinations, theme parks are seeing increased visitor numbers and higher revenue potential
- This trend is particularly evident in regions such as North America, Europe, and Asia-Pacific, where governments and private investors are heavily funding tourism infrastructure, including large-scale amusement parks and entertainment hubs
- With international tourists seeking unique and culturally immersive experiences, amusement parks are expanding their offerings with region-specific themes, attractions based on global franchises, and integrated resort-style entertainment complexes to attract visitors from diverse backgrounds
- The growing demand for destination tourism has led to significant investments in amusement parks near major travel hubs, resort cities, and urban centers, making them accessible to international tourists
- As tourism continues to be a major economic driver, amusement parks are leveraging this growth by offering customized travel packages, partnerships with airlines and hotels, and exclusive visitor experiences to boost attendance and revenue
For instance,
- Dubai Parks and Resorts has become a major tourist attraction, offering international visitors experiences across Motiongate Dubai, Bollywood Parks, and Legoland Dubai
- Universal Beijing Resort was developed to capitalize on the increasing inbound and outbound tourism in China, offering globally recognized attractions tailored to the Asian market
- With increasing investments in global tourism infrastructure and the rise of travel-focused amusement park experiences, the industry will continue to see sustained growth, driving innovation, expansion, and enhanced visitor engagement worldwide
Opportunity
“Strategic Partnerships & Franchise Collaborations”
- The increasing collaboration between amusement park operators and global entertainment franchises presents a significant opportunity for market expansion. By leveraging well-known brands, amusement parks can enhance visitor engagement, drive merchandise sales, and create exclusive attractions that cater to dedicated fan bases
- Entertainment giants such as Disney, Universal Studios, and Warner Bros. are forming strategic alliances with film studios, video game companies, and streaming platforms to develop immersive, franchise-driven experiences
- Parks are also partnering with travel agencies, airlines, and hospitality brands to create bundled experiences, including travel packages, resort stays, and exclusive park events. These partnerships boost ticket sales, extend visitor stays, and increase overall revenue generation
For instance,
- Disney’s collaboration with Lucasfilm resulted in the successful launch of Star Wars: Galaxy’s Edge, offering visitors a fully immersive experience in the Star Wars universe
- Six Flags collaborates with DC Comics to develop superhero-themed roller coasters and attractions, leveraging the popularity of characters such as Batman, Superman, and Wonder Woman
- As the demand for exclusive, story-driven experiences continues to grow, strategic partnerships and franchise collaborations present a major opportunity for amusement parks to differentiate themselves, attract global audiences, and drive long-term revenue growth
Restraint/Challenge
“High Development and Operational Costs”
- The high costs associated with developing and maintaining amusement parks pose a significant challenge for operators. Building large-scale theme parks requires substantial investments in land acquisition, infrastructure, attractions, and technology, often amounting to billions of dollars
- The ongoing operational expenses, including staff wages, ride maintenance, utilities, and safety compliance, further add to the financial burden. Parks must also continuously invest in new attractions, themed expansions, and technology upgrades to remain competitive, increasing long-term costs
- Rising construction material prices, regulatory requirements, and environmental compliance costs further challenge park operators, particularly in regions with strict zoning laws and sustainability mandates
For instance,
- Shanghai Disney Resort, which opened in 2016, reportedly cost over USD 5.5 billion to develop. Continuous expansions, such as Toy Story Land (2018) and the upcoming Zootopia-themed land, require additional investments, highlighting the long-term financial commitment needed to sustain large-scale amusement parks
- As development and operational costs continue to rise, amusement park operators must find ways to optimize expenses, secure long-term financing, and maximize revenue streams to sustain profitability while maintaining world-class attractions
Amusement Parks Market Scope
The market is segmented on the basis of type, rides, gender, age group, and revenue sources.
|
Segmentation |
Sub-Segmentation |
|
By Type |
|
|
By Rides |
|
|
By Gender |
|
|
By Age Group
|
|
|
By Revenue Sources |
|
Amusement Parks Market Regional Analysis
“North America is the Dominant Region in the Amusement Parks Market”
- North America dominates the Amusement Parks market, driven by the presence of world-renowned theme park operators, particularly in the U.S. and Canada, which continue to set industry standards in innovation, attraction development, and visitor experiences
- The U.S. holds a significant share due to its high disposable income, strong tourism industry, and culture of family entertainment that supports steady visitor growth
- The region's extensive theme park infrastructure, including major parks such as Walt Disney World, Disneyland, Universal Studios, and Six Flags, continues to expand with new rides, immersive attractions, and resort developments that reinforce North America's leadership position
- In addition, the adoption of advanced technology, such as virtual reality (VR), augmented reality (AR), and AI-driven guest experiences, is further enhancing visitor engagement and operational efficiency, solidifying North America as the leading region in the amusement parks market
“Asia-Pacific is Projected to Register the Highest Growth Rate”
- The Asia-Pacific region is expected to witness the highest growth rate in the Amusement Parks market, driven by rising urbanization, increasing disposable incomes, and strong government support for tourism development
- Countries such as China, India, Japan, and South Korea are witnessing a surge in amusement park investments, with new theme parks and resort-style attractions being developed to cater to the growing middle class and international tourists
- The expansion of major global operators in the region, such as Disney (Shanghai Disney Resort, Hong Kong Disneyland), Universal Studios (Beijing), and local brands such as Chimelong and Fantawild, is further fueling market growth
- In addition, the increasing adoption of cutting-edge technologies, including AI-powered attractions, digital ticketing, and smart park management systems, is enhancing visitor experiences and operational efficiency, making Asia-Pacific the fastest-growing market for amusement parks
Amusement Parks Market Share
The market competitive landscape provides details by competitor. Details included are company overview, company financials, revenue generated, market potential, investment in research and development, new market initiatives, global presence, production sites and facilities, production capacities, company strengths and weaknesses, product launch, product width and breadth, application dominance. The above data points provided are only related to the companies' focus related to market.
The Major Market Leaders Operating in the Market Are:
- Disney (U.S.)
- Universal Studios (U.S.)
- Merlin Entertainments (U.K.)
- SeaWorld Parks & Entertainment, Inc. (U.S.)
- Six Flags Entertainment Corporation (U.S.)
- The LEGO Group (Denmark)
- Samsung C&T Corporation. (South Korea)
- LOTTEWORLD (South Korea)
- Resorts World at Sentosa Pte. Ltd. (Singapore)
- IMG Worlds of Adventure (U.A.E.)
- Coast Entertainment Holdings Limited (Australia)
- NAGASHIMA RESORT (Japan)
Latest Developments in Global Amusement Parks Market
- In November 2023, Disney Cruise Line launched a new cruise terminal at Port Everglades and announced fresh community investments in Junior Achievement South Florida and the Boys & Girls Clubs of Broward County. These strategic partnerships highlight the vital role of community-driven initiatives, emphasizing Disney Cruise Line's commitment to empowering youth beyond financial contributions. The collaboration also creates opportunities for Disney Cruise Line cast and crew, both on land and at sea, to actively volunteer, mentor, and engage with local students through educational programs
- In November 2023, Disney unveiled its 'Zootopia' themed land in China. The new attraction, featuring rides and restaurants, is part of Disney's USD 60 billion investment in global theme parks and resorts. The move aims to capitalize on China's growing appetite for domestic travel. Among the highlights is the thrilling 'Hot Pursuit' ride, where visitors join Officer Judy Hopps and Nick Wilde on a police chase to rescue kidnapped pop star Gazelle at Shanghai Disneyland Resort
SKU-

- Interactive Data Analysis Dashboard
- Company Analysis Dashboard for high growth potential opportunities
- Research Analyst Access for customization & queries
- Competitor Analysis with Interactive dashboard
- Latest News, Updates & Trend analysis
- Harness the Power of Benchmark Analysis for Comprehensive Competitor Tracking
Data collection and base year analysis are done using data collection modules with large sample sizes. The stage includes obtaining market information or related data through various sources and strategies. It includes examining and planning all the data acquired from the past in advance. It likewise envelops the examination of information inconsistencies seen across different information sources. The market data is analysed and estimated using market statistical and coherent models. Also, market share analysis and key trend analysis are the major success factors in the market report. To know more, please request an analyst call or drop down your inquiry.
The key research methodology used by DBMR research team is data triangulation which involves data mining, analysis of the impact of data variables on the market and primary (industry expert) validation. Data models include Vendor Positioning Grid, Market Time Line Analysis, Market Overview and Guide, Company Positioning Grid, Patent Analysis, Pricing Analysis, Company Market Share Analysis, Standards of Measurement, Global versus Regional and Vendor Share Analysis. To know more about the research methodology, drop in an inquiry to speak to our industry experts.
Data Bridge Market Research is a leader in advanced formative research. We take pride in servicing our existing and new customers with data and analysis that match and suits their goal. The report can be customized to include price trend analysis of target brands understanding the market for additional countries (ask for the list of countries), clinical trial results data, literature review, refurbished market and product base analysis. Market analysis of target competitors can be analyzed from technology-based analysis to market portfolio strategies. We can add as many competitors that you require data about in the format and data style you are looking for. Our team of analysts can also provide you data in crude raw excel files pivot tables (Fact book) or can assist you in creating presentations from the data sets available in the report.


