
Market Analysis and Insights Global Baricitinib Market
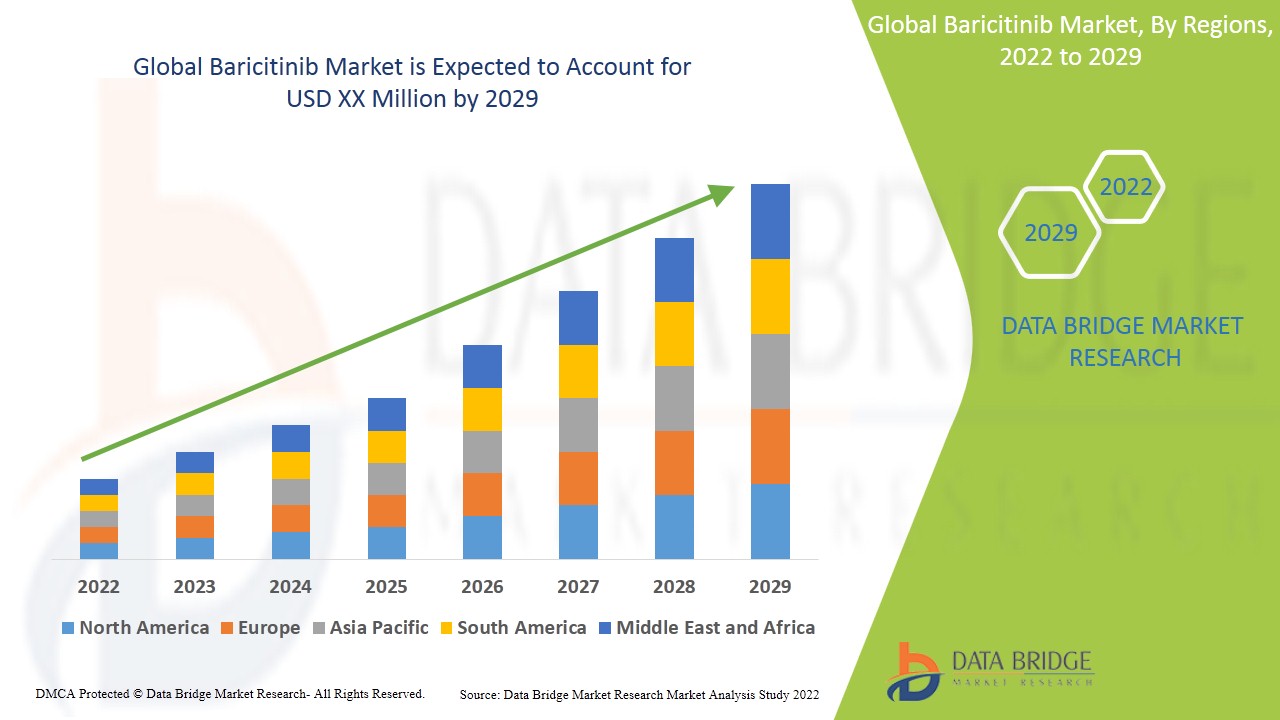
The baricitinib market is expected to witness market growth at a rate of 11.90% in the forecast period of 2022 to 2029. Data Bridge Market Research report on baricitinib market provides analysis and insights regarding the various factors expected to be prevalent throughout the forecast period while providing their impacts on the market’s growth. The rise in healthcare sector globally is escalating the growth of baricitinib market.
Baricitinib refers to orally-administered, small-molecule, janus-associated kinase (JAK) inhibitor that is widely utilized for the treatment of rheumatoid arthritis (RA), systemic lupus erythematosus and atopic dermatitis.
The rise in prevalence of rheumatoid arthritis across the globe acts as one of the major factors driving the growth of baricitinib market. The surge in the number of approval and uptake of premium- priced targeted therapies and increase in clinical trials for the enhancement of various therapies accelerate the market growth. The rise in company collaborations among manufacturers to develop new drugs and increase in the prevalence of disease such as rheumatoid arthritis (RA), systemic lupus erythematosus and atopic dermatitis among population further influence the market. Additionally, change in lifestyle, development in the biotechnology sector, rise in healthcare expenditure, change in lifestyle and development of technology offering therapies for treatment positively affect the baricitinib market. Furthermore, developments in the drugs extend profitable opportunities to the market players in the forecast period of 2022 to 2029.
On the other hand, availability of various classes of drugs is expected to obstruct the market growth. Low awareness among people is projected to challenge the baricitinib market in the forecast period of 2022-2029.
This baricitinib market report provides details of new recent developments, trade regulations, import export analysis, production analysis, value chain optimization, market share, impact of domestic and localized market players, analyses opportunities in terms of emerging revenue pockets, changes in market regulations, strategic market growth analysis, market size, category market growths, application niches and dominance, product approvals, product launches, geographic expansions, technological innovations in the market. To gain more info on baricitinib market contact Data Bridge Market Research for an Analyst Brief, our team will help you take an informed market decision to achieve market growth.
Global Baricitinib Market Scope and Market Size
The baricitinib market is segmented on the basis of drug class, end-users and distribution channel. The growth among segments helps you analyze niche pockets of growth and strategies to approach the market and determine your core application areas and the difference in your target markets.
- On the basis of drug classification, the baricitinib market is segmented into DMARDs and JAK Inhibitors.
- On the basis of end- users, the baricitinib market is segmented into hospitals, homecare, specialty clinics, ambulatory surgical centers and others.
- On the basis of distribution channel, the baricitinib market is segmented into hospital pharmacy, retail pharmacy and online pharmacy.
Baricitinib Market Country Level Analysis
The baricitinib market is segmented on the basis of drug class, end-users and distribution channel.
The countries covered in the global baricitinib market report are U.S., Canada and Mexico in North America, Peru, Brazil, Argentina and Rest of South America as part of South America, Germany, Italy, U.K., France, Spain, Netherlands, Belgium, Switzerland, Turkey, Russia, Hungary, Lithuania, Austria, Ireland, Norway, Poland, Rest of Europe in Europe, Japan, China, India, South Korea, Australia, Singapore, Malaysia, Thailand, Indonesia, Philippines, Vietnam, Rest of Asia-Pacific (APAC) in Asia-Pacific (APAC), South Africa, Saudi Arabia, U.A.E, Kuwait, Israel, Egypt, Rest of Middle East and Africa (MEA) as a part of Middle East and Africa (MEA).
North America dominates the baricitinib market due to the presence of developed healthcare system within the region. Asia-Pacific is expected to witness high growth during the forecast period of 2022 to 2029 because of the large population in the region.
The country section of the report also provides individual market impacting factors and changes in regulation in the market domestically that impacts the current and future trends of the market. Data points such as new sales, replacement sales, country demographics, disease epidemiology and import-export tariffs are some of the major pointers used to forecast the market scenario for individual countries. Also, presence and availability of global brands and their challenges faced due to large or scarce competition from local and domestic brands, impact of sales channels are considered while providing forecast analysis of the country data.
Patient Epidemiology Analysis
The baricitinib market also provides you with detailed market analysis for patient analysis, prognosis and cures. Prevalence, incidence, mortality, adherence rates are some of the data variables that are available in the report. Direct or indirect impact analysis of epidemiology to market growth are analyzed to create a more robust and cohort multivariate statistical model for forecasting the market in the growth period.
Competitive Landscape and Baricitinib Market Share Analysis
The baricitinib market competitive landscape provides details by competitor. Details included are company overview, company financials, revenue generated, market potential, investment in research and development, new market initiatives, global presence, production sites and facilities, production capacities, company strengths and weaknesses, product launch, product width and breadth, application dominance. The above data points provided are only related to the companies’ focus related baricitinib market.
Some of the major players operating in the baricitinib market report are AbbVie Inc., Pfizer Inc., Galapagos NV, Gilead Sciences, Inc., Theravance Biopharma, Incyte Corporation, Eli Lilly and Company, CTI BioPharma Corp, Sierra Oncology, Inc., Novartis AG, Sanofi, CELGENE CORPORATION, Vertex Pharmaceuticals Incorporated, Astellas Pharma Inc., Amneal Pharmaceuticals LLC, AstraZeneca, Aclaris Therapeutics, Inc., BIOCRYST PHARMACEUTICALS, INC, Biogen, Portola Pharmaceuticals, Inc., and Reistone Biopharma, among others.
SKU-

- Interactive Data Analysis Dashboard
- Company Analysis Dashboard for high growth potential opportunities
- Research Analyst Access for customization & queries
- Competitor Analysis with Interactive dashboard
- Latest News, Updates & Trend analysis
- Harness the Power of Benchmark Analysis for Comprehensive Competitor Tracking
Table of Content
1 INTRODUCTION
1.1 OBJECTIVES OF THE STUDY
1.2 MARKET DEFINITION
1.3 OVERVIEW OF GLOBAL BARICITINIB MARKET
1.4 CURRENCY AND PRICING
1.5 LIMITATION
1.6 MARKETS COVERED
2 MARKET SEGMENTATION
2.1 KEY TAKEAWAYS
2.2 ARRIVING AT THE GLOBAL BARICITINIB MARKET
2.2.1 VENDOR POSITIONING GRID
2.2.2 TECHNOLOGY LIFE LINE CURVE
2.2.3 TRIPOD DATA VALIDATION MODEL
2.2.4 MARKET GUIDE
2.2.5 MULTIVARIATE MODELLING
2.2.6 TOP TO BOTTOM ANALYSIS
2.2.7 CHALLENGE MATRIX
2.2.8 APPLICATION COVERAGE GRID
2.2.9 STANDARDS OF MEASUREMENT
2.2.10 VENDOR SHARE ANALYSIS
2.2.11 SALES VOLUME DATA
2.2.12 DATA POINTS FROM KEY PRIMARY INTERVIEWS
2.2.13 DATA POINTS FROM KEY SECONDARY DATABASES
2.3 GLOBAL BARICITINIB MARKET: RESEARCH SNAPSHOT
2.4 ASSUMPTIONS
3 MARKET OVERVIEW
3.1 DRIVERS
3.2 RESTRAINTS
3.3 OPPORTUNITIES
3.4 CHALLENGES
4 EXECUTIVE SUMMARY
5 PREMIUM INSIGHTS
5.1 PESTEL ANALYSIS
5.2 PORTER’S FIVE FORCES MODEL
6 INDUSTRY INSIGHTS
6.1 MICRO AND MACRO ECONOMIC FACTORS
6.2 PENETRATION AND GROWTH PROSPECT MAPPING
6.3 KEY PRICING STRATEGIES
6.4 INTERVIEWS WITH SPECIALIST
6.5 ANALYIS AND RECOMMENDATION
7 INTELLECTUAL PROPERTY (IP) PORTFOLIO
7.1 PATENT QUALITY AND STRENGTH
7.2 PATENT FAMILIES
7.3 LICENSING AND COLLABORATIONS
7.4 COMPETITIVE LANDSCAPE
7.5 IP STRATEGY AND MANAGEMENT
7.6 OTHER
8 COST ANALYSIS BREAKDOWN
9 TECHNONLOGY ROADMAP
10 INNOVATION TRACKER AND STRATEGIC ANALYSIS
10.1 MAJOR DEALS AND STRATEGIC ALLIANCES ANALYSIS
10.1.1 JOINT VENTURES
10.1.2 MERGERS AND ACQUISITIONS
10.1.3 LICENSING AND PARTNERSHIP
10.1.4 TECHNOLOGY COLLABORATIONS
10.1.5 STRATEGIC DIVESTMENTS
10.2 NUMBER OF PRODUCTS IN DEVELOPMENT
10.3 STAGE OF DEVELOPMENT
10.4 TIMELINES AND MILESTONES
10.5 INNOVATION STRATEGIES AND METHODOLOGIES
10.6 RISK ASSESSMENT AND MITIGATION
10.7 MERGERS AND ACQUISITIONS
10.8 FUTURE OUTLOOK
11 REGULATORY COMPLIANCE
11.1 REGULATORY AUTHORITIES
11.2 REGULATORY CLASSIFICATIONS
11.3 REGULATORY SUBMISSIONS
11.4 INTERNATIONAL HARMONIZATION
11.5 COMPLIANCE AND QUALITY MANAGEMENT SYSTEMS
11.6 REGULATORY CHALLENGES AND STRATEGIES
12 PIPELINE ANALYSIS
12.1 CLINICAL TRIALS AND PHASE ANALYSIS
12.2 DRUG THERAPY PIPELINE
12.3 PHASE III CANDIDATES
12.4 PHASE II CANDIDATES
12.5 PHASE I CANDIDATES
12.6 OTHERS (PRE-CLINICAL AND RESEARCH)
TABLE 1 CLINICAL TRIAL DATA FOR GLOBAL BARICITINIB MARKET
Company Name Product Name
XX XX
XX XX
XX XX
XX XX
XX XX
XX XX
XX XX
Sources: Press Releases, Annual Reports, SEC Filings, Investor Presentations, Other Government Sources, Analysis Based on Inputs from Secondary, Expert Interviews
TABLE 2 DISTRIBUTION OF PRODUCTS AND PROJECTS BY PHASE GLOBAL BARICITINIB MARKET
Phase Number of Projects
Preclinical/Research Projects XX
Clinical Development XX
Phase I XX
Phase II XX
Phase III XX
U.S. Filed/Approved but Not Yet Marketed XX
Total XX
Sources: Press Releases, Annual Reports, SEC Filings, Investor Presentations, Other Government Sources, Analysis Based on Inputs from Secondary, Expert Interviews
TABLE 3 DISTRIBUTION OF PROJECTS BY SCIENTIFIC APPROACH AND PHASE FOR GLOBAL BARICITINIB MARKET
Technology Preclinical/ Research Project
XX XX
XX XX
XX XX
XX XX
XX XX
Total Projects XX
Sources: Press Releases, Annual Reports, SEC Filings, Investor Presentations, Other Government Sources, Analysis Based on Inputs from Secondary, Expert Interviews
FIGURE 1 TOP ENTITIES BASED ON R&D GLANCE FOR GLOBAL BARICITINIB MARKET
Sources: Press Releases, Annual Reports, SEC Filings, Investor Presentations, Other Government Sources, Analysis Based on Inputs from Secondary, Expert Interviews
13 REIMBURSEMENT FRAMEWORK
14 OPPUTUNITY MAP ANALYSIS
15 VALUE CHAIN ANALYSIS
16 HEALTHCARE ECONOMY
16.1 HEALTHCARE EXPENDITURE
16.2 CAPITAL EXPENDITURE
16.3 CAPEX TRENDS
16.4 CAPEX ALLOCATION
16.5 FUNDING SOURCES
16.6 INDUSTRY BENCHMARKS
16.7 GDP RATION IN OVERALL GDP
16.8 HEALTHCARE SYSTEM STRUCTURE
16.9 GOVERNMENT POLICIES
16.1 ECONOMIC DEVELOPMENT
17 GLOBAL BARICITINIB MARKET, BY DOSAGE FORM
17.1 OVERVIEW
17.2 1 MG TABLETS
17.3 2 MG TABLETS
17.4 4 MG TABLETS
18 GLOBAL BARICITINIB MARKET, BY APPLICATION
18.1 OVERVIEW
18.2 RHEUMATOID ARTHRITIS
18.2.1 MODERATE TO SEVERE RHEUMATOID ARTHRITIS
18.2.2 REFRACTORY RHEUMATOID ARTHRITIS
18.3 ALOPECIA AREATA
18.3.1 MODERATE ALOPECIA AREATA
18.3.2 SEVERE ALOPECIA AREATA
18.4 COVID-19
18.5 OTHERS
19 GLOBAL BARICITINIB MARKET, BY AGE GROUP
19.1 OVERVIEW
19.2 PEDIATRIC
19.3 ADULTS
19.4 GERIATRIC
20 GLOBAL BARICITINIB MARKET, BY END USERS
20.1 OVERVIEW
20.2 HOSPITALS
20.2.1 IN-PATIENT
20.2.2 OUT-PATIENT
20.3 SPECIALTY CLINICS
20.4 HOMECARE
20.5 OTHERS
21 GLOBAL BARICITINIB MARKET, BY DISTRIBUTION CHANNEL
21.1 OVERVIEW
21.2 HOSPITAL PHARMACIES
21.3 RETAIL PHARMACIES
21.4 ONLINE PHARMACIES
21.5 SPECIALTY PHARMACIES
21.6 OTHERS
22 GLOBAL BARICITINIB MARKET MARKET, BY GEOGRAPHY
GLOBAL BARICITINIB MARKET (ALL SEGMENTATION PROVIDED ABOVE IS REPRESENTED IN THIS CHAPTER BY COUNTRY)
22.1 NORTH AMERICA
22.1.1 U.S.
22.1.2 CANADA
22.1.3 MEXICO
22.2 EUROPE
22.2.1 GERMANY
22.2.2 FRANCE
22.2.3 U.K.
22.2.4 ITALY
22.2.5 SPAIN
22.2.6 RUSSIA
22.2.7 TURKEY
22.2.8 BELGIUM
22.2.9 NETHERLANDS
22.2.10 SWITZERLAND
22.2.11 REST OF EUROPE
22.3 ASIA-PACIFIC
22.3.1 JAPAN
22.3.2 CHINA
22.3.3 SOUTH KOREA
22.3.4 INDIA
22.3.5 AUSTRALIA
22.3.6 SINGAPORE
22.3.7 THAILAND
22.3.8 MALAYSIA
22.3.9 INDONESIA
22.3.10 PHILIPPINES
22.3.11 REST OF ASIA-PACIFIC
22.4 SOUTH AMERICA
22.4.1 BRAZIL
22.4.2 ARGENTINA
22.4.3 PERU
22.4.4 CHILE
22.4.5 COLOMBIA
22.4.6 VENEZUELA
22.4.7 REST OF SOUTH AMERICA
22.5 MIDDLE EAST AND AFRICA
22.5.1 SOUTH AFRICA
22.5.2 SAUDI ARABIA
22.5.3 UAE
22.5.4 EGYPT
22.5.5 ISRAEL
22.5.6 REST OF MIDDLE EAST AND AFRICA
22.6 KEY PRIMARY INSIGHTS: BY MAJOR COUNTRIES
23 GLOBAL BARICITINIB MARKET- COMPANY LANDSCAPE
23.1 COMPANY SHARE ANALYSIS: GLOBAL
23.2 COMPANY SHARE ANALYSIS: NORTH AMERICA
23.3 COMPANY SHARE ANALYSIS: EUROPE
23.4 COMPANY SHARE ANALYSIS: ASIA-PACIFIC
23.5 MERGERS & ACQUISITIONS
23.6 NEW PRODUCT DEVELOPMENT & APPROVALS
23.7 EXPANSIONS
23.8 REGULATORY CHANGES
23.9 PARTNERSHIP AND OTHER STRATEGIC DEVELOPMENTS
24 GLOBAL BARICITINIB MARKET- MARKET, SWOT AND DBMR ANALYSIS
25 GLOBAL BARICITINIB MARKET, COMPANY PROFILE
25.1 ELI LILLY AND COMPANY
25.1.1 COMPANY OVERVIEW
25.1.2 REVENUE ANALYSIS
25.1.3 GEOGRAPHIC PRESENCE
25.1.4 PRODUCT PORTFOLIO
25.1.5 RECENT DEVELOPEMENTS
25.2 INCYTE CORPORATION
25.2.1 COMPANY OVERVIEW
25.2.2 REVENUE ANALYSIS
25.2.3 GEOGRAPHIC PRESENCE
25.2.4 PRODUCT PORTFOLIO
25.2.5 RECENT DEVELOPEMENTS
25.3 PFIZER INC.
25.3.1 COMPANY OVERVIEW
25.3.2 REVENUE ANALYSIS
25.3.3 GEOGRAPHIC PRESENCE
25.3.4 PRODUCT PORTFOLIO
25.3.5 RECENT DEVELOPEMENTS
25.4 ABBVIE INC.
25.4.1 COMPANY OVERVIEW
25.4.2 REVENUE ANALYSIS
25.4.3 GEOGRAPHIC PRESENCE
25.4.4 PRODUCT PORTFOLIO
25.4.5 RECENT DEVELOPEMENTS
25.5 NOVARTIS INTERNATIONAL
25.5.1 COMPANY OVERVIEW
25.5.2 REVENUE ANALYSIS
25.5.3 GEOGRAPHIC PRESENCE
25.5.4 PRODUCT PORTFOLIO
25.5.5 RECENT DEVELOPEMENTS
25.6 CIPLA
25.6.1 COMPANY OVERVIEW
25.6.2 REVENUE ANALYSIS
25.6.3 GEOGRAPHIC PRESENCE
25.6.4 PRODUCT PORTFOLIO
25.6.5 RECENT DEVELOPEMENTS
25.7 SUN PHARMACEUTICAL INDUSTRIES LTD.
25.7.1 COMPANY OVERVIEW
25.7.2 REVENUE ANALYSIS
25.7.3 GEOGRAPHIC PRESENCE
25.7.4 PRODUCT PORTFOLIO
25.7.5 RECENT DEVELOPEMENTS
25.8 AUROBINDO PHARMA
25.8.1 COMPANY OVERVIEW
25.8.2 REVENUE ANALYSIS
25.8.3 GEOGRAPHIC PRESENCE
25.8.4 PRODUCT PORTFOLIO
25.8.5 RECENT DEVELOPEMENTS
25.9 TEVA PHARMACEUTICAL INDUSTRIES LTD.
25.9.1 COMPANY OVERVIEW
25.9.2 REVENUE ANALYSIS
25.9.3 GEOGRAPHIC PRESENCE
25.9.4 PRODUCT PORTFOLIO
25.9.5 RECENT DEVELOPEMENTS
25.1 DR REDDY'S LABORATORIES LTD
25.10.1 COMPANY OVERVIEW
25.10.2 REVENUE ANALYSIS
25.10.3 GEOGRAPHIC PRESENCE
25.10.4 PRODUCT PORTFOLIO
25.10.5 RECENT DEVELOPEMENTS
25.11 NATCO PHARMA LTD
25.11.1 COMPANY OVERVIEW
25.11.2 REVENUE ANALYSIS
25.11.3 GEOGRAPHIC PRESENCE
25.11.4 PRODUCT PORTFOLIO
25.11.5 RECENT DEVELOPEMENTS
25.12 TORRENT PHARMACEUTICALS LTD
25.12.1 COMPANY OVERVIEW
25.12.2 REVENUE ANALYSIS
25.12.3 GEOGRAPHIC PRESENCE
25.12.4 PRODUCT PORTFOLIO
25.12.5 RECENT DEVELOPEMENTS
25.13 MANKIND PHARMA LTD
25.13.1 COMPANY OVERVIEW
25.13.2 REVENUE ANALYSIS
25.13.3 GEOGRAPHIC PRESENCE
25.13.4 PRODUCT PORTFOLIO
25.13.5 RECENT DEVELOPEMENTS
26 CONCLUSION
27 QUESTIONNAIRE
28 ABOUT DATA BRIDGE MARKET RESEARCH
Data collection and base year analysis are done using data collection modules with large sample sizes. The stage includes obtaining market information or related data through various sources and strategies. It includes examining and planning all the data acquired from the past in advance. It likewise envelops the examination of information inconsistencies seen across different information sources. The market data is analysed and estimated using market statistical and coherent models. Also, market share analysis and key trend analysis are the major success factors in the market report. To know more, please request an analyst call or drop down your inquiry.
The key research methodology used by DBMR research team is data triangulation which involves data mining, analysis of the impact of data variables on the market and primary (industry expert) validation. Data models include Vendor Positioning Grid, Market Time Line Analysis, Market Overview and Guide, Company Positioning Grid, Patent Analysis, Pricing Analysis, Company Market Share Analysis, Standards of Measurement, Global versus Regional and Vendor Share Analysis. To know more about the research methodology, drop in an inquiry to speak to our industry experts.
Data Bridge Market Research is a leader in advanced formative research. We take pride in servicing our existing and new customers with data and analysis that match and suits their goal. The report can be customized to include price trend analysis of target brands understanding the market for additional countries (ask for the list of countries), clinical trial results data, literature review, refurbished market and product base analysis. Market analysis of target competitors can be analyzed from technology-based analysis to market portfolio strategies. We can add as many competitors that you require data about in the format and data style you are looking for. Our team of analysts can also provide you data in crude raw excel files pivot tables (Fact book) or can assist you in creating presentations from the data sets available in the report.


