
Market Analysis and Insights of Bus Public Transport Market
Data Bridge Market Research analyses that the bus public transport market would exhibit a CAGR of 8.30% for the forecast period of 2022-2029. Growing demand for public transportation systems especially in the developing economies, increased adoption of advanced automotive manufacturing technologies, growth and expansion of automotive industry especially in the developing economies and rising level of investment by the major market players for more innovation are the major factors attributable to the growth of bus public transport market.
Buses are a public mode of transportation that are used to save costs, fuel and reduce the environmental impact of harmful gas and emissions. Buses can transport a large number of passengers from one place to another.
Growth in the level of investments for research and development activities, growing awareness about the benefits of public transportations and upsurge in the public and private partnership for the development of automotive infrastructure will foster in growth in the market value. Rising application of this advanced technology in the commercial vehicles and stringent environmental regulations imposed by the government will also create lucrative growth opportunities for the market. Growing need of customised solutions for public transport vehicles, surging rate of manufacturing of commercial and passenger vehicles, rising prevalence of intelligent transport system and increasing passenger population will also foster the market growth.
However, lack of technological expertise in the developing and underdeveloped economies will pose a major challenge to the market growth rate. High costs involved with technological innovations and research and development proficiencies, increasing need of high capital investment and dearth of required advanced infrastructural facilities in the underdeveloped regions will hamper the market growth rate. Further, negative impact of COVID-19 will also restrict the scope of growth for the market.
This bus public transport market report provides details of new recent developments, trade regulations, import export analysis, production analysis, value chain optimization, market share, impact of domestic and localised market players, analyses opportunities in terms of emerging revenue pockets, changes in market regulations, strategic market growth analysis, market size, category market growths, application niches and dominance, product approvals, product launches, geographic expansions, technological innovations in the market. To gain more info on bus public transport market contact Data Bridge Market Research for an Analyst Brief, our team will help you take an informed market decision to achieve market growth.
Global Bus Public Transport Market Scope and Market Size
The global bus public transport market is segmented on the basis of application, length, seating capacity, fuel type, body type and locality. The growth amongst these segments will help you analyse meagre growth segments in the industries, and provide the users with valuable market overview and market insights to help them in making strategic decisions for identification of core market applications.
- Bus public transport market on the basis of application has been segmented as motor coaches, transit buses, and school buses.
- Based on length, the bus public transport market has been segmented into 6-8 m, 9-12 m, and above 12 m.
- On the basis of seating capacity, the bus public transport market has been segmented into up to 30 seater, 31-40-seater, and above 40 seater.
- On the basis of fuel type, the bus public transport market has been segmented into diesel, petrol/gasoline, compressed natural gas, electric and hybrid.
- Based on body type, the bus public transport market has been segmented into fully built, and customizable.
- Bus public transport has also been segmented on the basis of locality into city, and rural.
Bus Public Transport Market Country Level Analysis
The global bus public transport market is segmented on the basis of application, length, seating capacity, fuel type, body type and locality.
The countries covered in the bus public transport market report are U.S., Canada and Mexico in North America, Brazil, Argentina and Rest of South America as part of South America, Germany, Italy, U.K., France, Spain, Netherlands, Belgium, Switzerland, Turkey, Russia, Rest of Europe in Europe, Japan, China, India, South Korea, Australia, Singapore, Malaysia, Thailand, Indonesia, Philippines, Rest of Asia-Pacific (APAC) in Asia-Pacific (APAC), South Africa, Saudi Arabia, U.A.E, Israel, Egypt, Rest of Middle East and Africa (MEA) as a part of Middle East and Africa (MEA).
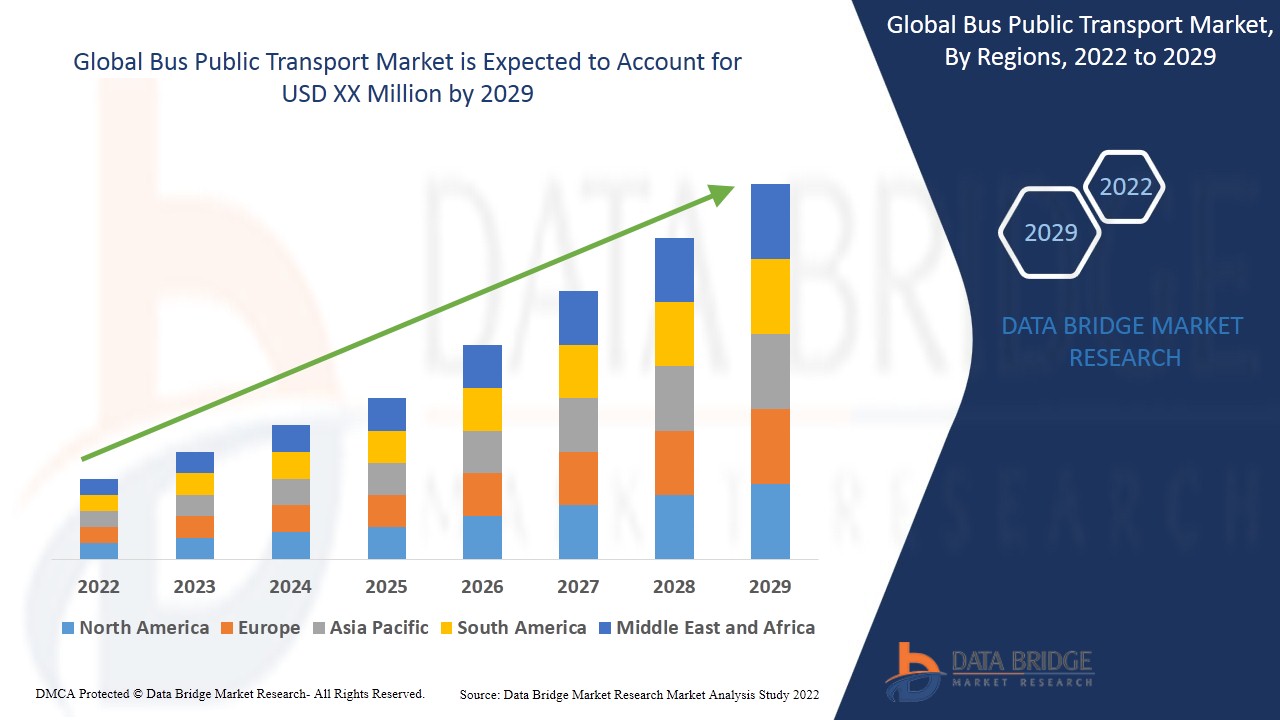
Asia-Pacific region dominates the bus public transport market and will continue to flourish its trend of dominance during the forecast period owing to the surging demand for passenger vehicles, growing investment by the government for the development of transport infrastructure, surging focus towards the integration of passenger safety systems in both commercial and passenger vehicles, rising disposable income of the people in India and China, growing urbanization and industrialisation and growth and expansion of automotive industry in this region.
The country section of the bus public transport market report also provides individual market impacting factors and changes in regulation in the market domestically that impacts the current and future trends of the market. Data points such as consumption volumes, production sites and volumes, import export analysis, price trend analysis, cost of raw materials, down-stream and upstream value chain analysis are some of the major pointers used to forecast the market scenario for individual countries. Also, presence and availability of global brands and their challenges faced due to large or scarce competition from local and domestic brands, impact of sales channels are considered while providing forecast analysis of the country data.
Competitive Landscape and Bus Public Transport Market Share Analysis
The bus public transport market competitive landscape provides details by competitor. Details included are company overview, company financials, revenue generated, market potential, investment in research and development, new market initiatives, global presence, production sites and facilities, production capacities, company strengths and weaknesses, product launch, product width and breadth, application dominance. The above data points provided are only related to the companies’ focus related to bus public transport market.
Some of the major players operating in bus public transport market are YUTONG, AB Volvo, Scania, Tata Motors., SML ISUZU, Hino Motors, Ltd., MAN, Marcopolo SA, Mercedes-Benz Group AG., CNH Industrial N.V., ASHOK LEYLAND, Yutong Bus, TRATON GROUP, Alexander Dennis Limited (ADL) and Robert Bosch GmbH among others.
SKU-

- Interactive Data Analysis Dashboard
- Company Analysis Dashboard for high growth potential opportunities
- Research Analyst Access for customization & queries
- Competitor Analysis with Interactive dashboard
- Latest News, Updates & Trend analysis
- Harness the Power of Benchmark Analysis for Comprehensive Competitor Tracking
Table of Content
1 INTRODUCTION
1.1 OBJECTIVES OF THE STUDY
1.2 MARKET DEFINITION
1.3 OVERVIEW OF GLOBAL BUS PUBLIC TRANSPORT MARKET
1.4 CURRENCY AND PRICING
1.5 LIMITATION
1.6 MARKETS COVERED
2 MARKET SEGMENTATION
2.1 KEY TAKEAWAYS
2.2 ARRIVING AT THE GLOBAL BUS PUBLIC TRANSPORT MARKET
2.3 VENDOR POSITIONING GRID
2.4 TECHNOLOGY LIFE LINE CURVE
2.5 MARKET GUIDE
2.6 MULTIVARIATE MODELLING
2.7 TOP TO BOTTOM ANALYSIS
2.8 STANDARDS OF MEASUREMENT
2.9 VENDOR SHARE ANALYSIS
2.1 DATA POINTS FROM KEY PRIMARY INTERVIEWS
2.11 DATA POINTS FROM KEY SECONDARY DATABASES
2.12 GLOBAL BUS PUBLIC TRANSPORT MARKET: RESEARCH SNAPSHOT
2.13 ASSUMPTIONS
3 MARKET OVERVIEW
3.1 DRIVERS
3.2 RESTRAINTS
3.3 OPPORTUNITIES
3.4 CHALLENGES
4 EXECUTIVE SUMMARY
5 PREMIUM INSIGHTS
6 GLOBAL BUS PUBLIC TRANSPORT MARKET, BY LOCALITY
6.1 OVERVIEW
6.2 CITY
6.3 RURAL
7 GLOBAL BUS PUBLIC TRANSPORT MARKET, BY PROPULSION
7.1 OVERVIEW
7.2 ELECTRIC
7.3 GASOLINE
7.4 NATURAL GAS
7.5 DIESEL
7.6 HYBRID
8 GLOBAL BUS PUBLIC TRANSPORT MARKET, BY BUS TYPE
8.1 OVERVIE0057
8.2 TRANSIT BUSES
8.3 SCHOOL BUSES
8.4 OTHERS
9 GLOBAL BUS PUBLIC TRANSPORT MARKET, BY OWNERSHIP
9.1 OVERVIEW
9.2 PRIVATE OWNED
9.3 PUBLIC OWNED
10 GLOBAL BUS PUBLIC TRANSPORT MARKET, BY BUS LENGTH
10.1 OVERVIEW
10.2 6-8 MT
10.3 9-12 MT
10.4 ABOVE 12 MT
11 GLOBAL BUS PUBLIC TRANSPORT MARKET, BY NUMBER OF SEATS
11.1 OVERVIEW
11.2 UPTO 30 SEATER
11.3 31 TO 40 SEATER
11.4 ABOVE 41 SEATER
12 GLOBAL BUS PUBLIC TRANSPORT MARKET, BY BODY TYPE
12.1 OVERVIEW
12.2 FULLY TYPE
12.3 CUSTOMIZABLE
13 GLOBAL BUS PUBLIC TRANSPORT MARKET, BY END-USER
13.1 OVERVIEW
13.2 INTRACITY
13.2.1 ELECTRIC
13.2.2 GASOLINE
13.2.3 NATURAL GAS
13.2.4 DIESEL
13.2.5 HYBRID
13.3 INTERCITY
13.3.1 ELECTRIC
13.3.2 GASOLINE
13.3.3 NATURAL GAS
13.3.4 DIESEL
13.3.5 HYBRID
13.4 OTHERS
14 GLOBAL BUS PUBLIC TRANSPORT MARKET, BY GEOGRAPHY
14.1 GLOBAL BUS PUBLIC TRANSPORT MARKET, (ALL SEGMENTATION PROVIDED ABOVE IS REPRESENTED IN THIS CHAPTER BY COUNTRY)
14.1.1 NORTH AMERICA
14.1.1.1. U.S.
14.1.1.2. CANADA
14.1.1.3. MEXICO
14.1.2 EUROPE
14.1.2.1. GERMANY
14.1.2.2. FRANCE
14.1.2.3. U.K.
14.1.2.4. ITALY
14.1.2.5. SPAIN
14.1.2.6. RUSSIA
14.1.2.7. TURKEY
14.1.2.8. BELGIUM
14.1.2.9. NETHERLANDS
14.1.2.10. SWITZERLAND
14.1.2.11. REST OF EUROPE
14.1.3 ASIA PACIFIC
14.1.3.1. JAPAN
14.1.3.2. CHINA
14.1.3.3. SOUTH KOREA
14.1.3.4. INDIA
14.1.3.5. AUSTRALIA
14.1.3.6. SINGAPORE
14.1.3.7. THAILAND
14.1.3.8. MALAYSIA
14.1.3.9. INDONESIA
14.1.3.10. PHILIPPINES
14.1.3.11. REST OF ASIA PACIFIC
14.1.4 SOUTH AMERICA
14.1.4.1. BRAZIL
14.1.4.2. ARGENTINA
14.1.4.3. REST OF SOUTH AMERICA
14.1.5 MIDDLE EAST AND AFRICA
14.1.5.1. SOUTH AFRICA
14.1.5.2. EGYPT
14.1.5.3. SAUDI ARABIA
14.1.5.4. U.A.E
14.1.5.5. ISRAEL
14.1.5.6. REST OF MIDDLE EAST AND AFRICA
14.2 KEY PRIMARY INSIGHTS: BY MAJOR COUNTRIES
15 GLOBAL BUS PUBLIC TRANSPORT MARKET, COMPANY LANDSCAPE
15.1 COMPANY SHARE ANALYSIS: NORTH AMERICA
15.2 COMPANY SHARE ANALYSIS: EUROPE
15.3 COMPANY SHARE ANALYSIS: ASIA-PACIFIC
15.4 MERGERS & ACQUISITIONS
15.5 NEW PRODUCT DEVELOPMENT & APPROVALS
15.6 EXPANSIONS
15.7 REGULATORY CHANGES
15.8 PARTNERSHIP AND OTHER STRATEGIC DEVELOPMENTS
16 GLOBAL BUS PUBLIC TRANSPORT MARKET, SWOT ANALYSIS
17 GLOBAL BUS PUBLIC TRANSPORT MARKET, COMPANY PROFILE
17.1 MTR CORPORATION
17.1.1 COMPANY SNAPSHOT
17.1.2 REVENUE ANALYSIS
17.1.3 GEOGRAPHIC PRESENCE
17.1.4 PRODUCT PORTFOLIO
17.1.5 RECENT DEVELOPMENTS
17.2 BAY AREA RAPID TRANSIT
17.2.1 COMPANY SNAPSHOT
17.2.2 REVENUE ANALYSIS
17.2.3 GEOGRAPHIC PRESENCE
17.2.4 PRODUCT PORTFOLIO
17.2.5 RECENT DEVELOPMENTS
17.3 MADRID METRO
17.3.1 COMPANY SNAPSHOT
17.3.2 REVENUE ANALYSIS
17.3.3 GEOGRAPHIC PRESENCE
17.3.4 PRODUCT PORTFOLIO
17.3.5 RECENT DEVELOPMENTS
17.4 CHICAGO TRANSIT AUTHORITY
17.4.1 COMPANY SNAPSHOT
17.4.2 REVENUE ANALYSIS
17.4.3 GEOGRAPHIC PRESENCE
17.4.4 PRODUCT PORTFOLIO
17.4.5 RECENT DEVELOPMENTS
17.5 GRANDE WEST TRANSPORTATION GROUP LTD.
17.5.1 COMPANY SNAPSHOT
17.5.2 REVENUE ANALYSIS
17.5.3 GEOGRAPHIC PRESENCE
17.5.4 PRODUCT PORTFOLIO
17.5.5 RECENT DEVELOPMENTS
17.6 THE WASHINGTON METROPOLITAN AREA TRANSIT AUTHORITY
17.6.1 COMPANY SNAPSHOT
17.6.2 REVENUE ANALYSIS
17.6.3 GEOGRAPHIC PRESENCE
17.6.4 PRODUCT PORTFOLIO
17.6.5 RECENT DEVELOPMENTS
17.7 TEMSA GLOBAL
17.7.1 COMPANY SNAPSHOT
17.7.2 REVENUE ANALYSIS
17.7.3 GEOGRAPHIC PRESENCE
17.7.4 PRODUCT PORTFOLIO
17.7.5 RECENT DEVELOPMENTS
17.8 GILLIG CORPORATION
17.8.1 COMPANY SNAPSHOT
17.8.2 REVENUE ANALYSIS
17.8.3 GEOGRAPHIC PRESENCE
17.8.4 PRODUCT PORTFOLIO
17.8.5 RECENT DEVELOPMENTS
17.9 SEOUL METRO
17.9.1 COMPANY SNAPSHOT
17.9.2 REVENUE ANALYSIS
17.9.3 GEOGRAPHIC PRESENCE
17.9.4 PRODUCT PORTFOLIO
17.9.5 RECENT DEVELOPMENTS
17.1 THE SAN DIEGO METROPOLITAN TRANSIT SYSTEM
17.10.1 COMPANY SNAPSHOT
17.10.2 REVENUE ANALYSIS
17.10.3 GEOGRAPHIC PRESENCE
17.10.4 PRODUCT PORTFOLIO
17.10.5 RECENT DEVELOPMENTS
17.11 EICHER MOTORS
17.11.1 COMPANY SNAPSHOT
17.11.2 REVENUE ANALYSIS
17.11.3 GEOGRAPHIC PRESENCE
17.11.4 PRODUCT PORTFOLIO
17.11.5 RECENT DEVELOPMENTS
17.12 FORCE MOTORS
17.12.1 COMPANY SNAPSHOT
17.12.2 REVENUE ANALYSIS
17.12.3 GEOGRAPHIC PRESENCE
17.12.4 PRODUCT PORTFOLIO
17.12.5 RECENT DEVELOPMENTS
17.13 VOLVO BUSES
17.13.1 COMPANY SNAPSHOT
17.13.2 REVENUE ANALYSIS
17.13.3 GEOGRAPHIC PRESENCE
17.13.4 PRODUCT PORTFOLIO
17.13.5 RECENT DEVELOPMENTS
17.14 SCANIA
17.14.1 COMPANY SNAPSHOT
17.14.2 REVENUE ANALYSIS
17.14.3 GEOGRAPHIC PRESENCE
17.14.4 PRODUCT PORTFOLIO
17.14.5 RECENT DEVELOPMENTS
17.15 MAN SE
17.15.1 COMPANY SNAPSHOT
17.15.2 REVENUE ANALYSIS
17.15.3 GEOGRAPHIC PRESENCE
17.15.4 PRODUCT PORTFOLIO
17.15.5 RECENT DEVELOPMENTS
17.16 VOLVO
17.16.1 COMPANY SNAPSHOT
17.16.2 REVENUE ANALYSIS
17.16.3 GEOGRAPHIC PRESENCE
17.16.4 PRODUCT PORTFOLIO
17.16.5 RECENT DEVELOPMENTS
17.17 EBUSCO
17.17.1 COMPANY SNAPSHOT
17.17.2 REVENUE ANALYSIS
17.17.3 GEOGRAPHIC PRESENCE
17.17.4 PRODUCT PORTFOLIO
17.17.5 RECENT DEVELOPMENTS
17.18 ZEBUS
17.18.1 COMPANY SNAPSHOT
17.18.2 REVENUE ANALYSIS
17.18.3 GEOGRAPHIC PRESENCE
17.18.4 PRODUCT PORTFOLIO
17.18.5 RECENT DEVELOPMENTS
17.19 CHICAGO TRANSIT AUTHORITY
17.19.1 COMPANY SNAPSHOT
17.19.2 REVENUE ANALYSIS
17.19.3 GEOGRAPHIC PRESENCE
17.19.4 PRODUCT PORTFOLIO
17.19.5 RECENT DEVELOPMENTS
17.2 BAY AREA RAPID TRANSIT
17.20.1 COMPANY SNAPSHOT
17.20.2 REVENUE ANALYSIS
17.20.3 GEOGRAPHIC PRESENCE
17.20.4 PRODUCT PORTFOLIO
17.20.5 RECENT DEVELOPMENTS
17.21 MASSACHUSETTS BAY TRANSPORTATION AUTHORITY
17.21.1 COMPANY SNAPSHOT
17.21.2 REVENUE ANALYSIS
17.21.3 GEOGRAPHIC PRESENCE
17.21.4 PRODUCT PORTFOLIO
17.21.5 RECENT DEVELOPMENTS
*NOTE: THE COMPANIES PROFILED IS NOT EXHAUSTIVE LIST AND IS AS PER OUR PREVIOUS CLIENT REQUIREMENT. WE PROFILE MORE THAN 100 COMPANIES IN OUR STUDY AND HENCE THE LIST OF COMPANIES CAN BE MODIFIED OR REPLACED ON REQUEST
18 RELATED REPORTS
19 QUESTIONNAIRE
20 ABOUT DATA BRIDGE MARKET RESEARCH
Data collection and base year analysis are done using data collection modules with large sample sizes. The stage includes obtaining market information or related data through various sources and strategies. It includes examining and planning all the data acquired from the past in advance. It likewise envelops the examination of information inconsistencies seen across different information sources. The market data is analysed and estimated using market statistical and coherent models. Also, market share analysis and key trend analysis are the major success factors in the market report. To know more, please request an analyst call or drop down your inquiry.
The key research methodology used by DBMR research team is data triangulation which involves data mining, analysis of the impact of data variables on the market and primary (industry expert) validation. Data models include Vendor Positioning Grid, Market Time Line Analysis, Market Overview and Guide, Company Positioning Grid, Patent Analysis, Pricing Analysis, Company Market Share Analysis, Standards of Measurement, Global versus Regional and Vendor Share Analysis. To know more about the research methodology, drop in an inquiry to speak to our industry experts.
Data Bridge Market Research is a leader in advanced formative research. We take pride in servicing our existing and new customers with data and analysis that match and suits their goal. The report can be customized to include price trend analysis of target brands understanding the market for additional countries (ask for the list of countries), clinical trial results data, literature review, refurbished market and product base analysis. Market analysis of target competitors can be analyzed from technology-based analysis to market portfolio strategies. We can add as many competitors that you require data about in the format and data style you are looking for. Our team of analysts can also provide you data in crude raw excel files pivot tables (Fact book) or can assist you in creating presentations from the data sets available in the report.


