
Global Dermatitis Market
Market Size in USD Billion
 USD
8.08 Billion
USD
15.06 Billion
2025
2033
USD
8.08 Billion
USD
15.06 Billion
2025
2033
| 2026 - 2033 | |
| USD 8.08 Billion | |
| USD 15.06 Billion | |
| % | |
|
Dermatitis Market Size
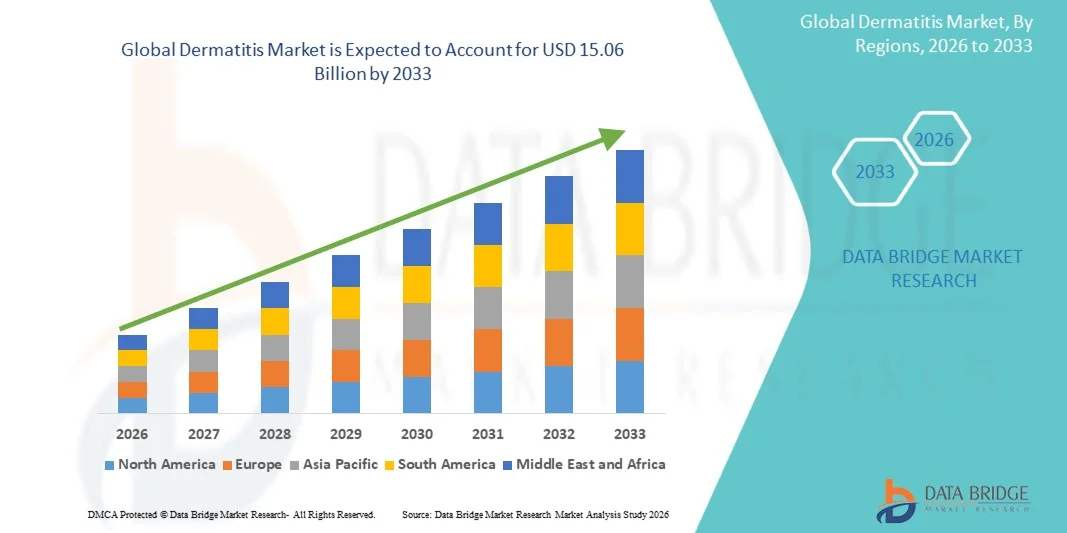
- The global dermatitis market size was valued at USD 8.08 billion in 2025 and is expected to reach USD 15.06 billion by 2033, at a CAGR of 8.10% during the forecast period
- The market growth is largely fueled by the increasing prevalence of various forms of dermatitis, including atopic dermatitis, contact dermatitis, and seborrheic dermatitis, driven by factors such as environmental triggers, allergens, lifestyle changes, and genetic susceptibility
- Furthermore, rising awareness regarding skin health, improved diagnosis rates, and the growing availability of advanced treatment options including biologics, topical therapies, and targeted systemic drugs are contributing to higher adoption of effective management solutions, thereby accelerating the growth of the dermatitis market
Dermatitis Market Analysis
- Dermatitis, encompassing a range of inflammatory skin conditions such as atopic dermatitis, contact dermatitis, and seborrheic dermatitis, is a significant segment of the dermatology market, driven by its chronic nature, recurrent flare-ups, and the need for long-term management through topical, systemic, and biologic therapies in both pediatric and adult populations
- The escalating demand for dermatitis treatments is primarily fueled by the rising global prevalence of skin allergies, environmental pollutants, changing lifestyles, increased stress levels, and greater awareness leading to higher diagnosis rates and treatment-seeking behavior among patients
- North America dominated the dermatitis market with the largest revenue share of 42.5% in 2025, supported by advanced healthcare infrastructure, high diagnosis rates, strong adoption of biologics and novel therapies, and the presence of major pharmaceutical companies, particularly in the U.S., where innovation in targeted immunomodulatory treatments continues to expand treatment options
- Asia-Pacific is expected to be the fastest growing region in the dermatitis market during the forecast period due to a large patient population, increasing healthcare expenditure, improving access to dermatological care, and growing awareness of chronic skin conditions
- Atopic dermatitis segment dominated the dermatitis market with the largest share of 60.9% in 2025, attributed to its high global prevalence, chronic relapsing nature, and the increasing use of advanced therapies such as biologics and Janus kinase (JAK) inhibitors for moderate to severe cases
Report Scope and Dermatitis Market Segmentation
|
Attributes |
Dermatitis Key Market Insights |
|
Segments Covered |
|
|
Countries Covered |
North America
Europe
Asia-Pacific
Middle East and Africa
South America
|
|
Key Market Players |
|
|
Market Opportunities |
|
|
Value Added Data Infosets |
In addition to the insights on market scenarios such as market value, growth rate, segmentation, geographical coverage, and major players, the market reports curated by the Data Bridge Market Research also include in-depth expert analysis, patient epidemiology, pipeline analysis, pricing analysis, and regulatory framework |
Dermatitis Market Trends
“Rising Adoption of Biologics and Targeted Therapies”
- A significant and accelerating trend in the global dermatitis market is the increasing adoption of advanced biologics and targeted therapies such as monoclonal antibodies and JAK inhibitors, which are improving treatment outcomes for moderate-to-severe and chronic cases of dermatitis
- For instance, biologic therapies like dupilumab and other emerging targeted agents are widely used to manage atopic dermatitis by addressing underlying immune pathways, offering more precise and long-term disease control compared to conventional treatments
- Advancements in personalized medicine and biomarker-driven approaches are enabling clinicians to better identify patient subgroups and tailor therapies, improving efficacy and reducing adverse effects in dermatitis management
- Furthermore, the integration of digital health tools and teledermatology platforms is enhancing patient access to care, enabling remote consultations, continuous monitoring, and timely intervention, particularly in underserved regions
- Increasing focus on combination therapies and long-term disease management strategies is improving patient adherence and clinical outcomes, especially for chronic and recurrent dermatitis cases
- Growing investment in research and development by pharmaceutical companies for novel pipeline molecules and next-generation immunomodulators is expanding the range of treatment options available in the market
- This trend towards more advanced, targeted, and accessible treatment approaches is reshaping clinical expectations and patient outcomes, with companies increasingly investing in innovative delivery mechanisms and precision medicine approaches
- The demand for effective, safe, and convenient dermatitis treatments is growing rapidly across both developed and emerging markets as patients and healthcare providers prioritize long-term disease control and quality of life
Dermatitis Market Dynamics
Driver
“Rising Prevalence and Increasing Awareness of Skin Disorders”
- The increasing global prevalence of dermatitis, coupled with growing awareness among patients and healthcare professionals, is a major driver accelerating the demand for effective diagnosis and treatment solutions
- For instance, pharmaceutical companies and dermatology-focused organizations are expanding awareness campaigns and screening initiatives to promote early diagnosis and treatment of atopic and contact dermatitis across various regions
- As environmental pollution, allergens, dietary changes, and lifestyle factors continue to contribute to higher incidence rates, more patients are seeking medical intervention for symptom relief and disease management
- Furthermore, the growing availability of advanced therapies, improved healthcare infrastructure, and increased healthcare spending are supporting wider adoption of prescription-based and over-the-counter dermatitis treatments
- Rising penetration of health insurance and reimbursement support in several regions is improving affordability and encouraging patients to opt for advanced dermatological care
- Increasing number of dermatology clinics and specialists, along with expanding access to healthcare services in emerging economies, is further supporting early diagnosis and treatment uptake
- The convenience of modern treatment options, including topical formulations, biologics, and systemic therapies, along with improved access to dermatology services, is further propelling market growth in both residential and clinical settings
- Overall, the rising burden of chronic skin conditions combined with improved awareness, diagnosis rates, and healthcare access is significantly driving the expansion of the dermatitis market
Restraint/Challenge
“High Treatment Costs and Limited Accessibility in Emerging Regions”
- Concerns surrounding the high cost of advanced therapies, including biologics and targeted treatments, along with limited accessibility in low- and middle-income regions, pose a significant challenge to broader market penetration
- For instance, premium biologic drugs used for moderate-to-severe dermatitis often require long-term administration and can be financially burdensome for patients without comprehensive insurance coverage or reimbursement support
- Addressing affordability and access issues through generic alternatives, biosimilars, and government healthcare initiatives is crucial for expanding treatment adoption and improving patient outcomes
- Furthermore, variability in healthcare infrastructure, shortage of dermatology specialists, and delayed diagnosis in developing regions limit timely access to effective care and appropriate treatment pathways
- Limited awareness about advanced treatment options among patients and primary care providers in emerging markets further delays proper disease management and escalates complications
- While awareness is gradually increasing, the perceived high cost of advanced therapies compared to conventional topical treatments can discourage patients from opting for newer and more effective options
- Overcoming these challenges through cost reduction strategies, improved reimbursement frameworks, expanded healthcare access, and educational initiatives will be vital for sustained growth of the dermatitis market
Dermatitis Market Scope
The market is segmented on the basis of type, treatment, diagnosis, route of administration, dosage form, end-users, and distribution channel.
- By Type
On the basis of type, the dermatitis market is segmented into contact dermatitis, atopic dermatitis, diaper dermatitis, nummular dermatitis, dyshidrotic dermatitis, perioral dermatitis, neurodermatitis, seborrheic dermatitis, and stasis dermatitis. The atopic dermatitis segment dominated the market with the largest market revenue share of 60.9% in 2025, driven by its high global prevalence, chronic relapsing nature, and increasing diagnosis rates across pediatric and adult populations. Patients with atopic dermatitis often require long-term and recurring treatment, which contributes to sustained demand for therapies such as biologics, topical corticosteroids, and immunomodulators. Growing awareness, improved diagnostic capabilities, and the availability of advanced targeted therapies further reinforce its dominance. The segment also benefits from strong clinical research activity and a robust pipeline of novel drugs targeting immune pathways.
The seborrheic dermatitis segment is anticipated to witness the fastest growth rate of 9% from 2026 to 2033, fueled by rising incidence linked to lifestyle factors, stress, hormonal changes, and fungal infections. Increased awareness regarding scalp and skin health, along with the availability of over-the-counter antifungal and medicated shampoos, is driving adoption. In addition, the growing demand for cosmetic and dermatological treatments for visible skin conditions is supporting segment expansion. The relatively underdiagnosed nature of seborrheic dermatitis in earlier stages is improving with better access to dermatology consultations and teledermatology services.
- By Treatment
On the basis of treatment, the dermatitis market is segmented into antibiotics, antihistamines, calcineurin inhibitors, topical corticosteroids, emollients, topical antiseptics, and others. The topical corticosteroids segment dominated the market with the largest market revenue share of 40% in 2025, owing to their widespread use as first-line therapy for managing inflammation, itching, and flare-ups across multiple types of dermatitis. Their affordability, availability in various strengths, and proven efficacy make them a preferred choice among healthcare providers. These drugs are commonly prescribed in both acute and chronic cases, contributing to high utilization rates globally.
The calcineurin inhibitors segment is expected to witness the fastest growth rate of 10% from 2026 to 2033, driven by increasing demand for steroid-sparing agents, especially for long-term management of sensitive areas such as the face and intertriginous regions. Drugs in this class offer reduced risk of skin thinning and other steroid-related side effects, making them suitable for prolonged use. Growing physician preference for safer long-term therapies and increasing patient awareness of adverse effects associated with corticosteroids are accelerating adoption.
- By Diagnosis
On the basis of diagnosis, the dermatitis market is segmented into blood tests, allergy skin tests, and skin biopsy. The allergy skin test segment dominated the market with the largest revenue share of 50% in 2025, as it is widely used to identify allergens responsible for contact dermatitis and atopic dermatitis. Its non-invasive nature, relatively quick results, and high diagnostic accuracy make it a preferred method among dermatologists and allergists. Increasing prevalence of allergic conditions and rising awareness about trigger identification further support its dominance.
The blood tests segment is anticipated to witness the fastest growth rate of 9% from 2026 to 2033, driven by advancements in immunological testing and the increasing use of specific IgE and biomarker-based assays. Blood tests are particularly useful in cases where skin testing is not feasible, such as in patients with severe skin conditions or those on certain medications. Expanding laboratory infrastructure and improved access to diagnostic facilities are also contributing to segment growth.
- By Route of Administration
On the basis of route of administration, the dermatitis market is segmented into oral, topical, and others. The topical segment dominated the market with the largest market revenue share of 65% in 2025, driven by the high prevalence of mild to moderate dermatitis cases that are effectively managed with creams, ointments, and lotions. Topical treatments are preferred due to their localized action, minimal systemic side effects, and ease of application. Their availability across prescription and over-the-counter channels further enhances accessibility and adoption.
The oral segment is expected to witness the fastest growth rate of 11% from 2026 to 2033, driven by increasing use in moderate-to-severe dermatitis cases. Oral antihistamines help in managing itching and improving patient comfort, while systemic immunosuppressants and targeted therapies address underlying inflammation. The rising adoption of biologics and advanced oral drugs is expanding treatment options. Oral administration is particularly important for patients who do not respond adequately to topical therapies. Improved clinical guidelines recommending systemic therapies in severe cases are also supporting growth. Growing availability of newer oral formulations is further boosting adoption.
- By Dosage Form
On the basis of dosage form, the dermatitis market is segmented into tablets, ointments, and others. The ointments segment dominated the market with the largest revenue share of 45% in 2025, as ointments provide effective skin barrier protection and better drug penetration, making them highly suitable for managing inflammatory skin conditions. They are widely used in topical corticosteroid and emollient formulations, especially for dry and chronic lesions. Their ease of application and strong moisturizing properties further enhance their preference among patients.
The tablets segment is anticipated to witness the fastest growth rate of 10% from 2026 to 2033, driven by increasing reliance on oral medications for systemic treatment. Tablets are commonly prescribed for antihistamines, antibiotics, and immunomodulatory drugs used in moderate-to-severe dermatitis cases. They offer convenient dosing and improved patient compliance. The growing adoption of advanced systemic therapies is expanding their use. Tablets are particularly useful when topical treatments are insufficient or impractical. Increasing availability of combination oral therapies is further supporting segment growth.
- By End-Users
On the basis of end-users, the dermatitis market is segmented into hospitals, specialty clinics, homecare, and others. The hospitals segment dominated the market with the largest market revenue share of 45% in 2025, due to the availability of advanced diagnostic facilities, access to specialized dermatologists, and the ability to manage severe and complicated cases of dermatitis. Hospitals also serve as primary centers for initiating biologic therapies and advanced treatments, contributing to higher patient inflow.
The homecare segment is expected to witness the fastest growth rate of 12% from 2026 to 2033, driven by increasing preference for at-home management of chronic conditions. Patients are increasingly opting for home-based care due to convenience, cost-effectiveness, and reduced hospital visits. The rise of telemedicine and remote monitoring tools is enabling continuous patient management outside clinical settings. Availability of self-administered treatments supports this shift toward homecare. Growing awareness of self-management practices is also contributing to adoption. Aging populations and chronic disease burden further accelerate demand for home-based care solutions.
- By Distribution Channel
On the basis of distribution channel, the dermatitis market is segmented into hospital pharmacy, retail pharmacy, online pharmacy, and others. The retail pharmacy segment dominated the market with the largest revenue share of 50% in 2025, supported by easy accessibility, widespread presence of pharmacies, and availability of both prescription and over-the-counter dermatology products. Patients often prefer retail pharmacies for quick and convenient access to topical treatments and basic medications.
The online pharmacy segment is anticipated to witness the fastest growth rate of 13% from 2026 to 2033, driven by increasing digitalization, rising e-commerce penetration, and growing consumer preference for doorstep delivery of medications. Online platforms offer competitive pricing, discounts, and a wide range of product availability, making them attractive for chronic condition management. The expansion of telehealth services and integration with e-prescriptions is further accelerating this segment’s growth. Promotional offers and subscription-based delivery models are also contributing to increased uptake.
Dermatitis Market Regional Analysis
- North America dominated the dermatitis market with the largest revenue share of 42.5% in 2025, supported by advanced healthcare infrastructure, high diagnosis rates, strong adoption of biologics and novel therapies, and the presence of major pharmaceutical companies
- Consumers in the region have high access to advanced therapies such as biologics, topical corticosteroids, and targeted immunomodulators, along with well-established diagnostic and treatment facilities that support early and effective disease management
- This widespread adoption is further supported by high healthcare expenditure, strong reimbursement frameworks, a large number of dermatology specialists, and increasing preference for innovative and long-term treatment solutions, establishing the region as a key market for dermatitis management
U.S. Dermatitis Market Insight
The U.S. Dermatitis Market captured the largest revenue share of 82% in 2025 within North America, fueled by the high prevalence of atopic and contact dermatitis and the strong presence of advanced healthcare infrastructure and dermatology specialists. Patients in the country increasingly prioritize access to innovative therapies such as biologics, JAK inhibitors, and advanced topical treatments for effective long-term disease management. The growing awareness of skin health, coupled with widespread insurance coverage and reimbursement support, further encourages early diagnosis and treatment adoption. Moreover, the increasing use of teledermatology platforms and integration of digital health solutions is significantly contributing to improved access and monitoring of dermatitis care across both urban and rural populations.
Europe Dermatitis Market Insight
The Europe dermatitis market is projected to expand at a substantial CAGR throughout the forecast period, primarily driven by the rising prevalence of chronic skin disorders and the presence of well-established healthcare systems. Increasing awareness regarding early diagnosis and treatment, along with favorable reimbursement policies in several countries, is fostering market growth. European consumers are increasingly adopting advanced treatment options, including biologics and steroid-sparing therapies, for long-term disease management. The region is also witnessing strong growth across hospitals, specialty clinics, and homecare settings, supported by expanding access to dermatological services and growing investment in healthcare infrastructure.
U.K. Dermatitis Market Insight
The U.K. dermatitis market is anticipated to grow at a noteworthy CAGR during the forecast period, driven by increasing cases of atopic dermatitis and rising awareness about skin health among consumers. The demand for advanced and convenient treatment options is increasing due to the growing burden of chronic dermatological conditions. In addition, the country’s well-developed healthcare system and access to dermatology specialists are supporting early diagnosis and treatment. The integration of digital health platforms and telemedicine services is further improving patient access to care, while strong pharmaceutical presence and ongoing research activities continue to support market expansion.
Germany Dermatitis Market Insight
The Germany dermatitis market is expected to expand at a considerable CAGR during the forecast period, fueled by high healthcare expenditure and increasing awareness of chronic skin conditions. Germany’s advanced medical infrastructure and strong emphasis on research and innovation are promoting the adoption of targeted therapies and biologics. The population’s preference for high-quality and effective treatments is driving demand for both prescription and over-the-counter dermatology products. In addition, the integration of dermatological care within hospital systems and specialty clinics, along with increasing adoption of digital healthcare solutions, is supporting consistent market growth.
Asia-Pacific Dermatitis Market Insight
The Asia-Pacific dermatitis market is poised to grow at the fastest CAGR of 13% during the forecast period of 2026 to 2033, driven by a large patient population, increasing prevalence of allergic skin conditions, and improving access to healthcare services. Rising disposable incomes, rapid urbanization, and growing awareness of dermatological diseases are encouraging patients to seek medical treatment. Government initiatives aimed at improving healthcare infrastructure and expanding insurance coverage are further supporting market growth. In addition, the increasing availability of affordable treatment options and expansion of pharmaceutical manufacturing in the region are enhancing accessibility and adoption across diverse populations.
Japan Dermatitis Market Insight
The Japan dermatitis market is gaining momentum due to the country’s aging population, high healthcare standards, and strong focus on advanced medical technologies. The prevalence of atopic dermatitis remains significant, particularly among both pediatric and adult populations, driving demand for effective long-term treatment options. Japan’s healthcare system supports early diagnosis and access to innovative therapies, including biologics and immunomodulators. Furthermore, increasing adoption of digital healthcare solutions and teledermatology is improving patient management. The emphasis on precision medicine and continuous research in dermatological treatments is further contributing to market growth.
India Dermatitis Market Insight
The India dermatitis market accounted for a significant revenue share in Asia-Pacific in 2025, attributed to the country’s large population base, rising urbanization, and increasing awareness of skin disorders. The growing middle-class population and improving access to healthcare services are driving demand for dermatological treatments. India is witnessing increasing adoption of both prescription-based and over-the-counter products for managing dermatitis, supported by the expansion of retail and online pharmacy channels. In addition, the availability of cost-effective treatment options and growing penetration of telemedicine services are enhancing access to dermatology care across urban and rural regions, contributing to overall market growth.
Dermatitis Market Share
The Dermatitis industry is primarily led by well-established companies, including:
- AbbVie Inc. (U.S.)
- Sanofi (France)
- Pfizer Inc. (U.S.)
- Novartis AG (Switzerland)
- GSK plc (U.K.)
- LEO Pharma A/S (Denmark)
- Bayer AG (Germany)
- Eli Lilly and Company (U.S.)
- Regeneron Pharmaceuticals, Inc. (U.S.)
- Amgen Inc. (U.S.)
- Takeda Pharmaceutical Company Limited (Japan)
- Incyte Corporation (U.S.)
- GALDERMA (Switzerland)
- Bristol-Myers Squibb Company (U.S.)
- Leo Laboratories Ltd. (India)
- Astellas Pharma Inc. (Japan)
- Novan, Inc. (U.S.)
- Dermira, Inc. (U.S.)
- Pierre Fabre Dermo-Cosmétique (France)
What are the Recent Developments in Global Dermatitis Market?
- In February 2026, the FDA approved Adquey (difamilast 1% ointment), a novel non-steroidal PDE4 inhibitor for the topical treatment of mild-to-moderate atopic dermatitis in adults and children aged 2 and older, expanding non-steroidal treatment options for eczema patients
- In September 2025, Amgen and Kyowa Kirin reported positive top-line results from their Phase 3 rocatinlimab study in adults and adolescents with moderate-to-severe atopic dermatitis, highlighting progress toward a potential new immunotherapy targeting the OX40 receptor that could expand treatment options for hard-to-treat cases
- In September 2025, the U.S. Food and Drug Administration (FDA) approved Incyte’s eczema cream Opzelura for pediatric patients aged 2–11, extending its indication beyond adults and making it the first topical JAK inhibitor approved for young children with atopic dermatitis, offering a steroid-free treatment option
- In July 2025, the FDA approved Anzupgo (delgocitinib cream) the first cream specifically for chronic hand eczema, providing a new treatment option for adults with moderate-to-severe hand eczema who cannot use or respond poorly to topical steroids
- In December 2024, the FDA approved Nemluvio (nemolizumab) for moderate-to-severe atopic dermatitis in patients aged 12 and older, marking the first monoclonal antibody targeting the interleukin-31 receptor alpha for this indication and improving itch and inflammation management
SKU-

- Interactive Data Analysis Dashboard
- Company Analysis Dashboard for high growth potential opportunities
- Research Analyst Access for customization & queries
- Competitor Analysis with Interactive dashboard
- Latest News, Updates & Trend analysis
- Harness the Power of Benchmark Analysis for Comprehensive Competitor Tracking
Data collection and base year analysis are done using data collection modules with large sample sizes. The stage includes obtaining market information or related data through various sources and strategies. It includes examining and planning all the data acquired from the past in advance. It likewise envelops the examination of information inconsistencies seen across different information sources. The market data is analysed and estimated using market statistical and coherent models. Also, market share analysis and key trend analysis are the major success factors in the market report. To know more, please request an analyst call or drop down your inquiry.
The key research methodology used by DBMR research team is data triangulation which involves data mining, analysis of the impact of data variables on the market and primary (industry expert) validation. Data models include Vendor Positioning Grid, Market Time Line Analysis, Market Overview and Guide, Company Positioning Grid, Patent Analysis, Pricing Analysis, Company Market Share Analysis, Standards of Measurement, Global versus Regional and Vendor Share Analysis. To know more about the research methodology, drop in an inquiry to speak to our industry experts.
Data Bridge Market Research is a leader in advanced formative research. We take pride in servicing our existing and new customers with data and analysis that match and suits their goal. The report can be customized to include price trend analysis of target brands understanding the market for additional countries (ask for the list of countries), clinical trial results data, literature review, refurbished market and product base analysis. Market analysis of target competitors can be analyzed from technology-based analysis to market portfolio strategies. We can add as many competitors that you require data about in the format and data style you are looking for. Our team of analysts can also provide you data in crude raw excel files pivot tables (Fact book) or can assist you in creating presentations from the data sets available in the report.


