
Global E Pharma Market
Market Size in USD Billion
 USD
73.31 Billion
USD
309.78 Billion
2024
2032
USD
73.31 Billion
USD
309.78 Billion
2024
2032
| 2025 - 2032 | |
| USD 73.31 Billion | |
| USD 309.78 Billion | |
| % | |
|
E-Pharma Market Analysis
In general, there are three types of e-pharmacies available on the market, organized e-pharmacies, non-organized e-pharmacies, and e-pharmacies used for illegal international commerce. The general public benefits from e-pharmacy in a number of ways, including customer convenience, access, education, data records, and medicine legitimacy.
E-Pharma Market Size
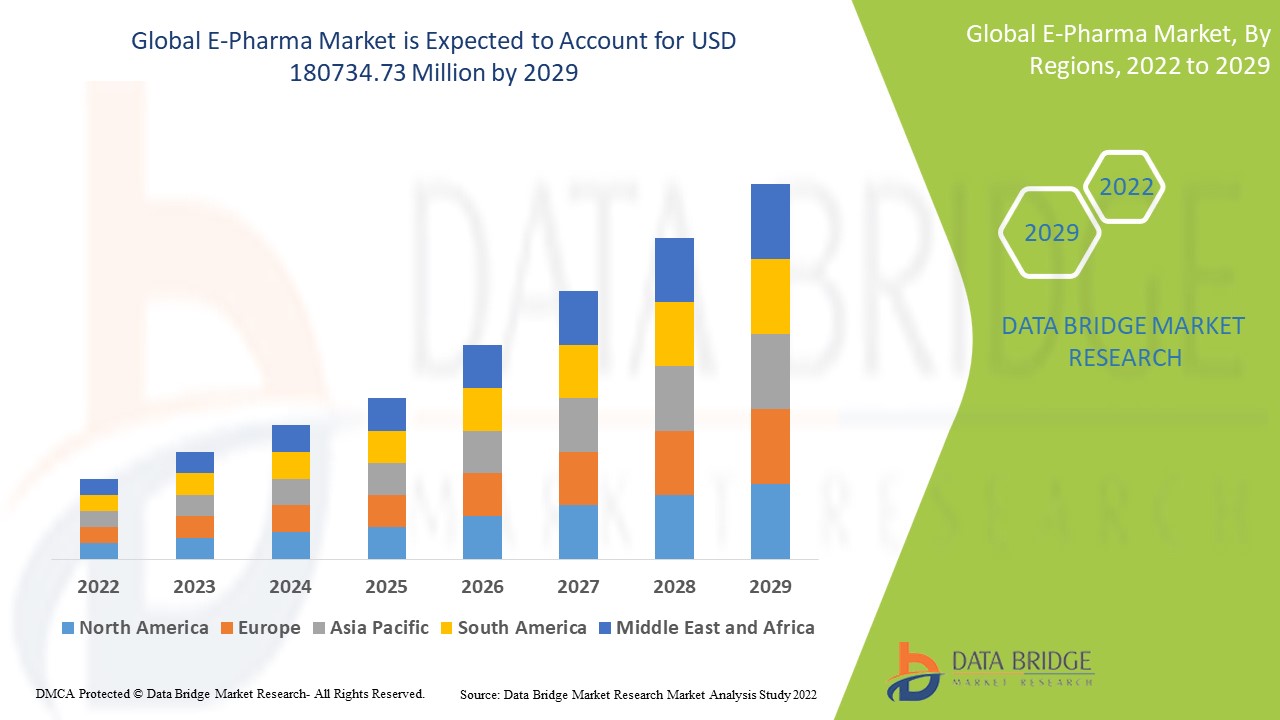
Global E-pharma market size was valued at USD 73.31 billion in 2024 and is projected to reach USD 309.78 billion by 2032, with a CAGR of 19.74% during the forecast period of 2025 to 2032.
Report Scope and E-Pharma Market Segmentation
|
Attributes |
E-Pharma Key Market Insights |
|
Segmentation |
|
|
Countries Covered |
U.S., Canada and Mexico in North America, Germany, France, U.K., Netherlands, Switzerland, Belgium, Russia, Italy, Spain, Turkey, Rest of Europe in Europe, China, Japan, India, South Korea, Singapore, Malaysia, Australia, Thailand, Indonesia, Philippines, Rest of Asia-Pacific (APAC) in the Asia-Pacific (APAC), Saudi Arabia, U.A.E, South Africa, Egypt, Israel, Rest of Middle East and Africa (MEA) as a part of Middle East and Africa (MEA), Brazil, Argentina and Rest of South America as part of South America |
|
Key Market Players |
Boehringer Ingelheim International GmbH (Germany), AbbVie Inc (U.S.), Aurobindo Pharma (India), Pfizer Inc. (U.S.), Walmart Inc. (U.S.), Walgreen Co. (U.S.), Express Scripts (U.S.), The Kroger Co. (U.S.), L Rowland & Co (U.K.), DocMorris (Germany), Giant Eagle, Inc. (U.S.), OptumRx, Inc. (U.S.), CVS Health (U.S.), Merck & Co., Inc. (U.S.) and Thermo Fisher Scientific Inc. (U.S.) |
|
Market Opportunities |
|
Global E-Pharma Market Definition
The definition of the "e-Pharma market" is the mode of exchange between pharmacies and pharmaceutical firms. One of the most recent inventions that has emerged as the most practical means to order medications is the e-pharma industry.
E-Pharma Market Dynamics
Drivers
- Increasing government initiatives
Rising emerging technologies like artificial intelligence (AI) and machine learning (ML) help in ensuring customer satisfaction by recommendation engines, increasing internet penetration due to cheap data rate, rising government initiatives, changing regulations, increasing internet penetration in urban as well as rural areas, and rising prevalence for e-prescriptions are all key factors escalating the market growth.
- Rising research and development activities
Additionally, rising emerging markets with an increasing geriatric population base, rising research and development activities in the healthcare sector, and rising technological advancements and modernization in the healthcare sector will further create new opportunities for the E-pharma market in the anticipated period of 2025–2032.
- Rise in the geriatric population
The rising prevalence rates of lifestyle disorders like as diabetes and obesity, rising health-care spending, and the fast-growing diagnostic industry are driving the worldwide e-pharma market expansion. In addition, the growing elderly population, increased demand for laboratory automation, and more awareness of preventative healthcare are all driving the E-pharma market forward.
Opportunities
The pharmaceutical industry's expanding use of e-commerce platforms is now fuelling market expansion. Additionally, the market expansion is being fuelled by expanding internet connectivity and the widespread use of smart gadgets.
Restraints/Challenges
However, the market would be constrained by an increase in illicit online pharmacies and the availability of bogus medications online, which will further hinder the growth of the e-pharma industry throughout the forecast period.
This e-pharma market report provides details of new recent developments, trade regulations, import-export analysis, production analysis, value chain optimization, market share, impact of domestic and localized market players, analyses opportunities in terms of emerging revenue pockets, changes in market regulations, strategic market growth analysis, market size, category market growths, application niches and dominance, product approvals, product launches, geographic expansions, technological innovations in the market. To gain more info on the e-pharma market contact Data Bridge Market Research for an Analyst Brief, our team will help you take an informed market decision to achieve market growth.
COVID-19 Impact on E-Pharma Market
Additionally, an increasing variety of in-app features, like special discounts, personalised purchases, expedited delivery, etc., are supporting the global market expansion. As a result of the rapid COVID-19 epidemic, brick-and-mortar pharmacies are gradually giving way to online pharmacy platforms in an effort to reduce the danger of coronavirus infection through human contact. Predictive analytics, artificial intelligence (AI), health information technology (HIT), and other cutting-edge technologies will increasingly be combined with e-pharmacy solutions to drive the global market in the years to come.
E-Pharma Market Scope
The e-pharma market is segmented on the basis of product type, application and type. The growth amongst these segments will help you analyze meagre growth segments in the industries and provide the users with a valuable market overview and market insights to help them make strategic decisions for identifying core market applications.
Application
- Hospitals
- Personal Use
- Government Research
Type
- Pharmacy Benefit Manager
- Legitimate Internet Pharmacy
- Illegal or Unethical Internet Pharmacy
Product Type
- Generic
- Branded
E-Pharma Market Regional Analysis
The e-pharma market is analyzed and market size insights and trends are provided by country, product type, application and type as referenced above.
The countries covered in the e-pharma market report are U.S., Canada and Mexico in North America, Germany, France, U.K., Netherlands, Switzerland, Belgium, Russia, Italy, Spain, Turkey, Rest of Europe in Europe, China, Japan, India, South Korea, Singapore, Malaysia, Australia, Thailand, Indonesia, Philippines, Rest of Asia-Pacific (APAC) in the Asia-Pacific (APAC), Saudi Arabia, U.A.E, South Africa, Egypt, Israel, Rest of Middle East and Africa (MEA) as a part of Middle East and Africa (MEA), Brazil, Argentina and Rest of South America as part of South America.
North America dominates the e-pharma market due to rise in the number of patients due to unhealthy lifestyle, rising government initiatives, changing regulations, and increasing internet penetration in urban as well as rural areas in this region.
Asia-Pacific is expected to grow at the highest growth rate in the forecast period of 2025 to 2032 due to rising aging population and rising government initiatives in this region.
The country section of the report also provides individual market impacting factors and changes in regulation in the market domestically that impacts the current and future trends of the market. Data points like down-stream and upstream value chain analysis, technical trends and porter's five forces analysis, case studies are some of the pointers used to forecast the market scenario for individual countries. Also, the presence and availability of global brands and their challenges faced due to large or scarce competition from local and domestic brands, impact of domestic tariffs and trade routes are considered while providing forecast analysis of the country data.
E-Pharma Market Share
The e-pharma market competitive landscape provides details by competitor. Details included are company overview, company financials, revenue generated, market potential, investment in research and development, new market initiatives, global presence, production sites and facilities, production capacities, company strengths and weaknesses, product launch, product width and breadth, application dominance. The above data points provided are only related to the companies' focus related to e-pharma market.
E-Pharma Market Leaders Operating in the Market Are:
- Boehringer Ingelheim International GmbH (Germany)
- AbbVie Inc (U.S.)
- Aurobindo Pharma (India)
- Pfizer Inc. (U.S.)
- Walmart Inc. (U.S.)
- Walgreen Co. (U.S.)
- Express Scripts (U.S.)
- The Kroger Co. (U.S.)
- L Rowland & Co (U.K.)
- DocMorris (Germany)
- Giant Eagle, Inc. (U.S.)
- OptumRx, Inc. (U.S.)
- CVS Health (U.S.)
- Merck & Co., Inc. (U.S.)
- Thermo Fisher Scientific Inc. (U.S.)
SKU-

- Interactive Data Analysis Dashboard
- Company Analysis Dashboard for high growth potential opportunities
- Research Analyst Access for customization & queries
- Competitor Analysis with Interactive dashboard
- Latest News, Updates & Trend analysis
- Harness the Power of Benchmark Analysis for Comprehensive Competitor Tracking
Table of Content
1 INTRODUCTION
1.1 OBJECTIVES OF THE STUDY
1.2 MARKET DEFINITION
1.3 OVERVIEW OF GLOBAL E PHARMA MARKET
1.4 CURRENCY AND PRICING
1.5 LIMITATION
1.6 MARKETS COVERED
2 MARKET SEGMENTATION
2.1 KEY TAKEAWAYS
2.2 GLOBAL E PHARMA MARKET SIZE
2.2.1 VENDOR POSITIONING GRID
2.2.2 TECHNOLOGY LIFE LINE CURVE
2.2.3 TRIPOD DATA VALIDATION MODEL
2.2.4 MARKET GUIDE
2.2.5 MULTIVARIATE MODELLING
2.2.6 TOP TO BOTTOM ANALYSIS
2.2.7 CHALLENGE MATRIX
2.2.8 APPLICATION COVERAGE GRID
2.2.9 STANDARDS OF MEASUREMENT
2.2.10 VENDOR SHARE ANALYSIS
2.2.11 SALES VOLUME DATA
2.2.12 DATA POINTS FROM KEY PRIMARY INTERVIEWS
2.2.13 DATA POINTS FROM KEY SECONDARY DATABASES
2.3 GLOBAL E PHARMA MARKET: RESEARCH SNAPSHOT
2.4 ASSUMPTIONS
3 MARKET OVERVIEW
3.1 DRIVERS
3.2 RESTRAINTS
3.3 OPPORTUNITIES
3.4 CHALLENGES
4 EXECUTIVE SUMMARY
5 PREMIUM INSIGHTS
5.1 PESTEL ANALYSIS
5.2 PORTER’S FIVE FORCES MODEL
6 INDUSTRY INSIGHTS
6.1 MICRO AND MACRO ECONOMIC FACTORS
6.2 PENETRATION AND GROWTH PROSPECT MAPPING
6.3 KEY PRICING STRATEGIES
6.4 INTERVIEWS WITH SPECIALIST
6.5 ANALYIS AND RECOMMENDATION
7 INTELLECTUAL PROPERTY (IP) PORTFOLIO
7.1 PATENT QUALITY AND STRENGTH
7.2 PATENT FAMILIES
7.3 LICENSING AND COLLABORATIONS
7.4 COMPETITIVE LANDSCAPE
7.5 IP STRATEGY AND MANAGEMENT
7.6 OTHER
8 COST ANALYSIS BREAKDOWN
9 TECHNONLOGY ROADMAP
10 INNOVATION TRACKER AND STRATEGIC ANALYSIS
10.1 MAJOR DEALS AND STRATEGIC ALLIANCES ANALYSIS
10.1.1 JOINT VENTURES
10.1.2 MERGERS AND ACQUISITIONS
10.1.3 LICENSING AND PARTNERSHIP
10.1.4 TECHNOLOGY COLLABORATIONS
10.1.5 STRATEGIC DIVESTMENTS
10.2 NUMBER OF PRODUCTS IN DEVELOPMENT
10.3 STAGE OF DEVELOPMENT
10.4 TIMELINES AND MILESTONES
10.5 INNOVATION STRATEGIES AND METHODOLOGIES
10.6 RISK ASSESSMENT AND MITIGATION
10.7 FUTURE OUTLOOK
11 REGULATORY COMPLIANCE
11.1 REGULATORY AUTHORITIES
11.2 REGULATORY CLASSIFICATIONS
11.2.1 CLASS I
11.2.2 CLASS II
11.2.3 CLASS III
11.3 REGULATORY SUBMISSIONS
11.4 INTERNATIONAL HARMONIZATION
11.5 COMPLIANCE AND QUALITY MANAGEMENT SYSTEMS
11.6 REGULATORY CHALLENGES AND STRATEGIES
12 REIMBURSEMENT FRAMEWORK
13 OPPUTUNITY MAP ANALYSIS
14 VALUE CHAIN ANALYSIS
15 HEALTHCARE ECONOMY
15.1 HEALTHCARE EXPENDITURE
15.2 CAPITAL EXPENDITURE
15.3 CAPEX TRENDS
15.4 CAPEX ALLOCATION
15.5 FUNDING SOURCES
15.6 INDUSTRY BENCHMARKS
15.7 GDP RATION IN OVERALL GDP
15.8 HEALTHCARE SYSTEM STRUCTURE
15.9 GOVERNMENT POLICIES
15.1 ECONOMIC DEVELOPMENT
16 GLOBAL E PHARMA MARKET, BY PRODUCT
16.1 OVERVIEW
16.2 PRESCRIPTION MEDICINE
16.2.1 ANALGESICS
16.2.1.1. PARACETAMOL
16.2.1.2. FENTANYL
16.2.1.3. TRAMADOL
16.2.1.4. ACETAMINOPHEN
16.2.1.5. OTHERS
16.2.2 IMMUNOSUPPRESSIVES
16.2.2.1. AZATHIOPRINE
16.2.2.2. CICLOSPORIN
16.2.2.3. MYCOPHENOLATE MOFETIL
16.2.2.4. OTHERS
16.2.3 ANTIDEPRESSANT
16.2.3.1. RISPERIDONE
16.2.3.2. OLANZAPINE
16.2.3.3. TRIFLUOPERAZINE
16.2.3.4. CHLORDIAZEPOXIDE
16.2.3.5. OTHERS
16.2.4 ANTI-INFECTIVES
16.2.4.1. ANTIBIOTICS
16.2.4.1.1. AMOXICILLIN
16.2.4.1.2. METRONIDAZOLE
16.2.4.1.3. DOXYCYCLINE
16.2.4.1.4. CIPROFLOXACIN
16.2.4.1.5. LEVOFLOXACIN
16.2.4.1.6. OTHERS
16.2.4.2. ANTIVIRAL
16.2.4.2.1. ACICLOVIR
16.2.4.2.2. ABACAVIR
16.2.4.2.3. LOPINAVIR
16.2.4.2.4. OSELTAMIVIR
16.2.4.2.5. OTHERS
16.2.4.3. ANTIFUNGAL
16.2.4.3.1. CLOTRIMAZOLE
16.2.4.3.2. ITRACONAZOLE
16.2.4.3.3. NYSTATIN
16.2.4.3.4. VORICONAZOLE
16.2.4.3.5. FLUCONAZOLE
16.2.4.3.6. OTHERS
16.2.4.4. OTHERS
16.2.5 ANTI-INFLAMMATORY
16.2.5.1. DICLOFENAC
16.2.5.2. IBUPROFEN
16.2.5.3. NAPROXEN
16.2.5.4. PREDNISOLONE
16.2.5.5. OTHERS
16.2.6 DIURETICS
16.2.6.1. SPIRONOLACTONE
16.2.6.2. HYDROCHLOROTHIAZIDE
16.2.6.3. FUROSEMIDE
16.2.6.4. OTHERS
16.2.7 GASTROINTESTINAL
16.2.7.1. ESOMOPRAZOLE
16.2.7.2. OMEPRAZOLE
16.2.7.3. RANITIDINE
16.2.7.4. LOPERAMIDE
16.2.7.5. OTHERS
16.2.8 CARDIOVASCULAR
16.2.8.1. ATENOLOL
16.2.8.2. MOLSIDOMINE
16.2.8.3. DIGOXIN
16.2.8.4. VERAPAMIL
16.2.8.5. OTHERS
16.2.9 OTHERS
16.3 OVER THE COUNTER
16.3.1 ANTACIDS
16.3.1.1. ALUMINUM CARBONATE ANTACIDS
16.3.1.2. CALCIUM CARBONATE ANTACIDS
16.3.1.3. MAGNESIUM OXIDE ANTACIDS
16.3.1.4. SODIUM BICARBONATE ANTACIDS
16.3.1.5. SODIUM CITRATE ANTACIDS
16.3.1.6. ALUMINUM HYDROXIDE ANTACIDS
16.3.1.7. MAGNESIUM HYDROXIDE ANTACIDS
16.3.1.8. OTHERS
16.3.2 PAIN RELIEF
16.3.2.1. ASPIRIN
16.3.2.2. NAPROXEN
16.3.2.3. IBUPROFEN
16.3.2.4. ACETAMINOPHEN
16.3.2.5. OTHERS
16.3.3 VITAMINS
16.3.3.1. BIOTIN
16.3.3.2. FOLIC ACID
16.3.3.3. THIAMIN
16.3.3.4. RIBOFLAVIN
16.3.3.5. PANTOTHENIC ACID
16.3.3.6. ASCORBIC ACID
16.3.3.7. COBALAMIN
16.3.3.8. PYRIDOXINE
16.3.3.9. NIACIN
16.3.3.10. RETINOIDS AND CAROTENE
16.3.3.11. CHOLINE
16.3.3.12. CALCIFEROL
16.3.3.13. ALPHA-TOCOPHEROL
16.3.3.14. PHYLLOQUINONE
16.3.3.15. MENADIONE
16.3.3.16. OTHERS
16.3.4 MINERALS
16.3.4.1. CALCIUM
16.3.4.2. CHLORIDE
16.3.4.3. CHROMIUM
16.3.4.4. COPPER
16.3.4.5. FLUORIDE
16.3.4.6. IODINE
16.3.4.7. IRON
16.3.4.8. MAGNESIUM
16.3.4.9. MANGANESE
16.3.4.10. MOLYBDENUM
16.3.4.11. PHOSPHORUS
16.3.4.12. POTASSIUM
16.3.4.13. SELENIUM
16.3.4.14. SODIUM
16.3.4.15. SULFUR
16.3.4.16. ZINC
16.3.4.17. OTHERS
16.3.5 DIETARY SUPPLEMENTATION
16.3.5.1. FISH OIL
16.3.5.2. HYDROCIL
16.3.5.3. REGULOID
16.3.5.4. PSYLLIUM
16.3.5.5. METAMUCIL
16.3.5.6. OTHERS
16.3.6 OTHERS
17 GLOBAL E PHARMA MARKET, BY TYPE
17.1 OVERVIEW
17.2 IN-PATIENT DRUG
17.3 OUT-PATIENT DRUG
18 GLOBAL E PHARMA MARKET, BY DRUG TYPE
18.1 OVERVIEW
18.2 BRANDED
18.3 GENERIC
18.4 OTHERS
19 GLOBAL E PHARMA MARKET, BY THERAPEUTICS APPLICATION
19.1 OVERVIEW
19.2 ISCHEMIC HEART DISEASE
19.2.1 PRESCRIPTION MEDICINE
19.2.2 OVER THE COUNTER
19.3 CHRONIC OBSTRUCTIVE PULMONARY DISEASE
19.3.1 PRESCRIPTION MEDICINE
19.3.2 OVER THE COUNTER
19.4 DIARRHEAL DISEASES
19.4.1 PRESCRIPTION MEDICINE
19.4.2 OVER THE COUNTER
19.5 LOWER RESPIRATORY INFECTION
19.5.1 PRESCRIPTION MEDICINE
19.5.2 OVER THE COUNTER
19.6 CEREBROVASCULAR DISEASES
19.6.1 PRESCRIPTION MEDICINE
19.6.2 OVER THE COUNTER
19.7 IRON-DEFICIENCY ANAEMIA
19.7.1 PRESCRIPTION MEDICINE
19.7.2 OVER THE COUNTER
19.8 NEONATAL PRETERM BIRTH
19.8.1 PRESCRIPTION MEDICINE
19.8.2 OVER THE COUNTER
19.9 TUBERCULOSIS
19.9.1 PRESCRIPTION MEDICINE
19.9.2 OVER THE COUNTER
19.1 SENSE ORGAN DISEASES
19.10.1 PRESCRIPTION MEDICINE
19.10.2 OVER THE COUNTER
19.11 CANCER
19.11.1 PRESCRIPTION MEDICINE
19.11.2 OVER THE COUNTER
19.12 INJURIES
19.12.1 PRESCRIPTION MEDICINE
19.12.2 OVER THE COUNTER
19.13 OPHTHALMOLOGY
19.13.1 PRESCRIPTION MEDICINE
19.13.2 OVER THE COUNTER
19.14 DERMATOLOGY
19.14.1 PRESCRIPTION MEDICINE
19.14.2 OVER THE COUNTER
19.15 NEUROLOGY
19.15.1 PRESCRIPTION MEDICINE
19.15.2 OVER THE COUNTER
19.16 ENDOCRINOLOGY
19.16.1 PRESCRIPTION MEDICINE
19.16.2 OVER THE COUNTER
19.17 GASTROINTESTINAL DISORDERS
19.17.1 PRESCRIPTION MEDICINE
19.17.2 OVER THE COUNTER
19.18 AUTOIMMUNE
19.18.1 PRESCRIPTION MEDICINE
19.18.2 OVER THE COUNTER
19.19 OTHERS
20 GLOBAL E PHARMA MARKET, BY ROUTE OF ADMINISTRATION
20.1 OVERVIEW
20.2 ORAL
20.2.1 TABLETS
20.2.2 CAPSULES
20.2.3 POWDER
20.2.4 PILLS
20.2.5 SYRUPS
20.2.6 OTHERS
20.3 TOPICAL
20.3.1 SOLUTIONS
20.3.2 CREAM
20.3.3 OINTMENT
20.3.4 GELS
20.3.5 LOTIONS
20.3.6 POWDERS
20.3.7 OTHERS
20.4 PARENTERAL
20.5 INTRANASAL
20.5.1 DROPS
20.5.2 SPRAYS
20.5.3 POWDERS
20.5.4 GELS
20.5.5 OTHERS
20.6 OCULAR
20.6.1 EYE DROPS
20.6.2 SPRAYS
20.6.3 OINTMENTS
20.6.4 OTHERS
20.7 OTHERS
21 GLOBAL E PHARMA MARKET, BY MODEL TYPE
21.1 OVERVIEW
21.2 INVENTORY-BASED MODEL
21.3 MARKETPLACE-BASED MODEL
21.4 GENERIC ECOMMERCE MODEL
22 GLOBAL E PHARMA MARKET, BY END USER
22.1 OVERVIEW
22.2 B2B
22.2.1 PHYSICIANS
22.2.2 CLINICS
22.2.3 HOSPITALS
22.2.4 HMO'S
22.2.5 PHARMACEUTICAL COMPANIES
22.2.6 OTHERS
22.3 B2C
23 GLOBAL E PHARMA MARKET, BY GEOGRAPHY
GLOBAL E PHARMA MARKET, (ALL SEGMENTATION PROVIDED ABOVE IS REPRESENTED IN THIS CHAPTER BY COUNTRY)
23.1 NORTH AMERICA
23.1.1 U.S.
23.1.2 CANADA
23.1.3 MEXICO
23.2 EUROPE
23.2.1 GERMANY
23.2.2 FRANCE
23.2.3 U.K.
23.2.4 HUNGARY
23.2.5 LITHUANIA
23.2.6 AUSTRIA
23.2.7 IRELAND
23.2.8 NORWAY
23.2.9 POLAND
23.2.10 ITALY
23.2.11 SPAIN
23.2.12 RUSSIA
23.2.13 TURKEY
23.2.14 NETHERLANDS
23.2.15 SWITZERLAND
23.2.16 REST OF EUROPE
23.3 ASIA-PACIFIC
23.3.1 JAPAN
23.3.2 CHINA
23.3.3 TAIWAN
23.3.4 SOUTH KOREA
23.3.5 INDIA
23.3.6 AUSTRALIA
23.3.7 SINGAPORE
23.3.8 THAILAND
23.3.9 MALAYSIA
23.3.10 INDONESIA
23.3.11 PHILIPPINES
23.3.12 VIETNAM
23.3.13 REST OF ASIA-PACIFIC
23.4 SOUTH AMERICA
23.4.1 BRAZIL
23.4.2 ECUADOR
23.4.3 CHILE
23.4.4 COLOMBIA
23.4.5 VENEZUELA
23.4.6 ARGENTINA
23.4.7 PERU
23.4.8 CURAÇAO
23.4.9 PARAGUAY
23.4.10 URUGUAY
23.4.11 TRINIDAD AND TOBAGO
23.4.12 REST OF SOUTH AMERICA
23.5 MIDDLE EAST AND AFRICA
23.5.1 SOUTH AFRICA
23.5.2 SAUDI ARABIA
23.5.3 UAE
23.5.4 EGYPT
23.5.5 KUWAIT
23.5.6 ISRAEL
23.5.7 BOLIVIA
23.5.8 REST OF MIDDLE EAST AND AFRICA
23.6 CENTRAL AMERICA
23.6.1 COSTA RICA
23.6.2 HONDURAS
23.6.3 EL SALVADOR
23.6.4 GUATEMALA
23.6.5 NICARAGUA
23.6.6 REST OF CENTRAL AMERICA
23.7 KEY PRIMARY INSIGHTS: BY MAJOR COUNTRIES
24 GLOBAL E PHARMA MARKET, SWOT AND DBMR ANALYSIS
25 GLOBAL E PHARMA MARKET, COMPANY LANDSCAPE
25.1 COMPANY SHARE ANALYSIS: GLOBAL
25.2 COMPANY SHARE ANALYSIS: NORTH AMERICA
25.3 COMPANY SHARE ANALYSIS: EUROPE
25.4 COMPANY SHARE ANALYSIS: ASIA-PACIFIC
25.5 MERGERS & ACQUISITIONS
25.6 NEW PRODUCT DEVELOPMENT & APPROVALS
25.7 EXPANSIONS
25.8 REGULATORY CHANGES
25.9 PARTNERSHIP AND OTHER STRATEGIC DEVELOPMENTS
26 GLOBAL E PHARMA MARKET, COMPANY PROFILE
26.1 CVS HEALTH
26.1.1 COMPANY OVERVIEW
26.1.2 REVENUE ANALYSIS
26.1.3 GEOGRAPHIC PRESENCE
26.1.4 PRODUCT PORTFOLIO
26.1.5 RECENT DEVELOPMENTS
26.2 SHOP APOTHEKE EUROPE N.V.
26.2.1 COMPANY OVERVIEW
26.2.2 REVENUE ANALYSIS
26.2.3 GEOGRAPHIC PRESENCE
26.2.4 PRODUCT PORTFOLIO
26.2.5 RECENT DEVELOPMENTS
26.3 ZUR ROSE GROUP AG
26.3.1 COMPANY OVERVIEW
26.3.2 REVENUE ANALYSIS
26.3.3 GEOGRAPHIC PRESENCE
26.3.4 PRODUCT PORTFOLIO
26.3.5 RECENT DEVELOPMENTS
26.4 WALGREENS BOOTS ALLIANCE, INC.
26.4.1 COMPANY OVERVIEW
26.4.2 REVENUE ANALYSIS
26.4.3 GEOGRAPHIC PRESENCE
26.4.4 PRODUCT PORTFOLIO
26.4.5 RECENT DEVELOPMENTS
26.5 FEDEX
26.5.1 COMPANY OVERVIEW
26.5.2 REVENUE ANALYSIS
26.5.3 GEOGRAPHIC PRESENCE
26.5.4 PRODUCT PORTFOLIO
26.5.5 RECENT DEVELOPMENTS
26.6 WALMART
26.6.1 COMPANY OVERVIEW
26.6.2 REVENUE ANALYSIS
26.6.3 GEOGRAPHIC PRESENCE
26.6.4 PRODUCT PORTFOLIO
26.6.5 RECENT DEVELOPMENTS
26.7 THE BOOTS COMPANY PLC
26.7.1 COMPANY OVERVIEW
26.7.2 REVENUE ANALYSIS
26.7.3 GEOGRAPHIC PRESENCE
26.7.4 PRODUCT PORTFOLIO
26.7.5 RECENT DEVELOPMENTS
26.8 SUPERDOG
26.8.1 COMPANY OVERVIEW
26.8.2 REVENUE ANALYSIS
26.8.3 GEOGRAPHIC PRESENCE
26.8.4 PRODUCT PORTFOLIO
26.8.5 RECENT DEVELOPMENTS
26.9 APO-ROT
26.9.1 COMPANY OVERVIEW
26.9.2 REVENUE ANALYSIS
26.9.3 GEOGRAPHIC PRESENCE
26.9.4 PRODUCT PORTFOLIO
26.9.5 RECENT DEVELOPMENTS
26.1 HOLLAND & BARRETT RETAIL LIMITED
26.10.1 COMPANY OVERVIEW
26.10.2 REVENUE ANALYSIS
26.10.3 GEOGRAPHIC PRESENCE
26.10.4 PRODUCT PORTFOLIO
26.10.5 RECENT DEVELOPMENTS
26.11 EXPRESS SCRIPTS HOLDING COMPANY
26.11.1 COMPANY OVERVIEW
26.11.2 REVENUE ANALYSIS
26.11.3 GEOGRAPHIC PRESENCE
26.11.4 PRODUCT PORTFOLIO
26.11.5 RECENT DEVELOPMENTS
26.12 LLOYDSPHARMACY
26.12.1 COMPANY OVERVIEW
26.12.2 REVENUE ANALYSIS
26.12.3 GEOGRAPHIC PRESENCE
26.12.4 PRODUCT PORTFOLIO
26.12.5 RECENT DEVELOPMENTS
26.13 PHARMACY2U LTD
26.13.1 COMPANY OVERVIEW
26.13.2 REVENUE ANALYSIS
26.13.3 GEOGRAPHIC PRESENCE
26.13.4 PRODUCT PORTFOLIO
26.13.5 RECENT DEVELOPMENTS
26.14 MEDIKAMENTE-PER-KLICK
26.14.1 COMPANY OVERVIEW
26.14.2 REVENUE ANALYSIS
26.14.3 GEOGRAPHIC PRESENCE
26.14.4 PRODUCT PORTFOLIO
26.14.5 RECENT DEVELOPMENTS
26.15 MEDPEX
26.15.1 COMPANY OVERVIEW
26.15.2 REVENUE ANALYSIS
26.15.3 GEOGRAPHIC PRESENCE
26.15.4 PRODUCT PORTFOLIO
26.15.5 RECENT DEVELOPMENTS
26.16 APONEO
26.16.1 COMPANY OVERVIEW
26.16.2 REVENUE ANALYSIS
26.16.3 GEOGRAPHIC PRESENCE
26.16.4 PRODUCT PORTFOLIO
26.16.5 RECENT DEVELOPMENTS
26.17 SANTÉDISCOUNT
26.17.1 COMPANY OVERVIEW
26.17.2 REVENUE ANALYSIS
26.17.3 GEOGRAPHIC PRESENCE
26.17.4 PRODUCT PORTFOLIO
26.17.5 RECENT DEVELOPMENTS
26.18 PHARMA GDD
26.18.1 COMPANY OVERVIEW
26.18.2 REVENUE ANALYSIS
26.18.3 GEOGRAPHIC PRESENCE
26.18.4 PRODUCT PORTFOLIO
26.18.5 RECENT DEVELOPMENTS
26.19 NEWPHARMA SRL
26.19.1 COMPANY OVERVIEW
26.19.2 REVENUE ANALYSIS
26.19.3 GEOGRAPHIC PRESENCE
26.19.4 PRODUCT PORTFOLIO
26.19.5 RECENT DEVELOPMENTS
26.2 EFARMA
26.20.1 COMPANY OVERVIEW
26.20.2 REVENUE ANALYSIS
26.20.3 GEOGRAPHIC PRESENCE
26.20.4 PRODUCT PORTFOLIO
26.20.5 RECENT DEVELOPMENTS
26.21 SHOP FARMACIA
26.21.1 COMPANY OVERVIEW
26.21.2 REVENUE ANALYSIS
26.21.3 GEOGRAPHIC PRESENCE
26.21.4 PRODUCT PORTFOLIO
26.21.5 RECENT DEVELOPMENTS
26.22 IAF NETWORK S.P.A.
26.22.1 COMPANY OVERVIEW
26.22.2 REVENUE ANALYSIS
26.22.3 GEOGRAPHIC PRESENCE
26.22.4 PRODUCT PORTFOLIO
26.22.5 RECENT DEVELOPMENTS
26.23 AMAVITA PHARMACIES
26.23.1 COMPANY OVERVIEW
26.23.2 REVENUE ANALYSIS
26.23.3 GEOGRAPHIC PRESENCE
26.23.4 PRODUCT PORTFOLIO
26.23.5 RECENT DEVELOPMENTS
26.24 PROMOFARMA ECOM, S.L.
26.24.1 COMPANY OVERVIEW
26.24.2 REVENUE ANALYSIS
26.24.3 GEOGRAPHIC PRESENCE
26.24.4 PRODUCT PORTFOLIO
26.24.5 RECENT DEVELOPMENTS
26.25 EAPTEKA
26.25.1 COMPANY OVERVIEW
26.25.2 REVENUE ANALYSIS
26.25.3 GEOGRAPHIC PRESENCE
26.25.4 PRODUCT PORTFOLIO
26.25.5 RECENT DEVELOPMENTS
26.26 1 MG
26.26.1 COMPANY OVERVIEW
26.26.2 REVENUE ANALYSIS
26.26.3 GEOGRAPHIC PRESENCE
26.26.4 PRODUCT PORTFOLIO
26.26.5 RECENT DEVELOPMENTS
26.27 APOLLO 247
26.27.1 COMPANY OVERVIEW
26.27.2 REVENUE ANALYSIS
26.27.3 GEOGRAPHIC PRESENCE
26.27.4 PRODUCT PORTFOLIO
26.27.5 RECENT DEVELOPMENTS
26.28 PHARMEASY
26.28.1 COMPANY OVERVIEW
26.28.2 REVENUE ANALYSIS
26.28.3 GEOGRAPHIC PRESENCE
26.28.4 PRODUCT PORTFOLIO
26.28.5 RECENT DEVELOPMENTS
26.29 NETMEDS
26.29.1 COMPANY OVERVIEW
26.29.2 REVENUE ANALYSIS
26.29.3 GEOGRAPHIC PRESENCE
26.29.4 PRODUCT PORTFOLIO
26.29.5 RECENT DEVELOPMENTS
NOTE: THE COMPANIES PROFILED IS NOT EXHAUSTIVE LIST AND IS AS PER OUR PREVIOUS CLIENT REQUIREMENT. WE PROFILE MORE THAN 100 COMPANIES IN OUR STUDY AND HENCE THE LIST OF COMPANIES CAN BE MODIFIED OR REPLACED ON REQUEST
27 RELATED REPORTS
28 CONCLUSION
29 QUESTIONNAIRE
30 ABOUT DATA BRIDGE MARKET RESEARCH
Data collection and base year analysis are done using data collection modules with large sample sizes. The stage includes obtaining market information or related data through various sources and strategies. It includes examining and planning all the data acquired from the past in advance. It likewise envelops the examination of information inconsistencies seen across different information sources. The market data is analysed and estimated using market statistical and coherent models. Also, market share analysis and key trend analysis are the major success factors in the market report. To know more, please request an analyst call or drop down your inquiry.
The key research methodology used by DBMR research team is data triangulation which involves data mining, analysis of the impact of data variables on the market and primary (industry expert) validation. Data models include Vendor Positioning Grid, Market Time Line Analysis, Market Overview and Guide, Company Positioning Grid, Patent Analysis, Pricing Analysis, Company Market Share Analysis, Standards of Measurement, Global versus Regional and Vendor Share Analysis. To know more about the research methodology, drop in an inquiry to speak to our industry experts.
Data Bridge Market Research is a leader in advanced formative research. We take pride in servicing our existing and new customers with data and analysis that match and suits their goal. The report can be customized to include price trend analysis of target brands understanding the market for additional countries (ask for the list of countries), clinical trial results data, literature review, refurbished market and product base analysis. Market analysis of target competitors can be analyzed from technology-based analysis to market portfolio strategies. We can add as many competitors that you require data about in the format and data style you are looking for. Our team of analysts can also provide you data in crude raw excel files pivot tables (Fact book) or can assist you in creating presentations from the data sets available in the report.


