
 Market Analysis and Insights of Foam Insulation Market
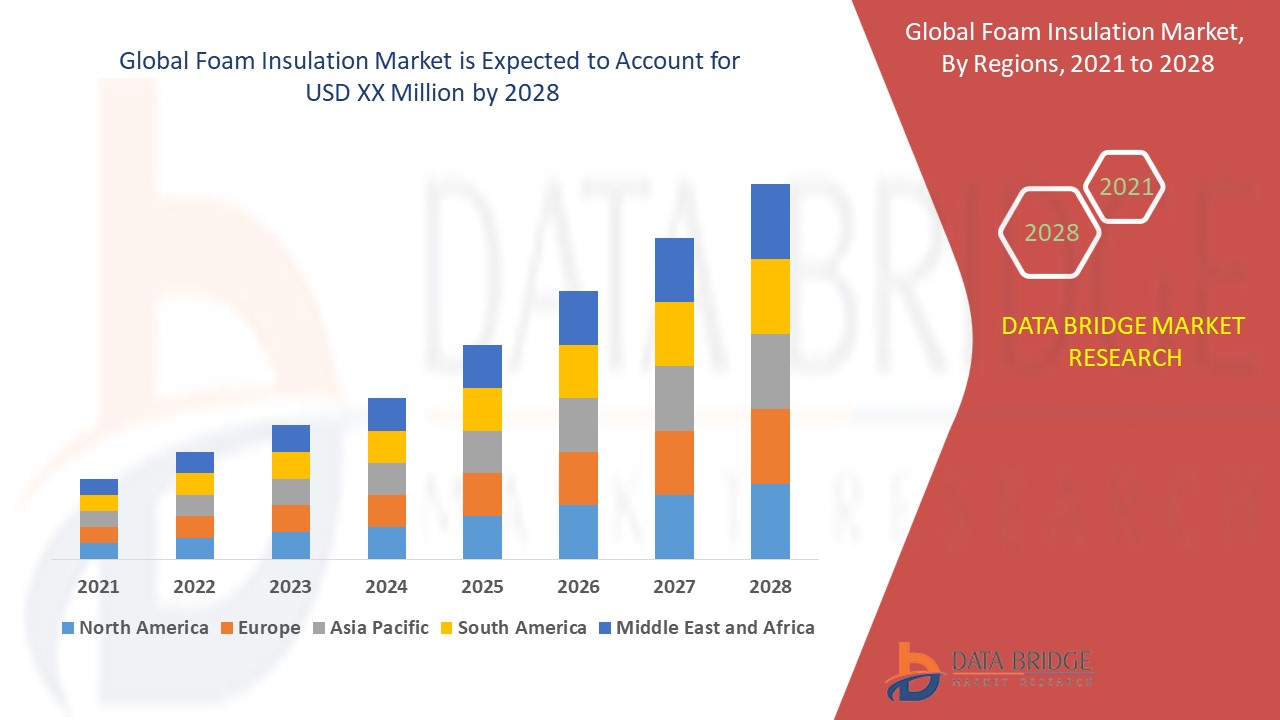
Rising urbanization and industrialization as a result have led to the rise in demand for foam insulation especially in the developing economies. Data Bridge Market Research analyses that the foam insulation market will witness a CAGR of 5.09% for the forecast period of 2021-2028.
Foam insulators are used in buildings or structures and to fill in the gaps or cracks to reduce the rate of heat transfer and air filtration. A foam insulator is a barrier material that is used to seals the walls, ceilings, floor cavities, and areas around electrical outlets, switchboards, and walls where doors and windows meet. Foam insulation is the most widely used type of insulation and is categorized into polystyrene foam, polyurethane foam, polyolefin foam, phenolic foam, elastomeric foam, and others. Spray foam is the most common technique of getting foam insulation. Spray foams never lose their shape, unlike other conventional insulation chemicals or materials. However, foam insulation must be done with proper protective gear and equipment. This is because the chemicals used in foam insulation can be dangerous and pose serious health risks. Therefore, professionals must be hired for the job.
Rising modernization, urbanization, and infrastructural development have propelled the growth in demand for foam insulation, especially in developing countries. The rise in the construction activities or expansion of buildings and the construction industry has fostered growth in demand for foam insulation. The rise in the demand for polystyrene foams has conclusively as a whole boosted up the foam insulation market value. Focus on the reduction of greenhouse gas emissions and stringent regulations imposed by the government in this regard will further create lucrative foam insulation market growth opportunities. Also, a rise in demand for foam insulation by the various end-user industries will further propel the growth of the market.
However, still, lack of awareness about the low and middle-class economies will derail the foam insulation market growth rate. Stringent regulations imposed on the use of certain chemicals and materials will further create hindrances in the way of foam insulation market growth. Volatility in the prices of raw materials like crude oil will further pose a big-time challenge to the foam insulation market growth. Moreover, the high cost of foam insulation as compared to loose-film insulations will demote the market growth.
This foam insulation market report provides details of new recent developments, trade regulations, import export analysis, production analysis, value chain optimization, market share, impact of domestic and localised market players, analyses opportunities in terms of emerging revenue pockets, changes in market regulations, strategic market growth analysis, market size, category market growths, application niches and dominance, product approvals, product launches, geographical expansions, technological innovations in the market. To gain more info on foam insulation market contact Data Bridge Market Research for an Analyst Brief, our team will help you take an informed market decision to achieve market growth.
Global Foam Insulation Market Scope and Market Size
The foam insulation market is segmented on the basis of type and end users. The growth amongst the different segments helps you in attaining the knowledge related to the different growth factors expected to be prevalent throughout the market and formulate different strategies to help identify core application areas and the difference in your target market.
- On the basis of type, the foam insulation market is segmented into polystyrene foam, polyurethane and polyisocyanurate foam, polyolefin foam, phenolic foam, elastomeric foam and others. Polystyrene foam is further sub-segmented into expanded polystyrene and extruded polystyrene.
- On the basis of end users, the foam insulation market is segmented into building and construction, consumer appliances, transport, and others.
Global Foam Insulation Market Country Level Analysis
The foam insulation market is analysed and market size, volume information is provided by country, type and end users as referenced above.
The countries covered in the foam insulation market report are U.S., Canada and Mexico in North America, Germany, France, U.K., Netherlands, Switzerland, Belgium, Russia, Italy, Spain, Turkey, Rest of Europe in Europe, China, Japan, India, South Korea, Singapore, Malaysia, Australia, Thailand, Indonesia, Philippines, Rest of Asia-Pacific (APAC) in the Asia-Pacific (APAC), Saudi Arabia, U.A.E, Israel, Egypt, South Africa, Rest of Middle East and Africa (MEA) as a part of Middle East and Africa (MEA), Brazil, Argentina and Rest of South America as part of South America.
North America dominates the market and will continue to during the forecast period. This is because of the growing reconstruction and renovation activities across countries in this region. Stringent regulations to meet the codes of building and construction activities are further propelling the market growth. Asia-Pacific on the other hand is projected to undergo highest growth rate during the forecast period. Rapid industrialization and urbanization are responsible for this. Growth and expansion of transportation industry is another growth determinant.
The country section of the foam insulation market report also provides individual market impacting factors and changes in regulation in the market domestically that impacts the current and future trends of the market. Data points such as consumption volumes, production sites and volumes, import export analysis, price trend analysis, cost of raw materials, down-stream and upstream value chain analysis are some of the major pointers used to forecast the market scenario for individual countries. Also, presence and availability of global brands and their challenges faced due to large or scarce competition from local and domestic brands, impact of domestic tariffs and trade routes are considered while providing forecast analysis of the country data.
Competitive Landscape and Foam Insulation Market Share Analysis
The foam insulation market competitive landscape provides details by competitor. Details included are company overview, company financials, revenue generated, market potential, investment in research and development, new market initiatives, global presence, production sites and facilities, production capacities, company strengths and weaknesses, product launch, product width and breadth, application dominance. The above data points provided are only related to the companies’ focus related to foam insulation market.
The major players covered in the foam insulation market report are BASF SE, Dow, Covestro AG, Huntsman International LLC., Lapolla Industries, Inc., SAFCO Foam Insulation, CAJUN FOAM INSULATION., Saint-Gobain Group., EnergyGuard Foam Insulators, LP, Insulation Northwest, PUFF INC, Pittsburgh Foam Insulation, Owens Corning., Recticel, Armacell, Kingspan Group, Johns Manville., Berkshire Hathaway Inc., ISOTHANE LTD and Evonik Industries AG among other domestic and global players. Market share data is available for global, North America, Europe, Asia-Pacific (APAC), Middle East and Africa (MEA) and South America separately. DBMR analysts understand competitive strengths and provide competitive analysis for each competitor separately.
SKU-

- Interactive Data Analysis Dashboard
- Company Analysis Dashboard for high growth potential opportunities
- Research Analyst Access for customization & queries
- Competitor Analysis with Interactive dashboard
- Latest News, Updates & Trend analysis
- Harness the Power of Benchmark Analysis for Comprehensive Competitor Tracking
Table of Content
TABLE OF CONTENTS GLOBAL FOAM INSULATION MARKET
1.INTRODUCTION
1.1.OBJECTIVES OF THE STUDY 1.2.MARKET DEFINITION 1.3.OVERVIEW OF GLOBAL FOAM INSULATION MARKET 1.4.CURRENCY AND PRICING 1.5.LIMITATION 1.6.MARKETS COVERED
2.MARKET SEGMENTATION
2.1.MARKETS COVERED 2.2.YEARS CONSIDERED FOR THE STUDY 2.3.CURRENCY AND PRICING 2.4.RESEARCH METHODOLOGY 2.5.PRIMARY INTERVIEWS WITH KEY OPINION LEADERS 2.6.SECONDARY SOURCES 2.7.ASSUMPTIONS
3.MARKET OVERVIEW
3.1.DRIVERS
3.1.1.INCREASING RESEARCH AND DEVELOPMENT 3.1.2.REDUCTION IN GREENHOUSE GAS EMISSIONS 3.1.3.INCREASING DEMAND FOR ENERGY-EFFICIENT EQUIPMENT
3.2.RESTRAINTS
3.2.1.HIGH COST OF FOAM INSULATION PRODUCTS
3.3.OPPORTUNITIES
3.3.1.INCREASING INDUSTRIALIZATION GLOBALLY
3.4.CHALLENGES
3.4.1.ISSUES RELATED WITH ALUMINIUM FOAM SOLDERING ISSUE 3.4.2.LACK OF SKILLED LABORS FOR PROPER USAGE OF FOAM INSULATING PRODUCTS
4.EXECUTIVE SUMMARY 5.PREMIUM INSIGHTS 6.GLOBAL FOAM INSULATION MARKET, BY PRODUCT TYPE
6.1.OVERVIEW
6.2.POLYSTYRENE FOAM
6.2.1.EXPANDED POLYSTYRENE 6.2.2.EXTRUDED POLYSTYRENE
6.3.POLYURETHANE FOAM
6.3.1.LIQUID SPRAYED FOAM 6.3.2.RIGID FOAM BOARD 6.4.POLYISOCYANURATE FOAM 6.5.POLYOLEFIN FOAM 6.6.ELASTOMERIC FOAM 6.7.PHENOLIC FOAM
7.GLOBAL FOAM INSULATION MARKET, BY END USER
7.1.OVERVIEW 7.2.BUILDING & CONSTRUCTION 7.3.TRANSPORTATION 7.4.CONSUMER APPLIANCES 7.5.OTHERS
8.GLOBAL FOAM INSULATION MARKET, BY GEOGRAPHY
8.1.OVERVIEW
8.2.NORTH AMERICA
8.2.1.U.S. 8.2.2.CANADA 8.2.3.MEXICO
8.3.EUROPE
8.3.1.GERMANY 8.3.2.FRANCE 8.3.3.U.K. 8.3.4.RUSSIA 8.3.5.SPAIN 8.3.6.ITALY 8.3.7.NETHERLANDS 8.3.8.BELGIUM 8.3.9.TURKEY 8.3.10.SWITZERLAND 8.3.11.REST OF EUROPE
8.4.ASIA-PACIFIC
8.4.1.CHINA 8.4.2.JAPAN 8.4.3.INDIA 8.4.4.AUSTRALIA 8.4.5.SOUTH KOREA 8.4.6.INDONESIA 8.4.7.MALAYSIA 8.4.8.SINGAPORE 8.4.9.THAILAND 8.4.10.PHILIPPINES 8.4.11.REST OF ASIA PACIFIC
8.5.SOUTH AMERICA
8.5.1.BRAZIL 8.5.2.REST OF SOUTH AMERICA 8.6.MIDDLE EAST AND AFRICA 8.6.1.SOUTH AFRICA 8.6.2.REST OF MIDDLE EAST AND AFRICA
9.GLOBAL FOAM INSULATION MARKET, COMPANY LANDSCAPE
9.1.COMPANY SHARE ANALYSIS: GLOBAL 9.2.COMPANY SHARE ANALYSIS: NORTH AMERICA 9.3.COMPANY SHARE ANALYSIS: EUROPE 9.4.COMPANY SHARE ANALYSIS: ASIA-PACIFIC
10.COMPANY PROFILES
10.1.BASF SE
10.1.1.COMPANY OVERVIEW 10.1.2.REVENUE ANALYSIS 10.1.3.PRODUCT PORTFOLIO 10.1.4.RECENT DEVELOPMENTS
10.2.THE DOW CHEMICAL COMPANY
10.2.1.COMPANY OVERVIEW 10.2.2.REVENUE ANALYSIS 10.2.3.PRODUCT PORTFOLIO 10.2.4.RECENT DEVELOPMENTS
10.3.COVESTRO AG
10.3.1.COMPANY OVERVIEW 10.3.2.REVENUE ANALYSIS 10.3.3.PRODUCT PORTFOLIO 10.3.4.RECENT DEVELOPMENTS
10.4.HUNTSMAN CORPORATION
10.4.1.COMPANY OVERVIEW 10.4.2.REVENUE ANALYSIS 10.4.3.PRODUCT PORTFOLIO 10.4.4.RECENT DEVELOPMENTS
10.5.KINGSPAN GROUP
10.5.1.COMPANY OVERVIEW 10.5.2.REVENUE ANALYSIS 10.5.3.PRODUCT PORTFOLIO 10.5.4.RECENT DEVELOPMENTS
10.6.LAPOLLA INDUSTRIES, INC.
10.6.1.COMPANY OVERVIEW 10.6.2.REVENUE ANALYSIS 10.6.3.PRODUCT PORTFOLIO 10.6.4.RECENT DEVELOPMENTS
10.7.OWENS CORNING
10.7.1.COMPANY OVERVIEW 10.7.2.REVENUE ANALYSIS 10.7.3.PRODUCT PORTFOLIO 10.7.4.RECENT DEVELOPMENTS
10.8.SAINT-GOBAIN
10.8.1.COMPANY OVERVIEW 10.8.2.REVENUE ANALYSIS 10.8.3.PRODUCT PORTFOLIO 10.8.4.RECENT DEVELOPMENTS
10.9.RECTICEL GROUP
10.9.1.COMPANY OVERVIEW 10.9.2.REVENUE ANALYSIS 10.9.3.PRODUCT PORTFOLIO 10.9.4.RECENT DEVELOPMENTS
10.10.ARMACELL INTERNATIONAL SA
10.10.1.COMPANY OVERVIEW 10.10.2.REVENUE ANALYSIS 10.10.3.PRODUCT PORTFOLIO 10.10.4.RECENT DEVELOPMENTS
10.11.JOHNS MANVILLE
10.11.1.COMPANY OVERVIEW 10.11.2.COMPANY SNAPSHOT 10.11.3.PRODUCT PORTFOLIO 10.11.4.RECENT DEVELOPMENTS
10.12.DEMILEC USA, INC.
10.12.1.COMPANY OVERVIEW 10.12.2.COMPANY SNAPSHOT 10.12.3.PRODUCT PORTFOLIO 10.12.4.RECENT DEVELOPMENTS
10.13.ICYNENE
10.13.1.COMPANY OVERVIEW 10.13.2.COMPANY SNAPSHOT 10.13.3.PRODUCT PORTFOLIO 10.13.4.RECENT DEVELOPMENTS
11.RELATED REPORTS
List of Table
LIST OF TABLE GLOBAL FOAM INSULATION MARKET
TABLE 1 GLOBAL FOAM INSULATION MARKET, BY PRODUCT TYPE, 2015 – 2024 (USD MILLION) TABLE 2 GLOBAL POLYSTYRENE FOAM MARKET, BY TYPE, 2015 – 2024 (USD MILLION) TABLE 3 GLOBAL POLYURETHANE FOAM MARKET, BY TYPE, 2015 – 2024 (USD MILLION) TABLE 4 GLOBAL POLYSTYRENE FOAM MARKET, BY REGION, 2015-2024 (USD MILLION) TABLE 5 GLOBAL EXPANDED POLYSTYRENE MARKET, BY REGION, 2015-2024 (USD MILLION) TABLE 6 GLOBAL EXTRUDED POLYSTYRENE MARKET, BY REGION, 2015-2024 (USD MILLION) TABLE 7 GLOBAL POLYURETHANE FOAM MARKET, BY REGION, 2015-2024 (USD MILLION) TABLE 8 GLOBAL LIQUID SPRAYED FOAM MARKET, BY REGION, 2015-2024 (USD MILLION) TABLE 9 GLOBAL RIGID FOAM BOARD MARKET, BY REGION, 2015-2024 (USD MILLION) TABLE 10 GLOBAL POLYISOCYANURATE FOAM MARKET, BY REGION, 2015-2024 (USD MILLION) TABLE 11 GLOBAL POLYOLEFIN FOAM MARKET, BY REGION, 2015-2024 (USD MILLION) TABLE 12 GLOBAL ELASTOMERIC FOAM MARKET, BY REGION, 2015-2024 (USD MILLION) TABLE 13 GLOBAL PHENOLIC FOAM MARKET, BY REGION, 2015-2024 (USD MILLION) TABLE 14 GLOBAL FOAM INSULATION MARKET, BY END USER, 2015 – 2024 (USD MILLION) TABLE 15 GLOBAL BUILDING & CONSTRUCTION, BY REGION, 2015-2024 (USD MILLION) TABLE 16 GLOBAL TRANSPORTATION MARKET, BY REGION, 2015-2024 (USD MILLION) TABLE 17 GLOBAL CONSUMER APPLIANCES MARKET, BY REGION, 2015-2024 (USD MILLION) TABLE 18 GLOBAL OTHERS MARKET, BY REGION, 2015-2024 (USD MILLION) TABLE 19 GLOBAL FOAM INSULATION MARKET, BY GEOGRAPHY, 2015 – 2024 (USD MILLION) TABLE 20 NORTH AMERICA FOAM INSULATIONMARKET, BY COUNTRY 2015 – 2024 (USD MILLION) TABLE 21 NORTH AMERICA FOAM INSULATIONMARKET, BY PRODUCT TYPE, 2015-2024 (USD MILLION) TABLE 22 NORTH AMERICA POLYSTYRENE FOAM MARKET, BY TYPE, 2015 – 2024 (USD MILLION) TABLE 23 NORTH AMERICA POLYURETHANE FOAM MARKET, BY TYPE 2015 – 2024 (USD MILLION) TABLE 24 NORTH AMERICA FOAM INSULATION MARKET, BY END USER, 2015 – 2024 (USD MILLION) TABLE 25 U.S. FOAM INSULATIONMARKET, BY PRODUCT TYPE, 2015-2024 (USD MILLION) TABLE 26 U.S. POLYSTYRENE FOAM MARKET, BY TYPE 2015 – 2024 (USD MILLION) TABLE 27 U.S. POLYURETHANE FOAM MARKET, BY TYPE 2015 – 2024 (USD MILLION) TABLE 28 U.S. FOAM INSULATION MARKET, BY END USER, 2015 – 2024 (USD MILLION) TABLE 29 CANADA FOAM INSULATIONMARKET, BY PRODUCT TYPE 2015-2024 (USD MILLION) TABLE 30 CANADA POLYSTYRENE FOAM MARKET, BY TYPE 2015 – 2024 (USD MILLION) TABLE 31 CANADA POLYURETHANE FOAM MARKET, BY TYPE 2015 – 2024 (USD MILLION) TABLE 32 CANADA FOAM INSULATION MARKET, BY END USER, 2015 – 2024 (USD MILLION) TABLE 33 MEXICO FOAM INSULATION MARKET, BY PRODUCT TYPE 2015-2024 (USD MILLION) TABLE 34 MEXICO POLYSTYRENE FOAM MARKET, BY TYPE 2015 – 2024 (USD MILLION) TABLE 35 MEXICO POLYURETHANE FOAM MARKET, BY TYPE 2015 – 2024 (USD MILLION) TABLE 36 MEXICO FOAM INSULATION MARKET, BY END USER, 2015 – 2024 (USD MILLION) TABLE 37 EUROPE FOAM INSULATION MARKET, BY COUNTRY, 2015 – 2024 (USD MILLION) TABLE 38 EUROPE FOAM INSULATION MARKET, BY PRODUCT TYPE 2015-2024 (USD MILLION) TABLE 39 EUROPE POLYSTYRENE FOAM MARKET, BY TYPE 2015 – 2024 (USD MILLION) TABLE 40 EUROPE POLYURETHANE FOAM MARKET, BY TYPE 2015 – 2024 (USD MILLION) TABLE 41 EUROPE FOAM INSULATION MARKET, BY END USER, 2015 – 2024 (USD MILLION) TABLE 42 GERMANY FOAM INSULATIONMARKET, BY PRODUCT TYPE 2015-2024 (USD MILLION) TABLE 43 GERMANY POLYSTYRENE FOAM MARKET, BY TYPE 2015 – 2024 (USD MILLION) TABLE 44 GERMANY POLYURETHANE FOAM MARKET, BY TYPE 2015 – 2024 (USD MILLION) TABLE 45 GERMANY FOAM INSULATION MARKET, BY END USER, 2015 – 2024 (USD MILLION) TABLE 46 FRANCE FOAM INSULATIONMARKET, BY PRODUCT TYPE 2015-2024 (USD MILLION) TABLE 47 FRANCE POLYSTYRENE FOAM MARKET, BY TYPE 2015 – 2024 (USD MILLION) TABLE 48 FRANCE POLYURETHANE FOAM MARKET, BY TYPE 2015 – 2024 (USD MILLION) TABLE 49 FRANCE FOAM INSULATION MARKET, BY END USER, 2015 – 2024 (USD MILLION) TABLE 50 U.K. FOAM INSULATION MARKET, BY PRODUCT TYPE, 2015-2024 (USD MILLION) TABLE 51 U.K. POLYSTYRENE FOAM MARKET, BY TYPE 2015 – 2024 (USD MILLION) TABLE 52 U.K. POLYURETHANE FOAM MARKET, BY TYPE 2015 – 2024 (USD MILLION) TABLE 53 U.K. FOAM INSULATION MARKET, BY END USER, 2015 – 2024 (USD MILLION) TABLE 54 RUSSIA FOAM INSULATION MARKET, BY PRODUCT TYPE, 2015-2024 (USD MILLION) TABLE 55 RUSSIA POLYSTYRENE FOAM MARKET, BY TYPE 2015 – 2024 (USD MILLION) TABLE 56 RUSSIA POLYURETHANE FOAM MARKET, BY TYPE 2015 – 2024 (USD MILLION) TABLE 57 RUSSIA FOAM INSULATION MARKET, BY END USER, 2015 – 2024 (USD MILLION) TABLE 58 SPAIN FOAM INSULATIONMARKET, BY PRODUCT TYPE, 2015-2024 (USD MILLION) TABLE 59 SPAIN POLYSTYRENE FOAM MARKET, BY TYPE 2015 – 2024 (USD MILLION) TABLE 60 SPAIN POLYURETHANE FOAM MARKET, BY TYPE, 2015 – 2024 (USD MILLION) TABLE 61 SPAIN FOAM INSULATION MARKET, BY END USER, 2015 – 2024 (USD MILLION) TABLE 62 ITALY FOAM INSULATION MARKET, BY PRODUCT TYPE, 2015-2024 (USD MILLION) TABLE 63 ITALY POLYSTYRENE FOAM MARKET, BY TYPE 2015 – 2024 (USD MILLION) TABLE 64 ITALY POLYURETHANE FOAM MARKET, BY TYPE 2015 – 2024 (USD MILLION) TABLE 65 ITALY FOAM INSULATION MARKET, BY END USER, 2015 – 2024 (USD MILLION) TABLE 66 NETHERLANDS FOAM INSULATION MARKET, BY PRODUCT TYPE, 2015-2024 (USD MILLION) TABLE 67 NETHERLANDS POLYSTYRENE FOAM MARKET, BY TYPE 2015 – 2024 (USD MILLION) TABLE 68 NETHERLANDS POLYURETHANE FOAM MARKET, BY TYPE 2015 – 2024 (USD MILLION) TABLE 69 NETHERLANDS FOAM INSULATION MARKET, BY END USER, 2015 – 2024 (USD MILLION) TABLE 70 BELGIUM FOAM INSULATION MARKET, BY PRODUCT TYPE, 2015-2024 (USD MILLION) TABLE 71 BELGIUM POLYSTYRENE FOAM MARKET, BY TYPE 2015 – 2024 (USD MILLION) TABLE 72 BELGIUM POLYURETHANE FOAM MARKET, BY TYPE 2015 – 2024 (USD MILLION) TABLE 73 BELGIUM FOAM INSULATION MARKET, BY END USER, 2015 – 2024 (USD MILLION) TABLE 74 TURKEY FOAM INSULATION MARKET, BY PRODUCT TYPE, 2015-2024 (USD MILLION) TABLE 75 TURKEY POLYSTYRENE FOAM MARKET, BY TYPE 2015 – 2024 (USD MILLION) TABLE 76 TURKEY POLYURETHANE FOAM MARKET, BY TYPE 2015 – 2024 (USD MILLION) TABLE 77 TURKEY FOAM INSULATION MARKET, BY END USER, 2015 – 2024 (USD MILLION) TABLE 78 SWITZERLAND FOAM INSULATION MARKET, BY PRODUCT TYPE, 2015-2024 (USD MILLION) TABLE 79 SWITZERLAND POLYSTYRENE FOAM MARKET, BY TYPE 2015 – 2024 (USD MILLION) TABLE 80 SWITZERLAND POLYURETHANE FOAM MARKET, BY TYPE 2015 – 2024 (USD MILLION) TABLE 81 SWITZERLAND FOAM INSULATION MARKET, BY END USER, 2015 – 2024 (USD MILLION) TABLE 82 REST OF EUROPE FOAM INSULATION MARKET, BY PRODUCT TYPE, 2015-2024 (USD MILLION) TABLE 83 ASIA-PACIFIC FOAM INSULATION MARKET, BY COUNTRY, 2015 – 2024 (USD MILLION) TABLE 84 ASIA-PACIFIC FOAM INSULATION MARKET, BY PRODUCT TYPE, 2015 – 2024 (USD MILLION) TABLE 85 ASIA-PACIFIC POLYSTYRENE FOAM MARKET, BY TYPE, 2015 – 2024 (USD MILLION) TABLE 86 ASIA-PACIFIC POLYURETHANE FOAM MARKET, BY TYPE, 2015 – 2024 (USD MILLION) TABLE 87 ASIA-PACIFIC FOAM INSULATION MARKET, BY END USER, 2015 – 2024 (USD MILLION) TABLE 88 CHINA FOAM INSULATION MARKET, BY PRODUCT TYPE , 2015 – 2024 (USD MILLION) TABLE 89 CHINA POLYSTYRENE FOAM MARKET, BY TYPE , 2015 – 2024 (USD MILLION) TABLE 90 CHINA POLYURETHANE FOAM MARKET, BY TYPE, 2015 – 2024 (USD MILLION) TABLE 91 CHINA FOAM INSULATION MARKET, BY END USER, 2015 – 2024 (USD MILLION) TABLE 92 JAPAN FOAM INSULATION MARKET, BY PRODUCT TYPE, 2015 – 2024 (USD MILLION) TABLE 93 JAPAN POLYSTYRENE FOAM MARKET, BY TYPE, 2015 – 2024 (USD MILLION) TABLE 94 JAPAN POLYURETHANE FOAM MARKET, BY TYPE, 2015 – 2024 (USD MILLION) TABLE 95 JAPAN FOAM INSULATION MARKET, BY END USER, 2015 – 2024 (USD MILLION) TABLE 96 INDIA FOAM INSULATIONMARKET, BY PRODUCT TYPE, 2015-2024 (USD MILLION) TABLE 97 INDIA POLYSTYRENE FOAM MARKET, BY TYPE 2015 – 2024 (USD MILLION) TABLE 98 INDIA POLYURETHANE FOAM MARKET, BY TYPE 2015 – 2024 (USD MILLION) TABLE 99 INDIA FOAM INSULATION MARKET, BY END USER, 2015 – 2024 (USD MILLION) TABLE 100 AUSTRALIA FOAM INSULATION MARKET, BY PRODUCT TYPE, 2015-2024 (USD MILLION) TABLE 101 AUSTRALIA POLYSTYRENE FOAM MARKET, BY TYPE 2015 – 2024 (USD MILLION) TABLE 102 AUSTRALIA POLYURETHANE FOAM MARKET, BY TYPE 2015 – 2024 (USD MILLION) TABLE 103 AUSTRALIA FOAM INSULATION MARKET, BY END USER, 2015 – 2024 (USD MILLION) TABLE 104 SOUTH KOREA FOAM INSULATION MARKET, BY PRODUCT TYPE, 2015-2024 (USD MILLION) TABLE 105 SOUTH KOREA POLYSTYRENE FOAM MARKET, BY TYPE 2015 – 2024 (USD MILLION) TABLE 106 SOUTH KOREA POLYURETHANE FOAM MARKET, BY TYPE 2015 – 2024 (USD MILLION) TABLE 107 SOUTH KOREA FOAM INSULATION MARKET, BY END USER, 2015 – 2024 (USD MILLION) TABLE 108 INDONESIA FOAM INSULATION MARKET, BY PRODUCT TYPE, 2015-2024 (USD MILLION) TABLE 109 INDONESIA POLYSTYRENE FOAM MARKET, BY TYPE 2015 – 2024 (USD MILLION) TABLE 110 INDONESIA POLYURETHANE FOAM MARKET, BY TYPE 2015 – 2024 (USD MILLION) TABLE 111 INDONESIA FOAM INSULATION MARKET, BY END USER, 2015 – 2024 (USD MILLION) TABLE 112 MALAYSIA FOAM INSULATIONMARKET, BY PRODUCT TYPE, 2015-2024 (USD MILLION) TABLE 113 MALAYSIA POLYSTYRENE FOAM MARKET, BY TYPE 2015 – 2024 (USD MILLION) TABLE 114 MALAYSIA POLYURETHANE FOAM MARKET, BY TYPE 2015 – 2024 (USD MILLION) TABLE 115 MALAYSIA FOAM INSULATION MARKET, BY END USER, 2015 – 2024 (USD MILLION) TABLE 116 SINGAPORE FOAM INSULATION MARKET, BY PRODUCT TYPE, 2015-2024 (USD MILLION) TABLE 117 SINGAPORE POLYSTYRENE FOAM MARKET, BY TYPE 2015 – 2024 (USD MILLION) TABLE 118 SINGAPORE POLYURETHANE FOAM MARKET, BY TYPE 2015 – 2024 (USD MILLION) TABLE 119 SINGAPORE FOAM INSULATION MARKET, BY END USER, 2015 – 2024 (USD MILLION) TABLE 120 THAILAND FOAM INSULATION MARKET, BY PRODUCT TYPE, 2015-2024 (USD MILLION) TABLE 121 THAILAND POLYSTYRENE FOAM MARKET, BY TYPE 2015 – 2024 (USD MILLION) TABLE 122 THAILAND POLYURETHANE FOAM MARKET, BY TYPE 2015 – 2024 (USD MILLION) TABLE 123 THAILAND FOAM INSULATION MARKET, BY END USER, 2015 – 2024 (USD MILLION) TABLE 124 PHILIPPINES FOAM INSULATION MARKET, BY PRODUCT TYPE, 2015-2024 (USD MILLION) TABLE 125 PHILIPPINES POLYSTYRENE FOAM MARKET, BY TYPE 2015 – 2024 (USD MILLION) TABLE 126 PHILIPPINES POLYURETHANE FOAM MARKET, BY TYPE 2015 – 2024 (USD MILLION) TABLE 127 PHILIPPINES FOAM INSULATION MARKET, BY END USER, 2015 – 2024 (USD MILLION) TABLE 128 REST OF ASIA PACIFIC FOAM INSULATION MARKET, BY PRODUCT TYPE, 2015-2024 (USD MILLION) TABLE 129 SOUTH AMERICA FOAM INSULATION MARKET, BY COUNTRY, 2015 – 2024 (USD MILLION) TABLE 130 SOUTH AMERICA FOAM INSULATION MARKET, BY PRODUCT TYPE, 2015-2024 (USD MILLION) TABLE 131 SOUTH AMERICA POLYSTYRENE FOAM MARKET, BY TYPE 2015 – 2024 (USD MILLION) TABLE 132 SOUTH AMERICA POLYURETHANE FOAM MARKET, BY TYPE 2015 – 2024 (USD MILLION) TABLE 133 SOUTH AMERICA FOAM INSULATION MARKET, BY END USER, 2015 – 2024 (USD MILLION) TABLE 134 BRAZIL FOAM INSULATION MARKET, BY PRODUCT TYPE, 2015-2024 (USD MILLION) TABLE 135 BRAZIL POLYSTYRENE FOAM MARKET, BY TYPE 2015 – 2024 (USD MILLION) TABLE 136 BRAZIL POLYURETHANE FOAM MARKET, BY TYPE 2015 – 2024 (USD MILLION) TABLE 137 BRAZIL FOAM INSULATION MARKET, BY END USER, 2015 – 2024 (USD MILLION) TABLE 138 REST OF SOUTH AMERICA FOAM INSULATION MARKET, BY PRODUCT TYPE, 2015-2024 (USD MILLION) TABLE 139 MIDDLE EAST AND AFRICA FOAM INSULATION MARKET, BY COUNTRY, 2015 – 2024 (USD MILLION) TABLE 140 MIDDLE EAST AND AFRICA FOAM INSULATION MARKET, BY PRODUCT TYPE, 2015-2024 (USD MILLION) TABLE 141 MIDDLE EAST AND AFRICA POLYSTYRENE FOAM MARKET, BY TYPE 2015 – 2024 (USD MILLION) TABLE 142 MIDDLE EAST AND AFRICA POLYURETHANE FOAM MARKET, BY TYPE 2015 – 2024 (USD MILLION) TABLE 143 MIDDLE EAST AND AFRICA FOAM INSULATION MARKET, BY END USER, 2015 – 2024 (USD MILLION) TABLE 144 SOUTH AFRICA FOAM INSULATION MARKET, BY PRODUCT TYPE, 2015-2024 (USD MILLION) TABLE 145 SOUTH AFRICA POLYSTYRENE FOAM MARKET, BY TYPE 2015 – 2024 (USD MILLION) TABLE 146 SOUTH AFRICA POLYURETHANE FOAM MARKET, BY TYPE 2015 – 2024 (USD MILLION) TABLE 147 SOUTH AFRICA FOAM INSULATION MARKET, BY END USER, 2015 – 2024 (USD MILLION) TABLE 148 REST OF MIDDLE EAST AND AFRICA FOAM INSULATION MARKET, BY PRODUCT TYPE, 2015-2024 (USD MILLION)
List of Figure
LIST OF FIGURES GLOBAL FOAM INSULATION MARKET
FIGURE 1 GLOBAL FOAM INSULATION MARKET: SEGMENTATION FIGURE 2 GLOBAL FOAM INSULATION MARKET: DATA TRIANGULATION FIGURE 3 GLOBAL FOAM INSULATION MARKET: RESEARCH SNAPSHOT FIGURE 4 GLOBAL FOAM INSULATION MARKET: BOTTOM UP APPROACH FIGURE 5 GLOBAL FOAM INSULATION MARKET : TOP DOWN APPROACH FIGURE 6 GLOBAL FOAM INSULATION MARKET: INTERVIEW DEMOGRAPHICS FIGURE 7 DRIVERS, RESTRAINTS, OPPORTUNITIES, AND CHALLENGES OF GLOBAL FOAM INSULATION MARKET 34 FIGURE 8 GLOBAL FOAM INSULATION MARKET: SEGMENTATION FIGURE 9 ASIA PACIFIC IS EXPECTED TO DOMINATE THE MARKET FOR FOAM INSULATION AND IS EXPECTED TO BE GROWING WITH THE HIGHEST CAGR IN THE FORECAST PERIOD FROM 2017 TO 2024 FIGURE 10 INCREASING RESEARCH AND DEVELOPMENT AND GROWTH IN END-USE INDUSTRIES IS EXPECTED TO DRIVE THE MARKET FOR GLOBAL FOAM INSULATION MARKET IN THE FORECAST PERIOD 2017 TO 2024 FIGURE 11 POLYSTYRENE FOAM IS EXPECTED TO ACCOUNT FOR THE LARGEST SHARE OF THE GLOBAL FOAM INSULATION MARKET IN 2017 & 2024 FIGURE 12 ASIA PACIFIC IS THE HIGHEST GROWING AND MOST PROFITABLE REVENUE POCKETS FOR FOAM INSULATION MANUFACTURERS IN THE FORECAST PERIOD 2017 TO 2024 43 FIGURE 13 GLOBAL FOAM INSULATION MARKET: PRODUCT TYPE, 2016 FIGURE 14 GLOBAL FOAM INSULATION MARKET: END USER , 2016 FIGURE 15 GLOBAL FOAM INSULATION MARKET: SNAPSHOT (2016) FIGURE 16 GLOBAL FOAM INSULATION MARKET: BY GEOGRAPHY (2016) FIGURE 17 GLOBAL FOAM INSULATION MARKET: BY GEOGRAPHY (2017) FIGURE 18 GLOBAL FOAM INSULATION MARKET BY GEOGRAPHY (2016 & 2024) FIGURE 19 GLOBAL FOAM INSULATION MARKET, BY PRODUCT TYPE (2017 & 2024) FIGURE 20 NORTH AMERICA FOAM INSULATION : SNAPSHOT (2016) FIGURE 21 NORTH AMERICA FOAM INSULATION MARKET: BY COUNTRY (2016) FIGURE 22 NORTH AMERICA FOAM INSULATION MARKET: BY COUNTRY (2017) FIGURE 23 NORTH AMERICA FOAM INSULATION MARKET: BY COUNTRY (2016 & 2024) FIGURE 24 NORTH AMERICA FOAM INSULATIONMARKET BY PRODUCT TYPE (2017-2024) FIGURE 25 EUROPE FOAM INSULATION MARKET : SNAPSHOT (2016) FIGURE 26 EUROPE FOAM INSULATION MARKET: BY COUNTRY (2016) FIGURE 27 EUROPE FOAM INSULATION MARKET: BY COUNTRY (2017) FIGURE 28 EUROPE FOAM INSULATION MARKET BY COUNTRY (2016 & 2024) FIGURE 29 EUROPE FOAM INSULATION MARKET, BY PRODUCT TYPE (2017 & 2024) FIGURE 30 ASIA-PACIFIC FOAM INSULATION MARKET : SNAPSHOT (2016) FIGURE 31 ASIA-PACIFIC FOAM INSULATION MARKET: BY COUNTRY (2016) FIGURE 32 ASIA PACIFIC FOAM INSULATION MARKET: BY COUNTRY (2017) FIGURE 33 ASIA-PACIFIC FOAM INSULATION MARKET BY COUNTRY (2016 & 2024) FIGURE 34 ASIA-PACIFIC FOAM INSULATION MARKET, BY PRODUCT TYPE (2017 & 2024) FIGURE 35 SOUTH AMERICA FOAM INSULATION MARKET : SNAPSHOT (2016) FIGURE 36 SOUTH AMERICA FOAM INSULATION MARKET: BY COUNTRY (2016) FIGURE 37 SOUTH AMERICA FOAM INSULATION MARKET:BY COUNTRY (2017) FIGURE 38 SOUTH AMERICA FOAM INSULATION MARKET BY COUNTRY (2016 & 2024) FIGURE 39 SOUTH AMERICA FOAM INSULATION MARKET, BY PRODUCT TYPE (2017 & 2024) FIGURE 40 MIDDLE EAST AND AFRICA FOAM INSULATION MARKET SNAPSHOT (2016) FIGURE 41 MIDDLE EAST AND AFRICA FOAM INSULATION MARKET: BY COUNTRY (2016) FIGURE 42 MIDDLE EAST AND AFRICA FOAM INSULATION MARKET: BY COUNTRY (2017) FIGURE 43 MIDDLE EAST AND AFRICA FOAM INSULATION MARKET BY COUNTRY (2016 & 2024) FIGURE 44 MIDDLE EAST AND AFRICA FOAM INSULATION MARKET, BY PRODUCT TYPE (2017 & 2024) FIGURE 45 GLOBAL FOAM INSULATION MARKET: COMPANY SHARE 2016 (%) FIGURE 46 NORTH AMERICA FOAM INSULATION MARKET: COMPANY SHARE 2016 (%) FIGURE 47 EUROPE FOAM INSULATION MARKET: COMPANY SHARE 2016 (%) FIGURE 48 ASIA-PACIFIC FOAM INSULATION MARKET: COMPANY SHARE 2016 (%)
Global Foam Insulation Market, Supply Chain Analysis and Ecosystem Framework
To support market growth and help clients navigate the impact of geopolitical shifts, DBMR has integrated in-depth supply chain analysis into its Global Foam Insulation Market research reports. This addition empowers clients to respond effectively to global changes affecting their industries. The supply chain analysis section includes detailed insights such as Global Foam Insulation Market consumption and production by country, price trend analysis, the impact of tariffs and geopolitical developments, and import and export trends by country and HSN code. It also highlights major suppliers with data on production capacity and company profiles, as well as key importers and exporters. In addition to research, DBMR offers specialized supply chain consulting services backed by over a decade of experience, providing solutions like supplier discovery, supplier risk assessment, price trend analysis, impact evaluation of inflation and trade route changes, and comprehensive market trend analysis.
Data collection and base year analysis are done using data collection modules with large sample sizes. The stage includes obtaining market information or related data through various sources and strategies. It includes examining and planning all the data acquired from the past in advance. It likewise envelops the examination of information inconsistencies seen across different information sources. The market data is analysed and estimated using market statistical and coherent models. Also, market share analysis and key trend analysis are the major success factors in the market report. To know more, please request an analyst call or drop down your inquiry.
The key research methodology used by DBMR research team is data triangulation which involves data mining, analysis of the impact of data variables on the market and primary (industry expert) validation. Data models include Vendor Positioning Grid, Market Time Line Analysis, Market Overview and Guide, Company Positioning Grid, Patent Analysis, Pricing Analysis, Company Market Share Analysis, Standards of Measurement, Global versus Regional and Vendor Share Analysis. To know more about the research methodology, drop in an inquiry to speak to our industry experts.
Data Bridge Market Research is a leader in advanced formative research. We take pride in servicing our existing and new customers with data and analysis that match and suits their goal. The report can be customized to include price trend analysis of target brands understanding the market for additional countries (ask for the list of countries), clinical trial results data, literature review, refurbished market and product base analysis. Market analysis of target competitors can be analyzed from technology-based analysis to market portfolio strategies. We can add as many competitors that you require data about in the format and data style you are looking for. Our team of analysts can also provide you data in crude raw excel files pivot tables (Fact book) or can assist you in creating presentations from the data sets available in the report.


