
Global Functional Beverages Market
Market Size in USD Billion
 USD
153.15 Billion
USD
269.10 Billion
2025
2033
USD
153.15 Billion
USD
269.10 Billion
2025
2033
| 2026 - 2033 | |
| USD 153.15 Billion | |
| USD 269.10 Billion | |
| % | |
|
What is the Functional Beverages Market Size and Growth Rate?
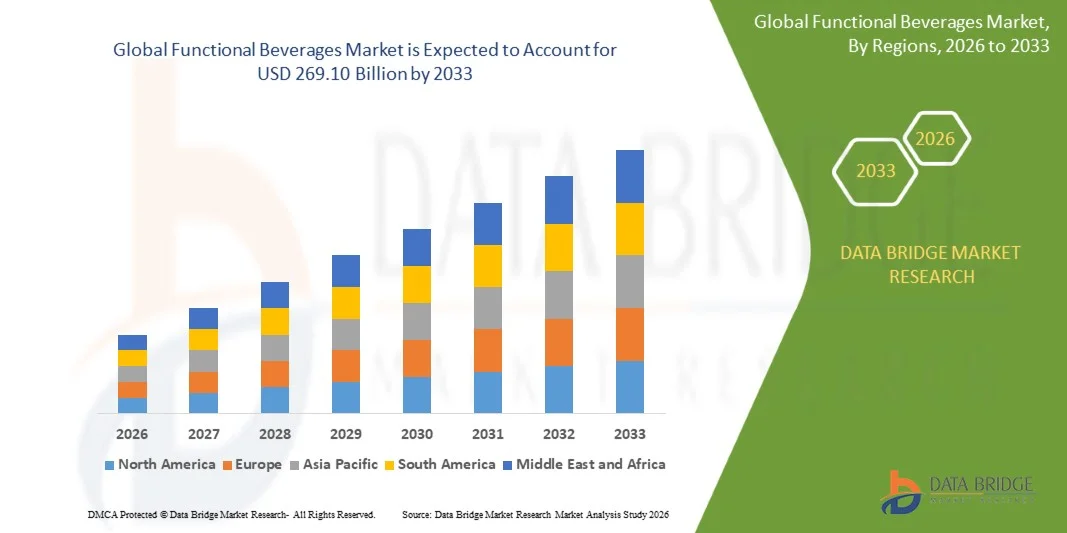
- As per Data Bridge Market Research Analysis the global functional beverages market size was valued at USD 153.15 billion in 2025 and is expected to reach USD 269.10 billion by 2033, at a CAGR of 7.3% during the forecast period
- The market growth is largely fueled by increasing consumer awareness regarding health, wellness, and preventive healthcare, leading to higher adoption of beverages enriched with functional ingredients such as vitamins, probiotics, and antioxidants
- Furthermore, rising demand for convenient, ready-to-consume drinks that support energy, hydration, and overall well-being is establishing functional beverages as a preferred choice among modern consumers. These converging factors are accelerating product innovation and expanding distribution channels, thereby significantly boosting the market growth
Market Size & Forecast
- Global Market Value (2025): USD 153.15 billion in 2025
- Expected Market Value (2033): USD 18.49 billion
- Forecast CAGR (2026–2033): 7.3%
Functional Beverages Market Analysis
- Functional beverages are non-alcoholic drinks formulated with added ingredients that provide health benefits beyond basic nutrition, such as energy enhancement, hydration, digestive support, and immunity boosting. These beverages include energy drinks, sports drinks, probiotic drinks, fortified juices, and herbal beverages catering to diverse consumer needs
- The escalating demand for functional beverages is primarily driven by shifting consumer preferences toward healthier alternatives, increasing urbanization, and rising disposable incomes, along with the growing inclination toward fitness-oriented lifestyles and clean-label products
- North America dominated the functional beverages market with a share of 39.55% in 2025, due to strong consumer inclination toward health-oriented drinks and increasing demand for energy and fortified beverages
- Asia-Pacific is expected to be the fastest growing region in the functional beverages market during the forecast period due to rapid urbanization, rising disposable incomes, and increasing health awareness
- Bottle segment dominated the market with a market share of 37.05% in 2025, due to its convenience, reusability, and widespread availability across retail channels. Bottles offer better product preservation and are preferred for on-the-go consumption, making them highly suitable for a variety of functional beverages. Increasing use of sustainable and recyclable materials in bottle packaging also supports segment growth
Report Scope and Functional Beverages Market Segmentation
|
Attributes |
Functional Beverages Key Market Insights |
|
Segments Covered |
|
|
Countries Covered |
North America
Europe
Asia-Pacific
Middle East and Africa
South America
|
|
Key Market Players |
|
|
Market Opportunities |
|
|
Value Added Data Infosets |
|
What is the Key Trend in the Functional Beverages Market?
“Growing Demand for Health and Wellness-Oriented Functional Beverages”
- A significant trend in the functional beverages market is the increasing demand for beverages that offer health and wellness benefits beyond basic nutrition, driven by rising awareness regarding preventive healthcare and balanced lifestyles. This trend is positioning functional beverages as essential daily consumption products among health-conscious consumers seeking convenient nutrition solutions
- For instance, PepsiCo, Inc. has expanded its portfolio with functional drinks such as Gatorade Fit and Tropicana Essentials that contain added vitamins and electrolytes to support hydration and immunity. These product innovations are strengthening brand positioning while catering to evolving consumer preferences for better-for-you beverages
- The rising popularity of probiotic and gut-health drinks is accelerating demand for beverages that support digestive health and immunity. Consumers are increasingly incorporating such drinks into their daily routines, driving expansion across dairy and non-dairy probiotic segments
- There is a growing inclination toward plant-based and clean-label beverages formulated without artificial additives and excess sugar. This shift is encouraging manufacturers to develop transparent ingredient formulations that align with consumer expectations for natural and sustainable products
- The increasing adoption of functional beverages among fitness enthusiasts and working professionals is supporting demand for energy, hydration, and performance-enhancing drinks. This is contributing to the diversification of product offerings targeting specific health needs and lifestyle preferences
- The market is witnessing continuous innovation in flavors, ingredients, and packaging formats to enhance consumer appeal and accessibility. This rising focus on multifunctional benefits and product differentiation is reinforcing the overall transition toward healthier beverage consumption patterns across global markets
Functional Beverages Market Dynamics
Driver
“Rising Consumer Focus on Preventive Healthcare and Nutritional Intake”
- The growing emphasis on preventive healthcare and nutritional intake is driving demand for functional beverages that provide targeted health benefits such as immunity support, energy enhancement, and hydration. Consumers are actively seeking products that contribute to long-term wellness and reduce the risk of lifestyle-related health issues
- For instance, Nestlé has introduced functional beverages enriched with vitamins, minerals, and probiotics under brands such as Nesvita and Boost to address specific health needs. These offerings are supporting the company’s strategy to align with rising consumer demand for health-focused nutrition solutions
- The increasing prevalence of lifestyle diseases and growing awareness regarding balanced diets are encouraging consumers to adopt functional beverages as part of their daily intake. This shift is strengthening demand for products that offer additional health benefits beyond hydration
- Urbanization and busy lifestyles are further contributing to the demand for convenient, ready-to-drink nutritional solutions that fit into fast-paced routines. Functional beverages are emerging as effective alternatives to traditional dietary supplements due to their ease of consumption
- The continuous focus on innovation in functional ingredients and product formulations is reinforcing market growth. The increasing alignment of beverage products with consumer health goals is positioning functional beverages as integral components of modern dietary habits
Restraint/Challenge
“High Product Cost and Regulatory Compliance Challenges”
- The functional beverages market faces challenges due to the high cost associated with sourcing premium ingredients such as probiotics, plant extracts, and specialized nutrients, which increases overall product pricing. These elevated costs can limit affordability and restrict adoption among price-sensitive consumers
- For instance, Danone invests heavily in research and development for probiotic beverages such as Activia and Actimel to ensure scientifically backed health benefits. These investments raise production costs and create pricing challenges while maintaining product efficacy and regulatory compliance
- Stringent regulatory requirements related to health claims, ingredient approvals, and labeling standards create complexity for manufacturers operating across multiple regions. Companies must adhere to varying guidelines, which can delay product launches and increase compliance costs
- The need for clinical validation and scientific substantiation of functional claims adds further complexity to product development. This requirement increases time-to-market and demands continuous investment in research activities
- The market continues to face pressure to balance product innovation with affordability and compliance. These constraints collectively influence market growth by limiting accessibility while increasing operational challenges for industry participants
Functional Beverages Market Scope
The market is segmented on the basis of type, packaging, functions, and distribution channel.
• By Type
On the basis of type, the functional beverages market is segmented into probiotic drinks, energy drinks, fruit and vegetable juices, herbal and fruit teas, fortified water, rehydration solutions, dairy beverages, non-dairy beverages, and others. The energy drinks segment dominated the largest market revenue share in 2025, driven by rising consumer demand for instant energy, mental alertness, and performance enhancement. Increasing consumption among young adults and working professionals supports its dominance, along with aggressive product innovation and marketing strategies by key players. The availability of diverse flavors and functional ingredients such as caffeine, taurine, and vitamins further strengthens its market position.
The probiotic drinks segment is anticipated to witness the fastest growth rate from 2026 to 2033, fueled by growing awareness regarding gut health and digestive wellness. Consumers are increasingly shifting toward beverages that support immunity and overall health, driving demand for probiotic-based formulations. The expansion of dairy and non-dairy probiotic options, along with clean-label trends, further accelerates adoption across health-conscious populations.
• By Packaging
On the basis of packaging, the functional beverages market is segmented into bottle, tetra pack, sachet, tin can, and others. The bottle segment held the largest market revenue share of 37.05% in 2025, driven by its convenience, reusability, and widespread availability across retail channels. Bottles offer better product preservation and are preferred for on-the-go consumption, making them highly suitable for a variety of functional beverages. Increasing use of sustainable and recyclable materials in bottle packaging also supports segment growth.
The tetra pack segment is expected to witness the fastest CAGR from 2026 to 2033, driven by its lightweight structure, extended shelf life, and eco-friendly appeal. Tetra packs are increasingly preferred for juices, dairy beverages, and probiotic drinks due to their ability to maintain product freshness without refrigeration. Rising demand for sustainable packaging solutions further contributes to the segment’s rapid expansion.
• By Functions
On the basis of functions, the functional beverages market is segmented into hydration, energy and rejuvenation, health and wellness, weight management, and others. The energy and rejuvenation segment dominated the largest market revenue share in 2025, driven by increasing demand for beverages that enhance stamina, focus, and physical performance. Busy lifestyles and rising consumption among fitness enthusiasts and working professionals contribute significantly to this dominance. Product innovations with functional ingredients further strengthen consumer preference.
The health and wellness segment is anticipated to witness the fastest growth rate from 2026 to 2033, fueled by rising awareness of preventive healthcare and nutritional intake. Consumers are increasingly opting for beverages enriched with vitamins, minerals, probiotics, and antioxidants to support immunity and overall well-being. This shift toward healthier lifestyles continues to drive strong growth in this segment.
• By Distribution Channel
On the basis of distribution channel, the functional beverages market is segmented into supermarket/hypermarket, pharmacies/health stores, convenience stores, online retail stores, and other distribution channels. The supermarket/hypermarket segment held the largest market revenue share in 2025, driven by the wide availability of products, organized shelf displays, and strong consumer footfall. These retail formats allow consumers to compare multiple brands and variants, enhancing purchasing decisions and boosting sales volume.
The online retail stores segment is expected to witness the fastest CAGR from 2026 to 2033, driven by increasing digital adoption and the convenience of home delivery. E-commerce platforms provide access to a broader range of functional beverages, including niche and premium products, attracting health-conscious consumers. Discount offers, subscription models, and easy product comparisons further accelerate the growth of this channel.s
Functional Beverages Market Regional Analysis
- North America dominated the functional beverages market with the largest revenue share of 39.55% in 2025, driven by strong consumer inclination toward health-oriented drinks and increasing demand for energy and fortified beverages
- Consumers in the region prioritize convenience, nutritional benefits, and functional ingredients such as vitamins, probiotics, and plant-based additives in daily consumption
- This widespread adoption is further supported by high disposable incomes, busy lifestyles, and growing awareness regarding preventive healthcare, establishing functional beverages as a preferred choice across diverse consumer groups
U.S. Functional Beverages Market Insight
The U.S. functional beverages market captured the largest revenue share within North America in 2025, fueled by increasing consumption of energy drinks, sports drinks, and probiotic beverages. Consumers are increasingly focusing on fitness, immunity, and mental performance, driving demand for innovative beverage formulations. The presence of major market players, strong distribution networks, and rising preference for clean-label and plant-based drinks further propel market growth. Moreover, continuous product innovation and marketing strategies significantly contribute to the expansion of the market.
Europe Functional Beverages Market Insight
The Europe functional beverages market is projected to expand at a substantial CAGR throughout the forecast period, primarily driven by increasing health consciousness and demand for natural and organic beverages. The rise in lifestyle-related health concerns, combined with growing awareness regarding nutrition, is fostering adoption across the region. European consumers are also drawn to low-sugar, fortified, and functional drinks that support overall wellness. The market is witnessing growth across retail and online channels, with strong demand in both developed and emerging economies.
U.K. Functional Beverages Market Insight
The U.K. functional beverages market is anticipated to grow at a noteworthy CAGR during the forecast period, driven by rising demand for healthier beverage alternatives and increasing adoption of energy and wellness drinks. Consumers are actively shifting away from sugary carbonated drinks toward functional beverages offering added health benefits. The country’s well-established retail infrastructure and growing online beverage sales are expected to continue stimulating market growth.
Germany Functional Beverages Market Insight
The Germany functional beverages market is expected to expand at a considerable CAGR during the forecast period, fueled by increasing preference for organic, natural, and functional food and beverage products. Germany’s strong focus on health, sustainability, and product quality supports the adoption of fortified and probiotic beverages. The integration of innovative ingredients and eco-friendly packaging solutions is also becoming increasingly prevalent, aligning with consumer expectations for sustainable consumption.
Asia-Pacific Functional Beverages Market Insight
The Asia-Pacific functional beverages market is poised to grow at the fastest CAGR during the forecast period of 2026 to 2033, driven by rapid urbanization, rising disposable incomes, and increasing health awareness. The region's expanding middle-class population and growing demand for energy, hydration, and wellness drinks are accelerating market growth. Furthermore, increasing investments by global and regional players, along with expanding retail and e-commerce sectors, are enhancing product accessibility across the region.
Japan Functional Beverages Market Insight
The Japan functional beverages market is gaining momentum due to the country’s strong focus on health and longevity, along with high consumption of functional and fortified drinks. The Japanese market emphasizes innovation, with beverages enriched with vitamins, amino acids, and probiotics gaining popularity. The integration of functional beverages into daily diets and the demand for convenient nutrition solutions are fueling growth across various consumer segments.
China Functional Beverages Market Insight
The China functional beverages market accounted for the largest market revenue share in Asia Pacific in 2025, attributed to rapid urbanization, increasing health awareness, and expanding middle-class population. China stands as a major market for energy drinks, herbal beverages, and fortified drinks across urban and semi-urban areas. The growing penetration of e-commerce platforms, strong domestic production, and increasing availability of affordable functional beverages are key factors propelling the market in China.
Which are the Top Companies in Functional Beverages Market?
The functional beverages industry is primarily led by well-established companies, including:
- PepsiCo, Inc. (U.S.)
- Nestlé (Switzerland)
- Kraft Foods (U.S.)
- General Mills (U.S.)
- Campbell Soup Co. (U.S.)
- Monster Beverage Corporation (U.S.)
- The Coca-Cola Company (U.S.)
- Red Bull GmbH (Austria)
- Archer Daniels Midland Co. (U.S.)
- DuPont Nutrition & Health (U.S.)
- BASF SE (Germany)
- Glanbia (Ireland)
- Clif Bar & Company (U.S.)
- Universal Nutrition (U.S.)
- Dr Pepper Snapple Group Inc. (U.S.)
- Groupe Danone (France)
- Tata Tea (India)
- GSK (U.K.)
Latest Developments in Global Functional Beverages Market
- In July 2025, Virtue expanded its portfolio by launching Virtue Electrolytes Hydration sachets, offering zero sugar, high electrolyte content, and added immunity support, which strengthened its positioning in the hydration segment and enhanced competition in performance and recovery-focused functional beverages. This development supports the growing consumer shift toward convenient, on-the-go hydration formats while enabling the brand to expand its reach across online platforms and major U.K. retail channels, thereby accelerating category growth
- In July 2025, O’Neill Vintners & Distillers entered the functional beverages market with Catalyst, an energy drink featuring plant-based caffeine, low calories, and vitamin fortification, which diversified competition by introducing clean-label energy solutions. This launch reflects the increasing demand for healthier energy alternatives and supports market expansion by addressing consumer concerns related to sugar intake, sustained energy release, and overall wellness-focused consumption patterns
- In April 2025, Pressed Juicery launched Blue Pineapple and Cherry Limeade Energy Tonics with zero sugar, electrolytes, and B vitamins, which reinforced the trend toward multifunctional beverages supporting energy, hydration, and cognitive performance. This innovation strengthens the brand’s presence in the premium wellness segment while contributing to broader market growth through the introduction of products targeting multiple health benefits within a single formulation
- In January 2025, PepsiCo expanded its functional beverage portfolio with new health-focused variants under its existing brands, incorporating added vitamins, electrolytes, and reduced sugar formulations, which intensified competition among established players. This strategic move accelerates innovation across the market and supports the transition toward functional and better-for-you beverages by leveraging strong distribution networks and brand recognition
- In July 2024, Bloom Nutrition introduced Bloom Pop, a low-calorie soda infused with clinically backed prebiotics, which supported the growing demand for gut-health beverages and expanded the functional soda category. This development enhances consumer adoption of digestive health products while contributing to market diversification through innovative formulations that combine taste, low sugar content, and scientifically supported health benefits
SKU-

- Interactive Data Analysis Dashboard
- Company Analysis Dashboard for high growth potential opportunities
- Research Analyst Access for customization & queries
- Competitor Analysis with Interactive dashboard
- Latest News, Updates & Trend analysis
- Harness the Power of Benchmark Analysis for Comprehensive Competitor Tracking
Global Functional Beverages Market, Supply Chain Analysis and Ecosystem Framework
To support market growth and help clients navigate the impact of geopolitical shifts, DBMR has integrated in-depth supply chain analysis into its Global Functional Beverages Market research reports. This addition empowers clients to respond effectively to global changes affecting their industries. The supply chain analysis section includes detailed insights such as Global Functional Beverages Market consumption and production by country, price trend analysis, the impact of tariffs and geopolitical developments, and import and export trends by country and HSN code. It also highlights major suppliers with data on production capacity and company profiles, as well as key importers and exporters. In addition to research, DBMR offers specialized supply chain consulting services backed by over a decade of experience, providing solutions like supplier discovery, supplier risk assessment, price trend analysis, impact evaluation of inflation and trade route changes, and comprehensive market trend analysis.
Data collection and base year analysis are done using data collection modules with large sample sizes. The stage includes obtaining market information or related data through various sources and strategies. It includes examining and planning all the data acquired from the past in advance. It likewise envelops the examination of information inconsistencies seen across different information sources. The market data is analysed and estimated using market statistical and coherent models. Also, market share analysis and key trend analysis are the major success factors in the market report. To know more, please request an analyst call or drop down your inquiry.
The key research methodology used by DBMR research team is data triangulation which involves data mining, analysis of the impact of data variables on the market and primary (industry expert) validation. Data models include Vendor Positioning Grid, Market Time Line Analysis, Market Overview and Guide, Company Positioning Grid, Patent Analysis, Pricing Analysis, Company Market Share Analysis, Standards of Measurement, Global versus Regional and Vendor Share Analysis. To know more about the research methodology, drop in an inquiry to speak to our industry experts.
Data Bridge Market Research is a leader in advanced formative research. We take pride in servicing our existing and new customers with data and analysis that match and suits their goal. The report can be customized to include price trend analysis of target brands understanding the market for additional countries (ask for the list of countries), clinical trial results data, literature review, refurbished market and product base analysis. Market analysis of target competitors can be analyzed from technology-based analysis to market portfolio strategies. We can add as many competitors that you require data about in the format and data style you are looking for. Our team of analysts can also provide you data in crude raw excel files pivot tables (Fact book) or can assist you in creating presentations from the data sets available in the report.


