
Gamma Butyrolactone Market Analysis and Insights
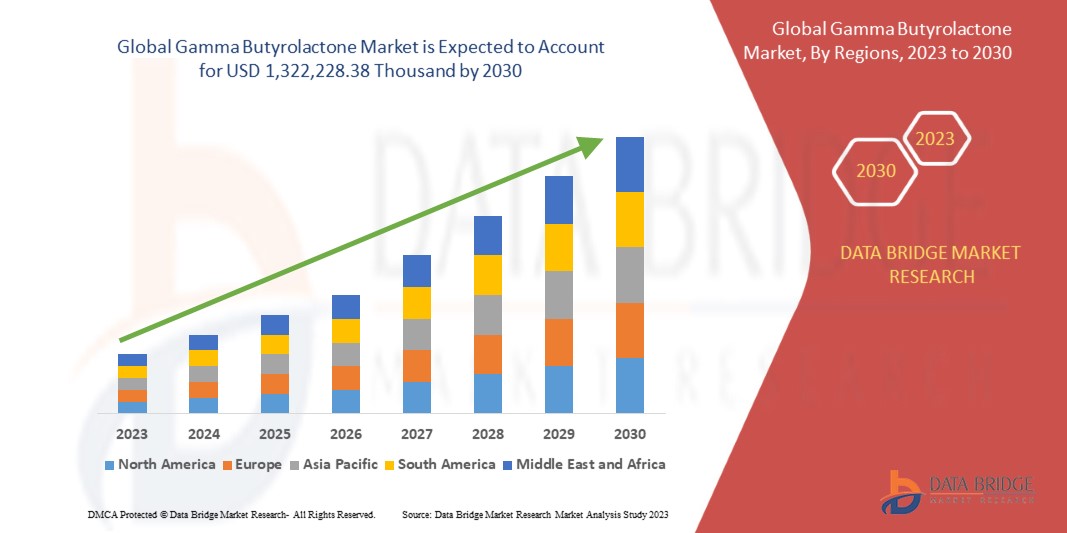
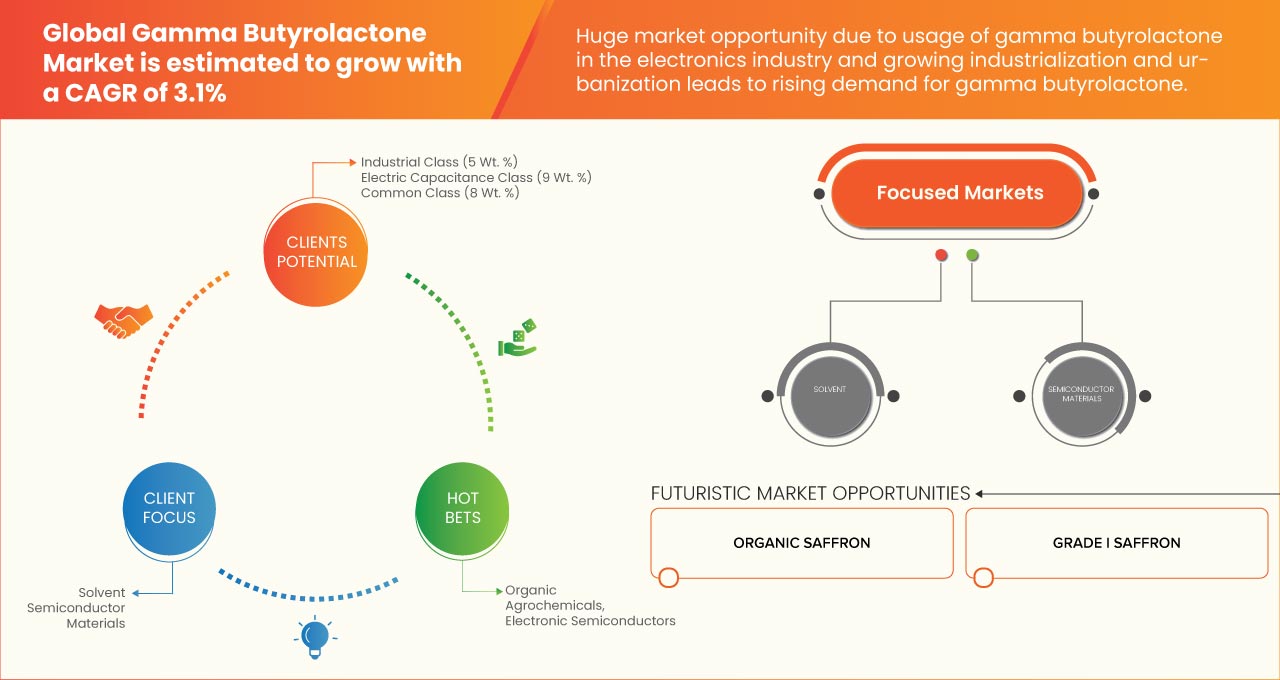
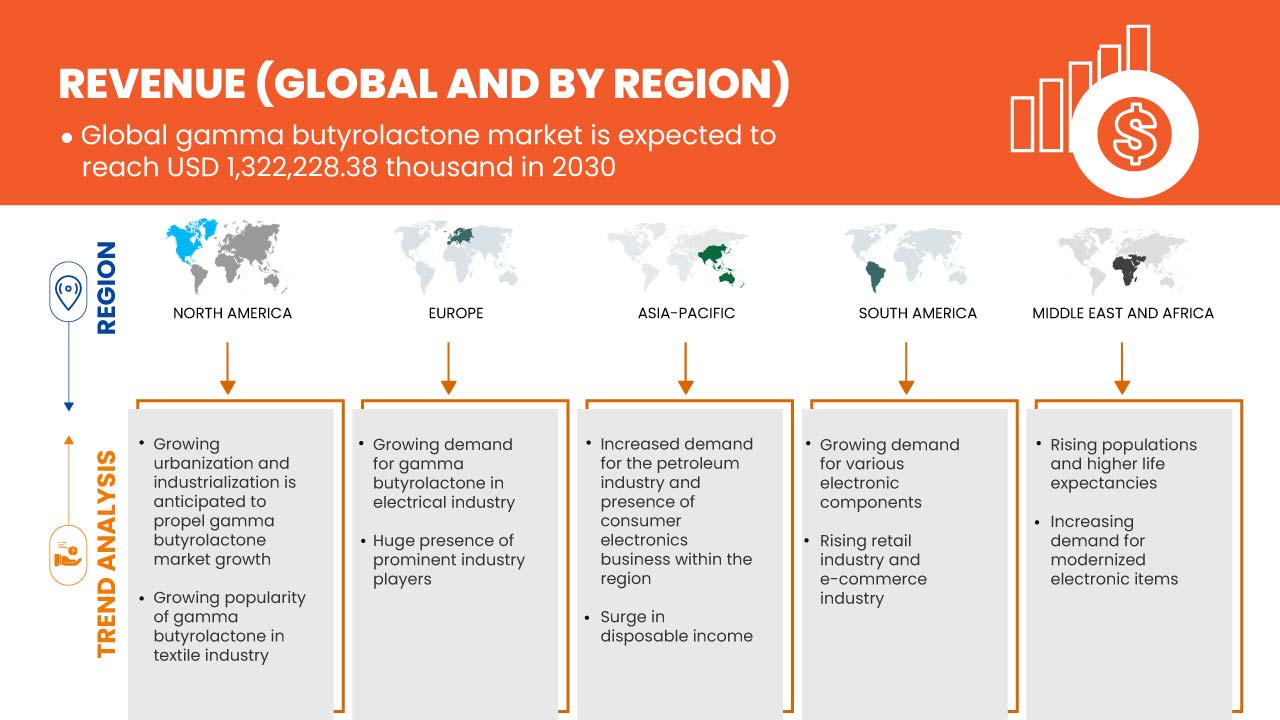
The global gamma butyrolactone market is expected to gain market growth in the forecast period of 2023 to 2030. Data Bridge Market Research analyses that the market is growing at a CAGR of 3.1% in the forecast period of 2023 to 2030 and is expected to reach USD 1,322,228.38 thousand by 2030.
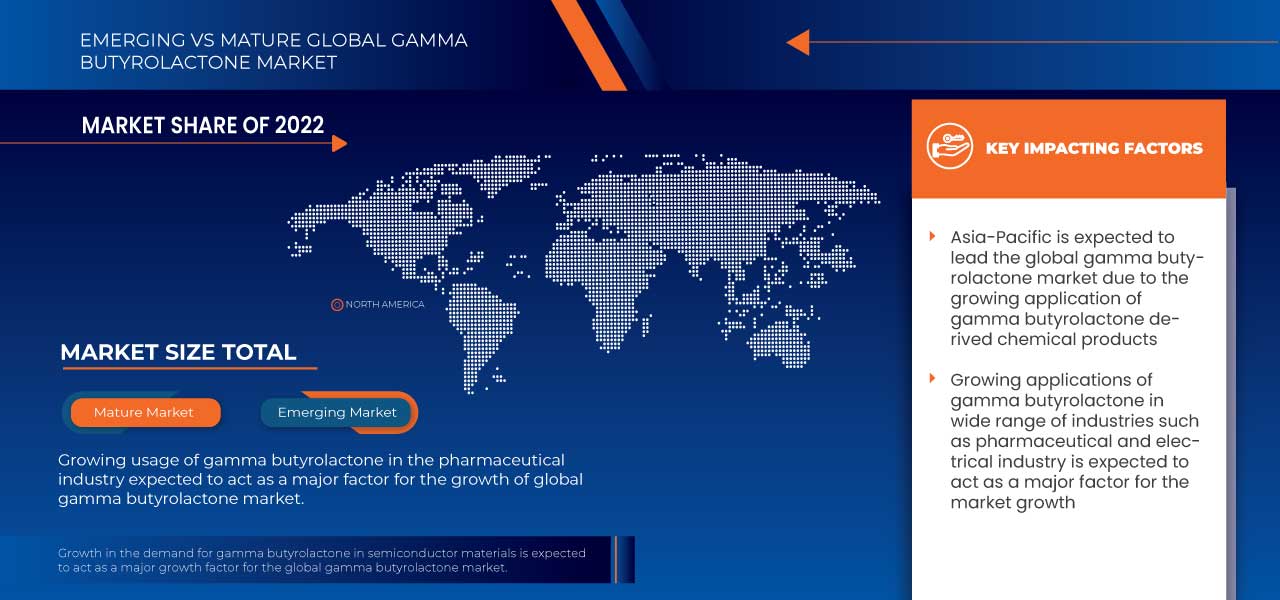
The major factor driving the growth of gamma butyrolactone is the rising demand from the growing application of derived chemical products expected to drive the market growth.
The global gamma butyrolactone market report provides details of market share, new developments and product pipeline analysis, the impact of domestic and localized market players, analyses opportunities in terms of emerging revenue pockets, changes in market regulations, product approvals, strategic decisions, product launches, geographic expansions and technological innovations in the market. To understand the analysis and the market scenario, contact us for an Analyst Brief. Our team will help you create a revenue-impact solution to achieve your desired goal.
|
Report Metric |
Details |
|
Forecast Period |
2023 to 2030 |
|
Base Year |
2022 |
|
Historic Years |
2021 (Customisable to 2020-2015) |
|
Quantitative Units |
Revenue in USD Thousand |
|
Segments Covered |
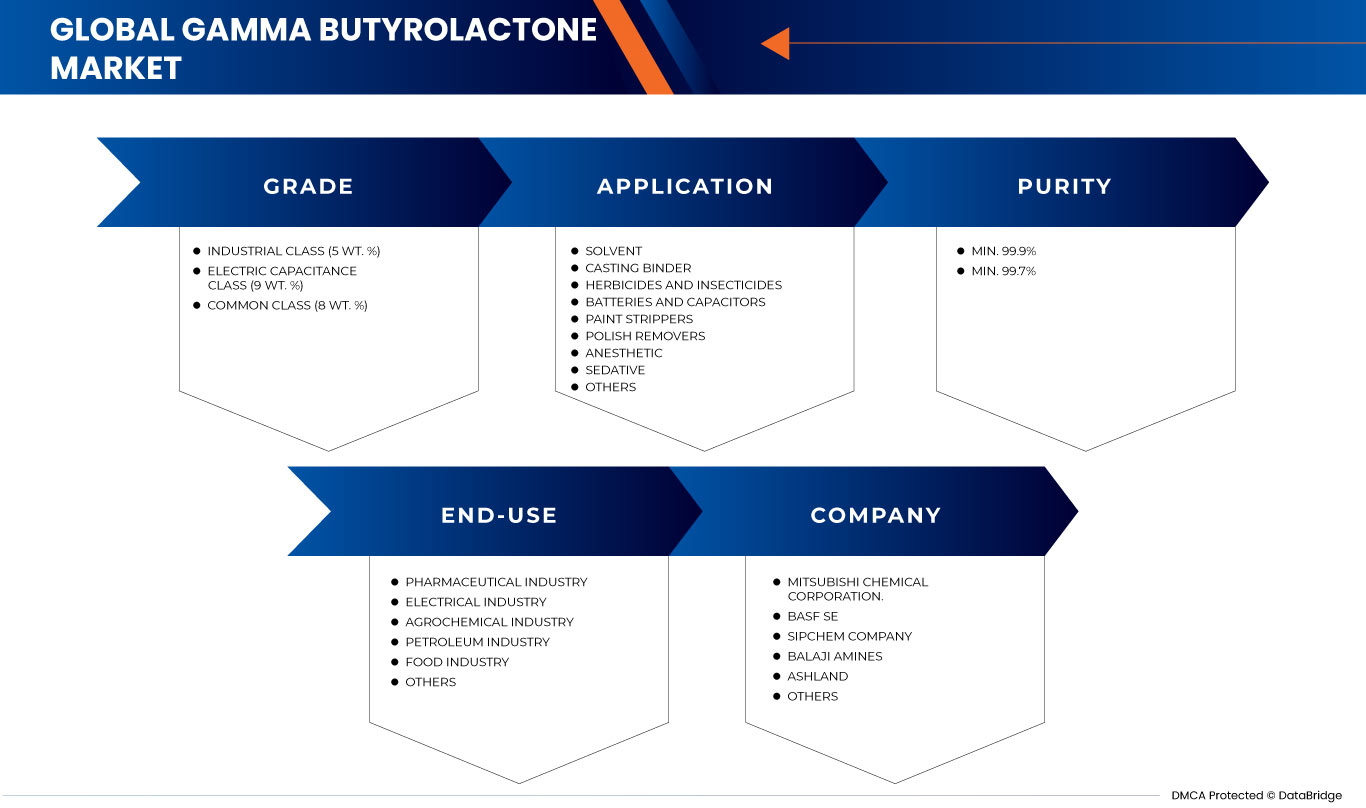
By Grade (Industrial Class (5 Wt. %), Electric Capacitance Class (9 Wt. %) and Common Class (8 Wt. %)), Purity (Min. 99.9% and Min. 99.7%), Application (Solvent, Casting Binder, Herbicides and Insecticides, Batteries and Capacitors, Paint Strippers, Polish Removers, Anesthetic, Sedative and Others), End-Use (Pharmaceutical Industry, Electrical Industry, Agrochemical Industry, Petroleum Industry, Food Industry and Others) |
|
Countries Covered |
U.S., Canada, Mexico, U.K., Italy, France, Spain, Russia, Switzerland, Turkey, Belgium, Luxemburg, Netherlands, Rest of Europe, Japan, China, South Korea, India, Singapore, Thailand, Indonesia, Malaysia, Philippines, Australia & New Zealand, Rest of Asia-Pacific, Brazil, Argentina, Rest of South America, South Africa, Egypt, Saudi Arabia, United Arab Emirates, Israel and the Rest of the Middle East and Africa |
|
Market Players Covered |
Zhejiang Realsun Chemical Co.,Ltd., Biosynth, BYN Chemical Co., Ltd, DCC, BASF SE, Ashland, Boai NKY Pharmaceuticals Ltd., Mitsubishi Chemical Corporation., Sipchem Company, BALAJI AMINES and others |
Market Definition
Gamma butyrolactone is a hygroscopic liquid with a ketone-like odor and a colorless, greasy and transparent appearance. It is also used as a precursor in manufacturing a number of chemical compounds. GBL is employed as an aesthetic and pacifier in the pharmaceutical business and for the production of interferon and ciprofloxacin.
Global Gamma Butyrolactone Market Dynamics
Drivers
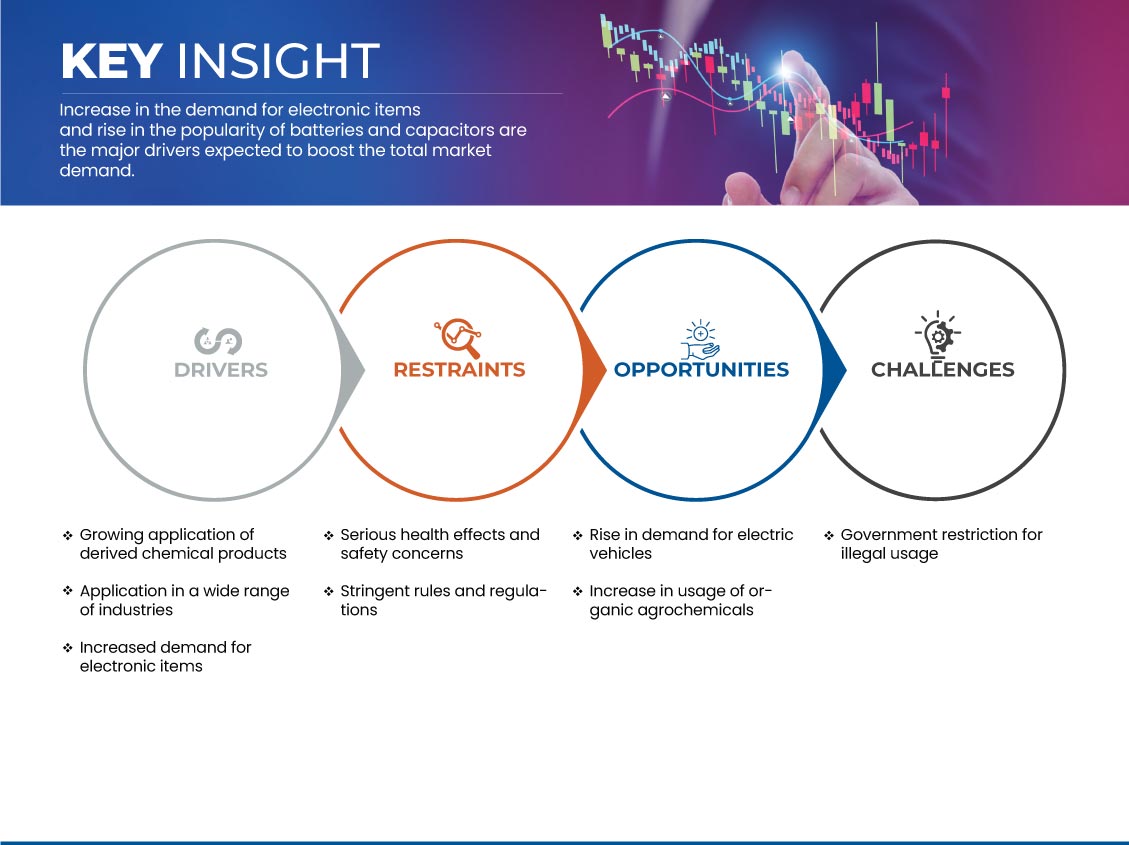
- Growing application of derived chemical products
Chemicals play an important role in every aspect of day-to-day life. Everything around the world consists of chemicals. To manufacture such useful chemicals, raw materials are required. Every chemical has its different raw materials and chemical intermediates. The daily use products such as medicines, food items, cosmetics, personal care products, paints, fuels, electronics and many more are made up of chemical compounds, which are derived from one or more chemical raw materials. Favorable frameworks, an increase in foreign direct investment in developing economies, increased demand from consumers and strong competition among manufacturers of chemicals products are the driving forces behind the market growth of chemical products.
- Application in a wide range of industries
The growing economy, rise in the transportation sector and growth in infrastructure are a few of the crucial variables which have led to the growth of the petroleum industry. Gamma butyrolactone is one of the useful chemicals which is employed as an extractant in the processing of butadiene, aromatic and advanced grease petroleum. Other than the petroleum based industry, gamma butyrolactone is used in agrochemicals industries. Agrochemical products play an important role in increasing agricultural yields. Utilizing agrochemicals improves crop productivity, plant health and controls plant disease. Such agrochemicals are classified into herbicides, nematicides, fungicides, pesticides and soil conditioners. The chemical is used to produce organic agrochemicals such as herbicides, nematocides and pesticides. Along with it, gamma butyrolactone serves as a plant growth regulator and stabilizer for pesticides containing phosphorus and chlorohydrocarbons. Thus the high population, increasing food demand and awareness among farmers regarding the benefits of agrochemicals are the factor that leads to the agrochemical industry growth, thus driving the Global gamma butyrolactone market.
Opportunities
- Rise in demand for electric vehicles
Since there is a greater demand for electric vehicles globally, there are more of them on the road today and this trend will only continue. The need for electric vehicles has risen in the last several years due to greater public awareness of the need to reduce greenhouse gas emissions, the high cost of fuel and technological advancements. Electric vehicles available in the market are electric cars, buses, tractors, scooters, bikes, bicycles, personal transporters and many more. Such different types of electric vehicles attract consumers from different work areas, thus increasing demand and sales of electric vehicles.
- Increase in usage of organic agrochemicals
The machine or engines which is installed in the plants or automotive industry are done for a longer duration but are used on a regular basis, due to which the wear and tear of parts are more inside the engine. The seals products which are installed with the machine have to work under different pressure and temperature, which increases the wear and tear of the seals products. Several types of lubricants are used in the machinery, which involve different chemical compositions, which sometimes also affect the composition of sealing products.
Restraints/Challenges
- Serious health effects and safety concerns
Gamma butyrolactone is a well-known chemical having a wide range of applications. The chemical found its application in various industries such as pharmaceuticals, petroleum, agrochemicals, cosmetics and personal care products. It is also used as an intermediate in the production of various chemicals, such as polyvinylpyrrolidone, phenyl butyric acid and DL-methionine. Along with it, the chemical is used as a solvent for cellulose acetate, methyl methacrylate and other polymers.
Recent Developments
- According to the My Chemical Monitoring, the Australian Department of Health's delegate announces the plan to limit the use of gamma butyrolactone in cosmetics and other items
Global Gamma Butyrolactone Market Scope and Market Size
The global gamma butyrolactone market is categorized into grade, application, purity and end-use. The growth among segments helps you analyze niche pockets of growth and strategies to approach the market and determine your core application areas and the difference in your target markets.
Grade
- Industrial Class (5 Wt. %)
- Common Class (8 Wt.%)
- Electric Capacitance Class (9 Wt.%)
On the basis of grade, the market is segmented into industrial class (5 wt. %), common class (8 wt. %) and electric capacitance class (9 wt. %)
Purity
- Min. 99.9%
- Min. 99.7%
On the basis of purity, the market is segmented into min. 99.7% and min. 99.9%.
Application
- Solvent
- Casting Binder
- Herbicides and Insecticides
- Batteries and Capacitors
- Paint Strippers
- Polish Removers
- Anesthetic
- Sedative
- Others
On the basis of application, the market is segmented into solvent, casting binder, herbicides and insecticides, batteries and capacitors, paint strippers, polish removers, anesthetic, sedative and others.
End Use
- Pharmaceutical Industry
- Electrical Industry
- Agrochemical Industry
- Petroleum Industry
- Food Industry
- Others
On the basis of end use, the market is segmented into the pharmaceutical industry, electrical industry, agrochemical industry, petroleum industry, food industry and others.
Global Gamma Butyrolactone Market Regional/Country Level Analysis
The global gamma butyrolactone market is analyzed and market size information is provided by country, grade, purity, application and end-use, as referenced above.
The countries covered in the global gamma butyrolactone market are U.S., Canada, Mexico, U.K., Italy, France, Spain, Russia, Switzerland, Turkey, Belgium, Luxemburg, Netherlands, Rest of Europe, Japan, China, South Korea, India, Singapore, Thailand, Indonesia, Malaysia, Philippines, Australia & New Zealand, Rest of Asia-Pacific, Brazil, Argentina, Rest of South America, South Africa, Egypt, Saudi Arabia, United Arab Emirates, Israel and the Rest of the Middle East and Africa.
Asia-Pacific is expected to lead the global gamma butyrolactone market due to the growing application of gamma butyrolactone derived chemical products.
The country section of the report also provides individual market impacting factors and changes in regulation in the market domestically that impact the current and future trends of the market. Data points such as new sales, replacement sales, country demographics, regulatory acts and import-export tariffs are some of the major pointers used to forecast the market scenario for individual countries. Also, the presence and availability of brands and their challenges faced due to large or scarce competition from local and domestic brands and the impact of sales channels are considered while providing forecast analysis of the country data.
Competitive Landscape and Global Gamma Butyrolactone Market Share Analysis
The global gamma butyrolactone market competitive landscape provides details by competitor. Details included are company overview, company financials, revenue generated, market potential, investment in research and development, new market initiatives, global presence, production sites and facilities, company strengths and weaknesses, product launch, clinical trials pipelines, brand analysis, product approvals, patents, product width and breath, application dominance, technology lifeline curve. The above data points provided are only related to the company’s focus related to the Global gamma butyrolactone market.
The major players covered in the global gamma butyrolactone market are Zhejiang Realsun Chemical Co.,Ltd., Biosynth, BYN Chemical Co., Ltd, DCC, BASF SE, Ashland, Boai NKY Pharmaceuticals Ltd., Mitsubishi Chemical Corporation., Sipchem Company, BALAJI AMINES and others.
SKU-

- Interactive Data Analysis Dashboard
- Company Analysis Dashboard for high growth potential opportunities
- Research Analyst Access for customization & queries
- Competitor Analysis with Interactive dashboard
- Latest News, Updates & Trend analysis
- Harness the Power of Benchmark Analysis for Comprehensive Competitor Tracking
Table of Content
1 INTRODUCTION
1.1 OBJECTIVES OF THE STUDY
1.2 MARKET DEFINITION
1.3 OVERVIEW OF THE GLOBAL GAMMA BUTYROLACTONE MARKET
1.4 LIMITATIONS
1.5 MARKETS COVERED
2 MARKET SEGMENTATION
2.1 MARKETS COVERED
2.2 GEOGRAPHICAL SCOPE
2.3 YEARS CONSIDERED FOR THE STUDY
2.4 CURRENCY AND PRICING
2.5 DBMR TRIPOD DATA VALIDATION MODEL
2.6 GRADE LIFE LINE CURVE
2.7 MULTIVARIATE MODELING
2.8 PRIMARY INTERVIEWS WITH KEY OPINION LEADERS
2.9 DBMR MARKET POSITION GRID
2.1 MARKET END-USE COVERAGE GRID
2.11 DBMR MARKET CHALLENGE MATRIX
2.12 DBMR VENDOR SHARE ANALYSIS
2.13 IMPORT-EXPORT DATA
2.14 SECONDARY SOURCES
2.15 ASSUMPTIONS
3 EXECUTIVE SUMMARY
4 PREMIUM INSIGHTS
4.1 PESTLE ANALYSIS
4.1.1 POLITICAL FACTORS
4.1.2 ECONOMIC FACTORS
4.1.3 SOCIAL FACTORS
4.1.4 TECHNOLOGICAL FACTORS
4.1.5 LEGAL FACTORS
4.1.6 ENVIRONMENTAL FACTORS
4.2 PORTER'S FIVE FORCES:
4.2.1 THREAT OF NEW ENTRANTS:
4.2.2 THREAT OF SUBSTITUTES:
4.2.3 CUSTOMER BARGAINING POWER:
4.2.4 SUPPLIER BARGAINING POWER:
4.2.5 INTERNAL COMPETITION (RIVALRY):
4.3 CLIMATE CHANGE SCENARIO
4.3.1 ENVIRONMENTAL CONCERNS
4.3.2 INDUSTRY RESPONSE
4.3.3 GOVERNMENT'S ROLE
4.3.4 ANALYST RECOMMENDATION
4.4 LIST OF KEY PATENTS LAUNCHED
4.5 SUPPLY CHAIN ANALYSIS
4.5.1 OVERVIEW
4.5.2 LOGISTIC COST SCENARIO
4.5.3 IMPORTANCE OF LOGISTICS SERVICE PROVIDERS
4.6 VENDOR SELECTION CRITERIA
5 MARKET OVERVIEW
5.1 DRIVERS
5.1.1 GROWING APPLICATION OF DERIVED CHEMICAL PRODUCTS
5.1.2 APPLICATION IN A WIDE RANGE OF INDUSTRIES
5.1.3 INCREASED DEMAND FOR ELECTRONIC ITEMS
5.2 RESTRAINTS
5.2.1 SERIOUS HEALTH EFFECTS AND SAFETY CONCERNS
5.2.2 STRINGENT RULES AND REGULATIONS
5.3 OPPORTUNITIES
5.3.1 RISE IN DEMAND FOR ELECTRIC VEHICLES
5.3.2 INCREASE IN USAGE OF ORGANIC AGROCHEMICALS
5.4 CHALLENGES
5.4.1 GOVERNMENT RESTRICTIONS FOR ILLEGAL USAGE
6 GLOBAL GAMMA BUTYROLACTONE MARKET, BY GRADE
6.1 OVERVIEW
6.2 INDUSTRIAL CLASS (5 WT.%)
6.3 ELECTRIC CAPACITANCE CLASS (9 WT.%)
6.4 COMMON CLASS (8 WT.%)
7 GLOBAL GAMMA BUTYROLACTONE MARKET, BY PURITY
7.1 OVERVIEW
7.2 MIN. 99.9%
7.3 MIN. 99.7%
8 GLOBAL GAMMA BUTYROLACTONE MARKET, BY APPLICATION
8.1 OVERVIEW
8.2 SOLVENT
8.3 CASTING BINDER
8.4 HERBICIDES AND INSECTICIDES
8.5 BATTERIES AND CAPACITORS
8.6 PAINT STRIPPERS
8.7 POLISH REMOVERS
8.8 ANESTHETIC
8.9 SEDATIVE
8.1 OTHERS
9 GLOBAL GAMMA BUTYROLACTONE MARKET, BY END-USE
9.1 OVERVIEW
9.2 PHARMACEUTICAL INDUSTRY
9.3 ELECTRICAL INDUSTRY
9.4 AGROCHEMICAL INDUSTRY
9.5 PETROLEUM INDUSTRY
9.6 FOOD INDUSTRY
9.7 OTHERS
10 GLOBAL GAMMA BUTYROLACTONE MARKET, BY REGION
10.1 OVERVIEW
10.2 ASIA-PACIFIC
10.2.1 CHINA
10.2.2 INDIA
10.2.3 JAPAN
10.2.4 SOUTH KOREA
10.2.5 SINGAPORE
10.2.6 THAILAND
10.2.7 AUSTRALIA & NEW ZEALAND
10.2.8 INDONESIA
10.2.9 MALAYSIA
10.2.10 PHILIPPINES
10.2.11 REST OF ASIA-PACIFIC
10.3 EUROPE
10.3.1 FRANCE
10.3.2 GERMANY
10.3.3 U.K.
10.3.4 ITALY
10.3.5 TURKEY
10.3.6 BELGIUM
10.3.7 SPAIN
10.3.8 RUSSIA
10.3.9 SWITZERLAND
10.3.10 NETHERLANDS
10.3.11 REST OF EUROPE
10.4 NORTH AMERICA
10.4.1 U.S.
10.4.2 CANADA
10.4.3 MEXICO
10.5 SOUTH AMERICA
10.5.1 BRAZIL
10.5.2 ARGENTINA
10.5.3 REST OF SOUTH AMERICA
10.6 MIDDLE EAST AND AFRICA
10.6.1 SOUTH AFRICA
10.6.2 SAUDI ARABIA
10.6.3 UNITED ARAB EMIRATES
10.6.4 ISRAEL
10.6.5 EGYPT
10.6.6 REST OF MIDDLE EAST AND AFRICA
11 GLOBAL GAMMA BUTYROLACTONE MARKET: COMPANY LANDSCAPE
11.1 COMPANY SHARE ANALYSIS: GLOBAL
11.2 COMPANY SHARE ANALYSIS: NORTH AMERICA
11.3 COMPANY SHARE ANALYSIS: EUROPE
11.4 COMPANY SHARE ANALYSIS: ASIA-PACIFIC
11.5 RECOGNITION
11.6 AWARD
11.7 EVENT
11.8 EXPANSION
11.9 AGREEMENT
12 SWOT ANALYSIS
13 COMPANY PROFILES
13.1 MITSUBISHI CHEMICAL CORPORATION.
13.1.1 COMPANY SNAPSHOT
13.1.2 REVENUE ANALYSIS
13.1.3 COMPANY SHARE ANALYSIS
13.1.4 PRODUCT PORTFOLIO
13.1.5 RECENT DEVELOPMENTS
13.2 BASF SE
13.2.1 COMPANY SNAPSHOT
13.2.2 REVENUE ANALYSIS
13.2.3 COMPANY SHARE ANALYSIS
13.2.4 PRODUCT PORTFOLIO
13.2.5 RECENT DEVELOPMENT
13.3 SIPCHEM COMPANY
13.3.1 COMPANY SNAPSHOT
13.3.2 REVENUE ANALYSIS
13.3.3 COMPANY SHARE ANALYSIS
13.3.4 PRODUCT PORTFOLIO
13.3.5 RECENT DEVELOPMENTS
13.4 BALAJI AMINES
13.4.1 COMPANY SNAPSHOT
13.4.2 REVENUE ANALYSIS
13.4.3 COMPANY SHARE ANALYSIS
13.4.4 PRODUCT PORTFOLIO
13.4.5 RECENT DEVELOPMENTS
13.5 ASHLAND
13.5.1 COMPANY SNAPSHOT
13.5.2 REVENUE ANALYSIS
13.5.3 COMPANY SHARE ANALYSIS
13.5.4 PRODUCT PORTFOLIO
13.5.5 RECENT DEVELOPMENT
13.6 BIOSYNTH
13.6.1 COMPANY SNAPSHOT
13.6.2 PRODUCT PORTFOLIO
13.6.3 RECENT DEVELOPMENT
13.7 BOAI NKY PHARMACEUTICALS LTD.
13.7.1 COMPANY SNAPSHOT
13.7.2 PRODUCT PORTFOLIO
13.7.3 RECENT DEVELOPMENT
13.8 BYN CHEMICALS CO., LTD
13.8.1 COMPANY SNAPSHOT
13.8.2 PRODUCT PORTFOLIO
13.8.3 RECENT DEVELOPMENT
13.9 DCC
13.9.1 COMPANY SNAPSHOT
13.9.2 PRODUCT PORTFOLIO
13.9.3 RECENT DEVELOPMENT
13.1 ZHEJIANG REALSUN CHEMICAL CO.,LTD.
13.10.1 COMPANY SNAPSHOT
13.10.2 PRODUCT PORTFOLIO
13.10.3 RECENT DEVELOPMENTS
14 QUESTIONNAIRE
15 RELATED REPORTS
List of Table
TABLE 1 IMPORT DATA OF LACTONES; HS CODE – 293220 (USD THOUSAND)
TABLE 2 EXPORT DATA OF LACTONES; HS CODE – 293220 (USD THOUSAND)
TABLE 3 GLOBAL GAMMA BUTYROLACTONE MARKET, BY GRADE, 2017-2030 (USD THOUSAND)
TABLE 4 GLOBAL GAMMA BUTYROLACTONE MARKET, BY GRADE, 2017-2030 (TONS)
TABLE 5 GLOBAL INDUSTRIAL CLASS (5 WT.%) IN GAMMA BUTYROLACTONE MARKET, BY REGION, 2017-2030 (USD THOUSAND)
TABLE 6 GLOBAL INDUSTRIAL CLASS (5 WT.%) IN GAMMA BUTYROLACTONE MARKET, BY REGION, 2017-2030 (TONS)
TABLE 7 GLOBAL ELECTRIC CAPACITANCE CLASS (9 WT.%) IN GAMMA BUTYROLACTONE MARKET, BY REGION, 2017-2030 (USD THOUSAND)
TABLE 8 GLOBAL ELECTRIC CAPACITANCE CLASS (9 WT.%) IN GAMMA BUTYROLACTONE MARKET, BY REGION, 2017-2030 (TONS)
TABLE 9 GLOBAL COMMON CLASS (8 WT.%) IN GAMMA BUTYROLACTONE MARKET, BY REGION, 2017-2030 (USD THOUSAND)
TABLE 10 GLOBAL COMMON CLASS (8 WT.%) IN GAMMA BUTYROLACTONE MARKET, BY REGION, 2017-2030 (TONS)
TABLE 11 GLOBAL GAMMA BUTYROLACTONE MARKET, BY PURITY, 2017-2030 (USD THOUSAND)
TABLE 12 GLOBAL MIN. 99.9% IN GAMMA BUTYROLACTONE MARKET, BY REGION, 2017-2030 (USD THOUSAND)
TABLE 13 GLOBAL MIN. 99.7% IN GAMMA BUTYROLACTONE MARKET, BY REGION, 2017-2030 (USD THOUSAND)
TABLE 14 GLOBAL GAMMA BUTYROLACTONE MARKET, BY APPLICATION, 2017-2030 (USD THOUSAND)
TABLE 15 GLOBAL SOLVENT IN GAMMA BUTYROLACTONE MARKET, BY REGION, 2017-2030 (USD THOUSAND)
TABLE 16 GLOBAL CASTING BINDER IN GLOBAL GAMMA BUTYROLACTONE MARKET, BY REGION, 2017-2030 (USD THOUSAND)
TABLE 17 GLOBAL HERBICIDES AND INSECTICIDES IN GAMMA BUTYROLACTONE MARKET, BY REGION, 2017-2030 (USD THOUSAND)
TABLE 18 GLOBAL BATTERIES AND CAPACITORS IN GAMMA BUTYROLACTONE MARKET, BY REGION, 2017-2030 (USD THOUSAND)
TABLE 19 GLOBAL PAINT STRIPPERS IN GAMMA BUTYROLACTONE MARKET, BY REGION, 2017-2030 (USD THOUSAND)
TABLE 20 GLOBAL POLISH REMOVERS IN GAMMA BUTYROLACTONE MARKET, BY REGION, 2017-2030 (USD THOUSAND)
TABLE 21 GLOBAL ANESTHETIC IN GAMMA BUTYROLACTONE MARKET, BY REGION, 2017-2030 (USD THOUSAND)
TABLE 22 GLOBAL SEDATIVE IN GAMMA BUTYROLACTONE MARKET, BY REGION, 2017-2030 (USD THOUSAND)
TABLE 23 GLOBAL OTHERS IN GAMMA BUTYROLACTONE MARKET, BY REGION, 2017-2030 (USD THOUSAND)
TABLE 24 GLOBAL GAMMA BUTYROLACTONE MARKET, BY END-USE, 2017-2030 (USD THOUSAND)
TABLE 25 GLOBAL PHARMACEUTICAL INDUSTRY IN GLOBAL GAMMA BUTYROLACTONE MARKET, BY REGION, 2017-2030 (USD THOUSAND)
TABLE 26 GLOBAL ELECTRICAL INDUSTRY IN GAMMA BUTYROLACTONE MARKET, BY REGION, 2017-2030 (USD THOUSAND)
TABLE 27 GLOBAL AGROCHEMICAL INDUSTRY IN GAMMA BUTYROLACTONE MARKET, BY REGION, 2017-2030 (USD THOUSAND)
TABLE 28 GLOBAL PETROLEUM INDUSTRY IN GAMMA BUTYROLACTONE MARKET, BY REGION, 2017-2030 (USD THOUSAND)
TABLE 29 GLOBAL FOOD INDUSTRY IN GAMMA BUTYROLACTONE MARKET, BY REGION, 2017-2030 (USD THOUSAND)
TABLE 30 GLOBAL OTHERS IN GAMMA BUTYROLACTONE MARKET, BY REGION, 2017-2030 (USD THOUSAND)
TABLE 31 GLOBAL GAMMA BUTYROLACTONE MARKET, BY REGION, 2017-2030 (USD THOUSAND)
TABLE 32 GLOBAL GAMMA BUTYROLACTONE MARKET, BY REGION, 2017-2030 (TONS)
TABLE 33 ASIA-PACIFIC GAMMA BUTYROLACTONE MARKET, BY COUNTRY, 2017-2030 (USD THOUSAND)
TABLE 34 ASIA-PACIFIC GAMMA BUTYROLACTONE MARKET, BY COUNTRY, 2017-2030 (TONS)
TABLE 35 ASIA-PACIFIC GAMMA BUTYROLACTONE MARKET, BY GRADE, 2017-2030 (USD THOUSAND)
TABLE 36 ASIA-PACIFIC GAMMA BUTYROLACTONE MARKET, BY GRADE, 2017-2030 (TONS)
TABLE 37 ASIA-PACIFIC GAMMA BUTYROLACTONE MARKET, BY PURITY, 2017-2030 (USD THOUSAND)
TABLE 38 ASIA-PACIFIC GAMMA BUTYROLACTONE MARKET, BY APPLICATION, 2017-2030 (USD THOUSAND)
TABLE 39 ASIA-PACIFIC GAMMA BUTYROLACTONE MARKET, BY END-USE, 2017-2030 (USD THOUSAND)
TABLE 40 CHINA GAMMA BUTYROLACTONE MARKET, BY GRADE, 2017-2030 (USD THOUSAND)
TABLE 41 CHINA GAMMA BUTYROLACTONE MARKET, BY GRADE, 2017-2030 (TONS)
TABLE 42 CHINA GAMMA BUTYROLACTONE MARKET, BY PURITY, 2017-2030 (USD THOUSAND)
TABLE 43 CHINA GAMMA BUTYROLACTONE MARKET, BY APPLICATION, 2017-2030 (USD THOUSAND)
TABLE 44 CHINA GAMMA BUTYROLACTONE MARKET, BY END-USE, 2017-2030 (USD THOUSAND)
TABLE 45 INDIA GAMMA BUTYROLACTONE MARKET, BY GRADE, 2017-2030 (USD THOUSAND)
TABLE 46 INDIA GAMMA BUTYROLACTONE MARKET, BY GRADE, 2017-2030 (TONS)
TABLE 47 INDIA GAMMA BUTYROLACTONE MARKET, BY PURITY, 2017-2030 (USD THOUSAND)
TABLE 48 INDIA GAMMA BUTYROLACTONE MARKET, BY APPLICATION, 2017-2030 (USD THOUSAND)
TABLE 49 INDIA GAMMA BUTYROLACTONE MARKET, BY END-USE, 2017-2030 (USD THOUSAND)
TABLE 50 JAPAN GAMMA BUTYROLACTONE MARKET, BY GRADE, 2017-2030 (USD THOUSAND)
TABLE 51 JAPAN GAMMA BUTYROLACTONE MARKET, BY GRADE, 2017-2030 (TONS)
TABLE 52 JAPAN GAMMA BUTYROLACTONE MARKET, BY PURITY, 2017-2030 (USD THOUSAND)
TABLE 53 JAPAN GAMMA BUTYROLACTONE MARKET, BY APPLICATION, 2017-2030 (USD THOUSAND)
TABLE 54 JAPAN GAMMA BUTYROLACTONE MARKET, BY END-USE, 2017-2030 (USD THOUSAND)
TABLE 55 SOUTH KOREA GAMMA BUTYROLACTONE MARKET, BY GRADE, 2017-2030 (USD THOUSAND)
TABLE 56 SOUTH KOREA GAMMA BUTYROLACTONE MARKET, BY GRADE, 2017-2030 (TONS)
TABLE 57 SOUTH KOREA GAMMA BUTYROLACTONE MARKET, BY PURITY, 2017-2030 (USD THOUSAND)
TABLE 58 SOUTH KOREA GAMMA BUTYROLACTONE MARKET, BY APPLICATION, 2017-2030 (USD THOUSAND)
TABLE 59 SOUTH KOREA GAMMA BUTYROLACTONE MARKET, BY END-USE, 2017-2030 (USD THOUSAND)
TABLE 60 SINGAPORE GAMMA BUTYROLACTONE MARKET, BY GRADE, 2017-2030 (USD THOUSAND)
TABLE 61 SINGAPORE GAMMA BUTYROLACTONE MARKET, BY GRADE, 2017-2030 (TONS)
TABLE 62 SINGAPORE GAMMA BUTYROLACTONE MARKET, BY PURITY, 2017-2030 (USD THOUSAND)
TABLE 63 SINGAPORE GAMMA BUTYROLACTONE MARKET, BY APPLICATION, 2017-2030 (USD THOUSAND)
TABLE 64 SINGAPORE GAMMA BUTYROLACTONE MARKET, BY END-USE, 2017-2030 (USD THOUSAND)
TABLE 65 THAILAND GAMMA BUTYROLACTONE MARKET, BY GRADE, 2017-2030 (USD THOUSAND)
TABLE 66 THAILAND GAMMA BUTYROLACTONE MARKET, BY GRADE, 2017-2030 (TONS)
TABLE 67 THAILAND GAMMA BUTYROLACTONE MARKET, BY PURITY, 2017-2030 (USD THOUSAND)
TABLE 68 THAILAND GAMMA BUTYROLACTONE MARKET, BY APPLICATION, 2017-2030 (USD THOUSAND)
TABLE 69 THAILAND GAMMA BUTYROLACTONE MARKET, BY END-USE, 2017-2030 (USD THOUSAND)
TABLE 70 AUSTRALIA & NEW ZEALAND GAMMA BUTYROLACTONE MARKET, BY GRADE, 2017-2030 (USD THOUSAND)
TABLE 71 AUSTRALIA & NEW ZEALAND GAMMA BUTYROLACTONE MARKET, BY GRADE, 2017-2030 (TONS)
TABLE 72 AUSTRALIA & NEW ZEALAND GAMMA BUTYROLACTONE MARKET, BY PURITY, 2017-2030 (USD THOUSAND)
TABLE 73 AUSTRALIA & NEW ZEALAND GAMMA BUTYROLACTONE MARKET, BY APPLICATION, 2017-2030 (USD THOUSAND)
TABLE 74 AUSTRALIA & NEW ZEALAND GAMMA BUTYROLACTONE MARKET, BY END-USE, 2017-2030 (USD THOUSAND)
TABLE 75 INDONESIA GAMMA BUTYROLACTONE MARKET, BY GRADE, 2017-2030 (USD THOUSAND)
TABLE 76 INDONESIA GAMMA BUTYROLACTONE MARKET, BY GRADE, 2017-2030 (TONS)
TABLE 77 INDONESIA GAMMA BUTYROLACTONE MARKET, BY PURITY, 2017-2030 (USD THOUSAND)
TABLE 78 INDONESIA GAMMA BUTYROLACTONE MARKET, BY APPLICATION, 2017-2030 (USD THOUSAND)
TABLE 79 INDONESIA GAMMA BUTYROLACTONE MARKET, BY END-USE, 2017-2030 (USD THOUSAND)
TABLE 80 MALAYSIA GAMMA BUTYROLACTONE MARKET, BY GRADE, 2017-2030 (USD THOUSAND)
TABLE 81 MALAYSIA GAMMA BUTYROLACTONE MARKET, BY GRADE, 2017-2030 (TONS)
TABLE 82 MALAYSIA GAMMA BUTYROLACTONE MARKET, BY PURITY, 2017-2030 (USD THOUSAND)
TABLE 83 MALAYSIA GAMMA BUTYROLACTONE MARKET, BY APPLICATION, 2017-2030 (USD THOUSAND)
TABLE 84 MALAYSIA GAMMA BUTYROLACTONE MARKET, BY END-USE, 2017-2030 (USD THOUSAND)
TABLE 85 PHILIPPINES GAMMA BUTYROLACTONE MARKET, BY GRADE, 2017-2030 (USD THOUSAND)
TABLE 86 PHILIPPINES GAMMA BUTYROLACTONE MARKET, BY GRADE, 2017-2030 (TONS)
TABLE 87 PHILIPPINES GAMMA BUTYROLACTONE MARKET, BY PURITY, 2017-2030 (USD THOUSAND)
TABLE 88 PHILIPPINES GAMMA BUTYROLACTONE MARKET, BY APPLICATION, 2017-2030 (USD THOUSAND)
TABLE 89 PHILIPPINES GAMMA BUTYROLACTONE MARKET, BY END-USE, 2017-2030 (USD THOUSAND)
TABLE 90 REST OF ASIA-PACIFIC GAMMA BUTYROLACTONE MARKET, BY GRADE, 2017-2030 (USD THOUSAND)
TABLE 91 REST OF ASIA-PACIFIC GAMMA BUTYROLACTONE MARKET, BY GRADE, 2017-2030 (TONS)
TABLE 92 EUROPE GAMMA BUTYROLACTONE MARKET, BY COUNTRY, 2017-2030 (USD THOUSAND)
TABLE 93 EUROPE GAMMA BUTYROLACTONE MARKET, BY COUNTRY, 2017-2030 (TONS)
TABLE 94 EUROPE GAMMA BUTYROLACTONE MARKET, BY GRADE, 2017-2030 (USD THOUSAND)
TABLE 95 EUROPE GAMMA BUTYROLACTONE MARKET, BY GRADE, 2017-2030 (TONS)
TABLE 96 EUROPE GAMMA BUTYROLACTONE MARKET, BY PURITY, 2017-2030 (USD THOUSAND)
TABLE 97 EUROPE GAMMA BUTYROLACTONE MARKET, BY APPLICATION, 2017-2030 (USD THOUSAND)
TABLE 98 EUROPE GAMMA BUTYROLACTONE MARKET, BY END-USE, 2017-2030 (USD THOUSAND)
TABLE 99 FRANCE GAMMA BUTYROLACTONE MARKET, BY GRADE, 2017-2030 (USD THOUSAND)
TABLE 100 FRANCE GAMMA BUTYROLACTONE MARKET, BY GRADE, 2017-2030 (TONS)
TABLE 101 FRANCE GAMMA BUTYROLACTONE MARKET, BY PURITY, 2017-2030 (USD THOUSAND)
TABLE 102 FRANCE GAMMA BUTYROLACTONE MARKET, BY APPLICATION, 2017-2030 (USD THOUSAND)
TABLE 103 FRANCE GAMMA BUTYROLACTONE MARKET, BY END-USE, 2017-2030 (USD THOUSAND)
TABLE 104 GERMANY GAMMA BUTYROLACTONE MARKET, BY GRADE, 2017-2030 (USD THOUSAND)
TABLE 105 GERMANY GAMMA BUTYROLACTONE MARKET, BY GRADE, 2017-2030 (TONS)
TABLE 106 GERMANY GAMMA BUTYROLACTONE MARKET, BY PURITY, 2017-2030 (USD THOUSAND)
TABLE 107 GERMANY GAMMA BUTYROLACTONE MARKET, BY APPLICATION, 2017-2030 (USD THOUSAND)
TABLE 108 GERMANY GAMMA BUTYROLACTONE MARKET, BY END-USE, 2017-2030 (USD THOUSAND)
TABLE 109 U.K. GAMMA BUTYROLACTONE MARKET, BY GRADE, 2017-2030 (USD THOUSAND)
TABLE 110 U.K. GAMMA BUTYROLACTONE MARKET, BY GRADE, 2017-2030 (TONS)
TABLE 111 U.K. GAMMA BUTYROLACTONE MARKET, BY PURITY, 2017-2030 (USD THOUSAND)
TABLE 112 U.K. GAMMA BUTYROLACTONE MARKET, BY APPLICATION, 2017-2030 (USD THOUSAND)
TABLE 113 U.K. GAMMA BUTYROLACTONE MARKET, BY END-USE, 2017-2030 (USD THOUSAND)
TABLE 114 ITALY GAMMA BUTYROLACTONE MARKET, BY GRADE, 2017-2030 (USD THOUSAND)
TABLE 115 ITALY GAMMA BUTYROLACTONE MARKET, BY GRADE, 2017-2030 (TONS)
TABLE 116 ITALY GAMMA BUTYROLACTONE MARKET, BY PURITY, 2017-2030 (USD THOUSAND)
TABLE 117 ITALY GAMMA BUTYROLACTONE MARKET, BY APPLICATION, 2017-2030 (USD THOUSAND)
TABLE 118 ITALY GAMMA BUTYROLACTONE MARKET, BY END-USE, 2017-2030 (USD THOUSAND)
TABLE 119 TURKEY GAMMA BUTYROLACTONE MARKET, BY GRADE, 2017-2030 (USD THOUSAND)
TABLE 120 TURKEY GAMMA BUTYROLACTONE MARKET, BY GRADE, 2017-2030 (TONS)
TABLE 121 TURKEY GAMMA BUTYROLACTONE MARKET, BY PURITY, 2017-2030 (USD THOUSAND)
TABLE 122 TURKEY GAMMA BUTYROLACTONE MARKET, BY APPLICATION, 2017-2030 (USD THOUSAND)
TABLE 123 TURKEY GAMMA BUTYROLACTONE MARKET, BY END-USE, 2017-2030 (USD THOUSAND)
TABLE 124 BELGIUM GAMMA BUTYROLACTONE MARKET, BY GRADE, 2017-2030 (USD THOUSAND)
TABLE 125 BELGIUM GAMMA BUTYROLACTONE MARKET, BY GRADE, 2017-2030 (TONS)
TABLE 126 BELGIUM GAMMA BUTYROLACTONE MARKET, BY PURITY, 2017-2030 (USD THOUSAND)
TABLE 127 BELGIUM GAMMA BUTYROLACTONE MARKET, BY APPLICATION, 2017-2030 (USD THOUSAND)
TABLE 128 BELGIUM GAMMA BUTYROLACTONE MARKET, BY END-USE, 2017-2030 (USD THOUSAND)
TABLE 129 SPAIN GAMMA BUTYROLACTONE MARKET, BY GRADE, 2017-2030 (USD THOUSAND)
TABLE 130 SPAIN GAMMA BUTYROLACTONE MARKET, BY GRADE, 2017-2030 (TONS)
TABLE 131 SPAIN GAMMA BUTYROLACTONE MARKET, BY PURITY, 2017-2030 (USD THOUSAND)
TABLE 132 SPAIN GAMMA BUTYROLACTONE MARKET, BY APPLICATION, 2017-2030 (USD THOUSAND)
TABLE 133 SPAIN GAMMA BUTYROLACTONE MARKET, BY END-USE, 2017-2030 (USD THOUSAND)
TABLE 134 RUSSIA GAMMA BUTYROLACTONE MARKET, BY GRADE, 2017-2030 (USD THOUSAND)
TABLE 135 RUSSIA GAMMA BUTYROLACTONE MARKET, BY GRADE, 2017-2030 (TONS)
TABLE 136 RUSSIA GAMMA BUTYROLACTONE MARKET, BY PURITY, 2017-2030 (USD THOUSAND)
TABLE 137 RUSSIA GAMMA BUTYROLACTONE MARKET, BY APPLICATION, 2017-2030 (USD THOUSAND)
TABLE 138 RUSSIA GAMMA BUTYROLACTONE MARKET, BY END-USE, 2017-2030 (USD THOUSAND)
TABLE 139 SWITZERLAND GAMMA BUTYROLACTONE MARKET, BY GRADE, 2017-2030 (USD THOUSAND)
TABLE 140 SWITZERLAND GAMMA BUTYROLACTONE MARKET, BY GRADE, 2017-2030 (TONS)
TABLE 141 SWITZERLAND GAMMA BUTYROLACTONE MARKET, BY PURITY, 2017-2030 (USD THOUSAND)
TABLE 142 SWITZERLAND GAMMA BUTYROLACTONE MARKET, BY APPLICATION, 2017-2030 (USD THOUSAND)
TABLE 143 SWITZERLAND GAMMA BUTYROLACTONE MARKET, BY END-USE, 2017-2030 (USD THOUSAND)
TABLE 144 NETHERLANDS GAMMA BUTYROLACTONE MARKET, BY GRADE, 2017-2030 (USD THOUSAND)
TABLE 145 NETHERLANDS GAMMA BUTYROLACTONE MARKET, BY GRADE, 2017-2030 (TONS)
TABLE 146 NETHERLANDS GAMMA BUTYROLACTONE MARKET, BY PURITY, 2017-2030 (USD THOUSAND)
TABLE 147 NETHERLANDS GAMMA BUTYROLACTONE MARKET, BY APPLICATION, 2017-2030 (USD THOUSAND)
TABLE 148 NETHERLANDS GAMMA BUTYROLACTONE MARKET, BY END-USE, 2017-2030 (USD THOUSAND)
TABLE 149 REST OF EUROPE GAMMA BUTYROLACTONE MARKET, BY GRADE, 2017-2030 (USD THOUSAND)
TABLE 150 REST OF EUROPE GAMMA BUTYROLACTONE MARKET, BY GRADE, 2017-2030 (TONS)
TABLE 151 NORTH AMERICA GAMMA BUTYROLACTONE MARKET, BY COUNTRY, 2017-2030 (USD THOUSAND)
TABLE 152 NORTH AMERICA GAMMA BUTYROLACTONE MARKET, BY COUNTRY, 2017-2030 (TONS)
TABLE 153 NORTH AMERICA GAMMA BUTYROLACTONE MARKET, BY GRADE, 2017-2030 (USD THOUSAND)
TABLE 154 NORTH AMERICA GAMMA BUTYROLACTONE MARKET, BY GRADE, 2017-2030 (TONS)
TABLE 155 NORTH AMERICA GAMMA BUTYROLACTONE MARKET, BY PURITY, 2017-2030 (USD THOUSAND)
TABLE 156 NORTH AMERICA GAMMA BUTYROLACTONE MARKET, BY APPLICATION, 2017-2030 (USD THOUSAND)
TABLE 157 NORTH AMERICA GAMMA BUTYROLACTONE MARKET, BY END-USE, 2017-2030 (USD THOUSAND)
TABLE 158 U.S. GAMMA BUTYROLACTONE MARKET, BY GRADE, 2017-2030 (USD THOUSAND)
TABLE 159 U.S. GAMMA BUTYROLACTONE MARKET, BY GRADE, 2017-2030 (TONS)
TABLE 160 U.S. GAMMA BUTYROLACTONE MARKET, BY PURITY, 2017-2030 (USD THOUSAND)
TABLE 161 U.S. GAMMA BUTYROLACTONE MARKET, BY APPLICATION, 2017-2030 (USD THOUSAND)
TABLE 162 U.S. GAMMA BUTYROLACTONE MARKET, BY END-USE, 2017-2030 (USD THOUSAND)
TABLE 163 CANADA GAMMA BUTYROLACTONE MARKET, BY GRADE, 2017-2030 (USD THOUSAND)
TABLE 164 CANADA GAMMA BUTYROLACTONE MARKET, BY GRADE, 2017-2030 (TONS)
TABLE 165 CANADA GAMMA BUTYROLACTONE MARKET, BY PURITY, 2017-2030 (USD THOUSAND)
TABLE 166 CANADA GAMMA BUTYROLACTONE MARKET, BY APPLICATION, 2017-2030 (USD THOUSAND)
TABLE 167 CANADA GAMMA BUTYROLACTONE MARKET, BY END-USE, 2017-2030 (USD THOUSAND)
TABLE 168 MEXICO GAMMA BUTYROLACTONE MARKET, BY GRADE, 2017-2030 (USD THOUSAND)
TABLE 169 MEXICO GAMMA BUTYROLACTONE MARKET, BY GRADE, 2017-2030 (TONS)
TABLE 170 MEXICO GAMMA BUTYROLACTONE MARKET, BY PURITY, 2017-2030 (USD THOUSAND)
TABLE 171 MEXICO GAMMA BUTYROLACTONE MARKET, BY APPLICATION, 2017-2030 (USD THOUSAND)
TABLE 172 MEXICO GAMMA BUTYROLACTONE MARKET, BY END-USE, 2017-2030 (USD THOUSAND)
TABLE 173 SOUTH AMERICA GAMMA BUTYROLACTONE MARKET, BY COUNTRY, 2017-2030 (USD THOUSAND)
TABLE 174 SOUTH AMERICA GAMMA BUTYROLACTONE MARKET, BY COUNTRY, 2017-2030 (TONS)
TABLE 175 SOUTH AMERICA GAMMA BUTYROLACTONE MARKET, BY GRADE, 2017-2030 (USD THOUSAND)
TABLE 176 SOUTH AMERICA GAMMA BUTYROLACTONE MARKET, BY GRADE, 2017-2030 (TONS)
TABLE 177 SOUTH AMERICA GAMMA BUTYROLACTONE MARKET, BY PURITY, 2017-2030 (USD THOUSAND)
TABLE 178 SOUTH AMERICA GAMMA BUTYROLACTONE MARKET, BY APPLICATION, 2017-2030 (USD THOUSAND)
TABLE 179 SOUTH AMERICA GAMMA BUTYROLACTONE MARKET, BY END-USE, 2017-2030 (USD THOUSAND)
TABLE 180 BRAZIL GAMMA BUTYROLACTONE MARKET, BY GRADE, 2017-2030 (USD THOUSAND)
TABLE 181 BRAZIL GAMMA BUTYROLACTONE MARKET, BY GRADE, 2017-2030 (TONS)
TABLE 182 BRAZIL GAMMA BUTYROLACTONE MARKET, BY PURITY, 2017-2030 (USD THOUSAND)
TABLE 183 BRAZIL GAMMA BUTYROLACTONE MARKET, BY APPLICATION, 2017-2030 (USD THOUSAND)
TABLE 184 BRAZIL GAMMA BUTYROLACTONE MARKET, BY END-USE, 2017-2030 (USD THOUSAND)
TABLE 185 ARGENTINA GAMMA BUTYROLACTONE MARKET, BY GRADE, 2017-2030 (USD THOUSAND)
TABLE 186 ARGENTINA GAMMA BUTYROLACTONE MARKET, BY GRADE, 2017-2030 (TONS)
TABLE 187 ARGENTINA GAMMA BUTYROLACTONE MARKET, BY PURITY, 2017-2030 (USD THOUSAND)
TABLE 188 ARGENTINA GAMMA BUTYROLACTONE MARKET, BY APPLICATION, 2017-2030 (USD THOUSAND)
TABLE 189 ARGENTINA GAMMA BUTYROLACTONE MARKET, BY END-USE, 2017-2030 (USD THOUSAND)
TABLE 190 REST OF SOUTH AMERICA GAMMA BUTYROLACTONE MARKET, BY GRADE, 2017-2030 (USD THOUSAND)
TABLE 191 REST OF SOUTH AMERICA GAMMA BUTYROLACTONE MARKET, BY GRADE, 2017-2030 (TONS)
TABLE 192 MIDDLE EAST AND AFRICA GAMMA BUTYROLACTONE MARKET, BY COUNTRY, 2017-2030 (USD THOUSAND)
TABLE 193 MIDDLE EAST AND AFRICA GAMMA BUTYROLACTONE MARKET, BY COUNTRY, 2017-2030 (TONS)
TABLE 194 MIDDLE EAST AND AFRICA GAMMA BUTYROLACTONE MARKET, BY GRADE, 2017-2030 (USD THOUSAND)
TABLE 195 MIDDLE EAST AND AFRICA GAMMA BUTYROLACTONE MARKET, BY GRADE, 2017-2030 (TONS)
TABLE 196 MIDDLE EAST AND AFRICA GAMMA BUTYROLACTONE MARKET, BY PURITY, 2017-2030 (USD THOUSAND)
TABLE 197 MIDDLE EAST AND AFRICA GAMMA BUTYROLACTONE MARKET, BY APPLICATION, 2017-2030 (USD THOUSAND)
TABLE 198 MIDDLE EAST AND AFRICA GAMMA BUTYROLACTONE MARKET, BY END-USE, 2017-2030 (USD THOUSAND)
TABLE 199 SOUTH AFRICA GAMMA BUTYROLACTONE MARKET, BY GRADE, 2017-2030 (USD THOUSAND)
TABLE 200 SOUTH AFRICA GAMMA BUTYROLACTONE MARKET, BY GRADE, 2017-2030 (TONS)
TABLE 201 SOUTH AFRICA GAMMA BUTYROLACTONE MARKET, BY PURITY, 2017-2030 (USD THOUSAND)
TABLE 202 SOUTH AFRICA GAMMA BUTYROLACTONE MARKET, BY APPLICATION, 2017-2030 (USD THOUSAND)
TABLE 203 SOUTH AFRICA GAMMA BUTYROLACTONE MARKET, BY END-USE, 2017-2030 (USD THOUSAND)
TABLE 204 SAUDI ARABIA GAMMA BUTYROLACTONE MARKET, BY GRADE, 2017-2030 (USD THOUSAND)
TABLE 205 SAUDI ARABIA GAMMA BUTYROLACTONE MARKET, BY GRADE, 2017-2030 (TONS)
TABLE 206 SAUDI ARABIA GAMMA BUTYROLACTONE MARKET, BY PURITY, 2017-2030 (USD THOUSAND)
TABLE 207 SAUDI ARABIA GAMMA BUTYROLACTONE MARKET, BY APPLICATION, 2017-2030 (USD THOUSAND)
TABLE 208 SAUDI ARABIA GAMMA BUTYROLACTONE MARKET, BY END-USE, 2017-2030 (USD THOUSAND)
TABLE 209 UNITED ARAB EMIRATES GAMMA BUTYROLACTONE MARKET, BY GRADE, 2017-2030 (USD THOUSAND)
TABLE 210 UNITED ARAB EMIRATES GAMMA BUTYROLACTONE MARKET, BY GRADE, 2017-2030 (TONS)
TABLE 211 UNITED ARAB EMIRATES GAMMA BUTYROLACTONE MARKET, BY PURITY, 2017-2030 (USD THOUSAND)
TABLE 212 UNITED ARAB EMIRATES GAMMA BUTYROLACTONE MARKET, BY APPLICATION, 2017-2030 (USD THOUSAND)
TABLE 213 UNITED ARAB EMIRATES GAMMA BUTYROLACTONE MARKET, BY END-USE, 2017-2030 (USD THOUSAND)
TABLE 214 ISRAEL GAMMA BUTYROLACTONE MARKET, BY GRADE, 2017-2030 (USD THOUSAND)
TABLE 215 ISRAEL GAMMA BUTYROLACTONE MARKET, BY GRADE, 2017-2030 (TONS)
TABLE 216 ISRAEL GAMMA BUTYROLACTONE MARKET, BY PURITY, 2017-2030 (USD THOUSAND)
TABLE 217 ISRAEL GAMMA BUTYROLACTONE MARKET, BY APPLICATION, 2017-2030 (USD THOUSAND)
TABLE 218 ISRAEL GAMMA BUTYROLACTONE MARKET, BY END-USE, 2017-2030 (USD THOUSAND)
TABLE 219 EGYPT GAMMA BUTYROLACTONE MARKET, BY GRADE, 2017-2030 (USD THOUSAND)
TABLE 220 EGYPT GAMMA BUTYROLACTONE MARKET, BY GRADE, 2017-2030 (TONS)
TABLE 221 EGYPT GAMMA BUTYROLACTONE MARKET, BY PURITY, 2017-2030 (USD THOUSAND)
TABLE 222 EGYPT GAMMA BUTYROLACTONE MARKET, BY APPLICATION, 2017-2030 (USD THOUSAND)
TABLE 223 EGYPT GAMMA BUTYROLACTONE MARKET, BY END-USE, 2017-2030 (USD THOUSAND)
TABLE 224 REST OF MIDDLE EAST AND AFRICA GAMMA BUTYROLACTONE MARKET, BY GRADE, 2017-2030 (USD THOUSAND)
TABLE 225 REST OF MIDDLE EAST AND AFRICA GAMMA BUTYROLACTONE MARKET, BY GRADE, 2017-2030 (TONS)
List of Figure
FIGURE 1 GLOBAL GAMMA BUTYROLACTONE MARKET
FIGURE 2 GLOBAL GAMMA BUTYROLACTONE MARKET: DATA TRIANGULATION
FIGURE 3 GLOBAL GAMMA BUTYROLACTONE MARKET: DROC ANALYSIS
FIGURE 4 GLOBAL GAMMA BUTYROLACTONE MARKET: GLOBAL VS REGIONAL MARKET ANALYSIS
FIGURE 5 GLOBAL GAMMA BUTYROLACTONE MARKET: COMPANY RESEARCH ANALYSIS
FIGURE 6 GLOBAL GAMMA BUTYROLACTONE MARKET: THE GRADE LIFE LINE CURVE
FIGURE 7 GLOBAL GAMMA BUTYROLACTONE MARKET: MULTIVARIATE MODELLING
FIGURE 8 GLOBAL GAMMA BUTYROLACTONE MARKET: INTERVIEW DEMOGRAPHICS
FIGURE 9 GLOBAL GAMMA BUTYROLACTONE MARKET: DBMR MARKET POSITION GRID
FIGURE 10 GLOBAL GAMMA BUTYROLACTONE MARKET: MARKET END-USE COVERAGE GRID
FIGURE 11 GLOBAL GAMMA BUTYROLACTONE MARKET: THE MARKET CHALLENGE MATRIX
FIGURE 12 GLOBAL GAMMA BUTYROLACTONE MARKET: VENDOR SHARE ANALYSIS
FIGURE 13 GLOBAL GAMMA BUTYROLACTONE MARKET: SEGMENTATION
FIGURE 14 ASIA-PACIFIC IS EXPECTED TO DOMINATE THE GLOBAL GAMMA BUTYROLACTONE MARKET AND IS EXPECTED TO GROW WITH THE HIGHEST CAGR IN THE FORECAST PERIOD
FIGURE 15 GROWING APPLICATION OF DERIVED CHEMICAL PRODUCTS IS EXPECTED TO DRIVE THE GLOBAL GAMMA BUTYROLACTONE MARKET GROWTH IN THE FORECAST PERIOD
FIGURE 16 INDUSTRIAL CLASS (5 WT. %) SEGMENT IS EXPECTED TO ACCOUNT FOR THE LARGEST SHARE OF THE GLOBAL GAMMA BUTYROLACTONE MARKET IN 2022 & 2029
FIGURE 17 ASIA-PACIFIC IS THE FASTEST-GROWING MARKET FOR GAMMA BUTYROLACTONE MARKET MANUFACTURERS IN THE FORECAST PERIOD
FIGURE 18 DRIVERS, RESTRAINTS, OPPORTUNITIES, AND CHALLENGE OF THE GLOBAL GAMMA BUTYROLACTONE MARKET
FIGURE 19 GLOBAL GAMMA BUTYROLACTONE MARKET: BY GRADE, 2022
FIGURE 20 GLOBAL GAMMA BUTYROLACTONE MARKET: BY PURITY, 2022
FIGURE 21 GLOBAL GAMMA BUTYROLACTONE MARKET: BY APPLICATION, 2022
FIGURE 22 GLOBAL GAMMA BUTYROLACTONE MARKET: BY END-USE, 2022
FIGURE 23 GLOBAL GAMMA BUTYROLACTONE MARKET: SNAPSHOT (2022)
FIGURE 24 GLOBAL GAMMA BUTYROLACTONE MARKET: BY REGION (2022)
FIGURE 25 GLOBAL GAMMA BUTYROLACTONE MARKET: BY REGION (2023 & 2030)
FIGURE 26 GLOBAL GAMMA BUTYROLACTONE MARKET: BY REGION (2022 & 2030)
FIGURE 27 GLOBAL GAMMA BUTYROLACTONE MARKET: BY GRADE (2023-2030)
FIGURE 28 ASIA-PACIFIC GAMMA BUTYROLACTONE MARKET: SNAPSHOT (2022)
FIGURE 29 ASIA-PACIFIC GAMMA BUTYROLACTONE MARKET: BY COUNTRY (2022)
FIGURE 30 ASIA-PACIFIC GAMMA BUTYROLACTONE MARKET: BY COUNTRY (2023 & 2030)
FIGURE 31 ASIA-PACIFIC GAMMA BUTYROLACTONE MARKET: BY COUNTRY (2022 & 2030)
FIGURE 32 ASIA-PACIFIC GAMMA BUTYROLACTONE MARKET: BY GRADE (2022 - 2030)
FIGURE 33 EUROPE GAMMA BUTYROLACTONE MARKET: SNAPSHOT (2022)
FIGURE 34 EUROPE GAMMA BUTYROLACTONE MARKET: BY COUNTRY (2022)
FIGURE 35 EUROPE GAMMA BUTYROLACTONE MARKET: BY COUNTRY (2023 & 2030)
FIGURE 36 EUROPE GAMMA BUTYROLACTONE MARKET: BY COUNTRY (2022 & 2030)
FIGURE 37 EUROPE GAMMA BUTYROLACTONE MARKET: BY GRADE (2023 - 2030)
FIGURE 38 NORTH AMERICA GAMMA BUTYROLACTONE MARKET: SNAPSHOT (2022)
FIGURE 39 NORTH AMERICA GAMMA BUTYROLACTONE MARKET: BY COUNTRY (2022)
FIGURE 40 NORTH AMERICA GAMMA BUTYROLACTONE MARKET: BY COUNTRY (2023 & 2030)
FIGURE 41 NORTH AMERICA GAMMA BUTYROLACTONE MARKET: BY COUNTRY (2022 & 2030)
FIGURE 42 NORTH AMERICA GAMMA BUTYROLACTONE MARKET: BY GRADE (2023 - 2030)
FIGURE 43 SOUTH AMERICA GAMMA BUTYROLACTONE MARKET: SNAPSHOT (2022)
FIGURE 44 SOUTH AMERICA GAMMA BUTYROLACTONE MARKET: BY COUNTRY (2022)
FIGURE 45 SOUTH AMERICA GAMMA BUTYROLACTONE MARKET: BY COUNTRY (2023 & 2030)
FIGURE 46 SOUTH AMERICA GAMMA BUTYROLACTONE MARKET: BY COUNTRY (2022 & 2030)
FIGURE 47 SOUTH AMERICA GAMMA BUTYROLACTONE MARKET: BY GRADE (2023 - 2030)
FIGURE 48 MIDDLE EAST AND AFRICA GAMMA BUTYROLACTONE MARKET: SNAPSHOT (2022)
FIGURE 49 MIDDLE EAST AND AFRICA GAMMA BUTYROLACTONE MARKET: BY COUNTRY (2022)
FIGURE 50 MIDDLE EAST AND AFRICA GAMMA BUTYROLACTONE MARKET: BY COUNTRY (2023 & 2030)
FIGURE 51 MIDDLE EAST AND AFRICA GAMMA BUTYROLACTONE MARKET: BY COUNTRY (2022 & 2030)
FIGURE 52 MIDDLE EAST AND AFRICA GAMMA BUTYROLACTONE MARKET: BY GRADE (2023 - 2030)
FIGURE 53 GLOBAL GAMMA BUTYROLACTONE MARKET: COMPANY SHARE 2022 (%)
FIGURE 54 NORTH AMERICA GAMMA BUTYROLACTONE MARKET: COMPANY SHARE 2022 (%)
FIGURE 55 EUROPE GAMMA BUTYROLACTONE MARKET: COMPANY SHARE 2022 (%)
FIGURE 56 ASIA-PACIFIC GAMMA BUTYROLACTONE MARKET: COMPANY SHARE 2022 (%)
Global Gamma Butyrolactone Market, Supply Chain Analysis and Ecosystem Framework
To support market growth and help clients navigate the impact of geopolitical shifts, DBMR has integrated in-depth supply chain analysis into its Global Gamma Butyrolactone Market research reports. This addition empowers clients to respond effectively to global changes affecting their industries. The supply chain analysis section includes detailed insights such as Global Gamma Butyrolactone Market consumption and production by country, price trend analysis, the impact of tariffs and geopolitical developments, and import and export trends by country and HSN code. It also highlights major suppliers with data on production capacity and company profiles, as well as key importers and exporters. In addition to research, DBMR offers specialized supply chain consulting services backed by over a decade of experience, providing solutions like supplier discovery, supplier risk assessment, price trend analysis, impact evaluation of inflation and trade route changes, and comprehensive market trend analysis.
Data collection and base year analysis are done using data collection modules with large sample sizes. The stage includes obtaining market information or related data through various sources and strategies. It includes examining and planning all the data acquired from the past in advance. It likewise envelops the examination of information inconsistencies seen across different information sources. The market data is analysed and estimated using market statistical and coherent models. Also, market share analysis and key trend analysis are the major success factors in the market report. To know more, please request an analyst call or drop down your inquiry.
The key research methodology used by DBMR research team is data triangulation which involves data mining, analysis of the impact of data variables on the market and primary (industry expert) validation. Data models include Vendor Positioning Grid, Market Time Line Analysis, Market Overview and Guide, Company Positioning Grid, Patent Analysis, Pricing Analysis, Company Market Share Analysis, Standards of Measurement, Global versus Regional and Vendor Share Analysis. To know more about the research methodology, drop in an inquiry to speak to our industry experts.
Data Bridge Market Research is a leader in advanced formative research. We take pride in servicing our existing and new customers with data and analysis that match and suits their goal. The report can be customized to include price trend analysis of target brands understanding the market for additional countries (ask for the list of countries), clinical trial results data, literature review, refurbished market and product base analysis. Market analysis of target competitors can be analyzed from technology-based analysis to market portfolio strategies. We can add as many competitors that you require data about in the format and data style you are looking for. Our team of analysts can also provide you data in crude raw excel files pivot tables (Fact book) or can assist you in creating presentations from the data sets available in the report.


