
Global Green Bio Polyols Market
Market Size in USD Million
 USD
875.43 Million
USD
1,483.90 Million
2024
2032
USD
875.43 Million
USD
1,483.90 Million
2024
2032
| 2025 - 2032 | |
| USD 875.43 Million | |
| USD 1,483.90 Million | |
| % | |
|
Green and Bio Polyols Market Analysis
Crop green and bio polyols market has an increasing demand for rigid and flexible polyurethane in various applications like sports and athletic footwear, as consumers are increasingly seek eco-friendly alternatives that minimize environmental impact while ensuring sustainable practices and less environmental effect, thereby driving market growth globally.
Green and Bio Polyols Market Size
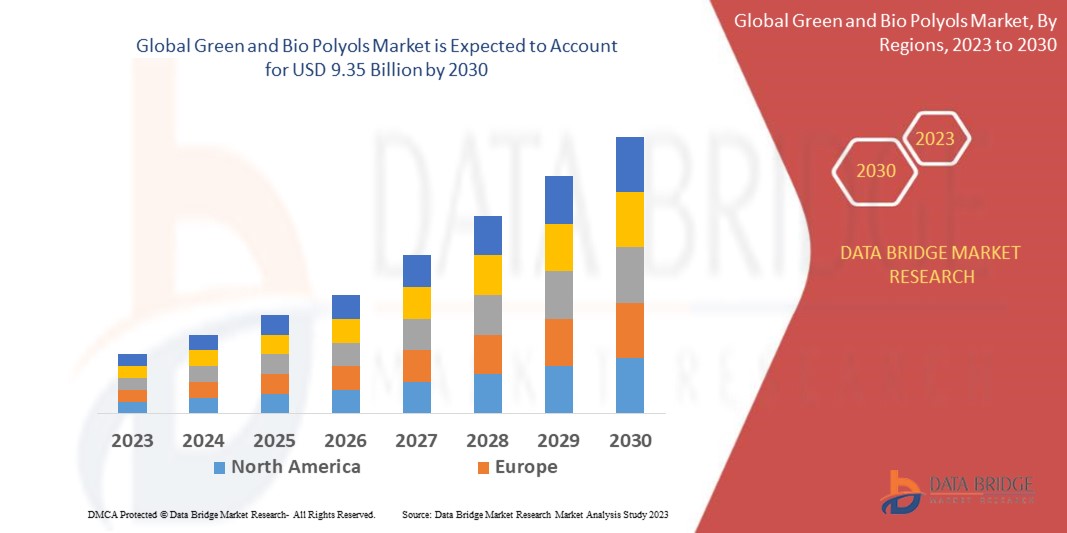
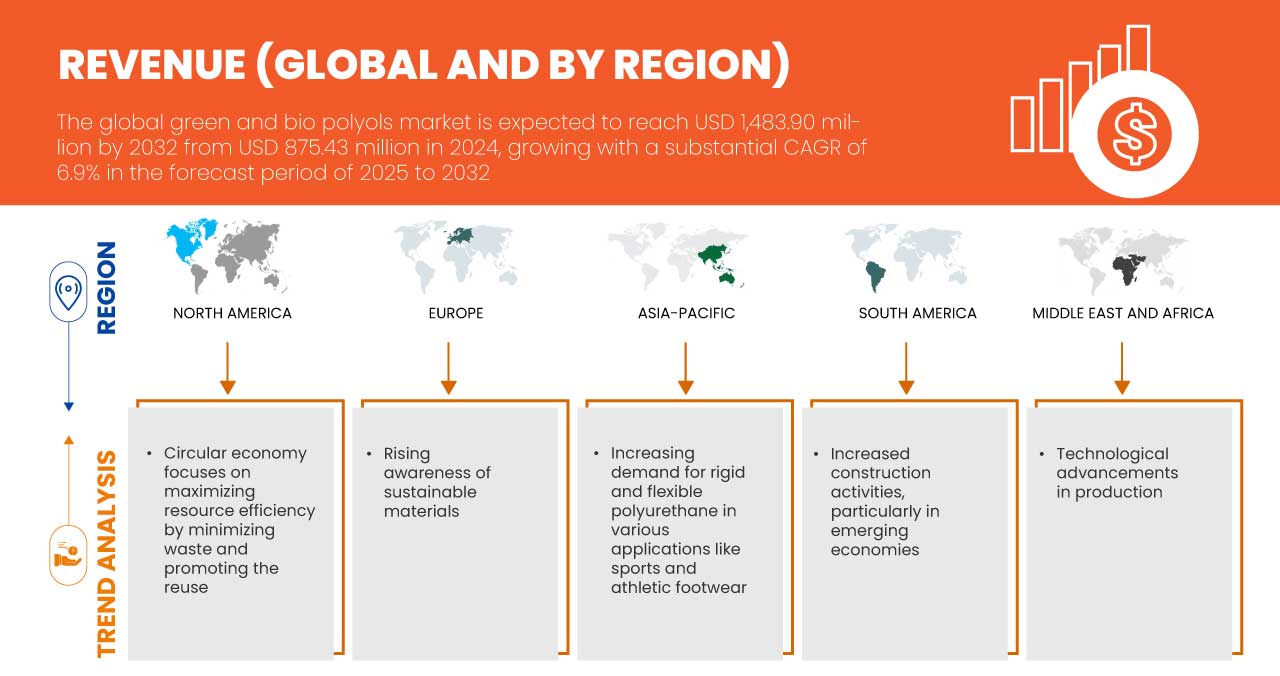
Global green and bio polyols market is expected to reach USD 1,483.90 million by 2032 from USD 875.43 million in 2024, growing with a substantial CAGR of 6.9% in the forecast period of 2025 to 2032. In addition to the insights on market scenarios such as market value, growth rate, segmentation, geographical coverage, and major players, the market reports curated by the Data Bridge Market Research also include in-depth expert analysis, pricing analysis, brand share analysis, consumer survey, demography analysis, supply chain analysis, value chain analysis, raw material/consumables overview, vendor selection criteria, PESTLE Analysis, Porter Analysis, and regulatory framework.
Green and Bio Polyols Market Trends
“Rising Awareness of Sustainable Materials ”
The growing global emphasis on sustainability is significantly influencing the demand for green and bio-based polyols, reshaping the market landscape. With increased awareness of the environmental consequences of fossil fuel-derived products, consumers and industries alike are shifting toward sustainable materials. This paradigm shift has catalyzed innovation and adoption of green and bio polyols, which are derived from renewable resources like plant-based oils and recycled materials.
Key industries such as construction, automotive, and packaging are embracing these eco-friendly polyols to align with stricter regulatory frameworks and evolving consumer preferences. Governments across regions are introducing incentives and mandates to curb carbon footprints, which further propels the demand for bio-based alternatives. In the automotive industry, rising consumer preference for vehicles with reduced environmental impact is driving the adoption of bio-polyurethane foams, which are widely used in seating, interiors, and insulation. Similarly, the construction sector is leveraging green polyols for energy-efficient insulation materials, meeting the growing demand for green building certifications such as LEED.
Moreover, multinational corporations are increasingly integrating sustainability into their branding strategies, opting for eco-friendly raw materials to enhance their market reputation. This shift not only addresses corporate social responsibility (CSR) goals but also positions these companies as innovators in an eco-conscious marketplace. In addition to it, heightened consumer awareness, driven by education campaigns and media coverage, has transformed sustainability from a niche concern into a mainstream market driver. This rising consciousness is reshaping buying patterns across sectors, creating robust demand for sustainable solutions like green and bio polyols.
Report Scope and Market Segmentation
|
Attributes |
Green and Bio Polyols Market Key Market Insights |
|
Segments Covered |
|
|
Countries Covered |
U.S., Canada, Mexico, China, Japan, South Korea, India, Australia and New Zealand, Singapore, Malaysia, Thailand, Indonesia, Philippines, Rest of Asia-Pacific, Germany, France, Italy, Netherlands, U.K., Spain, Belgium, Russia, Switzerland, Turkey, Luxemburg, Rest of Europe, Brazil, Argentina, Rest of South America, Saudi Arabia, U.A.E., Egypt, South Africa, Israel, and Rest of Middle East and Africa |
|
Key Market Players |
Cargill, Incorporated (U.S.), BASF SE (Germany), Emery Oleochemicals (U.S.), Stepan Company (U.S.), Polylabs TM (Lativa), Wanhua (China), ALBERDINGK BOLEY GmbH (Germany), BioBased Technologies (U.S.), and Aurorium (U.S.) |
|
Market Opportunities |
|
|
Value Added Data Infosets |
In addition to the insights on market scenarios such as market value, growth rate, segmentation, geographical coverage, and major players, the market reports curated by the Data Bridge Market Research also include in-depth expert analysis, pricing analysis, brand share analysis, consumer survey, demography analysis, supply chain analysis, value chain analysis, raw material/consumables overview, vendor selection criteria, PESTLE Analysis, Porter Analysis, and regulatory framework. |
Green and Bio Polyols Market Definition
Green and bio polyols are environmentally friendly alternatives to conventional polyols used in the production of polyurethane foams, coatings, adhesives, and elastomers. These polyols are derived from renewable resources such as vegetable oils (e.g., soy, castor, or palm oil), natural sugars, or another biomass. They help reduce reliance on petroleum-based feedstock and contribute to lower greenhouse gas emissions during production. Green polyols emphasize sustainable production methods with minimal environmental impact, whereas bio polyols specifically highlight their biological or renewable origin. Both types retain comparable chemical and physical properties to traditional polyols, making them suitable for diverse industrial applications. Additionally, they support circular economy principles, with some being recyclable or biodegradable. The use of green and bio polyols aligns with growing global demands for sustainable materials in sectors like automotive, construction, and packaging, as industries transition toward eco-friendly manufacturing solutions.
Green and Bio Polyols Market Dynamics
Drivers
- Increasing Demand for Rigid and Flexible Polyurethane in Various Applications Like Sports and Athletic Footwear
The growing demand for rigid and flexible polyurethane in diverse applications, particularly in sports and athletic footwear, is a key driver accelerating the growth of the global green and bio polyols market. As industries increasingly prioritize sustainability, the adoption of bio-based polyols for polyurethane production is gaining momentum, especially in high-demand sectors such as footwear. In the sports and athletic footwear industry, polyurethane plays a crucial role due to its lightweight, durable, and versatile properties. Rigid polyurethanes are widely used for structural components, while flexible variants are integral in cushioning and midsole applications. With rising consumer preference for eco-friendly products, footwear manufacturers are shifting toward bio-based polyurethanes to meet market demands and align with sustainability goals. Leading sportswear brands like Adidas, Nike, and Puma are at the forefront of this transformation. For instance, Adidas’ Futurecraft. Footprint sneakers incorporate bio-based polyurethane derived from renewable materials, reflecting the brand's commitment to reducing its environmental impact. Similarly, Nike is integrating bio-polyols in its product lines to create performance footwear that balances sustainability and functionality. The market for bio-polyols is further propelled by increasing awareness among consumers regarding the environmental impact of conventional polyurethane. As customers demand greener alternatives, companies are leveraging bio-based polyols to differentiate their products and strengthen their market positioning. Additionally, the rise of athleisure as a lifestyle trend is expanding the application scope of polyurethane, driving higher production volumes of bio-based variants. The ability of green and bio polyols to reduce greenhouse gas emissions and reliance on fossil fuels aligns seamlessly with global environmental targets, attracting investments from industry players. For Instance, Allbirds utilizes bio-based polyurethane derived from sugarcane in its footwear. The company’s SweetFoam innovation has become a benchmark in the industry for sustainable midsole production, further driving demand for green polyols
Circular Economy Focuses on Maximizing Resource Efficiency by Minimizing Waste and Promoting the Reuse
The concept of a circular economy is rapidly gaining traction across industries, and its focus on maximizing resource efficiency by minimizing waste and promoting the reuse of materials is becoming a key driver of the global green and bio polyols market. This economic model encourages manufacturers to adopt sustainable practices, such as using renewable resources, reducing energy consumption, and recycling materials, which aligns seamlessly with the growing demand for environmentally friendly solutions in the production of polyurethane products. In a circular economy, the emphasis is on reducing the reliance on virgin, petroleum-based resources and instead utilizing bio-based alternatives, such as green and bio polyols. These renewable polyols are derived from plant-based feedstocks or waste materials, contributing to a reduction in greenhouse gas emissions and supporting sustainable production processes. This shift is particularly important in industries such as automotive, construction, and consumer goods, where the use of traditional, non-renewable materials is being increasingly scrutinized. Leading companies are embracing circular economy principles by incorporating bio-based polyols into their product offerings. For example, BASF’s PolyTHF products, used in various applications, are now produced with a focus on sustainability and renewable feedstocks, contributing to a circular economy. Likewise, Covestro’s commitment to circularity is evident in its development of polyurethanes based on recycled CO2 and bio-based polyols, reducing reliance on fossil fuels and promoting a more sustainable supply chain
Opportunities
- Increased Construction Activities, Particularly in Emerging Economies
Regulatory push for eco-friendly products is creating a significant opportunity for the global Green and Bio Polyols Market. As governments worldwide implement stricter environmental regulations and sustainability targets, there is a growing demand for products made from renewable and biodegradable materials. Bio-based polyols, which are used in the production of sustainable foams, coatings, and adhesives, align with these regulatory requirements, offering an alternative to petroleum-based products. This shift is further supported by green building certifications and energy-efficient standards, encouraging manufacturers to adopt eco-friendly materials in their products. Consequently, these regulatory trends drive the market for green and bio polyols, fostering innovation and expansion in various industries, including construction, automotive, and packaging. he regulatory push for eco-friendly products will create substantial opportunities for the global green and bio polyols market by encouraging the transition to more sustainable, renewable alternatives. As governments implement stricter environmental regulations and set ambitious sustainability goals, companies will be driven to adopt bio-based and circular solutions to meet these requirements. This regulatory shift will foster innovation, improve the availability of sustainable polyols, and align with the growing consumer preference for environmentally conscious products.
- Regulatory Push for Eco-Friendly Products
Regulatory push for eco-friendly products is creating a significant opportunity for the global Green and Bio Polyols Market. As governments worldwide implement stricter environmental regulations and sustainability targets, there is a growing demand for products made from renewable and biodegradable materials. Bio-based polyols, which are used in the production of sustainable foams, coatings, and adhesives, align with these regulatory requirements, offering an alternative to petroleum-based products. This shift is further supported by green building certifications and energy-efficient standards, encouraging manufacturers to adopt eco-friendly materials in their products. Consequently, these regulatory trends drive the market for green and bio polyols, fostering innovation and expansion in various industries, including construction, automotive, and packaging. In conclusion, the regulatory push for eco-friendly products will create substantial opportunities for the global green and bio polyols market by encouraging the transition to more sustainable, renewable alternatives. As governments implement stricter environmental regulations and set ambitious sustainability goals, companies will be driven to adopt bio-based and circular solutions to meet these requirements. This regulatory shift will foster innovation, improve the availability of sustainable polyols, and align with the growing consumer preference for environmentally conscious products.
Restraints/Challenges
- Stringent regulations regarding use of Green and Bio Polyols
The high production cost associated with bio-based polyols remains a critical restraint for their widespread adoption in the global market. Unlike conventional polyols, which benefit from mature, cost-efficient manufacturing processes and established supply chains, bio-based polyols rely on renewable raw materials such as plant oils, agricultural waste, or other biomass. These feedstocks often involve complex extraction, refining, and processing steps that significantly increase production costs. One of the primary drivers of these elevated costs is the dependency on advanced technologies and infrastructure to convert bio-based feedstocks into high-quality polyols. These technologies, including enzymatic processing or fermentation, require substantial capital investments and operational expenditures. Additionally, economies of scale are yet to be achieved in the bio-based polyol segment, further exacerbating the cost disparity with petroleum-based alternatives. The variability and limited availability of feedstocks also contribute to high costs. Factors such as fluctuating agricultural yields, seasonal constraints, and competition from other industries using the same biomass resources can drive up raw material prices. For instance, soybean or castor oil, commonly used in bio-polyol production, often face pricing pressures due to demand from the food and biofuel sectors. These cost factors make bio-based polyols less attractive for price-sensitive industries, such as packaging, automotive, and consumer goods. Companies may hesitate to transition from conventional polyols, particularly in markets where sustainability certifications do not provide significant competitive advantage or consumer willingness to pay a premium is limited.
- Stringent Regulation for Polyols (Polyurethane) Production
Stringent regulations for polyols (polyurethane) production present significant challenges for the Global Green and Bio Polyols Market by increasing compliance costs and operational complexities. Regulations such as the NESHAP in the U.S., REACH in Europe, and various national laws around the world require companies to invest in advanced technologies to reduce emissions, ensure chemical safety, and meet environmental standards. These regulations often demand extensive testing, documentation, and adjustments in manufacturing processes, which can slow production, increase operational costs, and create barriers to market entry, particularly for companies transitioning to sustainable and bio-based production methods. For instance
United States
National Emission Standards for Hazardous Air Pollutants (NESHAP) Rules for new and existing plant facilities to reduce hazardous air pollutant emissions by ~70%, leading to higher compliance costs and potential operational delays.
Europe
REACH (Registration, Evaluation, Authorization and Restriction of Chemicals) Comprehensive regulations requiring safety testing and documentation for chemicals, impacting the production process and increasing R&D costs for compliance.
India
Environmental Protection Act, 1986 Regulations to control pollution and ensure safe manufacturing practices, necessitating adherence to environmental safety protocols, which may increase production costs.
Impact and Current Market Scenario of Raw Material Shortage and Shipping Delays
Data Bridge Market Research offers a high-level analysis of the market and delivers information by keeping in account the impact and current market environment of raw material shortage and shipping delays. This translates into assessing strategic possibilities, creating effective action plans, and assisting businesses in making important decisions.
Apart from the standard report, we also offer in-depth analysis of the procurement level from forecasted shipping delays, distributor mapping by region, commodity analysis, production analysis, price mapping trends, sourcing, category performance analysis, supply chain risk management solutions, advanced benchmarking, and other services for procurement and strategic support.
Expected Impact of Economic Slowdown on the Pricing and Availability of Products
When economic activity slows, industries begin to suffer. The forecasted effects of the economic downturn on the pricing and accessibility of the products are taken into account in the market insight reports and intelligence services provided by DBMR. With this, our clients can typically keep one step ahead of their competitors, project their sales and revenue, and estimate their profit and loss expenditures.
Global Green and Bio Polyols Market Scope
The market is segmented on the basis of type and application. The growth amongst these segments will help you analyze meagre growth segments in the industries and provide the users with a valuable market overview and market insights to help them make strategic decisions for identifying core market applications.
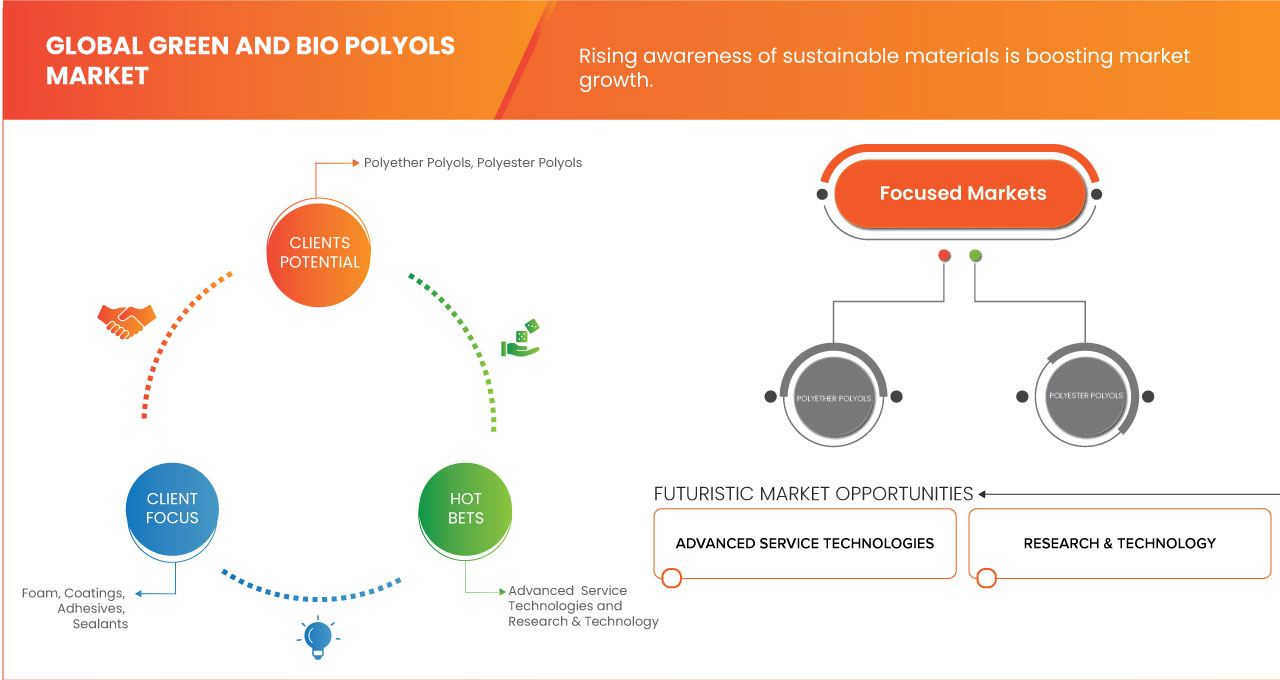
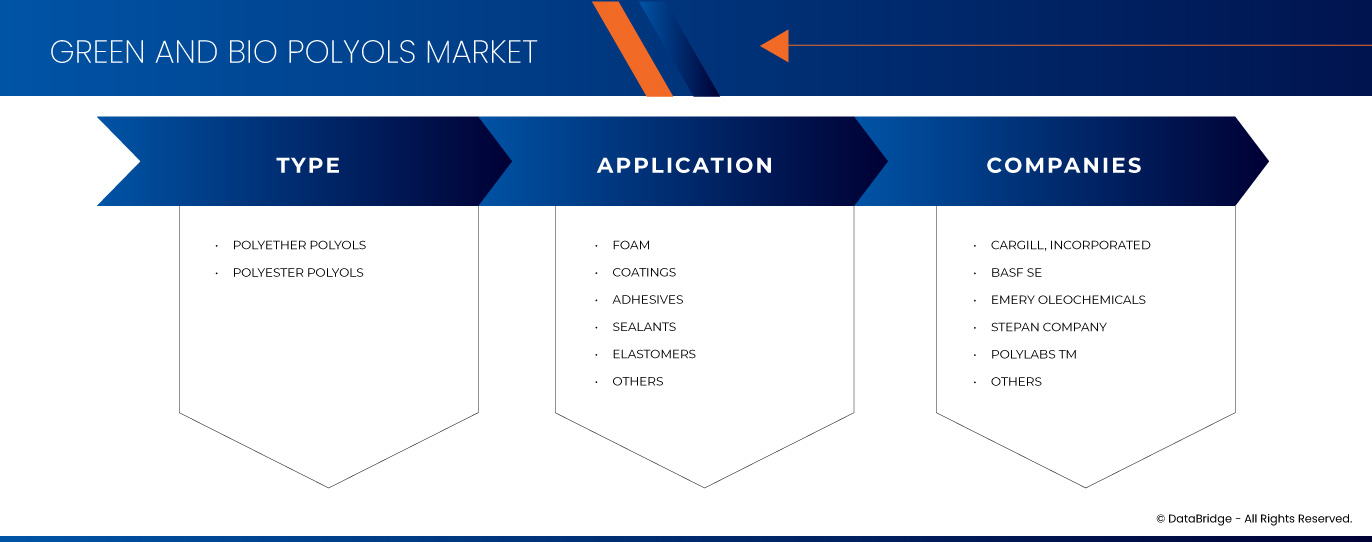
Type
- Polyether Polyols
- Polyester Polyols
Application
- Foam
- Coatings
- Adhesives
- Sealants
- Elastomers
- Others
Global Green and Bio Polyols Market Regional Analysis
The market is analyzed and market size insights and trends are provided by country, type, and application as referenced above.
The countries covered in the market are U.S., Canada, Mexico, China, Japan, South Korea, India, Australia and New Zealand, Singapore, Malaysia, Thailand, Indonesia, Philippines, Rest of Asia-Pacific, Germany, France, Italy, Netherlands, U.K., Spain, Belgium, Russia, Switzerland, Turkey, Luxemburg, Rest of Europe, Brazil, Argentina, Rest of South America, Saudi Arabia, U.A.E., Egypt, South Africa, Israel, Rest of Middle East and Africa.
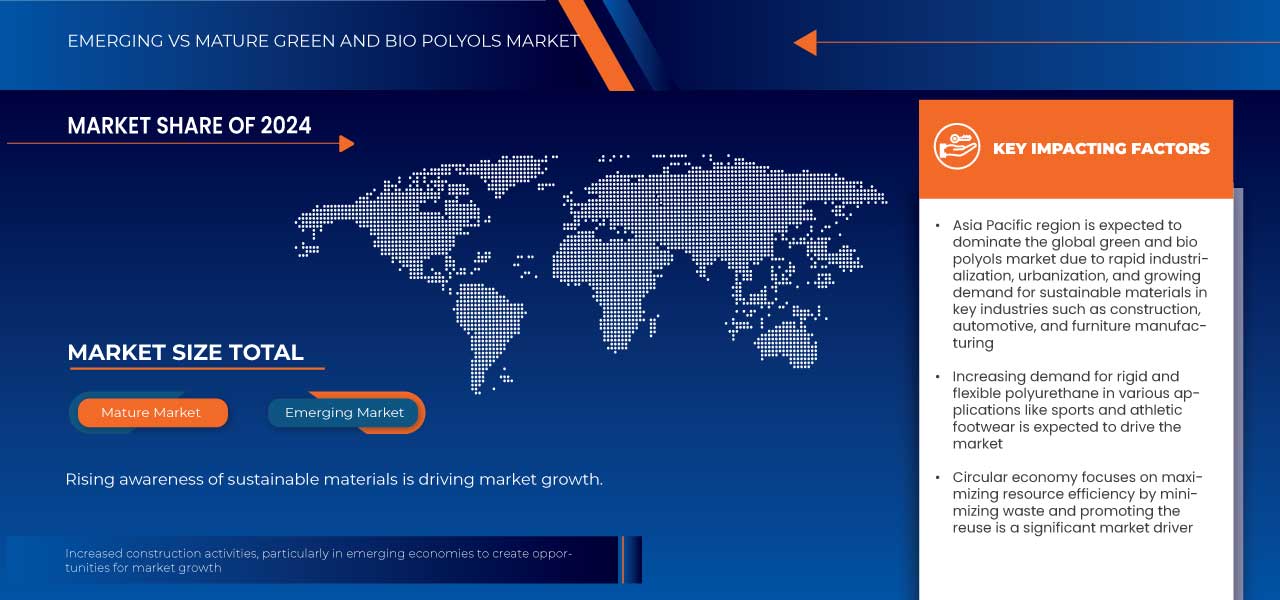
Asia Pacific region is expected to dominate the global green and bio polyols market due to rapid industrialization, urbanization, and growing demand for sustainable materials in key industries such as construction, automotive, and furniture manufacturing. The region's large population and expanding middle class drive significant demand for consumer goods, including mattresses, cushions, and insulation materials, which rely heavily on polyols.
Asia-Pacific is expected to be the fastest growing due to the region's rapidly increasing population. Consumer demand for sustainable and eco-friendly food production is also pushing the market.
The country section of the report also provides individual market impacting factors and changes in regulation in the market domestically that impacts the current and future trends of the market. Data points like down-stream and upstream value chain analysis, technical trends and porter's five forces analysis, case studies are some of the pointers used to forecast the market scenario for individual countries. Also, the presence and availability of global brands and their challenges faced due to large or scarce competition from local and domestic brands, impact of domestic tariffs and trade routes are considered while providing forecast analysis of the country data.
Global Green and Bio Polyols Market Share
The market competitive landscape provides details by competitors. Details included are company overview, company financials, revenue generated, market potential, investment in research and development, new market initiatives, global presence, production sites and facilities, production capacities, company strengths and weaknesses, product launch, product width and breadth, application dominance. The above data points provided are only related to the companies' focus related to market.
Green and Bio Polyols Market Leaders Operating in the Market Are:
- Cargill, Incorporated (U.S.)
- BASF SE (Germany)
- Emery Oleochemicals (U.S.)
- Stepan Company (U.S.)
- Polylabs TM (Lativa)
- Wanhua (China)
- ALBERDINGK BOLEY GmbH (Germany)
- BioBased Technologies (U.S.)
- Aurorium (U.S.)
Latest Developments in Green and Bio Polyols Market
- In November 2024, Krishna Enterprise and Alberdingk Boley announced their collaboration in water-based acrylic dispersions for the Indian market. Since 1985, Krishna Enterprise has provided innovative solutions in coatings, and Gaurang Goradia visited Alberdingk in October to sign the partnership agreement
- In October 2024, Cargill has been awarded the INDI 4.0 2024 Smart Factory award by Indonesia’s Ministry of Industry for successfully implementing Industry 4.0 technologies at its cocoa processing facility in Gresik. This recognition highlights Cargill’s commitment to advanced manufacturing practices, including automation, real-time data monitoring, and energy management, aimed at enhancing efficiency and sustainability
- In July 2023, Stepan received the World Finance Sustainability Award 2023, recognizing their commitment to sustainability and eco-friendly practices. The award highlights Stepan's efforts in creating innovative, environmentally responsible solutions across industries, reinforcing their leadership in sustainable business practices
- In June 2024, Aurorium, a specialty ingredients manufacturer, announced the launch of Haelium Pharmaceutical Solutions, reflecting its long-term commitment to healthcare. Built on decades of innovation, the Haelium product line established Aurorium as a global leader in pharmaceutical ingredients, embodying a unique approach to excellence
- In June 2024, BASF has expanded its portfolio by introducing biomass-balanced (BMB) ecoflex, a certified compostable biopolymer for the packaging industry. This ecoflexF Blend C1200 BMB uses renewable feedstock from organic waste, reducing fossil resource consumption and offering a 60% lower carbon footprint
SKU-

- Interactive Data Analysis Dashboard
- Company Analysis Dashboard for high growth potential opportunities
- Research Analyst Access for customization & queries
- Competitor Analysis with Interactive dashboard
- Latest News, Updates & Trend analysis
- Harness the Power of Benchmark Analysis for Comprehensive Competitor Tracking
Table of Content
1 INTRODUCTION
1.1 OBJECTIVES OF THE STUDY
1.2 MARKET DEFINITION
1.3 OVERVIEW
1.4 LIMITATIONS
1.5 MARKETS COVERED
2 MARKET SEGMENTATION
2.1 MARKETS COVERED
2.2 GEOGRAPHICAL SCOPE
2.3 YEARS CONSIDERED FOR THE STUDY
2.4 CURRENCY AND PRICING
2.5 DBMR TRIPOD DATA VALIDATION MODEL
2.6 MULTIVARIATE MODELING
2.7 PRIMARY INTERVIEWS WITH KEY OPINION LEADERS
2.8 DBMR MARKET POSITION GRID
2.9 DBMR VENDOR SHARE ANALYSIS
2.1 MARKET APPLICATION COVERAGE GRID
2.11 SECONDARY SOURCES
2.12 ASSUMPTIONS
3 EXECUTIVE SUMMARY
4 PREMIUM INSIGHTS
4.1 PESTEL ANALYSIS
4.1.1 POLITICAL FACTORS
4.1.2 ECONOMIC FACTORS
4.1.3 SOCIAL FACTORS
4.1.4 TECHNOLOGICAL FACTORS
4.1.5 ENVIRONMENTAL FACTORS
4.1.6 LEGAL FACTORS
4.1.7 CONCLUSION
4.2 PORTER’S FIVE FORCES
4.2.1 THREAT OF NEW ENTRANTS
4.2.2 THREAT OF SUBSTITUTES
4.2.3 BARGAINING POWER OF SUPPLIERS
4.2.4 BARGAINING POWER OF BUYERS
4.2.5 COMPETITIVE RIVALRY
4.3 IMPORT EXPORT SCENARIO
4.4 PRICE INDEX
4.5 PRODUCTION CONSUMPTION ANALYSIS
4.6 VENDOR SELECTION CRITERIA
4.6.1 QUALITY AND CONSISTENCY
4.6.2 TECHNICAL EXPERTISE
4.6.3 SUPPLY CHAIN RELIABILITY
4.6.4 COMPLIANCE AND SUSTAINABILITY
4.6.5 COST AND PRICING STRUCTURE
4.6.6 FINANCIAL STABILITY
4.6.7 FLEXIBILITY AND CUSTOMIZATION
4.6.8 RISK MANAGEMENT AND CONTINGENCY PLANS
4.7 CLIMATE CHANGE SCENARIO
4.7.1 ENVIRONMENTAL CONCERNS
4.7.2 INDUSTRY RESPONSE
4.7.3 GOVERNMENT'S ROLE
4.7.4 ANALYST RECOMMENDATIONS
4.8 PRODUCTION CAPACITY OVERVIEW
4.8.1 CURRENT PRODUCTION CAPACITY
4.8.2 REGIONAL DISTRIBUTION OF PRODUCTION CAPACITY
4.8.3 TECHNOLOGICAL ADVANCEMENTS AND INNOVATION
4.8.4 CAPACITY EXPANSION AND FUTURE PROJECTIONS
4.9 RAW MATERIAL COVERAGE
4.9.1 PLANT OILS
4.9.1.1 CASTOR OIL
4.9.1.2 SOYBEAN OIL
4.9.1.3 PALM OIL
4.9.2 AGRICULTURAL RESIDUES AND WASTE BIOMASS
4.9.2.1 CORN STOVER
4.9.2.2 WHEAT STRAW AND RICE HUSK
4.9.3 SUGAR-BASED FEEDSTOCKS
4.9.3.1 SUGAR ALCOHOLS
4.9.4 ALGAE AND OTHER NOVEL SOURCES
4.9.4.1 ALGAE
4.9.5 WASTE OILS AND BY-PRODUCTS
4.9.5.1 USED COOKING OILS
4.9.6 CONCLUSION
4.1 SUPPLY CHAIN ANALYSIS
4.10.1 OVERVIEW
4.10.2 LOGISTIC COST SCENARIO
4.10.2.1 TRANSPORTATION COSTS
4.10.2.2 STORAGE AND INVENTORY MANAGEMENT
4.10.2.3 GLOBAL SUPPLY CHAIN DISRUPTIONS
4.10.3 IMPORTANCE OF LOGISTIC SERVICE PROVIDERS
4.10.3.1 RAW MATERIAL SOURCING AND TRANSPORTATION
4.10.3.2 SUSTAINABILITY IN LOGISTICS
4.10.3.3 GLOBAL DISTRIBUTION AND SUPPLY CHAIN COORDINATION
4.10.3.4 TECHNOLOGICAL INTEGRATION
4.10.4 CONCLUSION
4.11 TECHNOLOGY ADVANCEMENTS BY MANUFACTURERS
4.11.1 FEEDSTOCK INNOVATION AND RAW MATERIAL OPTIMIZATION
4.11.1.1 ADVANCED CATALYSIS AND GREEN CHEMISTRY
4.11.1.2 FEEDSTOCK DIVERSIFICATION
4.11.2 ADVANCED PRODUCTION TECHNIQUES
4.11.2.1 BIOCATALYSIS AND ENZYMATIC PROCESSES
4.11.2.2 GREEN SOLVENTS AND SOLVENT-FREE PROCESSES
4.11.2.3 CONTINUOUS AND FLOW CHEMISTRY
4.11.3 PROCESS INTEGRATION AND ENERGY EFFICIENCY
4.11.3.1 HEAT INTEGRATION AND ENERGY RECOVERY
4.11.3.2 PROCESS INTENSIFICATION
4.11.4 PERFORMANCE AND PRODUCT INNOVATION
4.11.4.1 TAILORED BIO POLYOLS FOR SPECIFIC APPLICATIONS
4.11.4.2 ENHANCED DURABILITY AND STABILITY
4.11.5 CIRCULAR ECONOMY AND WASTE REDUCTION
4.11.5.1 RECYCLING OF BIO-BASED POLYOLS
4.11.5.2 ZERO-WASTE MANUFACTURING
4.11.6 CONCLUSION
5 REGULATION COVERAGE
5.1 ENVIRONMENTAL REGULATIONS AND STANDARDS
5.1.1 CARBON FOOTPRINT AND GREENHOUSE GAS EMISSIONS
5.1.2 SUSTAINABILITY AND BIODEGRADABILITY
5.1.3 REACH AND CHEMICAL SAFETY REGULATIONS
5.2 FEEDSTOCK SOURCING AND AGRICULTURAL REGULATIONS
5.2.1 SUSTAINABLE SOURCING OF RAW MATERIALS
5.2.2 AGRI-ENVIRONMENTAL REGULATIONS
5.2.3 TRACEABILITY AND CERTIFICATION
5.3 PRODUCT SAFETY AND REGULATORY COMPLIANCE
5.3.1 SAFETY AND TOXICITY REGULATIONS
5.3.2 FLAMMABILITY STANDARDS
5.4 CIRCULAR ECONOMY AND WASTE MANAGEMENT REGULATIONS
5.4.1 EXTENDED PRODUCER RESPONSIBILITY (EPR)
5.4.2 PLASTIC WASTE AND PACKAGING REGULATIONS
5.5 REGIONAL REGULATIONS AND STANDARDS
5.6 CONCLUSION
6 MARKET OVERVIEW
6.1 DRIVERS
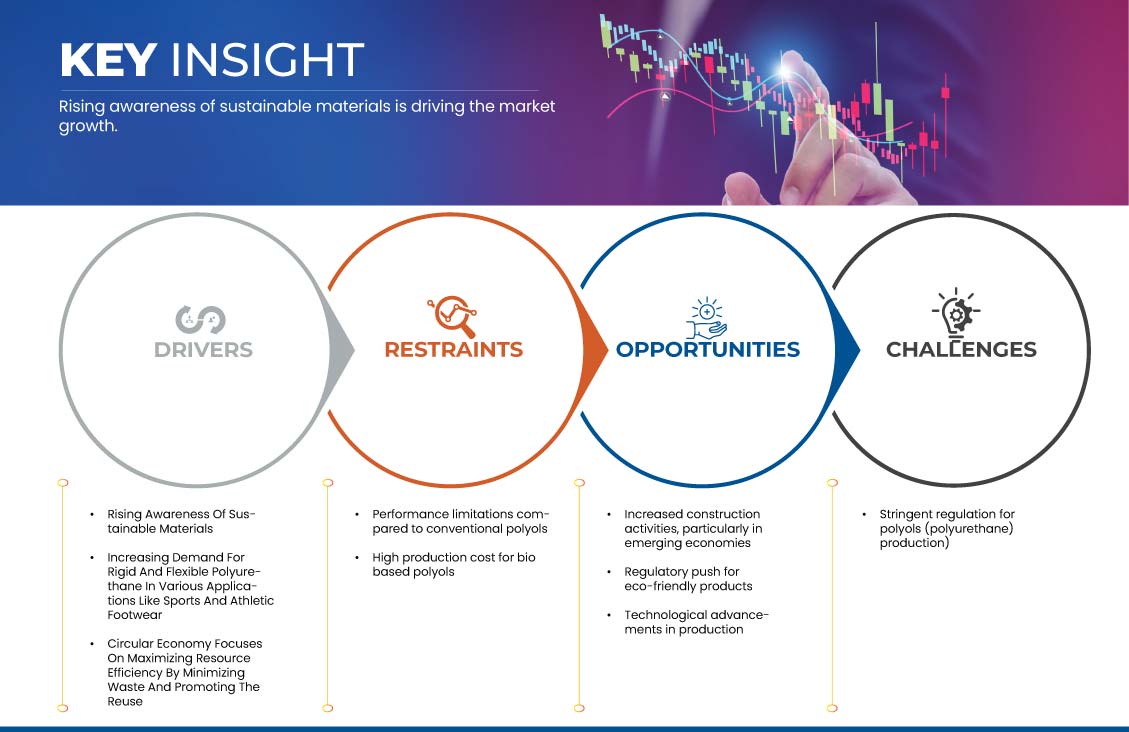
6.1.1 RISING AWARENESS OF SUSTAINABLE MATERIALS
6.1.2 INCREASING DEMAND FOR RIGID AND FLEXIBLE POLYURETHANE IN VARIOUS APPLICATIONS LIKE SPORTS AND ATHLETIC FOOTWEAR
6.1.3 CIRCULAR ECONOMY FOCUSES ON MAXIMIZING RESOURCE EFFICIENCY BY MINIMIZING WASTE AND PROMOTING THE REUSE
6.2 RESTRAINTS
6.2.1 PERFORMANCE LIMITATIONS COMPARED TO CONVENTIONAL POLYOLS
6.2.2 HIGH PRODUCTION COST FOR BIO BASED POLYOLS
6.3 OPPORTUNITIES
6.3.1 INCREASED CONSTRUCTION ACTIVITIES, PARTICULARLY IN EMERGING ECONOMIES
6.3.2 REGULATORY PUSH FOR ECO-FRIENDLY PRODUCTS
6.3.3 TECHNOLOGICAL ADVANCEMENTS IN PRODUCTION
6.4 CHALLENGE
6.4.1 STRINGENT REGULATION FOR POLYOLS (POLYURETHANE) PRODUCTION
7 GLOBAL GREEN AND BIO POLYOLS MARKET, BY TYPE
7.1 OVERVIEW
7.2 POLYETHER POLYOLS
7.3 POLYESTER POLYOLS
8 GLOBAL GREEN AND BIO POLYOLS MARKET, BY APPLICATION
8.1 OVERVIEW
8.2 FOAM
8.3 COATINGS
8.4 ADHESIVES
8.5 SEALANTS
8.6 ELASTOMERS
8.7 OTHERS
9 GLOBAL GREEN AND BIO POLYOLS MARKET, BY REGION
9.1 OVERVIEW
9.2 ASIA-PACIFIC
9.2.1 CHINA
9.2.2 JAPAN
9.2.3 SOUTH KOREA
9.2.4 INDIA
9.2.5 AUSTRALIA AND NEW ZEALAND
9.2.6 SINGAPORE
9.2.7 MALAYSIA
9.2.8 THAILAND
9.2.9 INDONESIA
9.2.10 PHILIPPINES
9.2.11 REST OF ASIA-PACIFIC
9.3 NORTH AMERICA
9.3.1 U.S.
9.3.2 CANADA
9.3.3 MEXICO
9.4 EUROPE
9.4.1 GERMANY
9.4.2 FRANCE
9.4.3 ITALY
9.4.4 NETHERLANDS
9.4.5 U.K.
9.4.6 SPAIN
9.4.7 BELGIUM
9.4.8 RUSSIA
9.4.9 SWITZERLAND
9.4.10 TURKEY
9.4.11 LUXEMBURG
9.4.12 REST OF EUROPE
9.5 MIDDLE EAST AND AFRICA
9.5.1 SAUDI ARABIA
9.5.2 U.A.E.
9.5.3 EGYPT
9.5.4 SOUTH AFRICA
9.5.5 ISRAEL
9.5.6 REST OF MIDDLE EAST AND AFRICA
9.6 SOUTH AMERICA
9.6.1 BRAZIL
9.6.2 ARGENTINA
9.6.3 REST OF SOUTH AMERICA
10 GLOBAL GREEN AND BIO POLYOLS MARKET: COMPANY LANDSCAPE
10.1 COMPANY SHARE ANALYSIS: GLOBAL
10.2 COMPANY SHARE ANALYSIS: ASIA-PACIFIC
10.3 COMPANY SHARE ANALYSIS: EUROPE
10.4 COMPANY SHARE ANALYSIS: NORTH AMERICA
11 SWOT ANALYSIS
12 COMPANY PROFILES
12.1 CARGILL, INCORPORATED
12.1.1 COMPANY SNAPSHOT
12.1.2 COMPANY SHARE ANALYSIS
12.1.3 PRODUCT PORTFOLIO
12.1.4 RECENT DEVELOPMENT
12.2 BASF
12.2.1 COMPANY SNAPSHOT
12.2.2 REVENUE ANALYSIS
12.2.3 COMPANY SHARE ANALYSIS
12.2.4 PRODUCT PORTFOLIO
12.2.5 RECENT DEVELOPMENT
12.3 EMERY OLEOCHEMICALS
12.3.1 COMPANY SNAPSHOT
12.3.2 COMPANY SHARE ANALYSIS
12.3.3 PRODUCT PORTFOLIO
12.3.4 RECENT DEVELOPMENT
12.4 STEPAN COMPANY
12.4.1 COMPANY SNAPSHOT
12.4.2 REVENUR ANALYSIS
12.4.3 COMPANY SHARE ANALYSIS
12.4.4 PRODUCT PORTFOLIO
12.4.5 RECENT DEVELOPMENT
12.5 POLYLABS TM.
12.5.1 COMPANY SNAPSHOT
12.5.2 COMPANY SHARE ANALYSIS
12.5.3 PRODUCT PORTFOLIO
12.5.4 RECENT DEVELOPMENT
12.6 ALBERDINGK BOLEY GMBH
12.6.1 COMPANY SNAPSHOT
12.6.2 PRODUCT PORTFOLIO
12.6.3 RECENT DEVELOPMENT
12.7 AURORIUM
12.7.1 COMPANY SNAPSHOT
12.7.2 PRODUCT PORTFOLIO
12.7.3 RECENT DEVELOPMENT
12.8 BIOBASED TECHNOLOGIES
12.8.1 COMPANY SNAPSHOT
12.8.2 PRODUCT PORTFOLIO
12.8.3 RECENT DEVELOPMENT
12.9 WANHUA
12.9.1 COMPANY SNAPSHOT
12.9.2 REVENUE ANALYSIS
12.9.3 PRODUCT PORTFOLIO
12.9.4 RECENT DEVELOPMENT
13 QUESTIONNAIRE
14 RELATED REPORTS
List of Table
TABLE 1 COUNTRY WISE REGULATION FOR PRODUCTION OF POLYOLS (POLYURETHANE)
TABLE 2 GLOBAL GREEN AND BIO POLYOLS MARKET, BY TYPE, 2018-2032 (USD THOUSAND)
TABLE 3 GLOBAL GREEN AND BIO POLYOLS MARKET, BY TYPE, 2018-2032 (KILO TONS)
TABLE 4 GLOBAL POLYETHER POLYOLS IN GREEN AND BIO POLYOLS MARKET, BY SEGMENT, 2018-2032 (USD THOUSAND)
TABLE 5 GLOBAL POLYETHER POLYOLS IN GREEN AND BIO POLYOLS MARKET, BY CATEGORY, 2018-2032 (USD THOUSAND)
TABLE 6 GLOBAL POLYESTER POLYOLS IN GREEN AND BIO POLYOLS MARKET, BY SEGMENT, 2018-2032 (USD THOUSAND)
TABLE 7 GLOBAL POLYESTER POLYOLS IN GREEN AND BIO POLYOLS MARKET, BY CATEGORY, 2018-2032 (USD THOUSAND)
TABLE 8 GLOBAL GREEN AND BIO POLYOLS MARKET, BY APPLICATION, 2018-2032 (USD THOUSAND)
TABLE 9 GLOBAL FOAM IN GREEN AND BIO POLYOLS MARKET, BY SEGMENT, 2018-2032 (USD THOUSAND)
TABLE 10 GLOBAL GREEN AND BIO POLYOLS, BY REGION, 2018-2032 (USD THOUSAND)
TABLE 11 GLOBAL GREEN AND BIO POLYOLS MARKET, BY REGION, 2018-2032 (KILO TONS)
TABLE 12 ASIA-PACIFIC GREEN AND BIO POLYOLS MARKET, BY COUNTRY, 2018-2032 (USD THOUSAND)
TABLE 13 ASIA-PACIFIC GREEN AND BIO POLYOLS MARKET, BY COUNTRY, 2018-2032 (KILO TONS)
TABLE 14 ASIA-PACIFIC GREEN AND BIO POLYOLS MARKET, BY TYPE, 2018-2032 (USD THOUSAND)
TABLE 15 ASIA-PACIFIC GREEN AND BIO POLYOLS MARKET, BY TYPE, 2018-2032 (KILO TONS)
TABLE 16 ASIA-PACIFIC POLYETHER POLYOLS IN GREEN AND BIO POLYOLS MARKET, BY SEGMENT, 2018-2032 (USD THOUSAND)
TABLE 17 ASIA-PACIFIC POLYETHER POLYOLS IN GREEN AND BIO POLYOLS MARKET, BY CATEGORY, 2018-2032 (USD THOUSAND)
TABLE 18 ASIA-PACIFIC POLYESTER POLYOLS IN GREEN AND BIO POLYOLS MARKET, BY SEGMENT, 2018-2032 (USD THOUSAND)
TABLE 19 ASIA-PACIFIC POLYESTER POLYOLS IN GREEN AND BIO POLYOLS MARKET, BY CATEGORY, 2018-2032 (USD THOUSAND)
TABLE 20 ASIA-PACIFIC GREEN AND BIO POLYOLS MARKET, BY APPLICATION, 2018-2032 (USD THOUSAND)
TABLE 21 ASIA-PACIFIC FOAM IN POLYESTER POLYOLS IN GREEN AND BIO POLYOLS MARKET, BY SEGMENT, 2018-2032 (USD THOUSAND)
TABLE 22 CHINA GREEN AND BIO POLYOLS MARKET, BY TYPE, 2018-2032 (USD THOUSAND)
TABLE 23 CHINA GREEN AND BIO POLYOLS MARKET, BY TYPE, 2018-2032 (KILO TONS)
TABLE 24 CHINA POLYETHER POLYOLS IN GREEN AND BIO POLYOLS MARKET, BY SEGMENT, 2018-2032 (USD THOUSAND)
TABLE 25 CHINA POLYETHER POLYOLS IN GREEN AND BIO POLYOLS MARKET, BY CATEGORY, 2018-2032 (USD THOUSAND)
TABLE 26 CHINA POLYESTER POLYOLS IN GREEN AND BIO POLYOLS MARKET, BY SEGMENT, 2018-2032 (USD THOUSAND)
TABLE 27 CHINA POLYESTER POLYOLS IN GREEN AND BIO POLYOLS MARKET, BY CATEGORY, 2018-2032 (USD THOUSAND)
TABLE 28 CHINA GREEN AND BIO POLYOLS MARKET, BY APPLICATION, 2018-2032 (USD THOUSAND)
TABLE 29 CHINA FOAM IN POLYESTER POLYOLS IN GREEN AND BIO POLYOLS MARKET, BY SEGMENT, 2018-2032 (USD THOUSAND)
TABLE 30 JAPAN GREEN AND BIO POLYOLS MARKET, BY TYPE, 2018-2032 (USD THOUSAND)
TABLE 31 JAPAN GREEN AND BIO POLYOLS MARKET, BY TYPE, 2018-2032 (KILO TONS)
TABLE 32 JAPAN POLYETHER POLYOLS IN GREEN AND BIO POLYOLS MARKET, BY SEGMENT, 2018-2032 (USD THOUSAND)
TABLE 33 JAPAN POLYETHER POLYOLS IN GREEN AND BIO POLYOLS MARKET, BY CATEGORY, 2018-2032 (USD THOUSAND)
TABLE 34 JAPAN POLYESTER POLYOLS IN GREEN AND BIO POLYOLS MARKET, BY SEGMENT, 2018-2032 (USD THOUSAND)
TABLE 35 JAPAN POLYESTER POLYOLS IN GREEN AND BIO POLYOLS MARKET, BY CATEGORY, 2018-2032 (USD THOUSAND)
TABLE 36 JAPAN GREEN AND BIO POLYOLS MARKET, BY APPLICATION, 2018-2032 (USD THOUSAND)
TABLE 37 JAPAN FOAM IN POLYESTER POLYOLS IN GREEN AND BIO POLYOLS MARKET, BY SEGMENT, 2018-2032 (USD THOUSAND)
TABLE 38 SOUTH KOREA GREEN AND BIO POLYOLS MARKET, BY TYPE, 2018-2032 (USD THOUSAND)
TABLE 39 SOUTH KOREA GREEN AND BIO POLYOLS MARKET, BY TYPE, 2018-2032 (KILO TONS)
TABLE 40 SOUTH KOREA POLYETHER POLYOLS IN GREEN AND BIO POLYOLS MARKET, BY SEGMENT, 2018-2032 (USD THOUSAND)
TABLE 41 SOUTH KOREA POLYETHER POLYOLS IN GREEN AND BIO POLYOLS MARKET, BY CATEGORY, 2018-2032 (USD THOUSAND)
TABLE 42 SOUTH KOREA POLYESTER POLYOLS IN GREEN AND BIO POLYOLS MARKET, BY SEGMENT, 2018-2032 (USD THOUSAND)
TABLE 43 SOUTH KOREA POLYESTER POLYOLS IN GREEN AND BIO POLYOLS MARKET, BY CATEGORY, 2018-2032 (USD THOUSAND)
TABLE 44 SOUTH KOREA GREEN AND BIO POLYOLS MARKET, BY APPLICATION, 2018-2032 (USD THOUSAND)
TABLE 45 SOUTH KOREA FOAM IN POLYESTER POLYOLS IN GREEN AND BIO POLYOLS MARKET, BY SEGMENT, 2018-2032 (USD THOUSAND)
TABLE 46 INDIA GREEN AND BIO POLYOLS MARKET, BY TYPE, 2018-2032 (USD THOUSAND)
TABLE 47 INDIA GREEN AND BIO POLYOLS MARKET, BY TYPE, 2018-2032 (KILO TONS)
TABLE 48 INDIA POLYETHER POLYOLS IN GREEN AND BIO POLYOLS MARKET, BY SEGMENT, 2018-2032 (USD THOUSAND)
TABLE 49 INDIA POLYETHER POLYOLS IN GREEN AND BIO POLYOLS MARKET, BY CATEGORY, 2018-2032 (USD THOUSAND)
TABLE 50 INDIA POLYESTER POLYOLS IN GREEN AND BIO POLYOLS MARKET, BY SEGMENT, 2018-2032 (USD THOUSAND)
TABLE 51 INDIA POLYESTER POLYOLS IN GREEN AND BIO POLYOLS MARKET, BY CATEGORY, 2018-2032 (USD THOUSAND)
TABLE 52 INDIA GREEN AND BIO POLYOLS MARKET, BY APPLICATION, 2018-2032 (USD THOUSAND)
TABLE 53 INDIA FOAM IN POLYESTER POLYOLS IN GREEN AND BIO POLYOLS MARKET, BY SEGMENT, 2018-2032 (USD THOUSAND)
TABLE 54 AUSTRALIA AND NEW ZEALAND GREEN AND BIO POLYOLS MARKET, BY TYPE, 2018-2032 (USD THOUSAND)
TABLE 55 AUSTRALIA AND NEW ZEALAND GREEN AND BIO POLYOLS MARKET, BY TYPE, 2018-2032 (KILO TONS)
TABLE 56 AUSTRALIA AND NEW ZEALAND POLYETHER POLYOLS IN GREEN AND BIO POLYOLS MARKET, BY SEGMENT, 2018-2032 (USD THOUSAND)
TABLE 57 AUSTRALIA AND NEW ZEALAND POLYETHER POLYOLS IN GREEN AND BIO POLYOLS MARKET, BY CATEGORY, 2018-2032 (USD THOUSAND)
TABLE 58 AUSTRALIA AND NEW ZEALAND POLYESTER POLYOLS IN GREEN AND BIO POLYOLS MARKET, BY SEGMENT, 2018-2032 (USD THOUSAND)
TABLE 59 AUSTRALIA AND NEW ZEALAND POLYESTER POLYOLS IN GREEN AND BIO POLYOLS MARKET, BY CATEGORY, 2018-2032 (USD THOUSAND)
TABLE 60 AUSTRALIA AND NEW ZEALAND GREEN AND BIO POLYOLS MARKET, BY APPLICATION, 2018-2032 (USD THOUSAND)
TABLE 61 AUSTRALIA AND NEW ZEALAND FOAM IN POLYESTER POLYOLS IN GREEN AND BIO POLYOLS MARKET, BY SEGMENT, 2018-2032 (USD THOUSAND)
TABLE 62 SINGAPORE GREEN AND BIO POLYOLS MARKET, BY TYPE, 2018-2032 (USD THOUSAND)
TABLE 63 SINGAPORE GREEN AND BIO POLYOLS MARKET, BY TYPE, 2018-2032 (KILO TONS)
TABLE 64 SINGAPORE POLYETHER POLYOLS IN GREEN AND BIO POLYOLS MARKET, BY SEGMENT, 2018-2032 (USD THOUSAND)
TABLE 65 SINGAPORE POLYETHER POLYOLS IN GREEN AND BIO POLYOLS MARKET, BY CATEGORY, 2018-2032 (USD THOUSAND)
TABLE 66 SINGAPORE POLYESTER POLYOLS IN GREEN AND BIO POLYOLS MARKET, BY SEGMENT, 2018-2032 (USD THOUSAND)
TABLE 67 SINGAPORE POLYESTER POLYOLS IN GREEN AND BIO POLYOLS MARKET, BY CATEGORY, 2018-2032 (USD THOUSAND)
TABLE 68 SINGAPORE GREEN AND BIO POLYOLS MARKET, BY APPLICATION, 2018-2032 (USD THOUSAND)
TABLE 69 SINGAPORE FOAM IN POLYESTER POLYOLS IN GREEN AND BIO POLYOLS MARKET, BY SEGMENT, 2018-2032 (USD THOUSAND)
TABLE 70 MALAYSIA GREEN AND BIO POLYOLS MARKET, BY TYPE, 2018-2032 (USD THOUSAND)
TABLE 71 MALAYSIA GREEN AND BIO POLYOLS MARKET, BY TYPE, 2018-2032 (KILO TONS)
TABLE 72 MALAYSIA POLYETHER POLYOLS IN GREEN AND BIO POLYOLS MARKET, BY SEGMENT, 2018-2032 (USD THOUSAND)
TABLE 73 MALAYSIA POLYETHER POLYOLS IN GREEN AND BIO POLYOLS MARKET, BY CATEGORY, 2018-2032 (USD THOUSAND)
TABLE 74 MALAYSIA POLYESTER POLYOLS IN GREEN AND BIO POLYOLS MARKET, BY SEGMENT, 2018-2032 (USD THOUSAND)
TABLE 75 MALAYSIA POLYESTER POLYOLS IN GREEN AND BIO POLYOLS MARKET, BY CATEGORY, 2018-2032 (USD THOUSAND)
TABLE 76 MALAYSIA GREEN AND BIO POLYOLS MARKET, BY APPLICATION, 2018-2032 (USD THOUSAND)
TABLE 77 MALAYSIA FOAM IN POLYESTER POLYOLS IN GREEN AND BIO POLYOLS MARKET, BY SEGMENT, 2018-2032 (USD THOUSAND)
TABLE 78 THAILAND GREEN AND BIO POLYOLS MARKET, BY TYPE, 2018-2032 (USD THOUSAND)
TABLE 79 THAILAND GREEN AND BIO POLYOLS MARKET, BY TYPE, 2018-2032 (KILO TONS)
TABLE 80 THAILAND POLYETHER POLYOLS IN GREEN AND BIO POLYOLS MARKET, BY SEGMENT, 2018-2032 (USD THOUSAND)
TABLE 81 THAILAND POLYETHER POLYOLS IN GREEN AND BIO POLYOLS MARKET, BY CATEGORY, 2018-2032 (USD THOUSAND)
TABLE 82 THAILAND POLYESTER POLYOLS IN GREEN AND BIO POLYOLS MARKET, BY SEGMENT, 2018-2032 (USD THOUSAND)
TABLE 83 THAILAND POLYESTER POLYOLS IN GREEN AND BIO POLYOLS MARKET, BY CATEGORY, 2018-2032 (USD THOUSAND)
TABLE 84 THAILAND GREEN AND BIO POLYOLS MARKET, BY APPLICATION, 2018-2032 (USD THOUSAND)
TABLE 85 THAILAND FOAM IN POLYESTER POLYOLS IN GREEN AND BIO POLYOLS MARKET, BY SEGMENT, 2018-2032 (USD THOUSAND)
TABLE 86 INDONESIA GREEN AND BIO POLYOLS MARKET, BY TYPE, 2018-2032 (USD THOUSAND)
TABLE 87 INDONESIA GREEN AND BIO POLYOLS MARKET, BY TYPE, 2018-2032 (KILO TONS)
TABLE 88 INDONESIA POLYETHER POLYOLS IN GREEN AND BIO POLYOLS MARKET, BY SEGMENT, 2018-2032 (USD THOUSAND)
TABLE 89 INDONESIA POLYETHER POLYOLS IN GREEN AND BIO POLYOLS MARKET, BY CATEGORY, 2018-2032 (USD THOUSAND)
TABLE 90 INDONESIA POLYESTER POLYOLS IN GREEN AND BIO POLYOLS MARKET, BY SEGMENT, 2018-2032 (USD THOUSAND)
TABLE 91 INDONESIA POLYESTER POLYOLS IN GREEN AND BIO POLYOLS MARKET, BY CATEGORY, 2018-2032 (USD THOUSAND)
TABLE 92 INDONESIA GREEN AND BIO POLYOLS MARKET, BY APPLICATION, 2018-2032 (USD THOUSAND)
TABLE 93 INDONESIA FOAM IN POLYESTER POLYOLS IN GREEN AND BIO POLYOLS MARKET, BY SEGMENT, 2018-2032 (USD THOUSAND)
TABLE 94 PHILIPPINES GREEN AND BIO POLYOLS MARKET, BY TYPE, 2018-2032 (USD THOUSAND)
TABLE 95 PHILIPPINES GREEN AND BIO POLYOLS MARKET, BY TYPE, 2018-2032 (KILO TONS)
TABLE 96 PHILIPPINES POLYETHER POLYOLS IN GREEN AND BIO POLYOLS MARKET, BY SEGMENT, 2018-2032 (USD THOUSAND)
TABLE 97 PHILIPPINES POLYETHER POLYOLS IN GREEN AND BIO POLYOLS MARKET, BY CATEGORY, 2018-2032 (USD THOUSAND)
TABLE 98 PHILIPPINES POLYESTER POLYOLS IN GREEN AND BIO POLYOLS MARKET, BY SEGMENT, 2018-2032 (USD THOUSAND)
TABLE 99 PHILIPPINES POLYESTER POLYOLS IN GREEN AND BIO POLYOLS MARKET, BY CATEGORY, 2018-2032 (USD THOUSAND)
TABLE 100 PHILIPPINES GREEN AND BIO POLYOLS MARKET, BY APPLICATION, 2018-2032 (USD THOUSAND)
TABLE 101 PHILIPPINES FOAM IN POLYESTER POLYOLS IN GREEN AND BIO POLYOLS MARKET, BY SEGMENT, 2018-2032 (USD THOUSAND)
TABLE 102 REST OF ASIA-PACIFIC GREEN AND BIO POLYOLS MARKET, BY TYPE, 2018-2032 (USD THOUSAND)
TABLE 103 REST OF ASIA-PACIFIC GREEN AND BIO POLYOLS MARKET, BY TYPE, 2018-2032 (KILO TONS)
TABLE 104 NORTH AMERICA GREEN AND BIO POLYOLS MARKET, BY COUNTRY, 2018-2032 (USD THOUSAND)
TABLE 105 NORTH AMERICA GREEN AND BIO POLYOLS MARKET, BY COUNTRY, 2018-2032 (KILO TONS)
TABLE 106 NORTH AMERICA GREEN AND BIO POLYOLS MARKET, BY TYPE, 2018-2032 (USD THOUSAND)
TABLE 107 NORTH AMERICA GREEN AND BIO POLYOLS MARKET, BY TYPE, 2018-2032 (KILO TONS)
TABLE 108 NORTH AMERICA POLYETHER POLYOLS IN GREEN AND BIO POLYOLS MARKET, BY SEGMENT, 2018-2032 (USD THOUSAND)
TABLE 109 NORTH AMERICA POLYETHER POLYOLS IN GREEN AND BIO POLYOLS MARKET, BY CATEGORY, 2018-2032 (USD THOUSAND)
TABLE 110 NORTH AMERICA POLYESTER POLYOLS IN GREEN AND BIO POLYOLS MARKET, BY SEGMENT, 2018-2032 (USD THOUSAND)
TABLE 111 NORTH AMERICA POLYESTER POLYOLS IN GREEN AND BIO POLYOLS MARKET, BY CATEGORY, 2018-2032 (USD THOUSAND)
TABLE 112 NORTH AMERICA GREEN AND BIO POLYOLS MARKET, BY APPLICATION, 2018-2032 (USD THOUSAND)
TABLE 113 NORTH AMERICA FOAM IN POLYESTER POLYOLS IN GREEN AND BIO POLYOLS MARKET, BY SEGMENT, 2018-2032 (USD THOUSAND)
TABLE 114 U.S. GREEN AND BIO POLYOLS MARKET, BY TYPE, 2018-2032 (USD THOUSAND)
TABLE 115 U.S. GREEN AND BIO POLYOLS MARKET, BY TYPE, 2018-2032 (KILO TONS)
TABLE 116 U.S. POLYETHER POLYOLS IN GREEN AND BIO POLYOLS MARKET, BY SEGMENT, 2018-2032 (USD THOUSAND)
TABLE 117 U.S. POLYETHER POLYOLS IN GREEN AND BIO POLYOLS MARKET, BY CATEGORY, 2018-2032 (USD THOUSAND)
TABLE 118 U.S. POLYESTER POLYOLS IN GREEN AND BIO POLYOLS MARKET, BY SEGMENT, 2018-2032 (USD THOUSAND)
TABLE 119 U.S. POLYESTER POLYOLS IN GREEN AND BIO POLYOLS MARKET, BY CATEGORY, 2018-2032 (USD THOUSAND)
TABLE 120 U.S. GREEN AND BIO POLYOLS MARKET, BY APPLICATION, 2018-2032 (USD THOUSAND)
TABLE 121 U.S. FOAM IN POLYESTER POLYOLS IN GREEN AND BIO POLYOLS MARKET, BY SEGMENT, 2018-2032 (USD THOUSAND)
TABLE 122 CANADA GREEN AND BIO POLYOLS MARKET, BY TYPE, 2018-2032 (USD THOUSAND)
TABLE 123 CANADA GREEN AND BIO POLYOLS MARKET, BY TYPE, 2018-2032 (KILO TONS)
TABLE 124 CANADA POLYETHER POLYOLS IN GREEN AND BIO POLYOLS MARKET, BY SEGMENT, 2018-2032 (USD THOUSAND)
TABLE 125 CANADA POLYETHER POLYOLS IN GREEN AND BIO POLYOLS MARKET, BY CATEGORY, 2018-2032 (USD THOUSAND)
TABLE 126 CANADA POLYESTER POLYOLS IN GREEN AND BIO POLYOLS MARKET, BY SEGMENT, 2018-2032 (USD THOUSAND)
TABLE 127 CANADA POLYESTER POLYOLS IN GREEN AND BIO POLYOLS MARKET, BY CATEGORY, 2018-2032 (USD THOUSAND)
TABLE 128 CANADA GREEN AND BIO POLYOLS MARKET, BY APPLICATION, 2018-2032 (USD THOUSAND)
TABLE 129 CANADA FOAM IN POLYESTER POLYOLS IN GREEN AND BIO POLYOLS MARKET, BY SEGMENT, 2018-2032 (USD THOUSAND)
TABLE 130 MEXICO GREEN AND BIO POLYOLS MARKET, BY TYPE, 2018-2032 (USD THOUSAND)
TABLE 131 MEXICO GREEN AND BIO POLYOLS MARKET, BY TYPE, 2018-2032 (KILO TONS)
TABLE 132 MEXICO POLYETHER POLYOLS IN GREEN AND BIO POLYOLS MARKET, BY SEGMENT, 2018-2032 (USD THOUSAND)
TABLE 133 MEXICO POLYETHER POLYOLS IN GREEN AND BIO POLYOLS MARKET, BY CATEGORY, 2018-2032 (USD THOUSAND)
TABLE 134 MEXICO POLYESTER POLYOLS IN GREEN AND BIO POLYOLS MARKET, BY SEGMENT, 2018-2032 (USD THOUSAND)
TABLE 135 MEXICO POLYESTER POLYOLS IN GREEN AND BIO POLYOLS MARKET, BY CATEGORY, 2018-2032 (USD THOUSAND)
TABLE 136 MEXICO GREEN AND BIO POLYOLS MARKET, BY APPLICATION, 2018-2032 (USD THOUSAND)
TABLE 137 MEXICO FOAM IN POLYESTER POLYOLS IN GREEN AND BIO POLYOLS MARKET, BY SEGMENT, 2018-2032 (USD THOUSAND)
TABLE 138 EUROPE GREEN AND BIO POLYOLS MARKET, BY COUNTRY, 2018-2032 (USD THOUSAND)
TABLE 139 EUROPE GREEN AND BIO POLYOLS MARKET, BY COUNTRY, 2018-2032 (KILO TONS)
TABLE 140 EUROPE GREEN AND BIO POLYOLS MARKET, BY TYPE, 2018-2032 (USD THOUSAND)
TABLE 141 EUROPE GREEN AND BIO POLYOLS MARKET, BY TYPE, 2018-2032 (KILO TONS)
TABLE 142 EUROPE POLYETHER POLYOLS IN GREEN AND BIO POLYOLS MARKET, BY SEGMENT, 2018-2032 (USD THOUSAND)
TABLE 143 EUROPE POLYETHER POLYOLS IN GREEN AND BIO POLYOLS MARKET, BY CATEGORY, 2018-2032 (USD THOUSAND)
TABLE 144 EUROPE POLYESTER POLYOLS IN GREEN AND BIO POLYOLS MARKET, BY SEGMENT, 2018-2032 (USD THOUSAND)
TABLE 145 EUROPE POLYESTER POLYOLS IN GREEN AND BIO POLYOLS MARKET, BY CATEGORY, 2018-2032 (USD THOUSAND)
TABLE 146 EUROPE GREEN AND BIO POLYOLS MARKET, BY APPLICATION, 2018-2032 (USD THOUSAND)
TABLE 147 EUROPE FOAM IN POLYESTER POLYOLS IN GREEN AND BIO POLYOLS MARKET, BY SEGMENT, 2018-2032 (USD THOUSAND)
TABLE 148 GERMANY GREEN AND BIO POLYOLS MARKET, BY TYPE, 2018-2032 (USD THOUSAND)
TABLE 149 GERMANY GREEN AND BIO POLYOLS MARKET, BY TYPE, 2018-2032 (KILO TONS)
TABLE 150 GERMANY POLYETHER POLYOLS IN GREEN AND BIO POLYOLS MARKET, BY SEGMENT, 2018-2032 (USD THOUSAND)
TABLE 151 GERMANY POLYETHER POLYOLS IN GREEN AND BIO POLYOLS MARKET, BY CATEGORY, 2018-2032 (USD THOUSAND)
TABLE 152 GERMANY POLYESTER POLYOLS IN GREEN AND BIO POLYOLS MARKET, BY SEGMENT, 2018-2032 (USD THOUSAND)
TABLE 153 GERMANY POLYESTER POLYOLS IN GREEN AND BIO POLYOLS MARKET, BY CATEGORY, 2018-2032 (USD THOUSAND)
TABLE 154 GERMANY GREEN AND BIO POLYOLS MARKET, BY APPLICATION, 2018-2032 (USD THOUSAND)
TABLE 155 GERMANY FOAM IN POLYESTER POLYOLS IN GREEN AND BIO POLYOLS MARKET, BY SEGMENT, 2018-2032 (USD THOUSAND)
TABLE 156 FRANCE GREEN AND BIO POLYOLS MARKET, BY TYPE, 2018-2032 (USD THOUSAND)
TABLE 157 FRANCE GREEN AND BIO POLYOLS MARKET, BY TYPE, 2018-2032 (KILO TONS)
TABLE 158 FRANCE POLYETHER POLYOLS IN GREEN AND BIO POLYOLS MARKET, BY SEGMENT, 2018-2032 (USD THOUSAND)
TABLE 159 FRANCE POLYETHER POLYOLS IN GREEN AND BIO POLYOLS MARKET, BY CATEGORY, 2018-2032 (USD THOUSAND)
TABLE 160 FRANCE POLYESTER POLYOLS IN GREEN AND BIO POLYOLS MARKET, BY SEGMENT, 2018-2032 (USD THOUSAND)
TABLE 161 FRANCE POLYESTER POLYOLS IN GREEN AND BIO POLYOLS MARKET, BY CATEGORY, 2018-2032 (USD THOUSAND)
TABLE 162 FRANCE GREEN AND BIO POLYOLS MARKET, BY APPLICATION, 2018-2032 (USD THOUSAND)
TABLE 163 FRANCE FOAM IN POLYESTER POLYOLS IN GREEN AND BIO POLYOLS MARKET, BY SEGMENT, 2018-2032 (USD THOUSAND)
TABLE 164 ITALY GREEN AND BIO POLYOLS MARKET, BY TYPE, 2018-2032 (USD THOUSAND)
TABLE 165 ITALY GREEN AND BIO POLYOLS MARKET, BY TYPE, 2018-2032 (KILO TONS)
TABLE 166 ITALY POLYETHER POLYOLS IN GREEN AND BIO POLYOLS MARKET, BY SEGMENT, 2018-2032 (USD THOUSAND)
TABLE 167 ITALY POLYETHER POLYOLS IN GREEN AND BIO POLYOLS MARKET, BY CATEGORY, 2018-2032 (USD THOUSAND)
TABLE 168 ITALY POLYESTER POLYOLS IN GREEN AND BIO POLYOLS MARKET, BY SEGMENT, 2018-2032 (USD THOUSAND)
TABLE 169 ITALY POLYESTER POLYOLS IN GREEN AND BIO POLYOLS MARKET, BY CATEGORY, 2018-2032 (USD THOUSAND)
TABLE 170 ITALY GREEN AND BIO POLYOLS MARKET, BY APPLICATION, 2018-2032 (USD THOUSAND)
TABLE 171 ITALY FOAM IN POLYESTER POLYOLS IN GREEN AND BIO POLYOLS MARKET, BY SEGMENT, 2018-2032 (USD THOUSAND)
TABLE 172 NETHERLANDS GREEN AND BIO POLYOLS MARKET, BY TYPE, 2018-2032 (USD THOUSAND)
TABLE 173 NETHERLANDS GREEN AND BIO POLYOLS MARKET, BY TYPE, 2018-2032 (KILO TONS)
TABLE 174 NETHERLANDS POLYETHER POLYOLS IN GREEN AND BIO POLYOLS MARKET, BY SEGMENT, 2018-2032 (USD THOUSAND)
TABLE 175 NETHERLANDS POLYETHER POLYOLS IN GREEN AND BIO POLYOLS MARKET, BY CATEGORY, 2018-2032 (USD THOUSAND)
TABLE 176 NETHERLANDS POLYESTER POLYOLS IN GREEN AND BIO POLYOLS MARKET, BY SEGMENT, 2018-2032 (USD THOUSAND)
TABLE 177 NETHERLANDS POLYESTER POLYOLS IN GREEN AND BIO POLYOLS MARKET, BY CATEGORY, 2018-2032 (USD THOUSAND)
TABLE 178 NETHERLANDS GREEN AND BIO POLYOLS MARKET, BY APPLICATION, 2018-2032 (USD THOUSAND)
TABLE 179 NETHERLANDS FOAM IN POLYESTER POLYOLS IN GREEN AND BIO POLYOLS MARKET, BY SEGMENT, 2018-2032 (USD THOUSAND)
TABLE 180 U.K. GREEN AND BIO POLYOLS MARKET, BY TYPE, 2018-2032 (USD THOUSAND)
TABLE 181 U.K. GREEN AND BIO POLYOLS MARKET, BY TYPE, 2018-2032 (KILO TONS)
TABLE 182 U.K. POLYETHER POLYOLS IN GREEN AND BIO POLYOLS MARKET, BY SEGMENT, 2018-2032 (USD THOUSAND)
TABLE 183 U.K. POLYETHER POLYOLS IN GREEN AND BIO POLYOLS MARKET, BY CATEGORY, 2018-2032 (USD THOUSAND)
TABLE 184 U.K. POLYESTER POLYOLS IN GREEN AND BIO POLYOLS MARKET, BY SEGMENT, 2018-2032 (USD THOUSAND)
TABLE 185 U.K. POLYESTER POLYOLS IN GREEN AND BIO POLYOLS MARKET, BY CATEGORY, 2018-2032 (USD THOUSAND)
TABLE 186 U.K. GREEN AND BIO POLYOLS MARKET, BY APPLICATION, 2018-2032 (USD THOUSAND)
TABLE 187 U.K. FOAM IN POLYESTER POLYOLS IN GREEN AND BIO POLYOLS MARKET, BY SEGMENT, 2018-2032 (USD THOUSAND)
TABLE 188 SPAIN GREEN AND BIO POLYOLS MARKET, BY TYPE, 2018-2032 (USD THOUSAND)
TABLE 189 SPAIN GREEN AND BIO POLYOLS MARKET, BY TYPE, 2018-2032 (KILO TONS)
TABLE 190 SPAIN POLYETHER POLYOLS IN GREEN AND BIO POLYOLS MARKET, BY SEGMENT, 2018-2032 (USD THOUSAND)
TABLE 191 SPAIN POLYETHER POLYOLS IN GREEN AND BIO POLYOLS MARKET, BY CATEGORY, 2018-2032 (USD THOUSAND)
TABLE 192 SPAIN POLYESTER POLYOLS IN GREEN AND BIO POLYOLS MARKET, BY SEGMENT, 2018-2032 (USD THOUSAND)
TABLE 193 SPAIN POLYESTER POLYOLS IN GREEN AND BIO POLYOLS MARKET, BY CATEGORY, 2018-2032 (USD THOUSAND)
TABLE 194 SPAIN GREEN AND BIO POLYOLS MARKET, BY APPLICATION, 2018-2032 (USD THOUSAND)
TABLE 195 SPAIN FOAM IN POLYESTER POLYOLS IN GREEN AND BIO POLYOLS MARKET, BY SEGMENT, 2018-2032 (USD THOUSAND)
TABLE 196 BELGIUM GREEN AND BIO POLYOLS MARKET, BY TYPE, 2018-2032 (USD THOUSAND)
TABLE 197 BELGIUM GREEN AND BIO POLYOLS MARKET, BY TYPE, 2018-2032 (KILO TONS)
TABLE 198 BELGIUM POLYETHER POLYOLS IN GREEN AND BIO POLYOLS MARKET, BY SEGMENT, 2018-2032 (USD THOUSAND)
TABLE 199 BELGIUM POLYETHER POLYOLS IN GREEN AND BIO POLYOLS MARKET, BY CATEGORY, 2018-2032 (USD THOUSAND)
TABLE 200 BELGIUM POLYESTER POLYOLS IN GREEN AND BIO POLYOLS MARKET, BY SEGMENT, 2018-2032 (USD THOUSAND)
TABLE 201 BELGIUM POLYESTER POLYOLS IN GREEN AND BIO POLYOLS MARKET, BY CATEGORY, 2018-2032 (USD THOUSAND)
TABLE 202 BELGIUM GREEN AND BIO POLYOLS MARKET, BY APPLICATION, 2018-2032 (USD THOUSAND)
TABLE 203 BELGIUM FOAM IN POLYESTER POLYOLS IN GREEN AND BIO POLYOLS MARKET, BY SEGMENT, 2018-2032 (USD THOUSAND)
TABLE 204 RUSSIA GREEN AND BIO POLYOLS MARKET, BY TYPE, 2018-2032 (USD THOUSAND)
TABLE 205 RUSSIA GREEN AND BIO POLYOLS MARKET, BY TYPE, 2018-2032 (KILO TONS)
TABLE 206 RUSSIA POLYETHER POLYOLS IN GREEN AND BIO POLYOLS MARKET, BY SEGMENT, 2018-2032 (USD THOUSAND)
TABLE 207 RUSSIA POLYETHER POLYOLS IN GREEN AND BIO POLYOLS MARKET, BY CATEGORY, 2018-2032 (USD THOUSAND)
TABLE 208 RUSSIA POLYESTER POLYOLS IN GREEN AND BIO POLYOLS MARKET, BY SEGMENT, 2018-2032 (USD THOUSAND)
TABLE 209 RUSSIA POLYESTER POLYOLS IN GREEN AND BIO POLYOLS MARKET, BY CATEGORY, 2018-2032 (USD THOUSAND)
TABLE 210 RUSSIA GREEN AND BIO POLYOLS MARKET, BY APPLICATION, 2018-2032 (USD THOUSAND)
TABLE 211 RUSSIA FOAM IN POLYESTER POLYOLS IN GREEN AND BIO POLYOLS MARKET, BY SEGMENT, 2018-2032 (USD THOUSAND)
TABLE 212 SWITZERLAND GREEN AND BIO POLYOLS MARKET, BY TYPE, 2018-2032 (USD THOUSAND)
TABLE 213 SWITZERLAND GREEN AND BIO POLYOLS MARKET, BY TYPE, 2018-2032 (KILO TONS)
TABLE 214 SWITZERLAND POLYETHER POLYOLS IN GREEN AND BIO POLYOLS MARKET, BY SEGMENT, 2018-2032 (USD THOUSAND)
TABLE 215 SWITZERLAND POLYETHER POLYOLS IN GREEN AND BIO POLYOLS MARKET, BY CATEGORY, 2018-2032 (USD THOUSAND)
TABLE 216 SWITZERLAND POLYESTER POLYOLS IN GREEN AND BIO POLYOLS MARKET, BY SEGMENT, 2018-2032 (USD THOUSAND)
TABLE 217 SWITZERLAND POLYESTER POLYOLS IN GREEN AND BIO POLYOLS MARKET, BY CATEGORY, 2018-2032 (USD THOUSAND)
TABLE 218 SWITZERLAND GREEN AND BIO POLYOLS MARKET, BY APPLICATION, 2018-2032 (USD THOUSAND)
TABLE 219 SWITZERLAND FOAM IN POLYESTER POLYOLS IN GREEN AND BIO POLYOLS MARKET, BY SEGMENT, 2018-2032 (USD THOUSAND)
TABLE 220 TURKEY GREEN AND BIO POLYOLS MARKET, BY TYPE, 2018-2032 (USD THOUSAND)
TABLE 221 TURKEY GREEN AND BIO POLYOLS MARKET, BY TYPE, 2018-2032 (KILO TONS)
TABLE 222 TURKEY POLYETHER POLYOLS IN GREEN AND BIO POLYOLS MARKET, BY SEGMENT, 2018-2032 (USD THOUSAND)
TABLE 223 TURKEY POLYETHER POLYOLS IN GREEN AND BIO POLYOLS MARKET, BY CATEGORY, 2018-2032 (USD THOUSAND)
TABLE 224 TURKEY POLYESTER POLYOLS IN GREEN AND BIO POLYOLS MARKET, BY SEGMENT, 2018-2032 (USD THOUSAND)
TABLE 225 TURKEY POLYESTER POLYOLS IN GREEN AND BIO POLYOLS MARKET, BY CATEGORY, 2018-2032 (USD THOUSAND)
TABLE 226 TURKEY GREEN AND BIO POLYOLS MARKET, BY APPLICATION, 2018-2032 (USD THOUSAND)
TABLE 227 TURKEY FOAM IN POLYESTER POLYOLS IN GREEN AND BIO POLYOLS MARKET, BY SEGMENT, 2018-2032 (USD THOUSAND)
TABLE 228 LUXEMBURG GREEN AND BIO POLYOLS MARKET, BY TYPE, 2018-2032 (USD THOUSAND)
TABLE 229 LUXEMBURG GREEN AND BIO POLYOLS MARKET, BY TYPE, 2018-2032 (KILO TONS)
TABLE 230 LUXEMBURG POLYETHER POLYOLS IN GREEN AND BIO POLYOLS MARKET, BY SEGMENT, 2018-2032 (USD THOUSAND)
TABLE 231 LUXEMBURG POLYETHER POLYOLS IN GREEN AND BIO POLYOLS MARKET, BY CATEGORY, 2018-2032 (USD THOUSAND)
TABLE 232 LUXEMBURG POLYESTER POLYOLS IN GREEN AND BIO POLYOLS MARKET, BY SEGMENT, 2018-2032 (USD THOUSAND)
TABLE 233 LUXEMBURG POLYESTER POLYOLS IN GREEN AND BIO POLYOLS MARKET, BY CATEGORY, 2018-2032 (USD THOUSAND)
TABLE 234 LUXEMBURG GREEN AND BIO POLYOLS MARKET, BY APPLICATION, 2018-2032 (USD THOUSAND)
TABLE 235 LUXEMBURG FOAM IN POLYESTER POLYOLS IN GREEN AND BIO POLYOLS MARKET, BY SEGMENT, 2018-2032 (USD THOUSAND)
TABLE 236 REST OF EUROPE GREEN AND BIO POLYOLS MARKET, BY TYPE, 2018-2032 (USD THOUSAND)
TABLE 237 REST OF EUROPE GREEN AND BIO POLYOLS MARKET, BY TYPE, 2018-2032 (KILO TONS)
TABLE 238 MIDDLE EAST AND AFRICA GREEN AND BIO POLYOLS MARKET, BY COUNTRY, 2018-2032 (USD THOUSAND)
TABLE 239 MIDDLE EAST AND AFRICA GREEN AND BIO POLYOLS MARKET, BY COUNTRY, 2018-2032 (KILO TONS)
TABLE 240 MIDDLE EAST AND AFRICA GREEN AND BIO POLYOLS MARKET, BY TYPE, 2018-2032 (USD THOUSAND)
TABLE 241 MIDDLE EAST AND AFRICA GREEN AND BIO POLYOLS MARKET, BY TYPE, 2018-2032 (KILO TONS)
TABLE 242 MIDDLE EAST AND AFRICA POLYETHER POLYOLS IN GREEN AND BIO POLYOLS MARKET, BY SEGMENT, 2018-2032 (USD THOUSAND)
TABLE 243 MIDDLE EAST AND AFRICA POLYETHER POLYOLS IN GREEN AND BIO POLYOLS MARKET, BY CATEGORY, 2018-2032 (USD THOUSAND)
TABLE 244 MIDDLE EAST AND AFRICA POLYESTER POLYOLS IN GREEN AND BIO POLYOLS MARKET, BY SEGMENT, 2018-2032 (USD THOUSAND)
TABLE 245 MIDDLE EAST AND AFRICA POLYESTER POLYOLS IN GREEN AND BIO POLYOLS MARKET, BY CATEGORY, 2018-2032 (USD THOUSAND)
TABLE 246 MIDDLE EAST AND AFRICA GREEN AND BIO POLYOLS MARKET, BY APPLICATION, 2018-2032 (USD THOUSAND)
TABLE 247 MIDDLE EAST AND AFRICA FOAM IN POLYESTER POLYOLS IN GREEN AND BIO POLYOLS MARKET, BY SEGMENT, 2018-2032 (USD THOUSAND)
TABLE 248 SAUDI ARABIA GREEN AND BIO POLYOLS MARKET, BY TYPE, 2018-2032 (USD THOUSAND)
TABLE 249 SAUDI ARABIA GREEN AND BIO POLYOLS MARKET, BY TYPE, 2018-2032 (KILO TONS)
TABLE 250 SAUDI ARABIA POLYETHER POLYOLS IN GREEN AND BIO POLYOLS MARKET, BY SEGMENT, 2018-2032 (USD THOUSAND)
TABLE 251 SAUDI ARABIA POLYETHER POLYOLS IN GREEN AND BIO POLYOLS MARKET, BY CATEGORY, 2018-2032 (USD THOUSAND)
TABLE 252 SAUDI ARABIA POLYESTER POLYOLS IN GREEN AND BIO POLYOLS MARKET, BY SEGMENT, 2018-2032 (USD THOUSAND)
TABLE 253 SAUDI ARABIA POLYESTER POLYOLS IN GREEN AND BIO POLYOLS MARKET, BY CATEGORY, 2018-2032 (USD THOUSAND)
TABLE 254 SAUDI ARABIA GREEN AND BIO POLYOLS MARKET, BY APPLICATION, 2018-2032 (USD THOUSAND)
TABLE 255 SAUDI ARABIA FOAM IN POLYESTER POLYOLS IN GREEN AND BIO POLYOLS MARKET, BY SEGMENT, 2018-2032 (USD THOUSAND)
TABLE 256 U.A.E. GREEN AND BIO POLYOLS MARKET, BY TYPE, 2018-2032 (USD THOUSAND)
TABLE 257 U.A.E. GREEN AND BIO POLYOLS MARKET, BY TYPE, 2018-2032 (KILO TONS)
TABLE 258 U.A.E. POLYETHER POLYOLS IN GREEN AND BIO POLYOLS MARKET, BY SEGMENT, 2018-2032 (USD THOUSAND)
TABLE 259 U.A.E. POLYETHER POLYOLS IN GREEN AND BIO POLYOLS MARKET, BY CATEGORY, 2018-2032 (USD THOUSAND)
TABLE 260 U.A.E. POLYESTER POLYOLS IN GREEN AND BIO POLYOLS MARKET, BY SEGMENT, 2018-2032 (USD THOUSAND)
TABLE 261 U.A.E. POLYESTER POLYOLS IN GREEN AND BIO POLYOLS MARKET, BY CATEGORY, 2018-2032 (USD THOUSAND)
TABLE 262 U.A.E. GREEN AND BIO POLYOLS MARKET, BY APPLICATION, 2018-2032 (USD THOUSAND)
TABLE 263 U.A.E. FOAM IN POLYESTER POLYOLS IN GREEN AND BIO POLYOLS MARKET, BY SEGMENT, 2018-2032 (USD THOUSAND)
TABLE 264 EGYPT GREEN AND BIO POLYOLS MARKET, BY TYPE, 2018-2032 (USD THOUSAND)
TABLE 265 EGYPT GREEN AND BIO POLYOLS MARKET, BY TYPE, 2018-2032 (KILO TONS)
TABLE 266 EGYPT POLYETHER POLYOLS IN GREEN AND BIO POLYOLS MARKET, BY SEGMENT, 2018-2032 (USD THOUSAND)
TABLE 267 EGYPT POLYETHER POLYOLS IN GREEN AND BIO POLYOLS MARKET, BY CATEGORY, 2018-2032 (USD THOUSAND)
TABLE 268 EGYPT POLYESTER POLYOLS IN GREEN AND BIO POLYOLS MARKET, BY SEGMENT, 2018-2032 (USD THOUSAND)
TABLE 269 EGYPT POLYESTER POLYOLS IN GREEN AND BIO POLYOLS MARKET, BY CATEGORY, 2018-2032 (USD THOUSAND)
TABLE 270 EGYPT GREEN AND BIO POLYOLS MARKET, BY APPLICATION, 2018-2032 (USD THOUSAND)
TABLE 271 EGYPT FOAM IN POLYESTER POLYOLS IN GREEN AND BIO POLYOLS MARKET, BY SEGMENT, 2018-2032 (USD THOUSAND)
TABLE 272 SOUTH AFRICA GREEN AND BIO POLYOLS MARKET, BY TYPE, 2018-2032 (USD THOUSAND)
TABLE 273 SOUTH AFRICA GREEN AND BIO POLYOLS MARKET, BY TYPE, 2018-2032 (KILO TONS)
TABLE 274 SOUTH AFRICA POLYETHER POLYOLS IN GREEN AND BIO POLYOLS MARKET, BY SEGMENT, 2018-2032 (USD THOUSAND)
TABLE 275 SOUTH AFRICA POLYETHER POLYOLS IN GREEN AND BIO POLYOLS MARKET, BY CATEGORY, 2018-2032 (USD THOUSAND)
TABLE 276 SOUTH AFRICA POLYESTER POLYOLS IN GREEN AND BIO POLYOLS MARKET, BY SEGMENT, 2018-2032 (USD THOUSAND)
TABLE 277 SOUTH AFRICA POLYESTER POLYOLS IN GREEN AND BIO POLYOLS MARKET, BY CATEGORY, 2018-2032 (USD THOUSAND)
TABLE 278 SOUTH AFRICA GREEN AND BIO POLYOLS MARKET, BY APPLICATION, 2018-2032 (USD THOUSAND)
TABLE 279 SOUTH AFRICA FOAM IN POLYESTER POLYOLS IN GREEN AND BIO POLYOLS MARKET, BY SEGMENT, 2018-2032 (USD THOUSAND)
TABLE 280 ISRAEL GREEN AND BIO POLYOLS MARKET, BY TYPE, 2018-2032 (USD THOUSAND)
TABLE 281 ISRAEL GREEN AND BIO POLYOLS MARKET, BY TYPE, 2018-2032 (KILO TONS)
TABLE 282 ISRAEL POLYETHER POLYOLS IN GREEN AND BIO POLYOLS MARKET, BY SEGMENT, 2018-2032 (USD THOUSAND)
TABLE 283 ISRAEL POLYETHER POLYOLS IN GREEN AND BIO POLYOLS MARKET, BY CATEGORY, 2018-2032 (USD THOUSAND)
TABLE 284 ISRAEL POLYESTER POLYOLS IN GREEN AND BIO POLYOLS MARKET, BY SEGMENT, 2018-2032 (USD THOUSAND)
TABLE 285 ISRAEL POLYESTER POLYOLS IN GREEN AND BIO POLYOLS MARKET, BY CATEGORY, 2018-2032 (USD THOUSAND)
TABLE 286 ISRAEL GREEN AND BIO POLYOLS MARKET, BY APPLICATION, 2018-2032 (USD THOUSAND)
TABLE 287 ISRAEL FOAM IN POLYESTER POLYOLS IN GREEN AND BIO POLYOLS MARKET, BY SEGMENT, 2018-2032 (USD THOUSAND)
TABLE 288 REST OF MIDDLE EAST AND AFRICA GREEN AND BIO POLYOLS MARKET, BY TYPE, 2018-2032 (USD THOUSAND)
TABLE 289 REST OF MIDDLE EAST AND AFRICA GREEN AND BIO POLYOLS MARKET, BY TYPE, 2018-2032 (KILO TONS)
TABLE 290 SOUTH AMERICA GREEN AND BIO POLYOLS MARKET, BY COUNTRY, 2018-2032 (USD THOUSAND)
TABLE 291 SOUTH AMERICA GREEN AND BIO POLYOLS MARKET, BY COUNTRY, 2018-2032 (KILO TONS)
TABLE 292 SOUTH AMERICA GREEN AND BIO POLYOLS MARKET, BY TYPE, 2018-2032 (USD THOUSAND)
TABLE 293 SOUTH AMERICA GREEN AND BIO POLYOLS MARKET, BY TYPE, 2018-2032 (KILO TONS)
TABLE 294 SOUTH AMERICA POLYETHER POLYOLS IN GREEN AND BIO POLYOLS MARKET, BY SEGMENT, 2018-2032 (USD THOUSAND)
TABLE 295 SOUTH AMERICA POLYETHER POLYOLS IN GREEN AND BIO POLYOLS MARKET, BY CATEGORY, 2018-2032 (USD THOUSAND)
TABLE 296 SOUTH AMERICA POLYESTER POLYOLS IN GREEN AND BIO POLYOLS MARKET, BY SEGMENT, 2018-2032 (USD THOUSAND)
TABLE 297 SOUTH AMERICA POLYESTER POLYOLS IN GREEN AND BIO POLYOLS MARKET, BY CATEGORY, 2018-2032 (USD THOUSAND)
TABLE 298 SOUTH AMERICA GREEN AND BIO POLYOLS MARKET, BY APPLICATION, 2018-2032 (USD THOUSAND)
TABLE 299 SOUTH AMERICA FOAM IN POLYESTER POLYOLS IN GREEN AND BIO POLYOLS MARKET, BY SEGMENT, 2018-2032 (USD THOUSAND)
TABLE 300 BRAZIL GREEN AND BIO POLYOLS MARKET, BY TYPE, 2018-2032 (USD THOUSAND)
TABLE 301 BRAZIL GREEN AND BIO POLYOLS MARKET, BY TYPE, 2018-2032 (KILO TONS)
TABLE 302 BRAZIL POLYETHER POLYOLS IN GREEN AND BIO POLYOLS MARKET, BY SEGMENT, 2018-2032 (USD THOUSAND)
TABLE 303 BRAZIL POLYETHER POLYOLS IN GREEN AND BIO POLYOLS MARKET, BY CATEGORY, 2018-2032 (USD THOUSAND)
TABLE 304 BRAZIL POLYESTER POLYOLS IN GREEN AND BIO POLYOLS MARKET, BY SEGMENT, 2018-2032 (USD THOUSAND)
TABLE 305 BRAZIL POLYESTER POLYOLS IN GREEN AND BIO POLYOLS MARKET, BY CATEGORY, 2018-2032 (USD THOUSAND)
TABLE 306 BRAZIL GREEN AND BIO POLYOLS MARKET, BY APPLICATION, 2018-2032 (USD THOUSAND)
TABLE 307 BRAZIL FOAM IN POLYESTER POLYOLS IN GREEN AND BIO POLYOLS MARKET, BY SEGMENT, 2018-2032 (USD THOUSAND)
TABLE 308 ARGENTINA GREEN AND BIO POLYOLS MARKET, BY TYPE, 2018-2032 (USD THOUSAND)
TABLE 309 ARGENTINA GREEN AND BIO POLYOLS MARKET, BY TYPE, 2018-2032 (KILO TONS)
TABLE 310 ARGENTINA POLYETHER POLYOLS IN GREEN AND BIO POLYOLS MARKET, BY SEGMENT, 2018-2032 (USD THOUSAND)
TABLE 311 ARGENTINA POLYETHER POLYOLS IN GREEN AND BIO POLYOLS MARKET, BY CATEGORY, 2018-2032 (USD THOUSAND)
TABLE 312 ARGENTINA POLYESTER POLYOLS IN GREEN AND BIO POLYOLS MARKET, BY SEGMENT, 2018-2032 (USD THOUSAND)
TABLE 313 ARGENTINA POLYESTER POLYOLS IN GREEN AND BIO POLYOLS MARKET, BY CATEGORY, 2018-2032 (USD THOUSAND)
TABLE 314 ARGENTINA GREEN AND BIO POLYOLS MARKET, BY APPLICATION, 2018-2032 (USD THOUSAND)
TABLE 315 ARGENTINA FOAM IN POLYESTER POLYOLS IN GREEN AND BIO POLYOLS MARKET, BY SEGMENT, 2018-2032 (USD THOUSAND)
TABLE 316 REST OF SOUTH AMERICA GREEN AND BIO POLYOLS MARKET, BY TYPE, 2018-2032 (USD THOUSAND)
TABLE 317 REST OF SOUTH AMERICA GREEN AND BIO POLYOLS MARKET, BY TYPE, 2018-2032 (KILO TONS)
List of Figure
FIGURE 1 GLOBAL GREEN AND BIO POLYOLS MARKET
FIGURE 2 GLOBAL GREEN AND BIO POLYOLS MARKET: DATA TRIANGULATION
FIGURE 3 GLOBAL GREEN AND BIO POLYOLS MARKET: DROC ANALYSIS
FIGURE 4 GLOBAL GREEN AND BIO POLYOLS MARKET: GLOBAL VS REGIONAL MARKET ANALYSIS
FIGURE 5 GLOBAL GREEN AND BIO POLYOLS MARKET: COMPANY RESEARCH ANALYSIS
FIGURE 6 GLOBAL GREEN AND BIO POLYOLS MARKET: MULTIVARIATE MODELLING
FIGURE 7 GLOBAL GREEN AND BIO POLYOLS MARKET: INTERVIEW DEMOGRAPHICS
FIGURE 8 GLOBAL GREEN AND BIO POLYOLS MARKET: DBMR MARKET POSITION GRID
FIGURE 9 GLOBAL GREEN AND BIO POLYOLS MARKET: VENDOR SHARE ANALYSIS
FIGURE 10 GLOBAL GREEN AND BIO POLYOLS MARKET: APPLICATION COVERAGE GRID
FIGURE 11 GLOBAL GREEN AND BIO POLYOLS MARKET: SEGMENTATION
FIGURE 12 ASIA-PACIFIC IS EXPECTED TO DOMINATE THE GLOBAL GREEN AND BIO POLYOLS MARKET AND IS EXPECTED TO GROW WITH THE HIGHEST CAGR IN THE FORECAST PERIOD
FIGURE 13 GLOBAL GREEN AND BIO POLYOLS MARKET, BY TYP, 2024
FIGURE 14 EXECUTIVE SUMMARY OF GLOBAL GREEN AND BIO POLYOLS MARKET
FIGURE 15 STRATEGIC DECISIONS
FIGURE 16 RISING AWARENESS OF SUSTAINABLE MATERIALS IS EXPECTED TO DRIVE THE GLOBAL GREEN AND BIO POLYOLS MARKET IN THE FORECAST PERIOD
FIGURE 17 THE POLYETHER POLYOLS SEGMENT IS EXPECTED TO ACCOUNT FOR THE LARGEST SHARE OF THE GLOBAL GREEN AND BIO POLYOLS MARKET IN 2025 AND 2032
FIGURE 18 ASIA-PACIFIC IS THE FASTEST-GROWING MARKET FOR GLOBAL GREEN AND BIO POLYOLS MARKET IN THE FORECAST PERIOD
FIGURE 19 PESTEL ANALYSIS
FIGURE 20 PORTER’S FIVE FORCES
FIGURE 21 IMPORT EXPORT SCENARIO (USD THOUSAND)
FIGURE 22 GLOBAL GREEN AND BIO POLYOLS MARKET, 2023-2032, AVERAGE SELLING PRICE (USD/TON)
FIGURE 23 PRODUCTION CONSUMPTION ANALYSIS
FIGURE 24 VENDOR SELECTION CRITERIA
FIGURE 25 DRIVERS, RESTRAINTS, OPPORTUNITIES, AND CHALLENGES FOR GLOBAL GREEN AND BIO POLYOLS MARKET
FIGURE 26 TOTAL LENGTH OF NATIONAL HIGHWAY IN (KM) (2014-2023) OF INDIA
FIGURE 27 NUMBER OF AIRPORTS (2014-2024) IN INDIA
FIGURE 28 GLOBAL GREEN AND BIO POLYOLS MARKET: BY TYPE, 2024
FIGURE 29 GLOBAL GREEN AND BIO POLYOLS MARKET: BY APPLICATION, 2024
FIGURE 30 GLOBAL GREEN AND BIO POLYOLS MARKET: SNAPSHOT (2024)
FIGURE 31 ASIA-PACIFIC GREEN AND BIO POLYOLS MARKET: SNAPSHOT (2024)
FIGURE 32 NORTH AMERICA GREEN AND BIO POLYOLS MARKET: SNAPSHOT (2024)
FIGURE 33 EUROPE GREEN AND BIO POLYOLS MARKET: SNAPSHOT (2024)
FIGURE 34 MIDDLE EAST AND AFRICA GREEN AND BIO POLYOLS MARKET: SNAPSHOT (2024)
FIGURE 35 SOUTH AMERICA GREEN AND BIO POLYOLS MARKET: SNAPSHOT (2024)
FIGURE 36 GLOBAL GREEN AND BIO POLYOLS MARKET: COMPANY SHARE 2024 (%)
FIGURE 37 ASIA-PACIFC GREEN AND BIO POLYOLS MARKET: COMPANY SHARE 2024 (%)
FIGURE 38 EUROPE GREEN AND BIO POLYOLS MARKET: COMPANY SHARE 2024 (%)
FIGURE 39 NORTH AMERICA GREEN AND BIO POLYOLS MARKET: COMPANY SHARE 2024 (%)
Global Green Bio Polyols Market, Supply Chain Analysis and Ecosystem Framework
To support market growth and help clients navigate the impact of geopolitical shifts, DBMR has integrated in-depth supply chain analysis into its Global Green Bio Polyols Market research reports. This addition empowers clients to respond effectively to global changes affecting their industries. The supply chain analysis section includes detailed insights such as Global Green Bio Polyols Market consumption and production by country, price trend analysis, the impact of tariffs and geopolitical developments, and import and export trends by country and HSN code. It also highlights major suppliers with data on production capacity and company profiles, as well as key importers and exporters. In addition to research, DBMR offers specialized supply chain consulting services backed by over a decade of experience, providing solutions like supplier discovery, supplier risk assessment, price trend analysis, impact evaluation of inflation and trade route changes, and comprehensive market trend analysis.
Data collection and base year analysis are done using data collection modules with large sample sizes. The stage includes obtaining market information or related data through various sources and strategies. It includes examining and planning all the data acquired from the past in advance. It likewise envelops the examination of information inconsistencies seen across different information sources. The market data is analysed and estimated using market statistical and coherent models. Also, market share analysis and key trend analysis are the major success factors in the market report. To know more, please request an analyst call or drop down your inquiry.
The key research methodology used by DBMR research team is data triangulation which involves data mining, analysis of the impact of data variables on the market and primary (industry expert) validation. Data models include Vendor Positioning Grid, Market Time Line Analysis, Market Overview and Guide, Company Positioning Grid, Patent Analysis, Pricing Analysis, Company Market Share Analysis, Standards of Measurement, Global versus Regional and Vendor Share Analysis. To know more about the research methodology, drop in an inquiry to speak to our industry experts.
Data Bridge Market Research is a leader in advanced formative research. We take pride in servicing our existing and new customers with data and analysis that match and suits their goal. The report can be customized to include price trend analysis of target brands understanding the market for additional countries (ask for the list of countries), clinical trial results data, literature review, refurbished market and product base analysis. Market analysis of target competitors can be analyzed from technology-based analysis to market portfolio strategies. We can add as many competitors that you require data about in the format and data style you are looking for. Our team of analysts can also provide you data in crude raw excel files pivot tables (Fact book) or can assist you in creating presentations from the data sets available in the report.


