
Global Her2 Positive Breast Cancer Treatment Market
Market Size in USD Billion
 USD
11.14 Billion
USD
12.54 Billion
2025
2033
USD
11.14 Billion
USD
12.54 Billion
2025
2033
| 2026 - 2033 | |
| USD 11.14 Billion | |
| USD 12.54 Billion | |
| % | |
|
HER2 Positive Breast Cancer Treatment Market Size
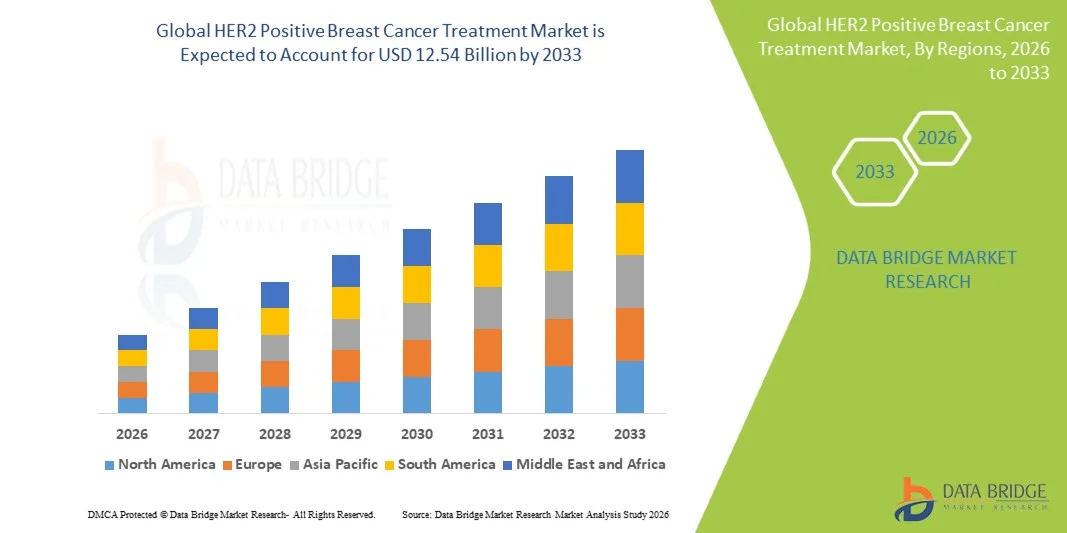
- The global HER2 Positive Breast Cancer Treatment market size was valued at USD 11.14 billion in 2025 and is expected to reach USD 12.54 billion by 2033, at a CAGR of 1.50% during the forecast period
- The market growth is largely fueled by the growing adoption and technological progress within antibody-drug conjugate (ADC) therapies and next-generation anti-HER2 targeted agents, leading to increased clinical efficacy and improved patient survival outcomes across all treatment lines
- Furthermore, rising demand for effective, well-tolerated, and molecularly targeted treatment solutions for HER2-positive early-stage and metastatic breast cancer is establishing novel anti-HER2 therapies as the modern standard of oncological care. These converging factors are accelerating the uptake of HER2 Positive Breast Cancer Treatment solutions, thereby significantly boosting the industry's growth
HER2 Positive Breast Cancer Treatment Market Analysis
- HER2 positive breast cancer treatments, offering targeted therapeutic intervention for the approximately 15-20% of all breast cancer patients with HER2 gene amplification or protein overexpression, are increasingly vital components of modern oncology care pathways in both neoadjuvant and metastatic treatment settings due to their superior efficacy, improved tolerability versus non-targeted alternatives, and strong alignment with precision medicine frameworks
- The escalating demand for HER2 positive breast cancer treatments is primarily fueled by the rising global burden of HER2-positive breast cancer, the expanding clinical utility of novel therapeutic modalities including ADCs and bispecific antibodies, and a growing preference for comprehensive HER2-directed treatment strategies
- North America dominated the HER2 positive breast cancer treatment market with the largest revenue share of 42.30% in 2025, characterized by early adoption of novel anti-HER2 therapies, high healthcare expenditure, and a strong presence of key pharmaceutical industry players
- Asia-Pacific is expected to be the fastest growing region in the HER2 positive breast cancer treatment market during the forecast period due to increasing incidence, growing healthcare infrastructure, and expanding HER2 testing access in countries such as China, Japan, and South Korea
- The Parenteral segment held the largest market revenue share of 61.3% in 2025, driven by the widespread use of intravenous monoclonal antibodies and injectable chemotherapy drugs in hospital settings
Report Scope and HER2 Positive Breast Cancer Treatment Market Segmentation
|
Attributes |
HER2 Positive Breast Cancer Treatment Key Market Insights |
|
Segments Covered |
|
|
Countries Covered |
North America
Europe
Asia-Pacific
Middle East and Africa
South America
|
|
Key Market Players |
• Roche (Switzerland) |
|
Market Opportunities |
|
|
Value Added Data Infosets |
In addition to the insights on market scenarios such as market value, growth rate, segmentation, geographical coverage, and major players, the market reports curated by the Data Bridge Market Research also include in-depth expert analysis, patient epidemiology, pipeline analysis, pricing analysis, and regulatory framework. |
HER2 Positive Breast Cancer Treatment Market Trends
“ADC Revolution Reshaping the HER2 Positive Treatment Paradigm”
- A significant and accelerating trend in the global HER2 Positive Breast Cancer Treatment market is the transformative clinical impact and rapid commercial adoption of antibody-drug conjugates (ADCs), particularly trastuzumab deruxtecan (T-DXd), which is fundamentally reshaping treatment sequencing decisions across all lines of HER2-positive breast cancer management. This evolution in the therapeutic landscape is significantly expanding the population of patients achieving meaningful clinical benefit from HER2-directed therapy
- For Instance, the DESTINY-Breast06 trial results presented at ASCO 2024 demonstrated compelling efficacy of trastuzumab deruxtecan in HER2-low and HER2-ultralow breast cancer patients, substantially expanding the addressable patient population for ADC therapy beyond conventional HER2-positive disease and creating a new therapeutic category with major commercial implications
- ADC innovation in HER2 positive breast cancer treatment enables features such as bystander tumor cell killing through the release of highly potent cytotoxic payloads, selectivity through HER2-targeted antibody delivery, and durable remission through sustained tumor control. These mechanisms have demonstrated progression-free survival improvements of 38% to 52% compared to standard-of-care in pivotal clinical trials
- The seamless integration of T-DXd treatment outcomes data with real-world evidence platforms and advanced clinical analytics tools facilitates centralized management of complex ADC treatment programs across multidisciplinary breast cancer care teams. Through integrated electronic health records and oncology information systems, breast oncologists can comprehensively manage HER2 testing results, treatment histories, and adverse event monitoring
- This trend towards more potent, precisely targeted, and next-generation ADC-based treatment approaches is fundamentally reshaping clinical treatment algorithms for HER2 positive breast cancer. Consequently, companies such as AstraZeneca and Daiichi Sankyo are co-developing an expanding ADC pipeline targeting HER2 with novel linker-payload combinations designed to overcome resistance and improve the therapeutic index
- The demand for HER2 positive breast cancer treatments incorporating ADC-based approaches is growing rapidly across both academic breast cancer centers and community oncology settings, as clinicians increasingly prioritize deep and durable tumor responses and comprehensive patient survival outcomes
HER2 Positive Breast Cancer Treatment Market Dynamics
Driver
“Growing Need Due to Rising HER2 Positive Breast Cancer Incidence and Novel Therapeutic Innovation”
- The increasing global incidence of HER2-positive breast cancer, with approximately 300,000 new HER2-positive breast cancer cases diagnosed annually worldwide and incidence rising at approximately 1.8% per year in several regions, coupled with the accelerating pace of novel therapeutic innovation in the anti-HER2 space, is a significant driver for the heightened demand for advanced HER2-positive breast cancer treatment options
- For Instance, in January 2025, AstraZeneca and Daiichi Sankyo announced positive Phase III results from the DESTINY-Breast09 trial evaluating trastuzumab deruxtecan as first-line treatment in metastatic HER2-positive breast cancer, demonstrating superior progression-free survival compared to trastuzumab plus pertuzumab plus taxane. Such strategies by key companies are expected to drive the HER2 Positive Breast Cancer Treatment industry growth in the forecast period
- As oncologists and patients become increasingly aware of the survival-extending potential of novel anti-HER2 therapies including ADCs, bispecific antibodies, and next-generation tyrosine kinase inhibitors, HER2-positive breast cancer treatments offer advanced clinical efficacy, manageable safety profiles, and demonstrated survival benefits across all treatment lines
- Furthermore, the growing availability of HER2 testing infrastructure, including standardized IHC and FISH testing protocols and emerging liquid biopsy-based HER2 assessment tools, is expanding the identification and treatment of HER2-positive breast cancer patients in both high-income and emerging market healthcare settings
- The expanding clinical indications for established anti-HER2 agents in early breast cancer neoadjuvant and adjuvant settings, combined with growing adoption of T-DXd in HER2-low disease, are substantially expanding the overall addressable market for HER2-directed therapies beyond traditional HER2-positive patient populations
Restraint/Challenge
“High Treatment Costs and Interstitial Lung Disease Risk with ADC Therapies”
- Concerns surrounding the high acquisition costs of novel anti-HER2 therapies, particularly next-generation ADCs with annual treatment costs exceeding USD 200,000 in the United States, combined with the clinically significant risk of ADC-associated interstitial lung disease (ILD) that requires active monitoring and management, pose significant challenges to both patient access and broad therapeutic adoption
- For Instance, the incidence of treatment-emergent ILD of any grade with trastuzumab deruxtecan ranges from approximately 10% to 15% across pivotal clinical trials, with fatal ILD cases reported in a small proportion of patients, necessitating careful patient selection, rigorous radiological monitoring protocols, and defined management algorithms that add clinical complexity and cost to ADC-based treatment programs
- Addressing these cost and safety challenges through health technology assessment submissions, value-based contracting with payers, and the development of standardized ILD monitoring and management protocols is crucial for ensuring appropriate patient access and building oncologist and patient confidence in ADC-based treatment programs. Companies such as AstraZeneca and Daiichi Sankyo have developed comprehensive T-DXd ILD management guidelines and have established dedicated medical education programs to support oncologists in safely managing ADC-related pulmonary toxicity
- In addition, the complex reimbursement landscape for novel anti-HER2 therapies across global markets, with significant variation in payer coverage policies, biosimilar substitution requirements, and national drug assessment timelines, creates substantial market access fragmentation that limits the commercial potential of novel HER2-directed therapies in certain geographic markets
- Overcoming these challenges through innovative access models, proactive safety communication programs, and the development of next-generation ADCs with improved therapeutic indices will be vital for sustained market growth
HER2 Positive Breast Cancer Treatment Market Scope
The market is segmented on the basis of treatment type, route of administration, end-users, and distribution channel.
• By Treatment Type
On the basis of treatment type, the HER2 Positive Breast Cancer Treatment market is segmented into Chemotherapy, Targeted Therapy, Immunotherapy, and Others. The Targeted Therapy segment dominated the largest market revenue share of 48.6% in 2025, driven by its high specificity toward HER2 protein overexpression and improved clinical outcomes compared to conventional chemotherapy. Increasing adoption of HER2 inhibitors such as trastuzumab and pertuzumab is significantly strengthening this segment. Rising prevalence of HER2-positive breast cancer globally is further supporting demand. Continuous advancements in monoclonal antibody development are improving treatment efficacy. Growing preference for precision medicine is accelerating adoption. Pharmaceutical companies are heavily investing in targeted therapy pipelines. Combination therapies involving targeted agents are enhancing survival rates. Regulatory approvals for new HER2-directed drugs are boosting market expansion. Higher treatment success rates with reduced systemic toxicity are supporting preference. Overall, targeted therapy remains the most advanced and widely adopted treatment approach.
The Immunotherapy segment is anticipated to witness the fastest growth rate of 12.4% from 2026 to 2033, driven by increasing clinical research into immune checkpoint inhibitors and combination treatment approaches. Immunotherapy is gaining traction due to its ability to enhance long-term immune response against cancer cells. Rising clinical trials evaluating HER2 and immunotherapy combinations are boosting adoption. Increasing focus on personalized oncology is supporting growth. Expanding pipeline of immune-oncology drugs is further strengthening the segment. Growing patient awareness of advanced treatment options is contributing to demand. Improved survival outcomes in late-stage cases are encouraging use. Pharmaceutical innovation in immune modulation is accelerating development. Rising healthcare expenditure in oncology is also supporting expansion. Overall, immunotherapy is emerging as a rapidly evolving segment in HER2-positive breast cancer care.
• By Route of Administration
On the basis of route of administration, the HER2 Positive Breast Cancer Treatment market is segmented into Oral, Parenteral, and Others. The Parenteral segment held the largest market revenue share of 61.3% in 2025, driven by the widespread use of intravenous monoclonal antibodies and injectable chemotherapy drugs in hospital settings. Parenteral administration ensures rapid drug delivery and high bioavailability. It remains the standard route for most HER2-targeted biologics. Increasing hospital-based cancer treatment procedures is supporting demand. Strong physician preference for controlled dosing enhances adoption. Rising use of infusion-based therapies is further strengthening growth. Advanced hospital infrastructure supports parenteral administration. Combination regimens heavily rely on injectable formulations. Improved clinical monitoring ensures treatment safety and effectiveness. Overall, parenteral route remains dominant in HER2 breast cancer therapy.
The Oral segment is expected to witness the fastest CAGR of 10.9% from 2026 to 2033, driven by growing demand for convenient, patient-friendly treatment options. Oral HER2 inhibitors are increasingly being developed to improve accessibility and compliance. Rising preference for home-based cancer care is supporting growth. Advancements in oral targeted therapy formulations are enhancing effectiveness. Expanding outpatient oncology treatment is boosting adoption. Growing elderly patient population is further increasing demand. Cost-effectiveness compared to injectable therapies supports usage. Improved drug absorption technologies are strengthening performance. Increasing shift toward self-administered therapies is accelerating expansion. Overall, oral administration is emerging as a high-growth segment.
• By End-Users
On the basis of end-users, the HER2 Positive Breast Cancer Treatment market is segmented into Hospitals, Homecare, Specialty Centres, and Others. The Hospitals segment accounted for the largest market revenue share of 55.7% in 2025, driven by the availability of advanced oncology infrastructure and multidisciplinary cancer care teams. Hospitals serve as the primary centers for diagnosis, infusion therapy, and long-term cancer management. High patient inflow for HER2-targeted treatments supports dominance. Availability of specialized oncology departments strengthens adoption. Strong reimbursement systems further enhance hospital utilization. Increasing cancer prevalence is boosting hospital admissions. Integration of diagnostics and therapeutics improves efficiency. Continuous technological upgrades in oncology units support growth. Access to advanced biologics is concentrated in hospital settings. Overall, hospitals remain the core treatment hub for HER2-positive breast cancer.
The Homecare segment is anticipated to witness the fastest growth rate of 13.1% from 2026 to 2033, driven by increasing adoption of oral therapies and patient-centric care models. Rising demand for home-based cancer management is supporting expansion. Advancements in remote patient monitoring technologies are improving safety. Growing elderly population is increasing need for homecare services. High treatment costs in hospitals are encouraging home-based alternatives. Improved caregiver support systems are boosting adoption. Expansion of oral targeted therapies is enabling home treatment. Government initiatives promoting home healthcare are supporting growth. Patient preference for comfort and convenience is increasing demand. Overall, homecare is emerging as a rapidly growing segment in oncology treatment delivery.
• By Distribution Channel
On the basis of distribution channel, the HER2 Positive Breast Cancer Treatment market is segmented into Hospital Pharmacy, Online Pharmacy, and Retail Pharmacy. The Hospital Pharmacy segment held the largest market revenue share of 50.8% in 2025, driven by direct integration with oncology treatment protocols and immediate availability of critical cancer drugs. Hospital pharmacies ensure controlled dispensing under medical supervision. Strong procurement systems support bulk drug availability. High dependency on hospital-based treatments strengthens dominance. Presence of oncology specialists enhances medication management. Increasing inpatient cancer therapies supports demand. Regulatory compliance ensures safe drug handling. Hospital pharmacies play a key role in biologics distribution. Rising hospital admissions further reinforce usage. Overall, hospital pharmacies remain the dominant distribution channel.
The Online Pharmacy segment is expected to witness the fastest CAGR of 14.6% from 2026 to 2033, driven by increasing digital healthcare adoption and rising demand for convenient drug access. Growing penetration of e-commerce in pharmaceuticals is supporting expansion. Home delivery of cancer medications is improving patient convenience. Increasing telemedicine adoption is driving online prescriptions. Cost transparency and competitive pricing are attracting patients. Expansion of regulatory frameworks for e-pharmacies is boosting growth. Rising preference for home-based care supports demand. Improved logistics and cold chain infrastructure ensure safe delivery. Subscription-based medication services are gaining popularity. Overall, online pharmacies are rapidly transforming pharmaceutical distribution in oncology.
HER2 Positive Breast Cancer Treatment Market Regional Analysis
- North America dominated the HER2 Positive Breast Cancer Treatment market with the largest revenue share of approximately 42.30% in 2025, driven by early adoption of novel anti-HER2 therapies, high healthcare expenditure, advanced oncology care infrastructure, and a strong presence of leading pharmaceutical and biotechnology companies. The region also benefits from well-established cancer diagnostic pathways and rapid clinical integration of targeted biologics, supporting faster uptake of innovative treatment regimens
- Patients and healthcare providers in the region increasingly rely on next-generation HER2-targeted therapies, including monoclonal antibodies, antibody-drug conjugates, and combination regimens, which have significantly improved survival outcomes in HER2-positive breast cancer. Strong clinical research activity and continuous drug approvals further strengthen treatment accessibility and innovation
- This widespread adoption is further supported by robust reimbursement systems, high awareness of early cancer detection, and expanding precision oncology programs, establishing North America as a leading hub for advanced HER2 Positive Breast Cancer Treatment solutions
U.S. HER2 Positive Breast Cancer Treatment Market Insight
The U.S. HER2 Positive Breast Cancer Treatment market captured the largest revenue share in 2025 within North America, driven by rapid advancements in targeted oncology therapies and strong uptake of precision medicine approaches. The country has witnessed significant growth in the use of HER2-directed treatments such as monoclonal antibodies, tyrosine kinase inhibitors, and antibody-drug conjugates across hospitals, cancer centers, and specialty clinics. Increasing biomarker-driven diagnosis, along with expanding clinical trial activity for next-generation HER2 therapies, is further accelerating innovation and treatment adoption. In addition, strong collaboration between pharmaceutical companies, academic research institutions, and healthcare providers continues to enhance access to advanced and personalized treatment options.
Europe HER2 Positive Breast Cancer Treatment Market Insight
The Europe HER2 Positive Breast Cancer Treatment market is projected to expand at a substantial CAGR throughout the forecast period, driven by rising breast cancer incidence, strong public healthcare systems, and increasing adoption of targeted oncology therapies. The region benefits from structured screening programs and growing emphasis on early-stage diagnosis and personalized treatment strategies. European healthcare systems are increasingly integrating HER2-targeted biologics and combination therapies into standard treatment protocols. Furthermore, supportive regulatory frameworks and rising participation in multinational clinical trials are improving access to innovative therapies across major markets.
U.K. HER2 Positive Breast Cancer Treatment Market Insight
The U.K. HER2 Positive Breast Cancer Treatment market is anticipated to grow at a noteworthy CAGR during the forecast period, supported by strong national cancer screening initiatives and increasing use of precision oncology approaches. Early diagnosis programs and improved access to advanced biologics are key drivers of market expansion. The country’s healthcare system continues to adopt HER2-targeted therapies across oncology centers, with growing use of antibody-drug conjugates and combination regimens. In addition, ongoing clinical research and treatment innovation are improving patient outcomes and supporting market growth.
Germany HER2 Positive Breast Cancer Treatment Market Insight
The Germany HER2 Positive Breast Cancer Treatment market is expected to expand at a considerable CAGR during the forecast period, fueled by a strong healthcare infrastructure, high awareness of breast cancer treatment options, and increasing use of advanced biologic therapies. The country places strong emphasis on evidence-based oncology care and precision medicine adoption. German healthcare providers are increasingly integrating HER2-targeted therapies into treatment pathways, supported by robust reimbursement frameworks and access to innovative drugs. Rising participation in clinical research programs further strengthens the country’s role in oncology innovation.
Asia-Pacific HER2 Positive Breast Cancer Treatment Market Insight
The Asia-Pacific HER2 Positive Breast Cancer Treatment market is poised to grow at the fastest CAGR during the forecast period, driven by increasing breast cancer incidence, expanding healthcare infrastructure, and improving access to HER2 diagnostic testing. Rising awareness of early detection and treatment is also contributing significantly to market growth across the region. Governments and healthcare systems are investing in oncology care expansion, while pharmaceutical companies are increasing their presence in emerging markets. Growing availability of targeted therapies and improved diagnostic capabilities are accelerating adoption across hospitals and cancer treatment centers.
Japan HER2 Positive Breast Cancer Treatment Market Insight
The Japan HER2 Positive Breast Cancer Treatment market is gaining momentum due to its advanced healthcare system, strong focus on early cancer detection, and high adoption of precision medicine approaches. The country’s aging population is further increasing demand for effective and targeted breast cancer therapies. Japan is witnessing growing use of HER2-targeted biologics and combination therapies in clinical practice, supported by strong oncology research and well-established treatment guidelines. Continuous innovation in drug development and diagnostics is further enhancing treatment outcomes.
China HER2 Positive Breast Cancer Treatment Market Insight
The China HER2 Positive Breast Cancer Treatment market accounted for the largest market revenue share in Asia Pacific in 2025, driven by a rapidly increasing patient population, expanding healthcare infrastructure, and rising awareness of breast cancer screening and diagnosis. Improvements in access to HER2 testing are enabling earlier and more accurate treatment decisions. China is also experiencing strong growth in the adoption of targeted oncology therapies, supported by increasing domestic pharmaceutical innovation and growing clinical research activity. Expansion of oncology care networks and improved availability of advanced biologics are further strengthening market development.
HER2 Positive Breast Cancer Treatment Market Share
The HER2 Positive Breast Cancer Treatment industry is primarily led by well-established companies, including:
• Roche (Switzerland)
• Novartis (Switzerland)
• Pfizer (U.S.)
• AstraZeneca (U.K.)
• Merck & Co. (U.S.)
• Bristol Myers Squibb (U.S.)
• Eli Lilly and Company (U.S.)
• Amgen (U.S.)
• Sanofi (France)
• Daiichi Sankyo (Japan)
• Takeda Pharmaceutical (Japan)
• Johnson & Johnson (U.S.)
• Genentech (U.S.)
• AbbVie (U.S.)
• Gilead Sciences (U.S.)
• Seagen (U.S.)
• Eisai (Japan)
• Teva Pharmaceutical Industries (Israel)
Latest Developments in Global HER2 Positive Breast Cancer Treatment Market
- In January 2025, AstraZeneca and Daiichi Sankyo announced pivotal Phase III results from the DESTINY-Breast09 trial demonstrating superior progression-free survival for trastuzumab deruxtecan versus trastuzumab plus pertuzumab plus taxane in first-line HER2-positive metastatic breast cancer, a potentially practice-changing finding that could establish T-DXd as the new first-line standard of care
- In November 2024, Roche received FDA supplemental approval for the subcutaneous formulation of Phesgo (pertuzumab and trastuzumab) for early HER2-positive breast cancer adjuvant treatment, reducing administration time from approximately 60-90 minutes for IV infusion to under 8 minutes for subcutaneous injection, substantially improving patient convenience and clinical workflow efficiency
- In September 2024, Zymeworks presented positive Phase II results for zanidatamab, its bispecific antibody targeting two distinct HER2 epitopes, in previously treated HER2-amplified gastroesophageal adenocarcinoma and breast cancer, demonstrating promising response rates and a differentiated mechanism of action that may complement existing HER2-directed treatment strategies
- In June 2024, Pfizer announced the initiation of a pivotal Phase III trial evaluating disitamab vedotin (RC48-ADC), a novel HER2-directed ADC licensed from RemeGen, in combination with pembrolizumab for HER2-positive metastatic breast cancer, expanding the HER2-directed ADC combination therapy landscape
- In April 2024, Merus announced promising Phase II data for zenocutuzumab, a bispecific antibody blocking NRG1-mediated HER2/HER3 signaling, in NRG1 fusion-positive breast cancer, establishing a new molecularly targeted treatment strategy for this rare but clinically significant breast cancer molecular subtype
SKU-

- Interactive Data Analysis Dashboard
- Company Analysis Dashboard for high growth potential opportunities
- Research Analyst Access for customization & queries
- Competitor Analysis with Interactive dashboard
- Latest News, Updates & Trend analysis
- Harness the Power of Benchmark Analysis for Comprehensive Competitor Tracking
Data collection and base year analysis are done using data collection modules with large sample sizes. The stage includes obtaining market information or related data through various sources and strategies. It includes examining and planning all the data acquired from the past in advance. It likewise envelops the examination of information inconsistencies seen across different information sources. The market data is analysed and estimated using market statistical and coherent models. Also, market share analysis and key trend analysis are the major success factors in the market report. To know more, please request an analyst call or drop down your inquiry.
The key research methodology used by DBMR research team is data triangulation which involves data mining, analysis of the impact of data variables on the market and primary (industry expert) validation. Data models include Vendor Positioning Grid, Market Time Line Analysis, Market Overview and Guide, Company Positioning Grid, Patent Analysis, Pricing Analysis, Company Market Share Analysis, Standards of Measurement, Global versus Regional and Vendor Share Analysis. To know more about the research methodology, drop in an inquiry to speak to our industry experts.
Data Bridge Market Research is a leader in advanced formative research. We take pride in servicing our existing and new customers with data and analysis that match and suits their goal. The report can be customized to include price trend analysis of target brands understanding the market for additional countries (ask for the list of countries), clinical trial results data, literature review, refurbished market and product base analysis. Market analysis of target competitors can be analyzed from technology-based analysis to market portfolio strategies. We can add as many competitors that you require data about in the format and data style you are looking for. Our team of analysts can also provide you data in crude raw excel files pivot tables (Fact book) or can assist you in creating presentations from the data sets available in the report.


