
 Market Analysis and Insights : Global Nitrogenous Fertilizer Market
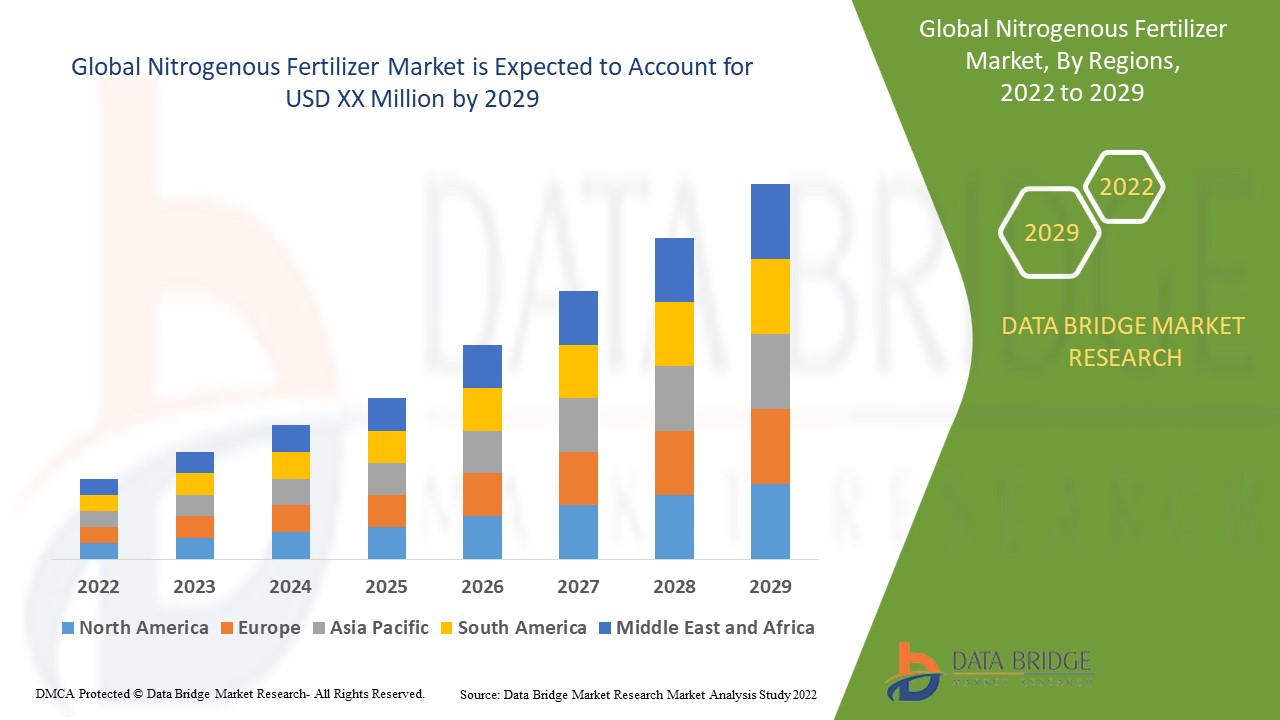
Data Bridge Market Research analyses that the nitrogenous fertilizer market will project a compound annual growth rate (CAGR) of 5.3% during the forecast period of 2022-2029.
Nitrogen fertilizer is one of the most prevalent types of fertilizer, manufactured from nitrogen (N) compounds and used as an addition in the farming sector to boost crop yield. They're commonly employed in soil, fertigation, foliar, and other applications.
The rising farmer knowledge of soil profile and nutritional balance, expanding popularity of commercial agriculture around the world coupled with low cost production of fertilizers and rising demand for agrochemicals are some of the reasons that are expected to boost the nitrogenous fertilizer market. Furthermore, upsurge in the need to increase productivity and to level yield and fertilizer intensity gaps across the nations will cushion the market’s growth rate.
Moreover, growing usage of nitrogenous fertilizer in agricultural land will further create lucrative and remunerative growth opportunities for the nitrogenous fertilizer market.
However, fluctuating prices of raw materials and health risks involved with nitrogen fertilizers will derail the nitrogenous fertilizer market growth rate. Also, growing consumption of organic food will pose a major challenge to the growth of the market.
This nitrogenous fertilizer market report provides details of new recent developments, trade regulations, import export analysis, production analysis, value chain optimization, market share, impact of domestic and localised market players, analyses opportunities in terms of emerging revenue pockets, changes in market regulations, strategic market growth analysis, market size, category market growths, application niches and dominance, product approvals, product launches, geographic expansions, technological innovations in the market. To gain more info on nitrogenous fertilizer market contact Data Bridge Market Research for an Analyst Brief, our team will help you take an informed market decision to achieve market growth.
Global Nitrogenous Fertilizer Market Scope and Market Size
The nitrogenous fertilizer market is segmented on the basis of product type, form, crop type and application. The growth among segments helps you analyse niche pockets of growth and strategies to approach the market and determine your core application areas and the difference in your target markets.
- On the basis of product type, the nitrogenous fertilizer market is segmented into urea, ammonium nitrate, ammonium sulphate, calcium ammonium nitrate (CAN) and others.
- On the basis of form, the nitrogenous fertilizer market is segmented into dry, liquid, and others.
- On the basis of crop type, the nitrogenous fertilizer market is segmented into cereals and grains, oilseeds and pulses, fruits and vegetables and others.
- On the basis of application, the nitrogenous fertilizer market is segmented into soil, foliar, fertigation and others.
Nitrogenous Fertilizer Market Country Level Analysis
The global nitrogenous fertilizer market is analyses and market size, volume information is provided by country, product type, form, crop type and application as referenced above.
The countries covered in the nitrogenous fertilizer market report are U.S., Canada, Mexico in North America, Germany, Poland, Ireland, Italy, U.K., France, Spain, Netherlands, Belgium, Switzerland, Turkey, Russia, Rest of Europe in Europe, Japan, China, India, South Korea, New Zealand, Vietnam, Australia, Singapore, Malaysia, Thailand, Indonesia, Philippines, Rest of Asia-Pacific (APAC) in Asia-Pacific (APAC), Brazil, Argentina, Chile, Rest of South America as a part of South America, UAE, Saudi Arabia, Egypt, Kuwait, South Africa, Rest of Middle East and Africa(MEA) as a part of Middle East and Africa(MEA).
Asia-Pacific dominates the nitrogenous fertilizer market and will continue to flourish its trend of dominance during the forecast period owing to the greater emphasis on fertilizer use, rising food demand and growing population in this region. South America is expected to score the highest CAGR because farmers in the region are becoming more aware of the benefits of various types of nitrogen fertilizers.
The country section of the nitrogenous fertilizer market report also provides individual market impacting factors and changes in regulation in the market domestically that impacts the current and future trends of the market. Data points such as consumption volumes, production sites and volumes, import export analysis, price trend analysis, cost of raw materials, down-stream and upstream value chain analysis are some of the major pointers used to forecast the market scenario for individual countries. Also, presence and availability of global brands and their challenges faced due to large or scarce competition from local and domestic brands, impact of domestic tariffs and trade routes are considered while providing forecast analysis of the country data.
Competitive Landscape and Global Nitrogenous Fertilizer Market Share Analysis
The nitrogenous fertilizer market competitive landscape provides details by competitor. Details included are company overview, company financials, revenue generated, market potential, investment in research and development, new market initiatives, global presence, production sites and facilities, production capacities, company strengths and weaknesses, product launch, product width and breadth, application dominance. The above data points provided are only related to the companies’ focus related to nitrogenous fertilizer market.
Some of the major players operating in the nitrogenous fertilizer market are Nutrien Ltd., Bunge Limited, Yara, Nutrien Ltd, PJSC Togliattiazot, Coromandel International Limited, EuroChem Group, CF Industries Holdings, Inc., Sinofert, CVR Partners LP, Koch Industries and Potash Corp. of Saskatchewan Inc., among others.
SKU-

- Interactive Data Analysis Dashboard
- Company Analysis Dashboard for high growth potential opportunities
- Research Analyst Access for customization & queries
- Competitor Analysis with Interactive dashboard
- Latest News, Updates & Trend analysis
- Harness the Power of Benchmark Analysis for Comprehensive Competitor Tracking
Table of Content
1 INTRODUCTION
1.1 OBJECTIVES OF THE STUDY
1.2 MARKET DEFINITION
1.3 OVERVIEW OF GLOBAL NITROGENOUS FERTILIZER MARKET
1.4 CURRENCY AND PRICING
1.5 LIMITATION
1.6 MARKETS COVERED
2 MARKET SEGMENTATION
2.1 KEY TAKEAWAYS
2.2 ARRIVING AT THE GLOBAL NITROGENOUS FERTILIZER MARKET SIZE
2.2.1 VENDOR POSITIONING GRID
2.2.2 TECHNOLOGY LIFE LINE CURVE
2.2.3 MARKET GUIDE
2.2.4 COMPANY POSITIONING GRID
2.2.5 COMAPANY MARKET SHARE ANALYSIS
2.2.6 MULTIVARIATE MODELLING
2.2.7 DEMAND AND SUPPLY-SIDE VARIABLES
2.2.8 CONSUMPTION TREND OF END PRODUCTS
2.2.9 TOP TO BOTTOM ANALYSIS
2.2.10 STANDARDS OF MEASUREMENT
2.2.11 VENDOR SHARE ANALYSIS
2.2.12 DATA POINTS FROM KEY PRIMARY INTERVIEWS
2.2.13 DATA POINTS FROM KEY SECONDARY DATABASES
2.3 GLOBAL NITROGENOUS FERTILIZER MARKET: RESEARCH SNAPSHOT
2.4 ASSUMPTIONS
3 MARKET OVERVIEW
3.1 DRIVERS
3.2 RESTRAINTS
3.3 OPPORTUNITIES
3.4 CHALLENGES
4 EXECUTIVE SUMMARY
5 PREMIUM INSIGHTS
5.1 VALUE CHAIN ANALYSIS
5.2 SUPPLY CHAIN ANALYSIS
5.3 IMPORT-EXPORT ANALYSIS
5.4 PORTER’S FIVE FORCES ANALYSIS
5.4.1 BARGAINING POWER OF SUPPLIERS
5.4.2 BARGAINING POWER OF BUYERS/CONSUMERS
5.4.3 THREAT OF NEW ENTRANTS
5.4.4 THREAT OF SUBSTITUTE PRODUCTS
5.4.5 INTENSITY OF COMPETITIVE RIVALRY
5.5 RAW MATERIAL SOURCING ANALYSIS
5.6 OVERVIEW OF TECHNOLOGICAL INNOVATIONS
5.7 INDUSTRY TRENDS AND FUTURE PERSPECTIVE
5.8 GROWTH STRATEGIES ADOPTED BY KEY MARKET PLAYERS
5.9 FACTORS INFLUENCING PURCHASING DECISION OF END-USERS
6 IMPACT OF ECONOMIC SLOW DOWN ON MARKET
6.1 IMPACT ON PRICE
6.2 IMPACT ON SUPPLY CHAIN
6.3 IMPACT ON SHIPMENT
6.4 IMPACT ON COMPANY’S STRATEGIC DECISIONS
7 REGULATORY FRAMEWORK AND GUIDELINES
8 PRICING INDEX (PRICE AT B2B END & PRICES AT FOB)
9 PRODUCTION CAPACITY OF KEY MANUFACTURERES
10 BRND OUTLOOK
10.1 COMPARATIVE BRAND ANALYSIS
10.2 PRODUCT VS BRAND OVERVIEW
11 GLOBAL NITROGENOUS FERTILIZER MARKET, BY TYPE (VALUE AND VOLUME)
11.1 OVERVIEW
11.2 UREA
11.3 AMMONIA
11.4 AMMONIUM NITRATE
11.5 AMMONIUM SULFATE
11.6 CALCIUM AMMONIUM NITRATE (CAN)
11.7 UREA-AMMONIUM NITRATE (UAN)
11.8 OTHERS
12 GLOBAL NITROGENOUS FERTILIZER MARKET, BY CROP TYPE
12.1 OVERVIEW
12.2 OIL SEEDS
12.2.1 OIL SEEDS, BY TYPE
12.2.1.1. SOYBEAN
12.2.1.2. SUNFLOWER
12.2.1.3. CORN
12.2.1.4. PEANUT
12.2.1.5. COTTONSEED
12.2.1.6. FLAXSEED
12.2.1.7. OTHERS
12.2.2 OIL SEEDS, BY NITROGENOUS FERTILIZER TYPE
12.2.2.1. UREA
12.2.2.2. AMMONIA
12.2.2.3. AMMONIUM NITRATE
12.2.2.4. AMMONIUM SULFATE
12.2.2.5. CALCIUM AMMONIUM NITRATE (CAN)
12.2.2.6. UREA-AMMONIUM NITRATE (UAN)
12.2.2.7. ORHERS
12.3 PULSES
12.3.1 PULSES, BY TYPE
12.3.1.1. BLACK BEANS
12.3.1.2. PEAS
12.3.1.3. CHICKPEAS
12.3.1.4. OTHERS
12.3.2 PULSES, BY NITROGENOUS FERTILIZER TYPE
12.3.2.1. UREA
12.3.2.2. AMMONIA
12.3.2.3. AMMONIUM NITRATE
12.3.2.4. AMMONIUM SULFATE
12.3.2.5. CALCIUM AMMONIUM NITRATE (CAN)
12.3.2.6. UREA-AMMONIUM NITRATE (UAN)
12.3.2.7. ORHERS
12.4 CEREALS & GRAINS
12.4.1 CERELAS & GRAINS, BY TYPE
12.4.1.1. RICE
12.4.1.2. WHEAT
12.4.1.3. BARLEY
12.4.1.4. MILLET
12.4.1.5. OAT
12.4.1.6. SORGHUM
12.4.1.7. RYE
12.4.1.8. OTHERS
12.4.2 OCEREALS & GRAINS, BY NITROGENOUS FERTILIZER TYPE
12.4.2.1. UREA
12.4.2.2. AMMONIA
12.4.2.3. AMMONIUM NITRATE
12.4.2.4. AMMONIUM SULFATE
12.4.2.5. CALCIUM AMMONIUM NITRATE (CAN)
12.4.2.6. UREA-AMMONIUM NITRATE (UAN)
12.4.2.7. ORHERS
12.5 FRUITS
12.5.1 FRUITS, BY TYPE
12.5.1.1. APPLE & PEARS
12.5.1.2. CITRUS FRUITS
12.5.1.3. TROPICAL FRUITS
12.5.1.4. BERRIES
12.5.1.5. MELONS
12.5.1.6. OTHERS
12.5.2 FRUITS, BY NITROGENOUS FERTILIZER TYPE
12.5.2.1. UREA
12.5.2.2. AMMONIA
12.5.2.3. AMMONIUM NITRATE
12.5.2.4. AMMONIUM SULFATE
12.5.2.5. CALCIUM AMMONIUM NITRATE (CAN)
12.5.2.6. UREA-AMMONIUM NITRATE (UAN)
12.5.2.7. ORHERS
12.6 VEGETABLES
12.6.1 .VEGETABLES, BY TYPE
12.6.1.1. LEAFY GREENS
12.6.1.2. CRUCIFEROUS VEGETABLES
12.6.1.3. MARROW VEGATBALES
12.6.1.4. ROOT VEGETABLES
12.6.1.5. ONION
12.6.1.6. GRALIC
12.6.1.7. OTHERS
12.6.2 VEGETABLES, BY NITROGENOUS FERTILIZER TYPE
12.6.2.1. UREA
12.6.2.2. AMMONIA
12.6.2.3. AMMONIUM NITRATE
12.6.2.4. AMMONIUM SULFATE
12.6.2.5. CALCIUM AMMONIUM NITRATE (CAN)
12.6.2.6. UREA-AMMONIUM NITRATE (UAN)
12.6.2.7. ORHERS
12.7 HORTICULTURE
12.7.1 HORTICULTURE, BY NITROGENOUS FERTILIZER TYPE
12.7.1.1. PROLINE
12.7.1.2. HYDROXYPROLINE
12.7.1.3. GLUTAMINE
12.7.1.4. GLUTAMIC ACID
12.7.1.5. HISTIDINE
12.7.1.6. LYSINE
12.7.1.7. CYSTEINE
12.7.1.8. ALANINE
12.7.1.9. ARGININE
12.7.1.10. TRYPTOPHAN
12.7.1.11. VALINE
12.7.1.12. PHENYLALANINE
12.7.1.13. METHIONIN
12.7.1.14. ASPARAGINE
12.7.1.15. OTHERS
12.8 TURN & ORNAMENTS
12.8.1 TURF & ORNAMENTS, BY NITROGENOUS FERTILIZER TYPE
12.8.1.1. UREA
12.8.1.2. AMMONIA
12.8.1.3. AMMONIUM NITRATE
12.8.1.4. AMMONIUM SULFATE
12.8.1.5. CALCIUM AMMONIUM NITRATE (CAN)
12.8.1.6. UREA-AMMONIUM NITRATE (UAN)
12.8.1.7. OTHERS
13 GLOBAL NITROGENOUS FERTILIZER MARKET, BY FORM
13.1 OVERVIEW
13.2 DRY
13.3 LIQUID
14 GLOBAL NITROGENOUS FERTILIZER MARKET, BY SOLUBILITY
14.1 OVERVIEW
14.2 WATER SOLUBLE
14.3 INSOULBLE
15 GLOBAL NITROGENOUS FERTILIZER MARKET, BY DISTRIBUTION CHANNEL
15.1 OVERVIEW
15.2 DIRECT
15.3 INDIRECT
15.3.1 INSTITUTIONAL
15.3.1.1. COOPERATIVE SOCITIES
15.3.1.2. AGRI-CORPORATION
15.3.1.3. STATE FEDERATION
15.3.2 DEALERS
16 GLOBAL NITROGENOUS FERTILIZER MARKET, COMPANY LANDSCAPE
16.1 COMPANY SHARE ANALYSIS: GLOBAL
16.2 COMPANY SHARE ANALYSIS: NORTH AMERICA
16.3 COMPANY SHARE ANALYSIS: EUROPE
16.4 COMPANY SHARE ANALYSIS: ASIA-PACIFIC
16.5 MERGERS & ACQUISITIONS
16.6 NEW PRODUCT DEVELOPMENT & APPROVALS
16.7 EXPANSIONS & PARTNERSHIP
16.8 REGULATORY CHANGES
17 GLOBAL NITROGENOUS FERTILIZER MARKET, BY GEOGRAPHY
OVERVIEW (ALL SEGMENTATION PROVIDED ABOVE IS REPRESNTED IN THIS CHAPTER BY COUNTRY)
17.1 NORTH AMERICA
17.1.1 U.S.
17.1.2 CANADA
17.1.3 MEXICO
17.2 EUROPE
17.2.1 GERMANY
17.2.2 U.K.
17.2.3 ITALY
17.2.4 FRANCE
17.2.5 SPAIN
17.2.6 SWITZERLAND
17.2.7 NETHERLANDS
17.2.8 BELGIUM
17.2.9 RUSSIA
17.2.10 TURKEY
17.2.11 REST OF EUROPE
17.3 ASIA-PACIFIC
17.3.1 JAPAN
17.3.2 CHINA
17.3.3 SOUTH KOREA
17.3.4 INDIA
17.3.5 AUSTRALIA
17.3.6 SINGAPORE
17.3.7 THAILAND
17.3.8 INDONESIA
17.3.9 MALAYSIA
17.3.10 PHILIPPINES
17.3.11 REST OF ASIA-PACIFIC
17.4 SOUTH AMERICA
17.4.1 BRAZIL
17.4.2 ARGENTINA
17.4.3 REST OF SOUTH AMERICA
17.5 MIDDLE EAST AND AFRICA
17.5.1 SOUTH AFRICA
17.5.2 UAE
17.5.3 SAUDI ARABIA
17.5.4 KUWAIT
17.5.5 REST OF MIDDLE EAST AND AFRICA
18 GLOBAL NITROGENOUS FERTILIZER MARKET, SWOT & DBMR ANALYSIS
19 GLOBAL NITROGENOUS FERTILIZER MARKET, COMPANY PROFILE
19.1 NUTRIEN LTD
19.1.1 COMPANY OVERVIEW
19.1.2 REVENUE ANALYSIS
19.1.3 GEOGRAPHICAL PRESENCE
19.1.4 PRODUCT PORTFOLIO
19.1.5 RECENT DEVELOPMENTS
19.2 BUNGE LIMITED
19.2.1 COMPANY OVERVIEW
19.2.2 REVENUE ANALYSIS
19.2.3 GEOGRAPHICAL PRESENCE
19.2.4 PRODUCT PORTFOLIO
19.2.5 RECENT DEVELOPMENTS
19.3 YARA
19.3.1 COMPANY OVERVIEW
19.3.2 REVENUE ANALYSIS
19.3.3 GEOGRAPHICAL PRESENCE
19.3.4 PRODUCT PORTFOLIO
19.3.5 RECENT DEVELOPMENTS
19.4 PJSC TOGLIATTIAZOT
19.4.1 COMPANY OVERVIEW
19.4.2 REVENUE ANALYSIS
19.4.3 GEOGRAPHICAL PRESENCE
19.4.4 PRODUCT PORTFOLIO
19.4.5 RECENT DEVELOPMENTS
19.5 COROMANDEL INTERNATIONAL LIMITED
19.5.1 COMPANY OVERVIEW
19.5.2 REVENUE ANALYSIS
19.5.3 GEOGRAPHICAL PRESENCE
19.5.4 PRODUCT PORTFOLIO
19.5.5 RECENT DEVELOPMENTS
19.6 EUROCHEM GROUP
19.6.1 COMPANY OVERVIEW
19.6.2 REVENUE ANALYSIS
19.6.3 GEOGRAPHICAL PRESENCE
19.6.4 PRODUCT PORTFOLIO
19.6.5 RECENT DEVELOPMENTS
19.7 CF INDUSTRIES HOLDINGS, INC.
19.7.1 COMPANY OVERVIEW
19.7.2 REVENUE ANALYSIS
19.7.3 GEOGRAPHICAL PRESENCE
19.7.4 PRODUCT PORTFOLIO
19.7.5 RECENT DEVELOPMENTS
19.8 SINOFERT
19.8.1 COMPANY OVERVIEW
19.8.2 REVENUE ANALYSIS
19.8.3 GEOGRAPHICAL PRESENCE
19.8.4 PRODUCT PORTFOLIO
19.8.5 RECENT DEVELOPMENTS
19.9 KOCH INDUSTRIES
19.9.1 COMPANY OVERVIEW
19.9.2 REVENUE ANALYSIS
19.9.3 GEOGRAPHICAL PRESENCE
19.9.4 PRODUCT PORTFOLIO
19.9.5 RECENT DEVELOPMENTS
19.1 SKW STICKSTOFFWERKE PIESTERITZ GMBH
19.10.1 COMPANY OVERVIEW
19.10.2 REVENUE ANALYSIS
19.10.3 GEOGRAPHICAL PRESENCE
19.10.4 PRODUCT PORTFOLIO
19.10.5 RECENT DEVELOPMENTS
19.11 OSTCHEM
19.11.1 COMPANY OVERVIEW
19.11.2 REVENUE ANALYSIS
19.11.3 GEOGRAPHICAL PRESENCE
19.11.4 PRODUCT PORTFOLIO
19.11.5 RECENT DEVELOPMENTS
19.12 OCI
19.12.1 COMPANY OVERVIEW
19.12.2 REVENUE ANALYSIS
19.12.3 GEOGRAPHICAL PRESENCE
19.12.4 PRODUCT PORTFOLIO
19.12.5 RECENT DEVELOPMENTS
19.13 ARGUS BRAZIL
19.13.1 COMPANY OVERVIEW
19.13.2 REVENUE ANALYSIS
19.13.3 GEOGRAPHIC PRESENCE
19.13.4 PRODUCT PORTFOLIO
19.13.5 RECENT DEVELOPMENTS
19.14 BOREALIS
19.14.1 COMPANY OVERVIEW
19.14.2 REVENUE ANALYSIS
19.14.3 GEOGRAPHIC PRESENCE
19.14.4 PRODUCT PORTFOLIO
19.14.5 RECENT DEVELOPMENTS
19.15 URALCHEM
19.15.1 COMPANY OVERVIEW
19.15.2 REVENUE ANALYSIS
19.15.3 GEOGRAPHIC PRESENCE
19.15.4 PRODUCT PORTFOLIO
19.15.5 RECENT DEVELOPMENTS
Note: THE COMPANIES PROFILED IS NOT EXHAUSTIVE LIST AND IS AS PER OUR PREVIOUS CLIENT REQUIREMENT. WE PROFILE MORE THAN 100 COMPANIES IN OUR STUDY AND HENCE THE LIST OF COMPANIES CAN BE MODIFIED OR REPLACED ON REQUEST
20 RELATED REPORTS
21 QUESTIONNAIRE
22 ABOUT DATA BRIDGE MARKET RESEARCH
Data collection and base year analysis are done using data collection modules with large sample sizes. The stage includes obtaining market information or related data through various sources and strategies. It includes examining and planning all the data acquired from the past in advance. It likewise envelops the examination of information inconsistencies seen across different information sources. The market data is analysed and estimated using market statistical and coherent models. Also, market share analysis and key trend analysis are the major success factors in the market report. To know more, please request an analyst call or drop down your inquiry.
The key research methodology used by DBMR research team is data triangulation which involves data mining, analysis of the impact of data variables on the market and primary (industry expert) validation. Data models include Vendor Positioning Grid, Market Time Line Analysis, Market Overview and Guide, Company Positioning Grid, Patent Analysis, Pricing Analysis, Company Market Share Analysis, Standards of Measurement, Global versus Regional and Vendor Share Analysis. To know more about the research methodology, drop in an inquiry to speak to our industry experts.
Data Bridge Market Research is a leader in advanced formative research. We take pride in servicing our existing and new customers with data and analysis that match and suits their goal. The report can be customized to include price trend analysis of target brands understanding the market for additional countries (ask for the list of countries), clinical trial results data, literature review, refurbished market and product base analysis. Market analysis of target competitors can be analyzed from technology-based analysis to market portfolio strategies. We can add as many competitors that you require data about in the format and data style you are looking for. Our team of analysts can also provide you data in crude raw excel files pivot tables (Fact book) or can assist you in creating presentations from the data sets available in the report.


