
Global Non Gmo Food Market
Market Size in USD Billion
 USD
2.77 Billion
USD
8.77 Billion
2021
2029
USD
2.77 Billion
USD
8.77 Billion
2021
2029
| 2022 - 2029 | |
| USD 2.77 Billion | |
| USD 8.77 Billion | |
| % | |
|
Non GMO-Food Market Analysis and Size
Consumer awareness of the importance of clean label food ingredients is driving demand for non-GMO ingredients. Consumers are becoming more interested in learning about the key ingredients found in processed foods.
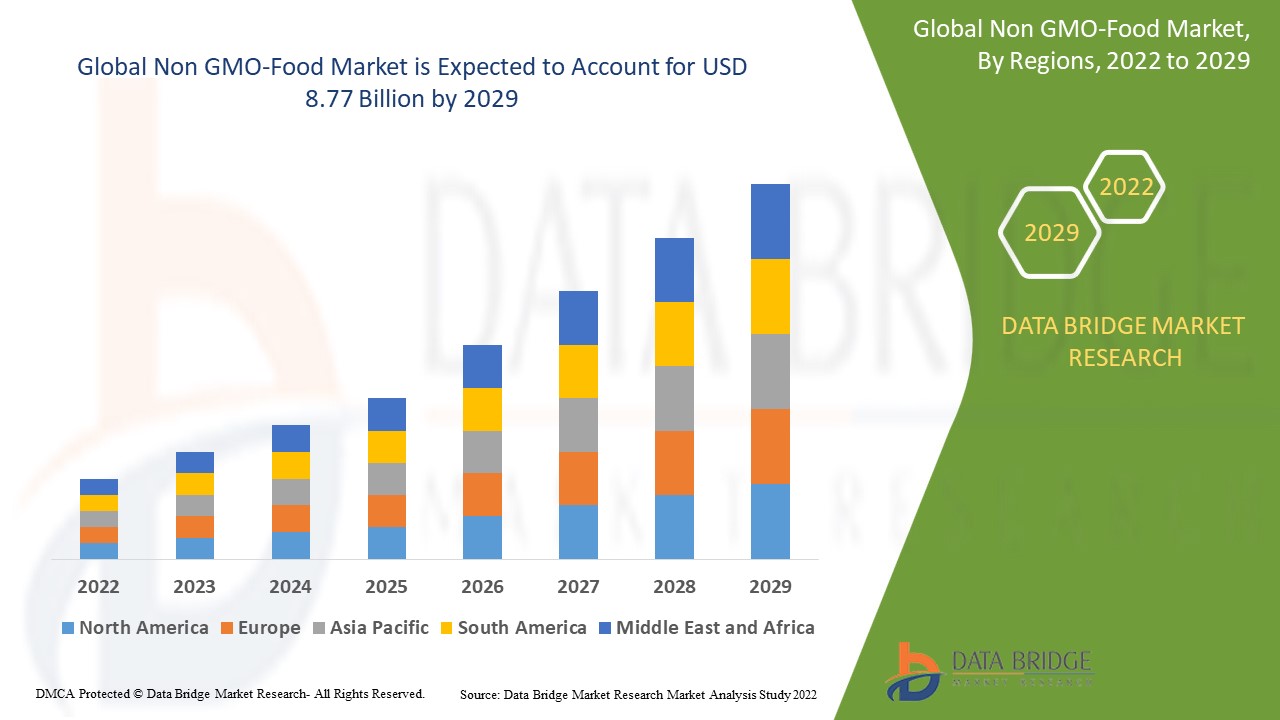
Data Bridge Market Research analyses that the non-GMO food market was valued at USD 2.77 billion in 2021 and is expected to reach the value of USD 8.77 billion by 2029, at a CAGR of 15.50% during the forecast period. In addition to the insights on market scenarios such as market value, growth rate, segmentation, geographical coverage, and major players, the market reports curated by the Data Bridge Market Research also include in-depth expert analysis, geographically represented company-wise production and capacity, network layouts of distributors and partners, detailed and updated price trend analysis and deficit analysis of supply chain and demand.
Non GMO-Food Market Scope and Segmentation
|
Report Metric |
Details |
|
Forecast Period |
2022 to 2029 |
|
Base Year |
2021 |
|
Historic Years |
2020 (Customizable to 2014 - 2019) |
|
Quantitative Units |
Revenue in USD Million, Volumes in Units, Pricing in USD |
|
Segments Covered |
Application (Beverages, Meat Products, Fruits and Vegetables, Dairy Alternatives, Animal Feed and Others), Distribution Channel (Hypermarkets and Supermarkets, Food Specialist Retailers, Convenience Store and Online), Type (Cereals and Grains, Liquor, Meat and Poultry, Edible Oil and Bakery), |
|
Countries Covered |
U.S., Canada and Mexico in North America, Germany, Sweden, Poland, Denmark, France, U.K., Netherlands, Switzerland, Belgium, Russia, Italy, Spain, Turkey, Rest of Europe in Europe, China, Japan, India, South Korea, Singapore, Malaysia, Australia, Thailand, Indonesia, Philippines, Rest of Asia-Pacific (APAC) in the Asia-Pacific (APAC), Saudi Arabia, U.A.E, South Africa, Egypt, Israel, Rest of Middle East and Africa (MEA) as a part of Middle East and Africa (MEA), Brazil, Argentina and Rest of South America as part of South America |
|
Market Players Covered |
Amy’s Kitchen Inc (U.S.), Hain Celestial (U.S.), Nature’s Path Foods (Canada), Organic Valley (U.S.), Chiquita Brands International Inc (U.S.), United Natural Foods, Inc (U.S.), Specialty Food Associations, Inc (U.S.), Blue Diamond Growers (U.S.), Cargill, Incorporated (U.S.), Clif Bar & Company (U.S.), NOW Foods (U.S.), Pernod Ricard (France) |
|
Opportunities |
|
Market Definition
GMOs are living organisms, typically plants or microorganisms, whose genetic material has been artificially altered in a laboratory using genetic modification or engineering techniques. GMO plants are widely used in agriculture because they produce a high yield, have improved resistance to weeds and diseases, and require fewer pesticides.
Non GMO-Food Market Dynamics
Drivers
- Positive nutrition profile and growing environmental concerns
Non-GMO foods are regarded as eco-friendly and natural, and as a result, consumers, particularly vegans and vegetarians, have a favourable perception of their nutritional profile and environmental impact. This has resulted in an increase in demand for non-GMO food products such as grains, vegetables, and fruits. In addition, many companies are using non-GMO ingredients in the production of baby or infant food.
- Awareness campaigns against the negative effects of GMO ingredients in various food products
Numerous organisations, including the Non-GMO Project, GMO Inside, and the Organic Consumers Association, have launched campaigns to raise awareness about the presence of GMO ingredients in various food products around the world. Many leading brands have responded to such campaigns by diversifying their market operations by offering a diverse non-GMO ingredient portfolio. To meet the growing consumer demand for non-GMO products, Cargill Incorporated, an American privately held corporation, has introduced a wide range of ingredients ranging from sweeteners, starches, and texturizers to oils, cocoa, and chocolate.
Opportunities
GMO food product consumption has been linked to diseases such as gastrointestinal disorders, organ damage, cancer, and infertility, with rising public awareness about the dangers of GMO consumption expected to be a major driver of the market's growth. Natural, organic, and healthy non-GMO cereals will drive growth in the non-GMO food market during the forecast period.
Restraints
Inserting genes into the DNA of a food plant is a random process, and scientists have no idea where the genes end up. This can disrupt the functionality of other genes, create novel proteins that are never found in the food supply, and cause toxin and allergy problems in the foods. Premium pricing of non-GMO food products is one of the major issues that will act as a restraint and further challenge the growth of the non-GMO food market during the forecast period.
This non-GMO food market report provides details of new recent developments, trade regulations, import-export analysis, production analysis, value chain optimization, market share, impact of domestic and localized market players, analyses opportunities in terms of emerging revenue pockets, changes in market regulations, strategic market growth analysis, market size, category market growths, application niches and dominance, product approvals, product launches, geographic expansions, technological innovations in the market. To gain more info on the non-GMO food market contact Data Bridge Market Research for an Analyst Brief, our team will help you take an informed market decision to achieve market growth.
Impact and Current Market Scenario of Raw Material Shortage and Shipping Delays
Data Bridge Market Research offers a high-level analysis of the market and delivers information by keeping in account the impact and current market environment of raw material shortage and shipping delays. This translates into assessing strategic possibilities, creating effective action plans, and assisting businesses in making important decisions.
Apart from the standard report, we also offer in-depth analysis of the procurement level from forecasted shipping delays, distributor mapping by region, commodity analysis, production analysis, price mapping trends, sourcing, category performance analysis, supply chain risk management solutions, advanced benchmarking, and other services for procurement and strategic support.
COVID-19 Impact on Non GMO-Food Market
The recent outbreak of coronavirus has critically impacted the non GMO food market. Almost every sector has been grievously hit by the pandemic and affected the day-to-day work-related functions. As a result, the food and beverage industry had to bear financial losses, therefore negatively impacting the non GMO food market. On the brighter side, the manufacturers are focusing on developing better products, keeping in mind the new market trends to fulfil consumer requirements in the post-pandemic phase. New technological advancements will further help to excel the availability of non GMO food in the developing and emerging markets post pandemic.
Expected Impact of Economic Slowdown on the Pricing and Availability of Products
When economic activity slows, industries begin to suffer. The forecasted effects of the economic downturn on the pricing and accessibility of the products are taken into account in the market insight reports and intelligence services provided by DBMR. With this, our clients can typically keep one step ahead of their competitors, project their sales and revenue, and estimate their profit and loss expenditures.
Global Non-GMO Food Market Scope
The non-GMO food market is segmented on the basis of application, type and distribution channel. The growth amongst these segments will help you analyze meagre growth segments in the industries and provide the users with a valuable market overview and market insights to help them make strategic decisions for identifying core market applications.
Application
- Beverages
- Meat Products
- Fruits and Vegetables
- Dairy Alternatives
- Animal Feed
- Others
Type
- Cereals and Grains
- Liquor
- Meat and Poultry
- Edible Oil
- Bakery
Distribution Channel
- Hypermarkets and Supermarkets
- Food Specialist Retailers
- Convenience Store
- Online
Non-GMO Food Market Regional Analysis/Insights
The non-GMO food market is analysed and market size insights and trends are provided by country, application, type and distribution channel as referenced above.
The countries covered in non-GMO food market report are the U.S., Canada and Mexico in North America, Germany, Sweden, Poland, Denmark, France, U.K., Netherlands, Switzerland, Belgium, Russia, Italy, Spain, Turkey, Rest of Europe in Europe, China, Japan, India, South Korea, Singapore, Malaysia, Australia, Thailand, Indonesia, Philippines, Rest of Asia-Pacific (APAC) in the Asia-Pacific (APAC), Saudi Arabia, U.A.E, South Africa, Egypt, Israel, Rest of Middle East and Africa (MEA) as a part of Middle East and Africa (MEA), Brazil, Argentina and Rest of South America as part of South America
North America dominates the non-GMO food market due to the unique benefits associated with the products, such as minimal chemical usage during production and eco-friendliness, and rising consumer awareness of Non-GMO products will fuel the region's growth.
The country section of the report also provides individual market impacting factors and changes in market regulation that impact the current and future trends of the market. Data points like down-stream and upstream value chain analysis, technical trends and porter's five forces analysis, case studies are some of the pointers used to forecast the market scenario for individual countries. Also, the presence and availability of global brands and their challenges faced due to large or scarce competition from local and domestic brands, impact of domestic tariffs and trade routes are considered while providing forecast analysis of the country data.
Competitive Landscape and Non GMO Food Market Share Analysis
The non-GMO food market competitive landscape provides details by competitor. Details included are company overview, company financials, revenue generated, market potential, investment in research and development, new market initiatives, global presence, production sites and facilities, production capacities, company strengths and weaknesses, product launch, product width and breadth, application dominance. The above data points provided are only related to the companies' focus related to Non non-GMO food market.
Some of the major players operating in the non-GMO food market are:
- Amy’s Kitchen Inc (U.S.)
- Hain Celestial (U.S.)
- Nature’s Path Foods (Canada)
- Organic Valley (U.S.)
- Chiquita Brands International Inc (U.S.)
- United Natural Foods, Inc (U.S.)
- Specialty Food Associations, Inc (U.S.)
- Blue Diamond Growers (U.S.)
- Cargill, Incorporated (U.S.)
- Clif Bar & Company (U.S.)
- NOW Foods (U.S.)
- Pernod Ricard (France)
SKU-

- Interactive Data Analysis Dashboard
- Company Analysis Dashboard for high growth potential opportunities
- Research Analyst Access for customization & queries
- Competitor Analysis with Interactive dashboard
- Latest News, Updates & Trend analysis
- Harness the Power of Benchmark Analysis for Comprehensive Competitor Tracking
Table of Content
1 INTRODUCTION
1.1 OBJECTIVES OF THE STUDY..
1.2 MARKET DEFINITION
1.3 OVERVIEW OF GLOBAL NON-GMO FOOD MARKET
1.4 CURRENCY AND PRICING
1.5 LIMITATION
1.6 MARKETS COVERED
2 MARKET SEGMENTATION
2.1 KEY TAKEAWAYS
2.2 ARRIVING AT THE GLOBAL NON-GMO FOOD MARKET SIZE
2.2.1 VENDOR POSITIONING GRID
2.2.2 TECHNOLOGY LIFE LINE CURVE
2.2.3 MARKET GUIDE
2.2.4 COMPANY POSITIONING GRID
2.2.5 COMAPANY MARKET SHARE ANALYSIS
2.2.6 MULTIVARIATE MODELLING
2.2.7 DEMAND AND SUPPLY-SIDE VARIABLES
2.2.8 TOP TO BOTTOM ANALYSIS
2.2.9 STANDARDS OF MEASUREMENT
2.2.10 VENDOR SHARE ANALYSIS
2.2.11 DATA POINTS FROM KEY PRIMARY INTERVIEWS
2.2.12 DATA POINTS FROM KEY SECONDARY DATABASES
2.3 GLOBAL NON-GMO FOOD MARKET: RESEARCH SNAPSHOT
2.4 ASSUMPTIONS
3 MARKET OVERVIEW
3.1 DRIVERS
3.2 RESTRAINTS
3.3 OPPORTUNITIES
3.4 CHALLENGES
4 EXECUTIVE SUMMARY
5 PREMIUM INSIGHTS
5.1 SUPPLY CHAIN ANALYSIS
5.2 FACTORS INFLUENCING PURCHASING DECISION
5.3 INDUSTRY TRENDS AND FUTURE PERSPECTIVES
5.4 GROWTH STRATEGIES ADOPTED BY KEY PLAYERS
5.5 SHOPPING BEHAVIOUR AND DYNAMICS
5.5.1 RECOMMENDATION FROM FAMILY & FRIENDS
5.5.2 RESEARCH
5.5.3 IMPULSIVE
5.5.4 ADVERTISEMENT
5.5.4.1. TELEVISION ADVERTISEMENT
5.5.4.2. ONLINE ADVERTISEMENT
5.5.4.3. IN-STORE ADVERTISEMENT
5.5.4.4. OUTDOOR ADVERTISEMENT
5.6 PRIVATE LABEL VS BRAND ANALYSIS
5.7 PROMOTIONAL ACTIVITIES
5.8 CONSUMER DISPOSABLE INCOME DYNAMICS/SPEND DYNAMICS
5.9 NEW PRODUCT LAUNCH STRATEGY
5.9.1 NUMBER OF NEW PRODUCT LAUNCH
5.9.1.1. LINE EXTENSTION
5.9.1.2. NEW PACKAGING
5.9.1.3. RE-LAUNCHED
5.9.1.4. NEW FORMULATION
5.1 CONSUMER LEVEL TRENDS
5.11 MEETING CONSUMER REQUIREMENT
6 IMPACT OF ECONOMIC SLOW DOWN ON MARKET
6.1 IMPACT ON PRICE
6.2 IMPACT ON SUPPLY CHAIN
6.3 IMPACT ON SHIPMENT
6.4 IMPACT ON COMPANY’S STRATEGIC DECISIONS
7 REGULATORY FRAMEWORK AND GUIDELINES
8 PRICING ANALYSIS
9 BRAND OUTLOOK
9.1 COMPARATIVE BRAND ANALYSIS
9.2 PRODUCT VS BRAND OVERVIEW
10 GLOBAL NON-GMO FOOD MARKET, BY PRODUCT TYPE, 2021-2030, (USD MILLION)
10.1 OVERVIEW
10.2 FOOD
10.2.1 FOOD, BY TYPE
10.2.1.1. BAKERY
10.2.1.1.1. BAKERY, BY TYPE
10.2.1.1.1.1 BREAD & ROLLS
10.2.1.1.1.2 CAKES, PASTRIES & TRUFFLE
10.2.1.1.1.3 BISCUIT
10.2.1.1.1.4 TART & PIES
10.2.1.1.1.5 BROWNIES
10.2.1.1.1.6 COOKIES & CRACKERS
10.2.1.1.1.7 TORTILLA
10.2.1.1.1.8 OTHERS
10.2.1.2. DAIRY PRODUCTS
10.2.1.2.1. DAIRY PRODUCTS, BY TYPE
10.2.1.2.1.1 YOGURT
10.2.1.2.1.2 ICE CREAM
10.2.1.2.1.3 CHEESE
10.2.1.2.1.4 OTHERS
10.2.1.3. PROCESSED FOOD
10.2.1.3.1. PROCESSED FOOD, BY TYPE
10.2.1.3.1.1 READY MEALS
10.2.1.3.1.2 SAUCES, DRESSINGS AND CONDIMENTS
10.2.1.3.1.3 SOUPS
10.2.1.3.1.4 JAMS, PRESERVES & MARMALADES
10.2.1.3.1.5 OTHERS
10.2.1.4. CONFECTIONERY
10.2.1.4.1. CONFECTIONERY, BY TYPE
10.2.1.4.1.1 HARD-BOILED SWEETS
10.2.1.4.1.2 MINTS
10.2.1.4.1.3 GUMS & JELLIES
10.2.1.4.1.4 CHOCOLATE
10.2.1.4.1.5 CHOCOLATE SYRUPS
10.2.1.4.1.6 CARAMELS & TOFFEES
10.2.1.4.1.7 OTHERS
10.2.1.5. FROZEN DESSERTS
10.2.1.5.1. FROZEN DESSERTS, BY TYPE
10.2.1.5.1.1 GELATO
10.2.1.5.1.2 CUSTARD
10.2.1.5.1.3 SORBET
10.2.1.5.1.4 OTHERS
10.2.1.6. FUCNTIONAL FOOD
10.2.1.7. BABY FOOD
10.2.1.8. PLANT BASED MEAT
10.2.1.8.1. PLANT BASED MEAT, BY TYPE
10.2.1.8.1.1 BURGER
10.2.1.8.1.2 PATTIES
10.2.1.8.1.3 SAUSAGES
10.2.1.8.1.4 STRIPS
10.2.1.8.1.5 NUGGETS
10.2.1.8.1.6 MEATBALLS
10.2.1.8.1.7 TENDERS & CUTLETS
10.2.1.8.1.8 GROUNDS
10.2.1.8.1.9 OTHERS
10.2.1.9. NUTRITIONAL BARS
10.2.1.9.1. NUTRITIONAL BARS, BY TYPE
10.2.1.9.1.1 CEREAL BARS
10.2.1.9.1.1.1. GRANOLA BARS
10.2.1.9.1.1.2. OAT BARS
10.2.1.9.1.1.3. RICE BARS
10.2.1.9.1.1.4. MIXED CEREAL BARS
10.2.1.9.1.1.5. OTHERS
10.2.1.9.1.2 NUT BARS
10.2.1.9.1.2.1. ALMOND
10.2.1.9.1.2.2. CASHEW
10.2.1.9.1.2.3. PEANUT
10.2.1.9.1.2.4. DATES
10.2.1.9.1.2.5. HAZELNUTS
10.2.1.9.1.2.6. OTHERS
10.2.1.10. BREAKFAST CEREALS
10.2.1.11. CONVENIENCE FOOD
10.2.1.11.1. CONVENIENCE FOOD, BY TYPE
10.2.1.11.1.1 NOODLES
10.2.1.11.1.1.1. NOODLES, BY TYPE
A. REGULAR NOODLES
B. INSTANT NOODLES
10.2.1.11.1.2 PIZZA & PASTA
10.2.1.11.1.3 SANCKS & EXTRUDED SNACKS
10.2.1.11.1.4 OTHERS
10.3 BEVERAGES
10.3.1 BEVERAGES, BY TYPE
10.3.1.1. TEA & COFFEE
10.3.1.1.1. TEA
10.3.1.1.1.1 TEA, BY TYPE
10.3.1.1.1.1.1. GREEN TEA
10.3.1.1.1.1.2. BLACK TEA
10.3.1.1.1.1.3. MATCHA
10.3.1.1.1.1.4. HERBAL TEA
10.3.1.1.1.1.5. FERMENTED TEA
10.3.1.1.1.1.6. OTHERS
10.3.1.1.2. COFFEE
10.3.1.1.2.1 COFFEE, BY TYPE
10.3.1.1.2.1.1. COFFE POWDER
10.3.1.1.2.1.2. COFEE MIXES
10.3.1.1.2.1.3. RTD COFFEE
10.3.1.2. JUICES
10.3.1.3. VEGETABLE DRINKS
10.3.1.4. PLANT-BASED MILK
10.3.1.4.1. PLANT-BASED MILK, BY TYPE
10.3.1.4.1.1 SOY MILK
10.3.1.4.1.2 OAT MILK
10.3.1.4.1.3 ALMOND MILK
10.3.1.4.1.4 CASHEW MILK
10.3.1.4.1.5 OTHERS
10.3.1.5. DRINKABLE YOGURTS
10.3.1.6. SPORTS & ENERGY DRINKS
10.3.1.6.1. SPORTS DRINK
10.3.1.6.1.1 SPORTS DRINK, BY TYPE
10.3.1.6.1.1.1. ISOTONIC
10.3.1.6.1.1.2. HYPERTONIC
10.3.1.6.1.1.3. HYPOTONIC
10.3.1.6.2. ENERGY DRINK
10.3.1.6.2.1 ENERGY DRINK, BY TYPE
10.3.1.6.2.1.1. STILL
10.3.1.6.2.1.2. CARBONATED
10.3.1.7. OTHERS
11 GLOBAL NON-GMO FOOD MARKET, BY BRAND CATEGORY, 2021-2030, (USD MILLION)
11.1 OVERVIEW
11.2 BRANDED
11.3 PRIVATE LABEL
12 GLOBAL NON-GMO FOOD MARKET, BY CLAIM, 2021-2030, (USD MILLION)
12.1 OVERVIEW
12.2 GLUTEN FREE
12.3 ARTIFICIAL COLOR FREE
12.4 PRESERVATIVES FREE
12.5 ALL ABOVE CLAIMS
12.6 MULTIPLE CLAIMS
12.7 OTHER CLAIMS
12.8 NO CLAIM / REGULAR
13 GLOBAL NON-GMO FOOD MARKET, BY DISTRIBUTION CHANNEL, 2021-2030, (USD MILLION)
13.1 OVERVIEW
13.2 STORE BASED RETAILERS
13.2.1 SUPERMARKETS/HYPERMARKETS
13.2.2 GROCERY STORES
13.2.3 CONVENIENCE STORES
13.2.4 SPECIALITY STORES
13.2.5 OTHERS
13.3 NON-STORE RETAILERS
13.3.1 ONLINE RETAIL
13.3.2 COMPANY WEBSITES
14 GLOBAL NON-GMO FOOD MARKET, BY GEOGRAPHY
OVERVIEW (ALL SEGMENTATION PROVIDED ABOVE IS REPRESNTED IN THIS CHAPTER BY COUNTRY)
14.1 NORTH AMERICA
14.1.1 U.S.
14.1.2 CANADA
14.1.3 MEXICO
14.2 EUROPE
14.2.1 GERMANY
14.2.2 U.K.
14.2.3 ITALY
14.2.4 FRANCE
14.2.5 SPAIN
14.2.6 SWITZERLAND
14.2.7 NETHERLANDS
14.2.8 BELGIUM
14.2.9 RUSSIA
14.2.10 TURKEY
14.2.11 NORWAY
14.2.12 FINLAND
14.2.13 SWEDEN
14.2.14 DENMARK
14.2.15 POLAND
14.2.16 REST OF EUROPE
14.3 ASIA-PACIFIC
14.3.1 JAPAN
14.3.2 CHINA
14.3.3 SOUTH KOREA
14.3.4 INDIA
14.3.5 AUSTRALIA
14.3.6 SINGAPORE
14.3.7 THAILAND
14.3.8 INDONESIA
14.3.9 MALAYSIA
14.3.10 PHILIPPINES
14.3.11 TAIWAN
14.3.12 VIETNAM
14.3.13 NEW ZEALAND
14.3.14 REST OF ASIA-PACIFIC
14.4 SOUTH AMERICA
14.4.1 BRAZIL
14.4.2 ARGENTINA
14.4.3 REST OF SOUTH AMERICA
14.5 MIDDLE EAST AND AFRICA
14.5.1 SOUTH AFRICA
14.5.2 UAE
14.5.3 SAUDI ARABIA
14.5.4 KUWAIT
14.5.5 EGYPT
14.5.6 ISRAEL
14.5.7 OMAN
14.5.8 BAHRAIN
14.5.9 REST OF MIDDLE EAST AND AFRICA
15 GLOBAL NON-GMO FOOD MARKET, COMPANY LANDSCAPE
15.1 COMPANY SHARE ANALYSIS: GLOBAL
15.2 COMPANY SHARE ANALYSIS: NORTH AMERICA
15.3 COMPANY SHARE ANALYSIS: EUROPE
15.4 COMPANY SHARE ANALYSIS: ASIA-PACIFIC
15.5 MERGERS & ACQUISITIONS
15.6 NEW PRODUCT DEVELOPMENT & APPROVALS
15.7 EXPANSIONS & PARTNERSHIP
15.8 REGULATORY CHANGES
16 GLOBAL NON-GMO FOOD MARKET, SWOT & DBMR ANALYSIS
17 GLOBAL NON-GMO FOOD MARKET, COMPANY PROFILE
17.1 CONAGRA BRANDS, INC.
17.1.1 COMPANY OVERVIEW
17.1.2 REVENUE ANALYSIS
17.1.3 GEOGRAPHICAL PRESENCE
17.1.4 PRODUCT PORTFOLIO
17.1.5 RECENT DEVELOPMENTS
17.2 SUNFED
17.2.1 COMPANY OVERVIEW
17.2.2 REVENUE ANALYSIS
17.2.3 GEOGRAPHICAL PRESENCE
17.2.4 PRODUCT PORTFOLIO
17.2.5 RECENT DEVELOPMENTS
17.3 MAPLE LEAF FOODS INC.
17.3.1 COMPANY OVERVIEW
17.3.2 REVENUE ANALYSIS
17.3.3 GEOGRAPHICAL PRESENCE
17.3.4 PRODUCT PORTFOLIO
17.3.5 RECENT DEVELOPMENTS
17.4 AMY’S KITCHEN
17.4.1 COMPANY OVERVIEW
17.4.2 REVENUE ANALYSIS
17.4.3 GEOGRAPHICAL PRESENCE
17.4.4 PRODUCT PORTFOLIO
17.4.5 RECENT DEVELOPMENTS
17.5 GENERAL MILLS INC
17.5.1 COMPANY OVERVIEW
17.5.2 REVENUE ANALYSIS
17.5.3 GEOGRAPHICAL PRESENCE
17.5.4 PRODUCT PORTFOLIO
17.5.5 RECENT DEVELOPMENTS
17.6 DANONE
17.6.1 COMPANY OVERVIEW
17.6.2 REVENUE ANALYSIS
17.6.3 GEOGRAPHICAL PRESENCE
17.6.4 PRODUCT PORTFOLIO
17.6.5 RECENT DEVELOPMENTS
17.7 UNITED NATURAL FOODS, INC.
17.7.1 COMPANY OVERVIEW
17.7.2 REVENUE ANALYSIS
17.7.3 GEOGRAPHICAL PRESENCE
17.7.4 PRODUCT PORTFOLIO
17.7.5 RECENT DEVELOPMENTS
17.8 ORGANIC VALLEY
17.8.1 COMPANY OVERVIEW
17.8.2 REVENUE ANALYSIS
17.8.3 GEOGRAPHICAL PRESENCE
17.8.4 PRODUCT PORTFOLIO
17.8.5 RECENT DEVELOPMENTS
17.9 DOLE FOOD COMPANY, INC.
17.9.1 COMPANY OVERVIEW
17.9.2 REVENUE ANALYSIS
17.9.3 GEOGRAPHICAL PRESENCE
17.9.4 PRODUCT PORTFOLIO
17.9.5 RECENT DEVELOPMENTS
17.1 NEWMAN'S OWN INC.
17.10.1 COMPANY OVERVIEW
17.10.2 REVENUE ANALYSIS
17.10.3 GEOGRAPHICAL PRESENCE
17.10.4 PRODUCT PORTFOLIO
17.10.5 RECENT DEVELOPMENTS
17.11 PEPSICO INC.
17.11.1 COMPANY OVERVIEW
17.11.2 REVENUE ANALYSIS
17.11.3 GEOGRAPHICAL PRESENCE
17.11.4 PRODUCT PORTFOLIO
17.11.5 RECENT DEVELOPMENTS
17.12 THE KROGER CO.
17.12.1 COMPANY OVERVIEW
17.12.2 REVENUE ANALYSIS
17.12.3 GEOGRAPHICAL PRESENCE
17.12.4 PRODUCT PORTFOLIO
17.12.5 RECENT DEVELOPMENTS
17.13 CLIF BAR & COMPANY
17.13.1 COMPANY OVERVIEW
17.13.2 REVENUE ANALYSIS
17.13.3 GEOGRAPHICAL PRESENCE
17.13.4 PRODUCT PORTFOLIO
17.13.5 RECENT DEVELOPMENTS
17.14 THE KRAFT HEINZ COMPANY
17.14.1 COMPANY OVERVIEW
17.14.2 REVENUE ANALYSIS
17.14.3 GEOGRAPHICAL PRESENCE
17.14.4 PRODUCT PORTFOLIO
17.14.5 RECENT DEVELOPMENTS
17.15 WM MORRISON
17.15.1 COMPANY OVERVIEW
17.15.2 REVENUE ANALYSIS
17.15.3 GEOGRAPHICAL PRESENCE
17.15.4 PRODUCT PORTFOLIO
17.15.5 RECENT DEVELOPMENTS
17.16 HAIN CELESTIAL
17.16.1 COMPANY OVERVIEW
17.16.2 REVENUE ANALYSIS
17.16.3 GEOGRAPHICAL PRESENCE
17.16.4 PRODUCT PORTFOLIO
17.16.5 RECENT DEVELOPMENTS
17.17 THE HERSHEY COMPANY
17.17.1 COMPANY OVERVIEW
17.17.2 REVENUE ANALYSIS
17.17.3 GEOGRAPHICAL PRESENCE
17.17.4 PRODUCT PORTFOLIO
17.17.5 RECENT DEVELOPMENTS
17.18 NESTLÉ
17.18.1 COMPANY OVERVIEW
17.18.2 REVENUE ANALYSIS
17.18.3 GEOGRAPHICAL PRESENCE
17.18.4 PRODUCT PORTFOLIO
17.18.5 RECENT DEVELOPMENTS
17.19 EDEN FOODS
17.19.1 COMPANY OVERVIEW
17.19.2 REVENUE ANALYSIS
17.19.3 GEOGRAPHICAL PRESENCE
17.19.4 PRODUCT PORTFOLIO
17.19.5 RECENT DEVELOPMENTS
17.2 SUNOPTA
17.20.1 COMPANY OVERVIEW
17.20.2 REVENUE ANALYSIS
17.20.3 GEOGRAPHICAL PRESENCE
17.20.4 PRODUCT PORTFOLIO
17.20.5 RECENT DEVELOPMENTS
17.21 BELVOIR FRUIT FARMS LTD
17.21.1 COMPANY OVERVIEW
17.21.2 REVENUE ANALYSIS
17.21.3 GEOGRAPHICAL PRESENCE
17.21.4 PRODUCT PORTFOLIO
17.21.5 RECENT DEVELOPMENTS
17.22 UNCLE MATT'S ORGANIC
17.22.1 COMPANY OVERVIEW
17.22.2 REVENUE ANALYSIS
17.22.3 GEOGRAPHICAL PRESENCE
17.22.4 PRODUCT PORTFOLIO
17.22.5 RECENT DEVELOPMENTS
17.23 BONCAFÉ INTERNATIONAL PTE LTD
17.23.1 COMPANY OVERVIEW
17.23.2 REVENUE ANALYSIS
17.23.3 GEOGRAPHICAL PRESENCE
17.23.4 PRODUCT PORTFOLIO
17.23.5 RECENT DEVELOPMENTS
17.24 PS ORGANIC
17.24.1 COMPANY OVERVIEW
17.24.2 REVENUE ANALYSIS
17.24.3 GEOGRAPHICAL PRESENCE
17.24.4 PRODUCT PORTFOLIO
17.24.5 RECENT DEVELOPMENTS
17.25 LOUIS DREYFUS COMPANY
17.25.1 COMPANY OVERVIEW
17.25.2 REVENUE ANALYSIS
17.25.3 GEOGRAPHICAL PRESENCE
17.25.4 PRODUCT PORTFOLIO
17.25.5 RECENT DEVELOPMENTS
17.26 LUNDBERG FAMILY FARMS
17.26.1 COMPANY OVERVIEW
17.26.2 REVENUE ANALYSIS
17.26.3 GEOGRAPHICAL PRESENCE
17.26.4 PRODUCT PORTFOLIO
17.26.5 RECENT DEVELOPMENTS
NOTE: THE COMPANIES PROFILED IS NOT EXHAUSTIVE LIST AND IS AS PER OUR PREVIOUS CLIENT REQUIREMENT. WE PROFILE MORE THAN 100 COMPANIES IN OUR STUDY AND HENCE THE LIST OF COMPANIES CAN BE MODIFIED OR REPLACED ON REQUEST
18 RELATED REPORTS
19 CONCLUSION
20 QUESTIONNAIRE
21 ABOUT DATA BRIDGE MARKET RESEARCH
Global Non Gmo Food Market, Supply Chain Analysis and Ecosystem Framework
To support market growth and help clients navigate the impact of geopolitical shifts, DBMR has integrated in-depth supply chain analysis into its Global Non Gmo Food Market research reports. This addition empowers clients to respond effectively to global changes affecting their industries. The supply chain analysis section includes detailed insights such as Global Non Gmo Food Market consumption and production by country, price trend analysis, the impact of tariffs and geopolitical developments, and import and export trends by country and HSN code. It also highlights major suppliers with data on production capacity and company profiles, as well as key importers and exporters. In addition to research, DBMR offers specialized supply chain consulting services backed by over a decade of experience, providing solutions like supplier discovery, supplier risk assessment, price trend analysis, impact evaluation of inflation and trade route changes, and comprehensive market trend analysis.
Data collection and base year analysis are done using data collection modules with large sample sizes. The stage includes obtaining market information or related data through various sources and strategies. It includes examining and planning all the data acquired from the past in advance. It likewise envelops the examination of information inconsistencies seen across different information sources. The market data is analysed and estimated using market statistical and coherent models. Also, market share analysis and key trend analysis are the major success factors in the market report. To know more, please request an analyst call or drop down your inquiry.
The key research methodology used by DBMR research team is data triangulation which involves data mining, analysis of the impact of data variables on the market and primary (industry expert) validation. Data models include Vendor Positioning Grid, Market Time Line Analysis, Market Overview and Guide, Company Positioning Grid, Patent Analysis, Pricing Analysis, Company Market Share Analysis, Standards of Measurement, Global versus Regional and Vendor Share Analysis. To know more about the research methodology, drop in an inquiry to speak to our industry experts.
Data Bridge Market Research is a leader in advanced formative research. We take pride in servicing our existing and new customers with data and analysis that match and suits their goal. The report can be customized to include price trend analysis of target brands understanding the market for additional countries (ask for the list of countries), clinical trial results data, literature review, refurbished market and product base analysis. Market analysis of target competitors can be analyzed from technology-based analysis to market portfolio strategies. We can add as many competitors that you require data about in the format and data style you are looking for. Our team of analysts can also provide you data in crude raw excel files pivot tables (Fact book) or can assist you in creating presentations from the data sets available in the report.


