
Global Oil And Gas Data Monetization Market
Market Size in USD Billion
 USD
18.40 Billion
USD
59.08 Billion
2025
2033
USD
18.40 Billion
USD
59.08 Billion
2025
2033
| 2026 - 2033 | |
| USD 18.40 Billion | |
| USD 59.08 Billion | |
| % | |
|
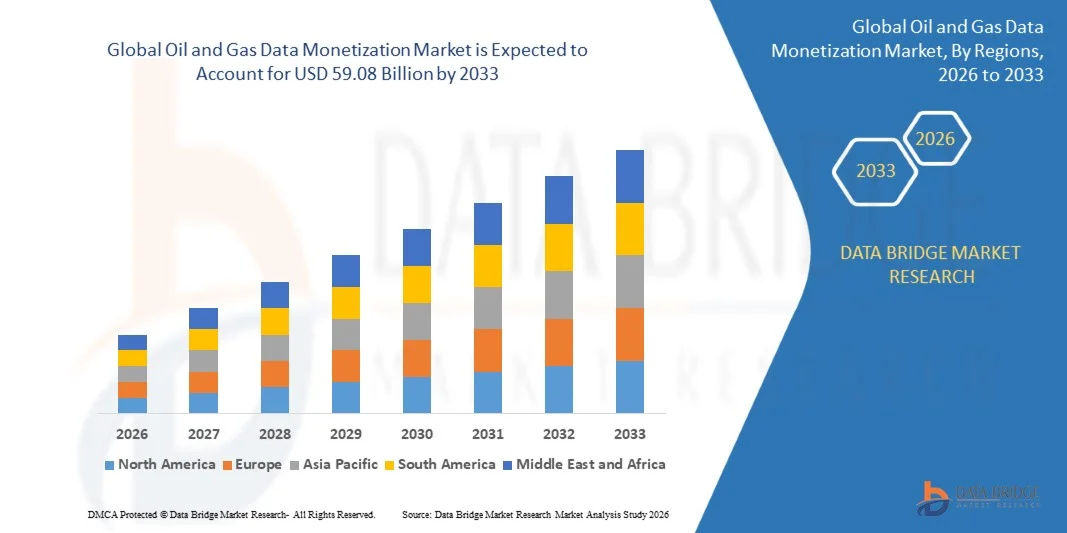
What is the Global Oil and Gas Data Monetization Market Size and Growth Rate?
- The global oil and gas data monetization market size was valued at USD 18.40 billion in 2025 and is expected to reach USD 59.08 billion by 2033, at a CAGR of15.7% during the forecast period
- The increase in the number of oil and gas companies across the globe acts as one of the major factors driving the growth of oil and gas data monetization market
- The rise in the adoption of the big data technologies to collect, manage, and increase new insights, and increase in demand for data monetization technologies that can assist key players in optimizing their business operations, and improving their competitive edge accelerate the market growth
What are the Major Takeaways of Oil and Gas Data Monetization Market?
- The advent of open standards and centralized data management for seamless integration and operation across the number of pipeline operation systems, and high usage of these operation systems such as simulation, measurement and asset management further influence the market
- In addition, increase system availability, rapid digitization, rise in the adoption of Internet of things and huge amounts of data generated positively affect the oil and gas data monetization market
- North America dominated the oil and gas data monetization market with a 41.9% revenue share in 2025, driven by strong digital transformation across the energy sector and the early adoption of advanced data analytics platforms by oil and gas companies in the U.S. and Canada
- Asia-Pacific is projected to register the fastest CAGR of 10.7% from 2026 to 2033, driven by growing digital transformation across the energy sector and increasing adoption of advanced analytics platforms in major oil and gas producing countries
- The Indirect Data Monetization segment dominated the market with a 58.6% share in 2025, as most oil and gas companies primarily leverage data to enhance operational efficiency, optimize production, and reduce operational risks rather than selling raw data directly
Report Scope and Oil and Gas Data Monetization Market Segmentation
|
Attributes |
Oil and Gas Data Monetization Key Market Insights |
|
Segments Covered |
|
|
Countries Covered |
North America
Europe
Asia-Pacific
Middle East and Africa
South America
|
|
Key Market Players |
|
|
Market Opportunities |
|
|
Value Added Data Infosets |
In addition to the insights on market scenarios such as market value, growth rate, segmentation, geographical coverage, and major players, the market reports curated by the Data Bridge Market Research also include in-depth expert analysis, pricing analysis, brand share analysis, consumer survey, demography analysis, supply chain analysis, value chain analysis, raw material/consumables overview, vendor selection criteria, PESTLE Analysis, Porter Analysis, and regulatory framework. |
What is the Key Trend in the Oil and Gas Data Monetization Market?
“Increasing Adoption of Cloud-Based Platforms and Advanced Analytics for Data Monetization”
- The oil and gas data monetization market is witnessing strong adoption of cloud-based data platforms, advanced analytics, and AI-driven solutions designed to extract commercial value from operational and geological datasets
- Companies are increasingly integrating digital technologies such as machine learning, big data analytics, and predictive modeling to transform raw exploration, production, and reservoir data into revenue-generating insights
- Growing demand for real-time operational intelligence and data sharing across upstream, midstream, and downstream operations is accelerating the use of digital platforms for data monetization
- For instance, companies such as Google Cloud, IBM, SAP, and Accenture are providing advanced analytics platforms that enable energy companies to commercialize seismic data, production data, and operational insights through secure data marketplaces
- Increasing collaboration between oil and gas companies, technology providers, and digital platform operators is enabling new business models centered on data exchange and analytics services
- As energy companies continue to digitalize operations and leverage advanced analytics, Oil and Gas Data Monetization platforms will play a crucial role in generating new revenue streams and improving operational efficiency
What are the Key Drivers of Oil and Gas Data Monetization Market?
- Rising adoption of digital transformation initiatives across the oil and gas industry is driving demand for platforms that can convert operational and geological data into monetizable assets
- For instance, in 2025, leading technology providers such as IBM, SAP, and Accenture expanded their energy analytics platforms to help oil and gas companies commercialize reservoir data, drilling analytics, and production insights
- Growing deployment of IoT sensors, smart drilling technologies, and digital oilfield systems is generating massive volumes of operational data, increasing the need for advanced analytics and monetization solutions
- Advancements in cloud computing, big data platforms, and AI-driven predictive analytics have improved the ability to process, analyze, and commercialize complex energy datasets
- Rising collaboration between oil companies, technology firms, and data marketplace providers is enabling secure data exchange and new revenue opportunities from energy-related datasets
- Supported by increasing investments in digital oilfield technologies, energy data analytics, and cloud infrastructure, the Oil and Gas Data Monetization market is expected to experience strong long-term growth
Which Factor is Challenging the Growth of the Oil and Gas Data Monetization Market?
- Concerns regarding data security, intellectual property protection, and regulatory compliance pose significant challenges to the widespread adoption of data monetization platforms in the oil and gas industry
- For instance, during 2024–2025, several energy companies faced challenges in sharing proprietary exploration and reservoir data due to confidentiality agreements and cybersecurity risks
- Integration complexities between legacy oilfield systems, modern analytics platforms, and cloud-based data environments increase implementation challenges for many organizations
- Limited digital infrastructure and lack of advanced data management capabilities in certain developing regions can slow the adoption of data monetization solutions
- High implementation costs associated with advanced analytics platforms, cloud infrastructure, and skilled data professionals can restrict adoption among smaller energy companies
- To address these challenges, companies are focusing on secure data governance frameworks, blockchain-enabled data sharing, advanced cybersecurity measures, and scalable cloud platforms to expand global adoption of Oil and Gas Data Monetization solutions
How is the Oil and Gas Data Monetization Market Segmented?
The market is segmented on the basis of method, component, application, E&P lifecycle, and oil companies.
• By Method
On the basis of method, the oil and gas data monetization market is segmented into Direct Data Monetization and Indirect Data Monetization. The Indirect Data Monetization segment dominated the market with a 58.6% share in 2025, as most oil and gas companies primarily leverage data to enhance operational efficiency, optimize production, and reduce operational risks rather than selling raw data directly. Indirect monetization includes the use of advanced analytics, predictive maintenance, reservoir optimization, and drilling performance analysis to improve profitability and decision-making. By converting operational insights into improved efficiency and cost savings, energy companies can generate significant economic value from large datasets produced during exploration and production operations. The increasing adoption of AI-powered analytics, digital oilfield platforms, and cloud-based data management solutions further strengthens the role of indirect monetization strategies.
The Direct Data Monetization segment is expected to grow at the fastest CAGR from 2026 to 2033, driven by the emergence of energy data marketplaces where seismic data, reservoir datasets, and geological surveys are commercialized for industry partners, research organizations, and exploration companies.
• By Component
On the basis of component, the oil and gas data monetization market is segmented into Data-as-a-Service, Professional Services, and Software/Platform. The Software/Platform segment dominated the market with a 44.9% share in 2025, driven by the widespread adoption of advanced analytics platforms, cloud-based data management systems, and AI-driven decision support tools. Oil and gas companies rely on specialized software platforms to collect, store, analyze, and distribute vast amounts of operational and geological data generated from drilling, production, and reservoir monitoring activities. These platforms enable real-time insights, predictive analytics, and automated reporting, which are critical for maximizing the commercial value of energy datasets. The increasing digital transformation of oilfield operations and growing integration of big data analytics tools are further accelerating the demand for advanced data monetization platforms.
The Data-as-a-Service segment is expected to grow at the fastest CAGR from 2026 to 2033, supported by the rising demand for subscription-based access to geological data, seismic datasets, and operational analytics provided through cloud-enabled data platforms.
• By Application
On the basis of application, the oil and gas data monetization market is segmented into Upstream, Midstream, and Downstream. The Upstream segment dominated the market with a 46.3% share in 2025, primarily due to the large volumes of geological, seismic, and reservoir data generated during exploration and drilling operations. Oil and gas companies are increasingly utilizing advanced analytics to convert exploration data into actionable insights that improve reservoir modeling, drilling performance, and resource estimation. By monetizing upstream datasets through internal optimization and external data sharing platforms, companies can significantly enhance exploration efficiency and reduce operational costs. In addition, the growing use of digital oilfield technologies and smart drilling systems continues to generate large datasets that can be leveraged for commercial and operational benefits.
The Downstream segment is expected to grow at the fastest CAGR from 2026 to 2033, driven by increasing digitalization in refining operations, supply chain optimization, and fuel demand forecasting using advanced data analytics platforms.
• By E&P Lifecycle
On the basis of E&P lifecycle, the oil and gas data monetization market is segmented into Exploration, Development, and Production. The Production segment dominated the market with a 42.7% share in 2025, as production operations generate continuous streams of operational data from sensors, monitoring systems, and digital oilfield platforms. This data is widely used for predictive maintenance, production optimization, equipment monitoring, and asset performance management. Companies increasingly leverage advanced analytics to convert production data into valuable insights that enhance operational efficiency and reduce downtime. Continuous monitoring of wells, pipelines, and processing facilities also creates opportunities for monetizing operational datasets through internal analytics platforms and external data services.
The Exploration segment is expected to grow at the fastest CAGR from 2026 to 2033, supported by rising investments in seismic surveys, geological modeling, and advanced exploration technologies that generate high-value datasets for potential commercialization.
• By Oil Companies
On the basis of oil companies, the oil and gas data monetization market is segmented into National Oil Companies (NOCs), Independent Oil Companies (IOCs), National Data Repositories (NDRs), and Oil and Gas Service Companies. The National Oil Companies (NOCs) segment dominated the market with a 39.8% share in 2025, as these organizations manage extensive national hydrocarbon resources and maintain large datasets related to exploration, production, and reservoir characteristics. NOCs often control national geological databases and collaborate with international partners to commercialize seismic and exploration data through licensing agreements and data repositories. Their strong financial resources and large-scale digital transformation initiatives further enable advanced data monetization strategies across upstream and downstream operations.
The National Data Repositories (NDRs) segment is expected to grow at the fastest CAGR from 2026 to 2033, driven by increasing government initiatives to centralize exploration data and provide controlled access to energy companies, research institutions, and exploration firms through digital data marketplaces.
Which Region Holds the Largest Share of the Oil and Gas Data Monetization Market?
- North America dominated the oil and gas data monetization market with a 41.9% revenue share in 2025, driven by strong digital transformation across the energy sector and the early adoption of advanced data analytics platforms by oil and gas companies in the U.S. and Canada. Major industry players are increasingly leveraging cloud computing, artificial intelligence, and big data technologies to convert large volumes of operational, seismic, and production data into valuable business insights. The growing focus on digital oilfield technologies, predictive analytics, and operational optimization continues to drive the adoption of data monetization platforms across exploration and production activities
- Leading technology providers in North America are introducing advanced analytics platforms, cloud-enabled data marketplaces, and AI-driven decision support tools that enable energy companies to securely commercialize geological and operational datasets. Continuous investment in digital infrastructure, energy analytics, and industrial IoT solutions is strengthening the region’s technological leadership
- Strong presence of global technology firms, advanced research ecosystems, and high investment in energy sector innovation further reinforce North America’s leading position in the global oil and gas data monetization market
U.S. Oil and Gas Data Monetization Market Insight
The U.S. represents the largest contributor within North America, supported by a highly digitalized oil and gas industry and the strong presence of technology companies providing advanced analytics and cloud platforms. Energy companies in the country increasingly utilize data monetization solutions to analyze seismic data, optimize drilling operations, and improve reservoir performance. The rapid adoption of digital oilfield technologies, IoT-enabled monitoring systems, and AI-driven analytics platforms is generating vast amounts of operational data that can be transformed into commercial value. In addition, collaboration between energy companies, technology vendors, and research institutions is accelerating the development of innovative data monetization solutions designed to improve operational efficiency and support strategic decision-making across upstream and downstream activities.
Canada Oil and Gas Data Monetization Market Insight
Canada contributes significantly to regional market growth due to increasing digitalization across its oil sands, exploration projects, and energy infrastructure. Oil and gas companies in Canada are increasingly adopting advanced data analytics platforms to improve production efficiency, optimize drilling operations, and enhance reservoir management. The country’s strong focus on energy technology innovation and data-driven operational strategies is encouraging companies to leverage large datasets generated during exploration and production processes. In addition, partnerships between energy firms, technology providers, and research institutions are fostering the development of advanced data monetization frameworks that enable secure data sharing and commercialization of geological and operational datasets.
Asia-Pacific Oil and Gas Data Monetization Market
Asia-Pacific is projected to register the fastest CAGR of 10.7% from 2026 to 2033, driven by growing digital transformation across the energy sector and increasing adoption of advanced analytics platforms in major oil and gas producing countries. Governments and energy companies across China, India, Southeast Asia, and Australia are investing heavily in digital oilfield technologies, cloud infrastructure, and AI-powered data management platforms. Rapid expansion of energy demand, exploration activities, and offshore drilling projects is generating large volumes of operational and geological data that can be monetized through advanced analytics solutions. In addition, rising collaboration between energy companies and technology firms is accelerating the adoption of data monetization platforms across upstream, midstream, and downstream operations.
China Oil and Gas Data Monetization Market Insight
China represents the largest market in Asia-Pacific due to extensive investments in energy infrastructure, digital oilfield technologies, and advanced data analytics platforms. The country’s major oil companies are increasingly leveraging big data, artificial intelligence, and cloud computing to optimize exploration, drilling, and production processes. Government initiatives supporting digital transformation in the energy sector and the rapid development of smart energy management systems are also driving demand for data monetization platforms. The ability to convert large volumes of exploration and operational data into valuable business insights is becoming a key strategic priority for energy companies operating in China.
Japan Oil and Gas Data Monetization Market Insight
Japan demonstrates steady growth in the Oil and Gas Data Monetization market, supported by strong technological capabilities and advanced data analytics expertise. Energy companies and technology providers in Japan are investing in digital platforms designed to analyze and commercialize operational data generated across energy infrastructure. The country’s focus on smart energy management, predictive maintenance, and digital transformation is driving the adoption of advanced data analytics tools. These technologies enable companies to derive greater value from operational datasets while improving energy efficiency and asset performance.
India Oil and Gas Data Monetization Market Insight
India is emerging as a rapidly growing market for oil and gas data monetization solutions, driven by increasing exploration activities and digitalization of the country’s energy infrastructure. Government initiatives aimed at improving domestic energy production and promoting digital transformation are encouraging energy companies to adopt advanced data analytics platforms. Oil and gas firms are increasingly utilizing data monetization strategies to analyze seismic data, optimize drilling operations, and enhance production efficiency. Growing investments in cloud computing, industrial IoT, and AI-driven analytics are further strengthening the adoption of data monetization platforms across the country.
South Korea Oil and Gas Data Monetization Market Insight
South Korea contributes significantly to the regional market due to its strong technological ecosystem and advanced digital infrastructure. Energy companies and technology firms in the country are actively developing data analytics platforms that enable efficient management and commercialization of operational energy datasets. The rapid adoption of artificial intelligence, big data technologies, and industrial IoT solutions is supporting the growth of the Oil and Gas Data Monetization market. In addition, strong government support for digital innovation and smart energy initiatives continues to encourage the adoption of advanced data monetization platforms across the energy sector.
Which are the Top Companies in Oil and Gas Data Monetization Market?
The oil and gas data monetization industry is primarily led by well-established companies, including:
- Adastra (Czech Republic)
- CellOS Software Ltd (Australia)
- Connectiva Analytics and Insights Ltd. (U.K.)
- Dawex Systems (France)
- Infosys Limited (India)
- Comviva (India)
- MNUBO (Canada)
- NETSCOUT Systems, Inc. (U.S.)
- Paxata, Inc. (U.S.)
- Optiva Inc. (Canada)
- SQLstream, Inc. (U.S.)
- Google (U.S.)
- IBM (U.S.)
- 101data Solutions (U.S.)
- Accenture (Ireland)
- Monetize (U.K.)
- Accenture (Ireland)
- ALC (U.S.)
- Optiva Inc. (Canada)
- SAP SE (Germany)
What are the Recent Developments in Global Oil and Gas Data Monetization Market?
- In July 2025, Cloudera signed a Memorandum of Understanding (MoU) with Saudi Aramco to develop AI-powered oil and gas solutions for the energy sector in Saudi Arabia, combining Cloudera’s advanced data platform capabilities with Aramco’s industry expertise to support digital transformation across exploration, production, and downstream operations, thereby strengthening the role of data-driven technologies in improving operational efficiency and decision-making in the energy industry
- In April 2025, EPAM received the 2025 Google Cloud Industry Solutions Partner of the Year Award for Oil and Gas for developing advanced AI-powered geospatial data visualization solutions that enable natural language queries across large and complex datasets while automatically mapping analytical insights across spatial environments, highlighting the growing importance of AI-enabled analytics in unlocking value from large-scale energy data
- In December 2024, Schlumberger reported that its Digital Solutions division generated quarterly revenue of USD 331 million, reflecting a significant 140% year-over-year increase driven largely by partnerships with hyperscale cloud providers focused on building artificial intelligence infrastructure rather than traditional oil and gas client engagements, indicating a major shift toward data-centric and AI-driven revenue models within the energy sector
SKU-

- Interactive Data Analysis Dashboard
- Company Analysis Dashboard for high growth potential opportunities
- Research Analyst Access for customization & queries
- Competitor Analysis with Interactive dashboard
- Latest News, Updates & Trend analysis
- Harness the Power of Benchmark Analysis for Comprehensive Competitor Tracking
Data collection and base year analysis are done using data collection modules with large sample sizes. The stage includes obtaining market information or related data through various sources and strategies. It includes examining and planning all the data acquired from the past in advance. It likewise envelops the examination of information inconsistencies seen across different information sources. The market data is analysed and estimated using market statistical and coherent models. Also, market share analysis and key trend analysis are the major success factors in the market report. To know more, please request an analyst call or drop down your inquiry.
The key research methodology used by DBMR research team is data triangulation which involves data mining, analysis of the impact of data variables on the market and primary (industry expert) validation. Data models include Vendor Positioning Grid, Market Time Line Analysis, Market Overview and Guide, Company Positioning Grid, Patent Analysis, Pricing Analysis, Company Market Share Analysis, Standards of Measurement, Global versus Regional and Vendor Share Analysis. To know more about the research methodology, drop in an inquiry to speak to our industry experts.
Data Bridge Market Research is a leader in advanced formative research. We take pride in servicing our existing and new customers with data and analysis that match and suits their goal. The report can be customized to include price trend analysis of target brands understanding the market for additional countries (ask for the list of countries), clinical trial results data, literature review, refurbished market and product base analysis. Market analysis of target competitors can be analyzed from technology-based analysis to market portfolio strategies. We can add as many competitors that you require data about in the format and data style you are looking for. Our team of analysts can also provide you data in crude raw excel files pivot tables (Fact book) or can assist you in creating presentations from the data sets available in the report.


