
Global Osteoarthritis Therapeutics Market
Market Size in USD Billion
 USD
8.67 Billion
USD
17.29 Billion
2024
2032
USD
8.67 Billion
USD
17.29 Billion
2024
2032
| 2025 - 2032 | |
| USD 8.67 Billion | |
| USD 17.29 Billion | |
| % | |
|
Global Osteoarthritis Therapeutics Market Size
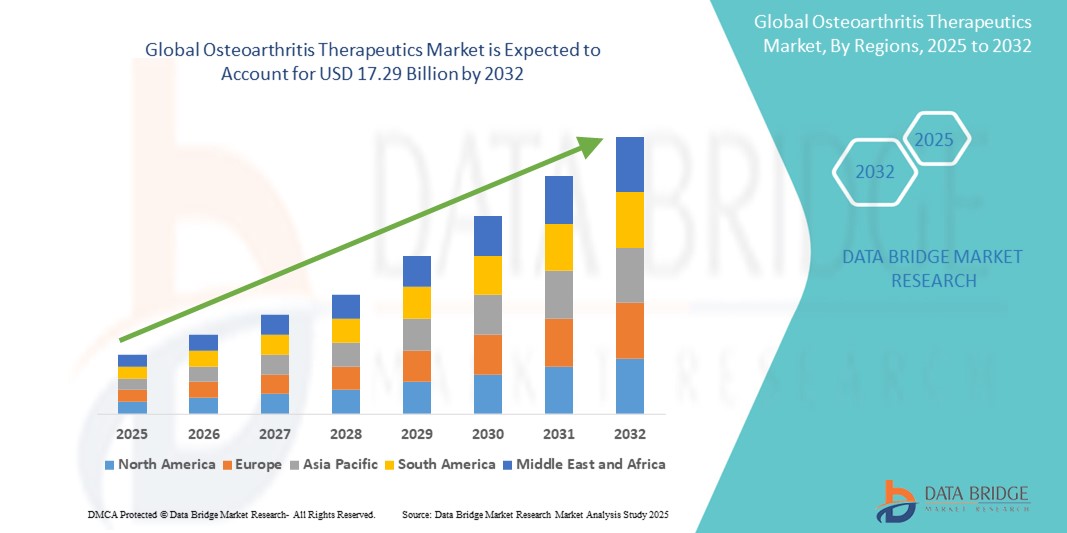
- The global osteoarthritis therapeutics market size was valued at USD 8.67 billion in 2024 and is expected to reach USD 17.29 billion by 2032, at a CAGR of 9.00% during the forecast period
- The market growth is largely fueled by the increasing prevalence of osteoarthritis worldwide, particularly among the aging population, combined with advances in therapeutic development including biologics, cell-based therapies, and disease-modifying osteoarthritis drugs (DMOADs). This trend is driving greater focus on early diagnosis and personalized treatment approaches
- Furthermore, rising patient awareness, improved access to healthcare in emerging markets, and increasing demand for minimally invasive and long-acting treatment options are positioning osteoarthritis therapeutics as a critical component of musculoskeletal care. These converging factors are accelerating the uptake of Osteoarthritis Therapeutics solutions, thereby significantly boosting the industry's growth
Osteoarthritis Therapeutics Market Analysis
- Osteoarthritis therapeutics, including pharmacological agents, biologics, and intra-articular injections, are becoming increasingly vital components of musculoskeletal care in both primary and specialty healthcare settings due to their effectiveness in managing chronic joint pain, improving mobility, and delaying the need for surgical interventions
- The escalating demand for osteoarthritis therapeutics is primarily fueled by the aging global population, rising obesity rates, increasing awareness of joint health, and advancements in regenerative medicine and disease-modifying osteoarthritis drugs (DMOADs)
- North America dominated the osteoarthritis therapeutics market with the largest revenue share of 41.7% in 2024, driven by the high prevalence of osteoarthritis, strong healthcare infrastructure, favorable reimbursement policies, and the presence of major pharmaceutical companies investing in R&D for novel therapies. The U.S. continues to lead the region with widespread adoption of advanced treatment options such as platelet-rich plasma (PRP) injections and viscosupplementation
- Asia-Pacific is expected to be the fastest growing region in the osteoarthritis therapeutics market during the forecast period, with a CAGR of 9.6%, owing to rapidly aging populations, increasing healthcare spending, improving diagnosis rates, and a growing emphasis on non-surgical interventions across countries such as China, India, and Japan
- The viscosupplementation agents segment dominated the osteoarthritis therapeutics market with a market share of 34.5% in 2024, driven by their role in improving joint lubrication and delaying the need for surgical intervention. These agents are particularly effective in treating knee osteoarthritis and are widely adopted due to their minimal side effects
Report Scope and Osteoarthritis Therapeutics Market Segmentation
|
Attributes |
Osteoarthritis Therapeutics Key Market Insights |
|
Segments Covered |
|
|
Countries Covered |
North America
Europe
Asia-Pacific
Middle East and Africa
South America
|
|
Key Market Players |
|
|
Market Opportunities |
|
|
Value Added Data Infosets |
In addition to the insights on market scenarios such as market value, growth rate, segmentation, geographical coverage, and major players, the market reports curated by the Data Bridge Market Research also include in-depth expert analysis, pricing analysis, brand share analysis, consumer survey, demography analysis, supply chain analysis, value chain analysis, raw material/consumables overview, vendor selection criteria, PESTLE Analysis, Porter Analysis, and regulatory framework. |
Osteoarthritis Therapeutics Market Trends
“Advancements in Targeted and Personalized Osteoarthritis Treatment Approaches”
- A significant and accelerating trend in the global osteoarthritis therapeutics market is the shift toward targeted biologics and personalized treatment regimens. Innovations in molecular diagnostics and genetic profiling are enabling clinicians to better understand patient-specific disease mechanisms and customize therapies accordingly
- For instance, novel interleukin inhibitors and monoclonal antibodies are being developed and introduced to the market to target specific inflammatory pathways involved in osteoarthritis progression. These therapies aim not just to relieve symptoms but to halt or slow joint degeneration, offering hope for long-term relief and improved quality of life
- The integration of advanced imaging tools and biomarkers allows earlier diagnosis and helps physicians monitor disease progression more accurately, leading to better treatment outcomes. Companies are increasingly investing in companion diagnostics to pair with high-value osteoarthritis drugs, optimizing their effectiveness for distinct patient groups
- Increasing research on regenerative medicine, including stem cell therapy and tissue engineering, is offering new opportunities to restore damaged cartilage, moving beyond pain relief to actual structural repair. Several biotech startups and pharma companies are conducting clinical trials focused on intra-articular regenerative injections that promise fewer side effects and longer-lasting benefits
- The trend toward digital therapeutics and remote patient monitoring tools is also gaining traction, particularly for managing chronic pain and physical therapy adherence. Wearable devices and mobile health apps are helping track joint movement, exercise compliance, and treatment response—allowing for real-time care optimization
- This progression toward more personalized, regenerative, and data-driven treatment strategies is fundamentally reshaping patient expectations and clinical protocols. As a result, major players such as Pfizer, Novartis, Amgen, and Zimmer Biomet are accelerating their investments in targeted osteoarthritis therapies and digital health ecosystems to stay competitive in this evolving landscape
Osteoarthritis Therapeutics Market Dynamics
Driver
“Growing Need Due to Rising Disease Burden and Aging Population”
- The increasing global burden of osteoarthritis, particularly among the aging population, is a major driver fueling demand for effective osteoarthritis therapeutics. The World Health Organization reports that osteoarthritis is among the most disabling diseases in older adults, significantly affecting mobility and quality of life
- For instance, in April 2024, AbbVie Inc. announced the expansion of its R&D program for osteoarthritis, focusing on next-generation anti-inflammatory biologics aimed at halting disease progression rather than just alleviating symptoms. Such strategic developments are expected to drive the osteoarthritis therapeutics industry growth in the forecast period
- As life expectancy increases worldwide, the prevalence of osteoarthritis is expected to rise proportionally. This shift is prompting healthcare systems to invest more heavily in disease management, while pharmaceutical companies focus on creating innovative and long-acting treatment options, including injectable hyaluronic acid, NSAIDs, and biologic therapies
- Moreover, the growing demand for pain management solutions, physical therapy integration, and joint-preserving drugs is making osteoarthritis treatment a priority area within rheumatology and orthopedics
- The convenience of oral, topical, and injectable treatment options, along with ongoing advancements in drug delivery systems and regenerative medicine, is improving patient compliance and expanding therapeutic applications across various care settings
- In addition, the rise in sedentary lifestyles and obesity is increasing the incidence of osteoarthritis among younger demographics, further contributing to market growth and creating new avenues for early intervention therapies and disease-modifying osteoarthritis drugs (DMOADs)
Restraint/Challenge
“High Development Costs and Limited Disease-Modifying Therapies”
- A significant challenge in the osteoarthritis therapeutics market is the limited availability of curative or disease-modifying treatments. Most current therapies are focused on symptom management, such as pain relief and inflammation control, rather than reversing or halting joint degeneration
- For instance, while biologics and stem cell-based therapies show promise, they often face high development costs, extended clinical trial timelines, and complex regulatory pathways, which delay market entry and limit widespread accessibility
- Despite growing investment, few DMOADs have received regulatory approval, and the lack of long-term efficacy data remains a concern. This slows innovation and restricts treatment options for advanced-stage patients seeking alternatives to joint replacement surgery
- Moreover, the cost burden of advanced therapeutics—including biologics, PRP (platelet-rich plasma) injections, and customized implants—can be prohibitive for patients, especially in low- and middle-income regions where healthcare reimbursement is limited
- To overcome these barriers, industry players must focus on streamlining R&D, securing faster regulatory approvals, and developing cost-effective treatment alternatives that can deliver structural benefits alongside symptomatic relief
- Greater collaboration between public and private stakeholders, along with advancements in biomarker identification and early-stage diagnostics, will be essential for the development of breakthrough therapies that can transform the current treatment landscape
Osteoarthritis Therapeutics Market Scope
The market is segmented on the basis of drug type, anatomy, route of administration, sales channel, and end-use.
• By Drug Type
On the basis of drug type, the osteoarthritis therapeutics market is segmented into viscosupplementation agents, nonsteroidal anti-inflammatory drugs, analgesics, corticosteroids, and others. The viscosupplementation agents segment dominated the largest market revenue share of 34.5% in 2024, driven by their role in improving joint lubrication and delaying the need for surgical intervention. These agents are particularly effective in treating knee osteoarthritis and are widely adopted due to their minimal side effects.
The nonsteroidal anti-inflammatory drugs segment is anticipated to witness the fastest growth rate of 9.4% CAGR from 2025 to 2032, attributed to their widespread availability over the counter and increasing demand for pain relief medication. Their affordability and effectiveness for mild to moderate symptoms make them a preferred choice in both developed and developing regions.
• By Anatomy
On the basis of anatomy, the osteoarthritis therapeutics market is segmented into knee osteoarthritis, hip osteoarthritis, hand osteoarthritis, and others. The knee osteoarthritis segment accounted for the largest market revenue share of 47.8% in 2024, due to the high prevalence of knee joint degeneration among the elderly and obese populations. The knee is the most commonly affected joint, and treatment advancements continue to support strong market demand.
The hip osteoarthritis segment is expected to register the fastest CAGR of 8.7% from 2025 to 2032, fueled by increasing aging demographics and rising surgical interventions such as hip replacement procedures.
• By Route of Administration
On the basis of route of administration, the osteoarthritis therapeutics market is segmented into parenteral route, topical route and oral route. The oral route segment held the largest market revenue share of 51.3% in 2024, due to the high convenience and compliance among patients for tablets and capsules. Oral NSAIDs and analgesics are commonly prescribed as first-line treatments.
The parenteral route is anticipated to grow at the fastest CAGR of 9.1% from 2025 to 2032, driven by the increased use of intra-articular injections such as hyaluronic acid and corticosteroids, which provide targeted relief and longer-lasting effects.
• By Sales Channel
On the basis of sales channel, the osteoarthritis therapeutics market is segmented into prescription drugs and over-the-counter drugs. The prescription drugs segment dominated the market with a revenue share of 64.2% in 2024, attributed to physician-prescribed medications for moderate to severe cases and post-operative management.
The over-the-counter drugs segment is projected to grow at the fastest CAGR of 8.9% from 2025 to 2032, owing to the increasing trend of self-medication, rising awareness, and easy availability of NSAIDs and topical pain relief products in pharmacies and retail outlets.
• By End-use
On the basis of end-use, the osteoarthritis therapeutics market is segmented into hospital pharmacies, retail pharmacies, and others. The hospital pharmacies segment held the largest market share of 46.5% in 2024, driven by high patient flow in hospitals, access to advanced injectable treatments, and physician supervision.
The retail pharmacies segment is expected to witness the fastest CAGR of 9.3% from 2025 to 2032, fueled by the increasing availability of OTC medications, expanding pharmacy chains, and the preference for purchasing chronic medications from neighborhood drugstores.
Osteoarthritis Therapeutics Market Regional Analysis
- North America dominated the osteoarthritis therapeutics market with the largest revenue share of 41.7% in 2024, driven by the rising prevalence of osteoarthritis, increasing elderly population, and the widespread availability of advanced treatment options
- The region benefits from well-established healthcare infrastructure, high patient awareness, and strong reimbursement frameworks
- Patients in North America increasingly opt for viscosupplementation, NSAIDs, and corticosteroids, with growing adoption of novel therapies, including regenerative and biological approaches. Furthermore, the rise in obesity and sedentary lifestyles contributes significantly to osteoarthritis incidence, reinforcing the demand for effective therapeutic solutions
U.S. Osteoarthritis Therapeutics Market Insight
The U.S. osteoarthritis therapeutics market captured the largest revenue share of 81% within North America in 2024, fueled by rapid uptake of innovative pharmacological therapies and the growing preference for personalized medicine. The U.S. leads in clinical trials, R&D investments, and approvals for next-generation therapies, supported by the presence of major pharmaceutical players. Moreover, the country’s aging population and increasing number of patients undergoing joint replacement surgeries have driven the demand for both symptomatic and disease-modifying treatments. The availability of over-the-counter pain relievers and strong physician recommendations further bolster the market.
Europe Osteoarthritis Therapeutics Market Insight
The Europe osteoarthritis therapeutics market is projected to expand at a robust CAGR of 8.6% from 2025 to 2032, primarily driven by an aging demographic and rising awareness of early intervention strategies. Countries across Europe are seeing increasing uptake of topical and oral NSAIDs, along with viscosupplementation treatments. Public healthcare initiatives aimed at reducing disability caused by osteoarthritis, combined with supportive reimbursement policies, are promoting adoption. In addition, patient education and non-invasive therapies are gaining popularity across outpatient and homecare settings.
U.K. Osteoarthritis Therapeutics Market Insight
The U.K. osteoarthritis therapeutics market is anticipated to grow at a CAGR of 8.9% from 2025 to 2032, driven by rising demand for non-surgical pain management and government focus on improving access to primary healthcare. The National Health Service (NHS) plays a pivotal role in delivering osteoarthritis care, often encouraging the use of analgesics and physical therapy in early stages. Growing emphasis on reducing joint replacement surgery burden is also increasing reliance on pharmacological therapeutics and early-stage interventions.
Germany Osteoarthritis Therapeutics Market Insight
The Germany osteoarthritis therapeutics market is expected to expand at a CAGR of 8.4% from 2025 to 2032, supported by increasing diagnosis rates and the adoption of biologic therapies for advanced cases. Germany's highly developed healthcare system and the availability of advanced intra-articular injections are driving market growth. In addition, rising awareness campaigns by healthcare organizations and patient support groups are promoting earlier treatment initiation and improved medication adherence.
Asia-Pacific Osteoarthritis Therapeutics Market Insight
The Asia-Pacific osteoarthritis therapeutics market is poised to grow at the fastest CAGR of 9.6% from 2025 to 2032, driven by a combination of aging populations, increasing joint disorders, and healthcare infrastructure development in emerging economies. Countries such as China, Japan, and India are witnessing increasing osteoarthritis diagnoses, with growing use of NSAIDs, corticosteroids, and hyaluronic acid injections. Government health programs and expanding pharmaceutical manufacturing capacities are making treatments more affordable and accessible to larger patient pools across the region.
Japan Osteoarthritis Therapeutics Market Insight
The Japan osteoarthritis therapeutics market is gaining momentum, projected to grow at a CAGR of 10.3% from 2025 to 2032, owing to the country’s rapidly aging population and strong emphasis on geriatric care. Japanese patients favor minimally invasive treatments, including oral and topical NSAIDs. There is a significant push for innovation in cartilage regeneration and joint preservation techniques. Integration of traditional and modern medicine, as well as high per capita health expenditure, supports further market development.
China Osteoarthritis Therapeutics Market Insight
China accounted for the largest market revenue share in Asia Pacific in 2024, contributing 36.5% of the regional revenue, driven by its massive patient base, increasing healthcare access, and investments in domestic drug manufacturing. The market is witnessing a surge in demand for affordable oral and injectable therapies. Rising health awareness, government-led elder care policies, and rapid expansion of hospital infrastructure are accelerating therapeutic adoption. Local pharmaceutical companies are also increasingly active in the osteoarthritis drug pipeline and biosimilar development.
Osteoarthritis Therapeutics Market Share
The osteoarthritis therapeutics industry is primarily led by well-established companies, including:
- Pfizer Inc. (U.S.)
- AbbVie Inc. (U.S.)
- Novartis AG (Switzerland)
- Amgen Inc. (U.S.)
- Boehringer Ingelheim International GmbH (Germany)
- Samsung Bioepis (South Korea)
- Merck & Co., Inc. (U.S.)
- Sun Pharmaceutical Industries Ltd. (India)
- Teva Pharmaceuticals Industries Ltd. (Israel)
- AstraZeneca (U.K.)
- Zimmer Biomet (U.S.)
- Stryker (U.S.)
- Enlivex Therapeutics Ltd. (Israel)
- Anika Therapeutics, Inc. (U.S.)
- Eupraxia Pharmaceuticals (Canada)
- Doron Therapeutics (U.S.)
Latest Developments in Global Osteoarthritis Therapeutics Market
- In April 2024, Eli Lilly and Company announced the launch of a new monoclonal antibody therapy targeting nerve growth factor (NGF) to manage moderate to severe osteoarthritis pain. This innovative therapy, developed in collaboration with a leading biotechnology firm, aims to provide long-lasting pain relief without the adverse effects commonly associated with NSAIDs and opioids, positioning Lilly at the forefront of next-generation osteoarthritis treatment
- In March 2024, Pfizer Inc. initiated Phase III clinical trials for its investigational disease-modifying osteoarthritis drug (DMOAD), designed to slow cartilage degeneration in patients with knee osteoarthritis. This development aligns with the growing global focus on regenerative approaches and personalized medicine in chronic joint conditions
- In February 2024, Johnson & Johnson’s Janssen Pharmaceuticals division received FDA Fast Track designation for its small-molecule inhibitor aimed at halting osteoarthritis progression. The drug targets inflammatory pathways implicated in cartilage breakdown, marking a major advancement in modifying disease progression beyond symptomatic relief
- In January 2024, Sanofi and Regeneron expanded their collaboration to evaluate the potential of Dupilumab in treating osteoarthritis-related inflammation and pain. Preliminary studies demonstrated promising results in reducing joint stiffness and improving mobility, opening new therapeutic possibilities for patients unresponsive to traditional treatments
- In December 2023, GlaxoSmithKline (GSK) launched a novel topical analgesic gel incorporating nanotechnology for enhanced penetration and sustained pain relief. This product, developed for over-the-counter use, is tailored to improve the quality of life for patients with early-stage osteoarthritis and has seen strong market uptake across Europe and Asia-Pacific
SKU-

- Interactive Data Analysis Dashboard
- Company Analysis Dashboard for high growth potential opportunities
- Research Analyst Access for customization & queries
- Competitor Analysis with Interactive dashboard
- Latest News, Updates & Trend analysis
- Harness the Power of Benchmark Analysis for Comprehensive Competitor Tracking
Table of Content
1 INTRODUCTION
1.1 OBJECTIVES OF THE STUDY
1.2 MARKET DEFINITION
1.3 OVERVIEW OF GLOBAL OSTEOARTHRITIS THERAPEUTICS MARKET
1.4 CURRENCY AND PRICING
1.5 LIMITATION
1.6 MARKETS COVERED
2 MARKET SEGMENTATION
2.1 KEY TAKEAWAYS
2.2 ARRIVING AT THE GLOBAL OSTEOARTHRITIS THERAPEUTICS MARKET SIZE
2.2.1 VENDOR POSITIONING GRID
2.2.2 TECHNOLOGY LIFE LINE CURVE
2.2.3 TRIPOD DATA VALIDATION MODEL
2.2.4 MARKET GUIDE
2.2.5 MULTIVARIATE MODELLING
2.2.6 TOP TO BOTTOM ANALYSIS
2.2.7 CHALLENGE MATRIX
2.2.8 APPLICATION COVERAGE GRID
2.2.9 STANDARDS OF MEASUREMENT
2.2.10 VENDOR SHARE ANALYSIS
2.2.11 EPIDEMIOLOGY
2.2.12 DATA POINTS FROM KEY PRIMARY INTERVIEWS
2.2.13 DATA POINTS FROM KEY SECONDARY DATABASES
2.3 GLOBAL OSTEOARTHRITIS THERAPEUTICS MARKET: RESEARCH SNAPSHOT
2.4 ASSUMPTIONS
3 MARKET OVERVIEW
3.1 DRIVERS
3.2 RESTRAINTS
3.3 OPPORTUNITIES
3.4 CHALLENGES
4 EXECUTIVE SUMMARY
5 PREMIUM INSIGHTS
5.1 PESTEL ANALYSIS
5.2 PORTER’S FIVE FORCES MODEL
6 INDUSTRY INSIGHTS
6.1 PATENT ANALYSIS
6.1.1 PATENT LANDSCAPE
6.1.2 USPTO NUMBER
6.1.3 PATENT EXPIRY
6.1.4 EPIO NUMBER
6.1.5 PATENT STRENGTH AND QUALITY
6.1.6 PATENT CLAIMS
6.1.7 PATENT CITATIONS
6.1.8 PATENT LITIGATION AND LICENSING
6.1.9 FILE OF PATENT
6.1.10 PATENT RECEIVED CONTRIES
6.1.11 TECHNOLOGY BACKGROUND
6.2 DRUG TREATMENT RATE BY MATURED MARKETS
6.3 DEMOGRAPHIC TRENDS: IMPACTS ON ALL INCIDENCE RATES
6.4 PATIENT FLOW DIAGRAM
6.5 KEY PRICING STRATEGIES
6.6 KEY PATIENT ENROLLMENT STRATEGIES
6.7 INTERVIEWS WITH SPECIALIST
6.8 OTHER KOL SNAPSHOTS
7 EPIDEMIOLOGY
7.1 INCIDENCE OF ALL BY GENDER
7.2 TREATMENT RATE
7.3 MORTALITY RATE
7.4 DRUG ADHERENCE AND THERAPY SWITCH MODEL
7.5 PATIENT TREATMENT SUCCESS RATES
8 MERGERS AND ACQUISITION
8.1 LICENSING
8.2 COMMERCIALIZATION AGREEMENTS
9 REGULATORY FRAMEWORK
9.1 REGULATORY APPROVAL PROCESS
9.2 GEOGRAPHIES’ EASE OF REGULATORY APPROVAL
9.3 REGULATORY APPROVAL PATHWAYS
9.4 LICENSING AND REGISTRATION
9.5 POST-MARKETING SURVEILLANCE
9.6 GOOD MANUFACTURING PRACTICES (GMPS) GUIDELINES
10 PIPELINE ANALYSIS
10.1 CLINICAL TRIALS AND PHASE ANALYSIS
10.2 DRUG THERAPY PIPELINE
10.3 PHASE III CANDIDATES
10.4 PHASE II CANDIDATES
10.5 PHASE I CANDIDATES
10.6 OTHERS (PRE-CLINICAL AND RESEARCH)
TABLE 1 GLOBAL CLINICAL TRIAL MARKET FOR OSTEOARTHRITIS THERAPEUTICS MARKET
Company Name Therapeutic Area
XX XX
XX XX
XX XX
XX XX
XX XX
XX XX
Sources: Press Releases, Annual Reports, SEC Filings, Investor Presentations, Other Government Sources, Analysis Based on Inputs from Secondary, Expert Interviews
TABLE 2 DISTRIBUTION OF PRODUCTS AND PROJECTS BY PHASE OSTEOARTHRITIS THERAPEUTICS MARKET
Phase Number of Projects
Preclinical/Research Projects XX
Clinical Development XX
Phase I XX
Phase II XX
Phase III XX
U.S. Filed/Approved But Not Yet Marketed XX
Total XX
Sources: Press Releases, Annual Reports, SEC Filings, Investor Presentations, Other Government Sources, Analysis Based on Inputs from Secondary, Expert Interviews
TABLE 3 DISTRIBUTION OF PROJECTS BY THERAPEUTIC AREA AND PHASE OSTEOARTHRITIS THERAPEUTICS MARKET
Therapeutic Area Preclinical/ Research Project
XX XX
XX XX
XX XX
XX XX
XX XX
Total Projects XX
Sources: Press Releases, Annual Reports, SEC Filings, Investor Presentations, Other Government Sources, Analysis Based on Inputs from Secondary, Expert Interviews
TABLE 4 DISTRIBUTION OF PROJECTS BY SCIENTIFIC APPROACH AND PHASE OSTEOARTHRITIS THERAPEUTICS MARKET
Technology Preclinical/ Research Project
XX XX
XX XX
XX XX
XX XX
XX XX
Total Projects XX
Sources: Press Releases, Annual Reports, SEC Filings, Investor Presentations, Other Government Sources, Analysis Based on Inputs from Secondary, Expert Interviews
FIGURE 1 TOP ENTITIES BASED ON R&D GLANCE FOR OSTEOARTHRITIS THERAPEUTICS MARKET
Sources: Press Releases, Annual Reports, SEC Filings, Investor Presentations, Other Government Sources, Analysis Based on Inputs from Secondary, Expert Interviews
11 MARKETED DRUG ANALYSIS
11.1 DRUG
11.1.1 BRAND NAME
11.1.2 GENERICS NAME
11.2 THERAPEUTIC INDICTION
11.3 PHARMACOLOGICAL CLASS OF THE DRUG
11.4 DRUG PRIMARY INDICATION
11.5 MARKET STATUS
11.6 MEDICATION TYPE
11.7 DRUG DOSAGES FORM
11.8 DOSAGES AVAILABILITY
11.9 DRUG ROUTE OF ADMINISTRATION
11.1 DOSING FREQUENCY
11.11 DRUG INSIGHT
11.12 AN OVERVIEW OF THE DRUG DEVELOPMENT ACTIVITIES SUCH AS REGULATORY MILSTONE, SAFETY DATA AND EFFICACY DATA, MARKET EXCLUSIVITY DATA.
11.12.1 FORECAST MARKET OUTLOOK
11.12.2 CROSS COMPETITION
11.12.3 THERAPEUTIC PORTFOLIO
11.12.4 CURRENT DEVELOPMENT SCENARIO
12 MARKET ACCESS
12.1 10-YEAR MARKET FORECAST
12.2 CLINICAL TRIAL RECENT UPDATES
12.3 ANNUAL NEW FDA APPROVED DRUGS
12.4 DRUGS MANUFACTURER AND DEALS
12.5 MAJOR DRUG UPTAKE
12.6 CURRENT TREATMENT PRACTICES
12.7 IMPACT OF UPCOMING THERAPY
13 R & D ANALYSIS
13.1 COMPARATIVE ANALYSIS
13.2 DRUG DEVELOPMENTAL LANDSCAPE
13.3 IN-DEPTH INSIGHTS ON REGULATORY MILESTONES
13.4 THERAPEUTIC ASSESSMENT
13.5 ASSET-BASED COLLABORATIONS AND PARTNERSHIPS
14 MARKET OVERVIEW
14.1 DRIVERS
14.2 RESTRAINTS
14.3 OPPORTUNITIES
14.4 CHALLENGES
15 GLOBAL OSTEOARTHRITIS THERAPEUTICS MARKET, BY ANATOMY
15.1 OVERVIEW
15.2 KNEE
15.3 HIP
15.4 HAND
15.5 SMALL JOINTS (FOOT & ANKLE AND WRIST )
15.6 OTHERS
16 GLOBAL OSTEOARTHRITIS THERAPEUTICS MARKET, BY TYPE
16.1 (MARKET VALUE , VOLUME AND AVERAGE SELLING PRICE FOR EACH SUBSEGMENT OF THIS SEGMENT WILL BE PROVIDED)
16.2 OVERVIEW
16.3 MEDICATION
16.3.1 MARKETED DRUGS
16.3.1.1. ANALGESICS
16.3.1.1.1. ACETAMINOPHEN
16.3.1.1.2. OPIOIDS
16.3.1.1.2.1 CO-CODAMOL
16.3.1.1.2.2 OXYCODONE
16.3.1.1.2.3 TRAMADOL
16.3.1.1.2.4 PROPOXYPHENE
16.3.1.1.2.5 OTHERS
16.3.1.2. NONSTEROIDAL ANTI-INFLAMMATORY DRUGS (NSAIDS)
16.3.1.2.1. CELECOXIB
16.3.1.2.2. PIROXICAM
16.3.1.2.3. IBUPROFEN
16.3.1.2.4. NAPROXEN
16.3.1.2.5. DICLOFENAC
16.3.1.2.5.1 PARENTERAL
16.3.1.2.5.2 ORAL
16.3.1.2.5.2.1. 50 MG
16.3.1.2.5.2.2. 75 MG
16.3.1.2.5.2.3. 100 MG
16.3.1.2.5.2.4. OTHERS
16.3.1.2.5.3 TOPICAL
16.3.1.2.5.3.1. 1.5% TOPICAL
16.3.1.2.5.3.2. 2% TOPICAL
16.3.1.2.5.3.3. OTHERS
16.3.1.2.6. DULOXETINE
16.3.1.2.7. ASPIRIN
16.3.1.2.8. OTHERS
16.3.1.3. COUNTERIRRITANTS
16.3.1.3.1. MENTHOL
16.3.1.3.2. LIDOCAINE
16.3.1.3.3. OTHERS
16.3.1.4. CALCIUM CHANNEL BLOCKER/COX-2 INHIBITOR COMBINATION
16.3.1.4.1. CELECOXIB/AMLODIPINE
16.3.1.4.2. CONSENSI
16.3.1.4.3. OTHERS
16.3.1.5. ANTIDEPRESSANTS
16.3.1.5.1. DULOXETINE
16.3.1.5.2. CYMBALTA
16.3.1.5.3. OTHERS
16.3.1.6. ANALGESIC
16.3.1.6.1. CAPSAICIN
16.3.1.6.2. QUTENZA
16.3.1.6.3. OTHERS
16.3.1.7. CORTICOSTEROIDS/ TRIAMCINOLONE ACETONIDE
16.3.1.7.1. METHYLPREDNISOLONE
16.3.1.7.2. KENALOG 40
16.3.1.7.3. ZILRETTA
16.3.1.7.4. BETAMETHASONE
16.3.1.7.5. OTHERS
16.3.1.8. ANTIRRHEUMATIC
16.3.1.8.1. EUFLEXXA
16.3.1.8.2. HYALGAN
16.3.1.8.3. ORTHOVISC
16.3.1.8.4. SUPARTZ
16.3.1.8.5. SYNVISC
16.3.1.8.6. SYNVISC-ONE
16.3.1.9. SKELETAL MUSCLE RELAXANTS
16.3.1.9.1. CARISOPRODOL
16.3.1.9.2. DANTROLENE
16.3.1.9.3. BACLOFEN
16.3.1.9.4. OTHERS
16.3.1.10. HYALURONIC ACID
16.3.1.11. PLATELET-RICH PLASMA (PRP)
16.3.1.12. OTHERS
16.3.2 PIPELINE DRUGS
16.3.2.1. APC201
16.3.2.2. GNSC-001
16.3.2.3. 4P004
16.3.2.4. DFV890
16.3.2.5. EP-104IAR
16.3.2.6. OTHERS
16.4 THERAPY
16.4.1 PHYSICAL THERAPY
16.4.2 OCCUPATIONAL THERAPY
16.4.3 TRANSCUTANEOUS ELECTRICAL NERVE STIMULATION (TENS)
16.4.4 OTHERS
16.5 SURGICAL PROCEDURES
16.5.1 BONE REALIGNMENT (OSTEOTOMY)
16.5.2 BONE FUSION (ARTHRODESIS)
16.5.3 JOINT REPLACEMENT SURGERY
16.5.4 ARTHROSCOPIC SURGERY
16.5.5 OTHERS
16.6 OTHERS
17 GLOBAL OSTEOARTHRITIS TREATMENT MEDICATION MARKET, BY DRUG TYPE
17.1 OVERVIEW
17.2 BRANDED
17.2.1 EUFLEXXA
17.2.2 SUPARTZ FX
17.2.3 MONOVISC
17.2.4 ZILRETTA
17.2.5 NAPRELAN
17.2.6 DUEXIS
17.2.7 OTHERS
17.3 GENERICS
18 GLOBAL OSTEOARTHRITIS TREATMENT MEDICATION MARKET, BY ROUTE OF ADMINISTRATION
18.1 OVERVIEW
18.2 ORAL
18.2.1 TABLETS
18.2.2 CAPSULES
18.2.3 OTHERS
18.3 TOPICAL
18.3.1 CREAMS
18.3.2 GELS
18.3.3 SOLUTION
18.3.4 OTHERS
18.4 PARENTERAL
18.4.1 SUBCUTANEOUS
18.4.2 INTRA-ARTICULAR
18.4.3 OTHERS
18.5 OTHERS
19 GLOBAL OSTEOARTHRITIS TREATMENT MEDICATION MARKET, BY MODE OF PURCHASE
19.1 OVERVIEW
19.2 PRESCRIPTION
19.3 OVER THE COUNTER (OTC)
20 GLOBAL OSTEOARTHRITIS THERAPEUTICS MARKET, BY POPULATION TYPE
20.1 OVERVIEW
20.2 PEDIATRIC
20.3 ADULTS
20.4 GERIATRIC
21 GLOBAL OSTEOARTHRITIS THERAPEUTICS MARKET, BY END USER
21.1 OVERVIEW
21.2 HOSPITALS
21.2.1 BY TYPE
21.2.1.1. PUBLIC
21.2.1.2. PRIVATE
21.2.2 BY LEVEL
21.2.2.1. TIER 1
21.2.2.2. TIER 2
21.2.2.3. TIER 3
21.3 SPECIALTY CLINICS
21.4 HOME HEALTHCARE
21.5 AMBULATORY SURGICAL CENTERS
21.6 OTHERS
22 GLOBAL OSTEOARTHRITIS THERAPEUTICS MARKET, BY DISTRIBUTION CHANNEL
22.1 OVERVIEW
22.2 DIRECT TENDER
22.3 RETAIL SALES
22.3.1 ONLINE
22.3.1.1. E-STORES
22.3.1.2. COMPANY WEBSITE
22.3.1.3. OTHERS
22.3.2 OFFLINE
22.3.2.1. HOSPITAL PHARMACY
22.3.2.2. MEDICINE STORES
22.3.2.3. OTHERS
22.4 OTHERS
23 GLOBAL OSTEOARTHRITIS THERAPEUTICS MARKET, COMPANY LANDSCAPE
23.1 COMPANY SHARE ANALYSIS: GLOBAL
23.2 MERGERS & ACQUISITIONS
23.3 NEW PRODUCT DEVELOPMENT & APPROVALS
23.4 EXPANSIONS
23.5 REGULATORY CHANGES
23.6 PARTNERSHIP AND OTHER STRATEGIC DEVELOPMENTS
24 GLOBAL OSTEOARTHRITIS THERAPEUTICS MARKET, BY GEOGRAPHY
24.1 GLOBAL OSTEOARTHRITIS THERAPEUTICS MARKET, (ALL SEGMENTATION PROVIDED ABOVE IS REPRESENTED IN THIS CHAPTER BY COUNTRY)
24.1.1 NORTH AMERICA
24.1.1.1. U.S.
24.1.1.2. CANADA
24.1.1.3. MEXICO
24.1.2 EUROPE
24.1.2.1. GERMANY
24.1.2.2. FRANCE
24.1.2.3. U.K.
24.1.2.4. HUNGARY
24.1.2.5. LITHUANIA
24.1.2.6. AUSTRIA
24.1.2.7. IRELAND
24.1.2.8. NORWAY
24.1.2.9. POLAND
24.1.2.10. ITALY
24.1.2.11. SPAIN
24.1.2.12. RUSSIA
24.1.2.13. TURKEY
24.1.2.14. NETHERLANDS
24.1.2.15. SWITZERLAND
24.1.2.16. REST OF EUROPE
24.1.3 ASIA-PACIFIC
24.1.3.1. JAPAN
24.1.3.2. CHINA
24.1.3.3. SOUTH KOREA
24.1.3.4. INDIA
24.1.3.5. AUSTRALIA
24.1.3.6. SINGAPORE
24.1.3.7. THAILAND
24.1.3.8. MALAYSIA
24.1.3.9. INDONESIA
24.1.3.10. PHILIPPINES
24.1.3.11. VIETNAM
24.1.3.12. REST OF ASIA-PACIFIC
24.1.4 SOUTH AMERICA
24.1.4.1. BRAZIL
24.1.4.2. ARGENTINA
24.1.4.3. PERU
24.1.4.4. REST OF SOUTH AMERICA
24.1.5 MIDDLE EAST AND AFRICA
24.1.5.1. SOUTH AFRICA
24.1.5.2. SAUDI ARABIA
24.1.5.3. UAE
24.1.5.4. EGYPT
24.1.5.5. KUWAIT
24.1.5.6. ISRAEL
24.1.5.7. REST OF MIDDLE EAST AND AFRICA
24.1.6 KEY PRIMARY INSIGHTS: BY MAJOR COUNTRIES
25 GLOBAL OSTEOARTHRITIS THERAPEUTICS MARKET, SWOT AND DBMR ANALYSIS
26 GLOBAL OSTEOARTHRITIS THERAPEUTICS MARKET, COMPANY PROFILE
26.1 MARKETED DRUG MANUFRACTURE
26.1.1 FERRING B.V.
26.1.1.1. COMPANY OVERVIEW
26.1.1.2. REVENUE ANALYSIS
26.1.1.3. GEOGRAPHIC PRESENCE
26.1.1.4. PRODUCT PORTFOLIO
26.1.1.5. RECENT DEVELOPMENTS
26.1.2 BIOVENTUS
26.1.2.1. COMPANY OVERVIEW
26.1.2.2. REVENUE ANALYSIS
26.1.2.3. GEOGRAPHIC PRESENCE
26.1.2.4. PRODUCT PORTFOLIO
26.1.2.5. RECENT DEVELOPMENTS
26.1.3 SANOFI-AVENTIS U.S. LLC, A SANOFI COMPANY
26.1.3.1. COMPANY OVERVIEW
26.1.3.2. REVENUE ANALYSIS
26.1.3.3. GEOGRAPHIC PRESENCE
26.1.3.4. PRODUCT PORTFOLIO
26.1.3.5. RECENT DEVELOPMENTS
26.1.4 FIDIA PHARMA USA INC.
26.1.4.1. COMPANY OVERVIEW
26.1.4.2. REVENUE ANALYSIS
26.1.4.3. GEOGRAPHIC PRESENCE
26.1.4.4. PRODUCT PORTFOLIO
26.1.4.5. RECENT DEVELOPMENTS
26.1.5 ANIKA THERAPEUTICS, INC.
26.1.5.1. COMPANY OVERVIEW
26.1.5.2. REVENUE ANALYSIS
26.1.5.3. GEOGRAPHIC PRESENCE
26.1.5.4. PRODUCT PORTFOLIO
26.1.5.5. RECENT DEVELOPMENTS
26.1.6 PFIZER INC.
26.1.6.1. COMPANY OVERVIEW
26.1.6.2. REVENUE ANALYSIS
26.1.6.3. GEOGRAPHIC PRESENCE
26.1.6.4. PRODUCT PORTFOLIO
26.1.6.5. RECENT DEVELOPMENTS
26.1.7 PERRIGO COMPANY PLC.
26.1.7.1. COMPANY OVERVIEW
26.1.7.2. REVENUE ANALYSIS
26.1.7.3. GEOGRAPHIC PRESENCE
26.1.7.4. PRODUCT PORTFOLIO
26.1.7.5. RECENT DEVELOPMENTS
26.1.8 TAJ PHARMA GROUP
26.1.8.1. COMPANY OVERVIEW
26.1.8.2. REVENUE ANALYSIS
26.1.8.3. GEOGRAPHIC PRESENCE
26.1.8.4. PRODUCT PORTFOLIO
26.1.8.5. RECENT DEVELOPMENTS
26.1.9 WELLONA PHARMA
26.1.9.1. COMPANY OVERVIEW
26.1.9.2. REVENUE ANALYSIS
26.1.9.3. GEOGRAPHIC PRESENCE
26.1.9.4. PRODUCT PORTFOLIO
26.1.9.5. RECENT DEVELOPMENTS
26.1.10 BASF CORPORATION
26.1.10.1. COMPANY OVERVIEW
26.1.10.2. REVENUE ANALYSIS
26.1.10.3. GEOGRAPHIC PRESENCE
26.1.10.4. PRODUCT PORTFOLIO
26.1.10.5. RECENT DEVELOPMENTS
26.1.11 ADVACARE PHARMA
26.1.11.1. COMPANY OVERVIEW
26.1.11.2. REVENUE ANALYSIS
26.1.11.3. GEOGRAPHIC PRESENCE
26.1.11.4. PRODUCT PORTFOLIO
26.1.11.5. RECENT DEVELOPMENTS
26.1.12 ZIMMER BIOMET
26.1.12.1. COMPANY OVERVIEW
26.1.12.2. REVENUE ANALYSIS
26.1.12.3. GEOGRAPHIC PRESENCE
26.1.12.4. PRODUCT PORTFOLIO
26.1.12.5. RECENT DEVELOPMENTS
26.1.13 SAPHNIX LIFE SCIENCES
26.1.13.1. COMPANY OVERVIEW
26.1.13.2. REVENUE ANALYSIS
26.1.13.3. GEOGRAPHIC PRESENCE
26.1.13.4. PRODUCT PORTFOLIO
26.1.13.5. RECENT DEVELOPMENTS
26.1.14 JANSSEN PHARMACEUTICALS, INC.
26.1.14.1. COMPANY OVERVIEW
26.1.14.2. REVENUE ANALYSIS
26.1.14.3. GEOGRAPHIC PRESENCE
26.1.14.4. PRODUCT PORTFOLIO
26.1.14.5. RECENT DEVELOPMENTS
26.1.15 AMNEAL PHARMACEUTICALS NY LLC
26.1.15.1. COMPANY OVERVIEW
26.1.15.2. REVENUE ANALYSIS
26.1.15.3. GEOGRAPHIC PRESENCE
26.1.15.4. PRODUCT PORTFOLIO
26.1.15.5. RECENT DEVELOPMENTS
26.1.16 APOTEX INC
26.1.16.1. COMPANY OVERVIEW
26.1.16.2. REVENUE ANALYSIS
26.1.16.3. GEOGRAPHIC PRESENCE
26.1.16.4. PRODUCT PORTFOLIO
26.1.16.5. RECENT DEVELOPMENTS
26.1.17 TEVA PHARMACEUTICALS USA, INC.
26.1.17.1. COMPANY OVERVIEW
26.1.17.2. REVENUE ANALYSIS
26.1.17.3. GEOGRAPHIC PRESENCE
26.1.17.4. PRODUCT PORTFOLIO
26.1.17.5. RECENT DEVELOPMENTS
26.1.18 MERCK SHARP & DOHME CORP., A SUBSIDIARY OF MERCK & CO., INC.
26.1.18.1. COMPANY OVERVIEW
26.1.18.2. REVENUE ANALYSIS
26.1.18.3. GEOGRAPHIC PRESENCE
26.1.18.4. PRODUCT PORTFOLIO
26.1.18.5. RECENT DEVELOPMENTS
26.1.19 KOLON TISSUEGENE, INC.
26.1.19.1. COMPANY OVERVIEW
26.1.19.2. REVENUE ANALYSIS
26.1.19.3. GEOGRAPHIC PRESENCE
26.1.19.4. PRODUCT PORTFOLIO
26.1.19.5. RECENT DEVELOPMENTS
26.1.20 AMPIO PHARMACEUTICALS INC.
26.1.20.1. COMPANY OVERVIEW
26.1.20.2. REVENUE ANALYSIS
26.1.20.3. GEOGRAPHIC PRESENCE
26.1.20.4. PRODUCT PORTFOLIO
26.1.20.5. RECENT DEVELOPMENTS
26.1.21 REGENERON PHARMACEUTICALS INC
26.1.21.1. COMPANY OVERVIEW
26.1.21.2. REVENUE ANALYSIS
26.1.21.3. GEOGRAPHIC PRESENCE
26.1.21.4. PRODUCT PORTFOLIO
26.1.21.5. RECENT DEVELOPMENTS
26.1.22 SMITH & NEPHEW
26.1.22.1. COMPANY OVERVIEW
26.1.22.2. REVENUE ANALYSIS
26.1.22.3. GEOGRAPHIC PRESENCE
26.1.22.4. PRODUCT PORTFOLIO
26.1.22.5. RECENT DEVELOPMENTS
26.1.23 PURDUE PHARMACEUTICALS L.P.
26.1.23.1. COMPANY OVERVIEW
26.1.23.2. REVENUE ANALYSIS
26.1.23.3. GEOGRAPHIC PRESENCE
26.1.23.4. PRODUCT PORTFOLIO
26.1.23.5. RECENT DEVELOPMENTS
26.1.24 BAYER AG
26.1.24.1. COMPANY OVERVIEW
26.1.24.2. REVENUE ANALYSIS
26.1.24.3. GEOGRAPHIC PRESENCE
26.1.24.4. PRODUCT PORTFOLIO
26.1.24.5. RECENT DEVELOPMENTS
26.1.25 BRISTOL LABORATORIES LTD
26.1.25.1. COMPANY OVERVIEW
26.1.25.2. GEOGRAPHIC PRESENCE
26.1.25.3. PRODUCT PORTFOLIO
26.1.25.4. RECENT DEVELOPMENTS
26.1.26 NOVARTIS AG
26.1.26.1. COMPANY OVERVIEW
26.1.26.2. REVENUE ANALYSIS
26.1.26.3. GEOGRAPHIC PRESENCE
26.1.26.4. PRODUCT PORTFOLIO
26.1.26.5. RECENT DEVELOPMENTS
26.1.27 LUPIN PHARMACEUTICALS, INC.
26.1.27.1. COMPANY OVERVIEW
26.1.27.2. REVENUE ANALYSIS
26.1.27.3. GEOGRAPHIC PRESENCE
26.1.27.4. PRODUCT PORTFOLIO
26.1.27.5. RECENT DEVELOPMENTS
26.1.28 GSK PLC.
26.1.28.1. COMPANY OVERVIEW
26.1.28.2. REVENUE ANALYSIS
26.1.28.3. GEOGRAPHIC PRESENCE
26.1.28.4. PRODUCT PORTFOLIO
26.1.28.5. RECENT DEVELOPMENTS
26.2 PIPELINE DRUG MANUFRACTURES
26.2.1 GENASCENCE
26.2.1.1. COMPANY OVERVIEW
26.2.1.2. REVENUE ANALYSIS
26.2.1.3. GEOGRAPHIC PRESENCE
26.2.1.4. PRODUCT PORTFOLIO
26.2.1.5. RECENT DEVELOPMENTS
26.2.2 4P PHARMA
26.2.2.1. COMPANY OVERVIEW
26.2.2.2. REVENUE ANALYSIS
26.2.2.3. GEOGRAPHIC PRESENCE
26.2.2.4. PRODUCT PORTFOLIO
26.2.2.5. RECENT DEVELOPMENTS
26.2.3 NOVARTIS AG
26.2.3.1. COMPANY OVERVIEW
26.2.3.2. REVENUE ANALYSIS
26.2.3.3. GEOGRAPHIC PRESENCE
26.2.3.4. PRODUCT PORTFOLIO
26.2.3.5. RECENT DEVELOPMENTS
26.2.4 BIOSPLICE THERAPEUTICS, INC.
26.2.4.1. COMPANY OVERVIEW
26.2.4.2. REVENUE ANALYSIS
26.2.4.3. GEOGRAPHIC PRESENCE
26.2.4.4. PRODUCT PORTFOLIO
26.2.4.5. RECENT DEVELOPMENTS
26.2.5 EUPRAXIA PHARMACEUTICALS
26.2.5.1. COMPANY OVERVIEW
26.2.5.2. REVENUE ANALYSIS
26.2.5.3. GEOGRAPHIC PRESENCE
26.2.5.4. PRODUCT PORTFOLIO
26.2.5.5. RECENT DEVELOPMENTS
26.2.6 ANDROS PHARMACEUTICALS CO., LTD
26.2.6.1. COMPANY OVERVIEW
26.2.6.2. REVENUE ANALYSIS
26.2.6.3. GEOGRAPHIC PRESENCE
26.2.6.4. PRODUCT PORTFOLIO
26.2.6.5. RECENT DEVELOPMENTS
NOTE: THE COMPANIES PROFILED IS NOT EXHAUSTIVE LIST AND IS AS PER OUR PREVIOUS CLIENT REQUIREMENT. WE PROFILE MORE THAN 100 COMPANIES IN OUR STUDY AND HENCE THE LIST OF COMPANIES CAN BE MODIFIED OR REPLACED ON REQUEST
27 RELATED REPORTS
28 CONCLUSION
29 QUESTIONNAIRE
30 ABOUT DATA BRIDGE MARKET RESEARCH
Data collection and base year analysis are done using data collection modules with large sample sizes. The stage includes obtaining market information or related data through various sources and strategies. It includes examining and planning all the data acquired from the past in advance. It likewise envelops the examination of information inconsistencies seen across different information sources. The market data is analysed and estimated using market statistical and coherent models. Also, market share analysis and key trend analysis are the major success factors in the market report. To know more, please request an analyst call or drop down your inquiry.
The key research methodology used by DBMR research team is data triangulation which involves data mining, analysis of the impact of data variables on the market and primary (industry expert) validation. Data models include Vendor Positioning Grid, Market Time Line Analysis, Market Overview and Guide, Company Positioning Grid, Patent Analysis, Pricing Analysis, Company Market Share Analysis, Standards of Measurement, Global versus Regional and Vendor Share Analysis. To know more about the research methodology, drop in an inquiry to speak to our industry experts.
Data Bridge Market Research is a leader in advanced formative research. We take pride in servicing our existing and new customers with data and analysis that match and suits their goal. The report can be customized to include price trend analysis of target brands understanding the market for additional countries (ask for the list of countries), clinical trial results data, literature review, refurbished market and product base analysis. Market analysis of target competitors can be analyzed from technology-based analysis to market portfolio strategies. We can add as many competitors that you require data about in the format and data style you are looking for. Our team of analysts can also provide you data in crude raw excel files pivot tables (Fact book) or can assist you in creating presentations from the data sets available in the report.


