
Global Paclitaxel Injection Market
Market Size in USD Billion
 USD
5.10 Billion
USD
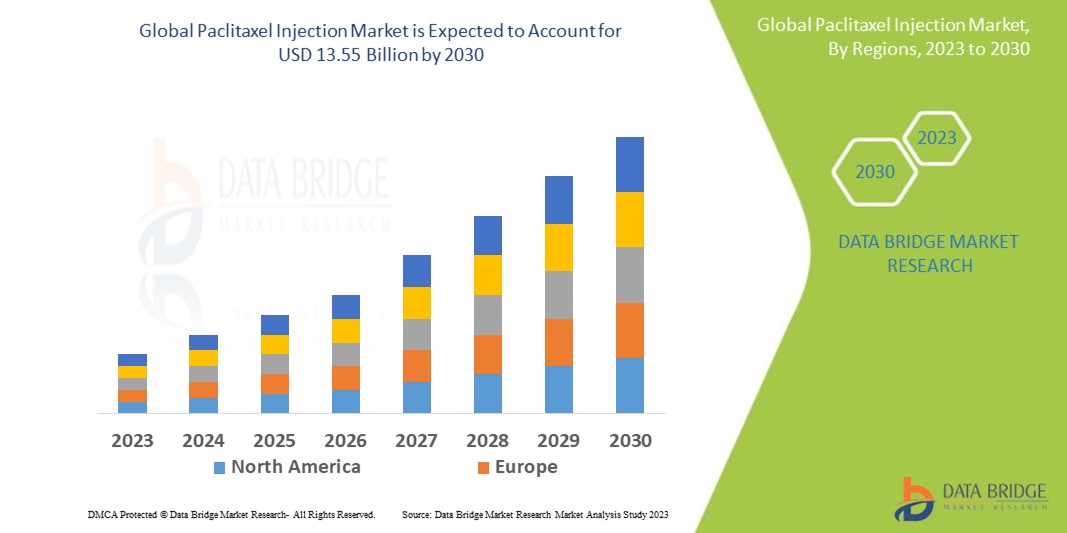
13.55 Billion
2022
2030
USD
5.10 Billion
USD
13.55 Billion
2022
2030
| 2023 - 2030 | |
| USD 5.10 Billion | |
| USD 13.55 Billion | |
| % | |
|
Paclitaxel Injection Market Analysis and Size
Rising tobacco and alcohol consumption, rising smoking prevalence, and a variety of other factors all contribute to an increase in the number of cancer cases worldwide. According to GLOBOCAN 2020, a cancer report produced by the International Agency for Research on Cancer, there were approximately 19.3 million new cases of cancer and approximately 10 million cancer deaths in the year 2020. One of the most important factors driving the growth of the paclitaxel injection market is the rising incidence of cancer. Taxol (paclitaxel) is a chemotherapy medication that inhibits the development of cancer cells and slows their growth and expansion in the body. It belongs to the class of drugs known as antineoplastics, and it prevents cancerous cell growth. Paclitaxel has a higher efficiency against cancer growth than other medications; additionally, paclitaxel injection is easily accessible in the market, which contributes to its high demand.
Data Bridge Market Research analyses that the paclitaxel injection market which is USD 5.10 billion in 2022, is expected to reach USD 13.55 billion by 2030, at a CAGR of 13.00% during the forecast period 2023 to 2030. In addition to the insights on market scenarios such as market value, growth rate, segmentation, geographical coverage, and major players, the market reports curated by the Data Bridge Market Research also include depth expert analysis, patient epidemiology, pipeline analysis, pricing analysis, and regulatory framework.
Paclitaxel Injection Market Scope and Segmentation
|
Report Metric |
Details |
|
Forecast Period |
2023 to 2030 |
|
Base Year |
2022 |
|
Historic Years |
2021 (Customizable to 2015 - 2020) |
|
Quantitative Units |
Revenue in USD Billion, Volumes in Units, Pricing in USD |
|
Segments Covered |
Indication (Breast Cancer, Cervical Cancer, Ovarian Cancer, Stomach Cancer, Prostate Cancer, Lungs Cancer, Esophageal Cancer, Testicular Cancer, Pancreatic Cancer, AIDS Related Kaposi’s Sarcoma, Others), End-User (Hospitals, Clinics, Cancer Research Institute) |
|
Countries Covered |
U.S., Canada and Mexico in North America, Germany, France, U.K., Netherlands, Switzerland, Belgium, Russia, Italy, Spain, Turkey, Rest of Europe in Europe, China, Japan, India, South Korea, Singapore, Malaysia, Australia, Thailand, Indonesia, Philippines, Rest of Asia-Pacific (APAC) in the Asia-Pacific (APAC), Saudi Arabia, U.A.E, South Africa, Egypt, Israel, Rest of Middle East and Africa (MEA) as a part of Middle East and Africa (MEA), Brazil, Argentina and Rest of South America as part of South America |
|
Market Players Covered |
Abbott (U.S.), Pfizer Inc. (U.S.), Fresenius SE & Co. KGaA (Germany), Strides Pharma Science Limited (India), Sagent Pharmaceuticals, Inc (U.S.), Bristol-Myers Squibb Company (U.S.), Taj Accura Pharmaceuticals Ltd (India), Khandelwal Laboratories Pvt.Ltd (India), Luye Pharma AG (China), Youcare Pharmaceutical Group Co., Ltd (China), Baisainuo (China), Novasep (France) and ONCOtherapeutics, Inc. (India) |
|
Market Opportunities |
|
Market Definition
Paclitaxel injection is a gelatinous drug derived from pacific yew trees through a chemical synthesis process. It is a sub-class of antineoplastic drugs used to treat cancers of the breast, lungs, ovaries, stomach, cervix, and other organs. Paclitaxel infection affects tubulin, a small globular protein found in human cells. It must be injected under the supervision of an oncologist with chemotherapy experience. Before prescribing this medication, the doctor should ensure that the patient does not have a high or low blood pressure problem. This injection has a number of side effects, including allergy, a decrease in WBC count, and blood pressure problems.
Paclitaxel Injection Market Dynamics
Drivers
- The rise in the number of cancer patients
One of the primary drivers of the paclitaxel injection market's growth is the increase in the number of cancer patients worldwide. According to WHO, cancer was the first or second leading cause of death for people under the age of 70 in 112 of the 183 countries studied in 2019. Furthermore, it was the third or fourth leading cause in the rest of the world.
The increased use of tobacco and alcohol is leading to an increase in the number of cancer patients worldwide. The rise in cancer cancers is expected to increase demand for paclitaxel injections because paclitaxel is a key drug used to treat cancer patients.
- Surging investments in healthcare infrastructure and spending
Increased investment, particularly by governments, is one of the primary drivers of market growth. According to a study conducted by the Peter G. Peterson Foundation, healthcare spending in the United States has increased significantly. National healthcare spending is expected to reach USD 6.2 trillion by the end of 2028. Furthermore, the American Medical Association predicts that US healthcare spending will rise 9.7% to USD 4.1 trillion in 2020. This rate of growth is significantly higher than the 4.3% forecast for 2019. These are the certain factors which propel the market growth.
Opportunities
- Increased prevalence of breast cancer
The increased prevalence of breast cancer in females is propelling the paclitaxel injection market forward. According to the International Agency for Research on Cancer, breast cancer has surpassed lung cancer as the most common type of cancer diagnosed. Furthermore, breast cancer will account for 11.7 percent of all new cancer cases in 2020. As a result, the prevalence of breast cancer is expected to rise further, as will public awareness of the efficacy of paclitaxel injection in the treatment of the disease.
Restraints/Challenges
- Rising side effects associated to paclitaxel injection
Rising adverse effects such as blood clots, allergy, leucopenia, diarrhoea, and weight loss, as well as the high cost of the drug, which is less affordable in low-income countries, are major factors acting as restraints and will further challenge the paclitaxel injection market during the forecast period.
This paclitaxel injection market report provides details of new recent developments, trade regulations, import-export analysis, production analysis, value chain optimization, market share, impact of domestic and localized market players, analyses opportunities in terms of emerging revenue pockets, changes in market regulations, strategic market growth analysis, market size, category market growths, application niches and dominance, product approvals, product launches, geographic expansions, technological innovations in the market. To gain more info on the paclitaxel injection market contact Data Bridge Market Research for an Analyst Brief, our team will help you take an informed market decision to achieve market growth.
COVID-19 Impact on the Paclitaxel Injection Market
The COVID-19 pandemic negatively impacts the availability of surgical care for millions of patients worldwide. COVID-19 has a wide-ranging impact on operating practise, affecting everything from staffing and workforce issues to procedural arrangements, intra-operative viral transmission risk, and perioperative preparation fluctuations. As a result of the pandemic, affected individuals are being denied operating access, with undefined loss of function and the risk of an adverse diagnosis. Individuals with cancer are thought to be at a higher risk of developing severe complications from the SARS CoV2, and treatment delays can result in worse oncological outcomes. Proper planning is thus required to deal with cancer treatment facilities while avoiding the risk of contamination to patients and staff.
Recent Developments
- In 2019, Celgene Corporation announced updates for ABRAXANE in the initial phase of treating pancreatic cancer and metastatic triple-negative breast cancer.
- In 2019, Sun Pharma Advanced Research Company Ltd. announced that Abraxis Bioscience had withdrawn its claims of infringement overpaclitaxel injection concentration for suspension.
- In 2022, ProPhase Labs, Inc. established BioPharma, Inc. as a wholly-owned subsidiary Furthermore, ProPhase BioPharma, Inc. (PBIO) and Global BioLife, Inc. have signed a licence agreement for the Linebacker portfolio (LB-1 and LB-2), two patented small molecule PIM kinase inhibitors with significant promise across numerous therapeutic indications. The company's initial focus will be on co-therapy for paclitaxel.
Global Paclitaxel Injection Market Scope
The paclitaxel injection market is segmented on the basis of indication and end-user. The growth amongst these segments will help you analyze meagre growth segments in the industries and provide the users with a valuable market overview and market insights to help them make strategic decisions for identifying core market applications.
Indication
- Breast Cancer
- Cervical Cancer
- Ovarian Cancer
- Stomach Cancer
- Prostate Cancer
- Lungs Cancer
- Esophageal Cancer
- Testicular Cancer
- Pancreatic Cancer
- AIDS Related Kaposi’s Sarcoma
- Others
End-User
- Hospitals
- Clinics
- Cancer Research Institute
Paclitaxel Injection Market Regional Analysis/Insights
The paclitaxel injection market is analyzed and market size insights and trends are provided by country, indication and end-user as referenced above.
The countries covered in the paclitaxel injection market report are U.S., Canada and Mexico in North America, Germany, France, U.K., Netherlands, Switzerland, Belgium, Russia, Italy, Spain, Turkey, Rest of Europe in Europe, China, Japan, India, South Korea, Singapore, Malaysia, Australia, Thailand, Indonesia, Philippines, Rest of Asia-Pacific (APAC) in the Asia-Pacific (APAC), Saudi Arabia, U.A.E, South Africa, Egypt, Israel, Rest of Middle East and Africa (MEA) as a part of Middle East and Africa (MEA), Brazil, Argentina and Rest of South America as part of South America.
North America dominates the paclitaxel injection market due to high prevalence of breast cancer and stomach cancer and improved efficacy of paclitaxel injections in this region.
Asia-Pacific is expected to grow at the highest growth rate in the forecast period of 2023 to 2030 because of the high population and increasing fundamental benefits of paclitaxel injection, quick results are expected in this region.
The country section of the report also provides individual market impacting factors and changes in regulation in the market domestically that impacts the current and future trends of the market. Data points like down-stream and upstream value chain analysis, technical trends and porter's five forces analysis, case studies are some of the pointers used to forecast the market scenario for individual countries. Also, the presence and availability of global brands and their challenges faced due to large or scarce competition from local and domestic brands, impact of domestic tariffs and trade routes are considered while providing forecast analysis of the country data.
Competitive Landscape and Paclitaxel Injection Market Share Analysis
The paclitaxel injection market competitive landscape provides details by competitor. Details included are company overview, company financials, revenue generated, market potential, investment in research and development, new market initiatives, global presence, production sites and facilities, production capacities, company strengths and weaknesses, product launch, product width and breadth, application dominance. The above data points provided are only related to the companies' focus related to paclitaxel injection market.
Some of the major players operating in the paclitaxel injection market are:
- Abbott (U.S.)
- Pfizer Inc. (U.S.)
- Fresenius SE & Co. KGaA (Germany)
- Strides Pharma Science Limited (India)
- Sagent Pharmaceuticals, Inc (U.S.)
- Bristol-Myers Squibb Company (U.S.)
- Taj Accura Pharmaceuticals Ltd (India)
- Khandelwal Laboratories Pvt. Ltd (India)
- Luye Pharma AG (China)
- Youcare Pharmaceutical Group Co., Ltd (China)
- Baisainuo (China)
- Novasep (France)
- ONCOtherapeutics, Inc. (India)
SKU-

- Interactive Data Analysis Dashboard
- Company Analysis Dashboard for high growth potential opportunities
- Research Analyst Access for customization & queries
- Competitor Analysis with Interactive dashboard
- Latest News, Updates & Trend analysis
- Harness the Power of Benchmark Analysis for Comprehensive Competitor Tracking
Table of Content
1 INTRODUCTION
1.1 OBJECTIVES OF THE STUDY
1.2 MARKET DEFINITION
1.3 OVERVIEW OF GLOBAL PACLITAXEL INJECTION MARKET
1.4 CURRENCY AND PRICING
1.5 LIMITATION
1.6 MARKETS COVERED
2 MARKET SEGMENTATION
2.1 KEY TAKEAWAYS
2.2 ARRIVING AT THE GLOBAL PACLITAXEL INJECTION SIZE
2.2.1 VENDOR POSITIONING GRID
2.2.2 TECHNOLOGY LIFE LINE CURVE
2.2.3 TRIPOD DATA VALIDATION MODEL
2.2.4 MARKET GUIDE
2.2.5 MULTIVARIATE MODELLING
2.2.6 TOP TO BOTTOM ANALYSIS
2.2.7 CHALLENGE MATRIX
2.2.8 APPLICATION COVERAGE GRID
2.2.9 STANDARDS OF MEASUREMENT
2.2.10 VENDOR SHARE ANALYSIS
2.2.11 DATA POINTS FROM KEY PRIMARY INTERVIEWS
2.2.12 DATA POINTS FROM KEY SECONDARY DATABASES
2.3 GLOBAL PACLITAXEL INJECTION MARKET: RESEARCH SNAPSHOT
2.4 ASSUMPTIONS
3 EXECUTIVE SUMMARY
4 PREMIUM INSIGHTS
4.1 PESTEL ANALYSIS
4.2 PORTER’S FIVE FORCES MODEL
5 INDUSTRY INSIGHTS
5.1 PATENT ANALYSIS
5.1.1 PATENT LANDSCAPE
5.1.2 USPTO NUMBER
5.1.3 PATENT EXPIRY
5.1.4 EPIO NUMBER
5.1.5 PATENT STRENGTH AND QUALITY
5.1.6 PATENT CLAIMS
5.1.7 PATENT CITATIONS
5.1.8 PATENT LITIGATION AND LICENSING
5.1.9 FILE OF PATENT
5.1.10 PATENT RECEIVED CONTRIES
5.1.11 TECHNOLOGY BACKGROUND
5.2 DRUG TREATMENT RATE BY MATURED MARKETS
5.3 DEMOGRAPHIC TRENDS: IMPACTS ON ALL INCIDENCE RATES
5.4 PATIENT FLOW DIAGRAM
5.5 KEY PRICING STRATEGIES
5.6 KEY PATIENT ENROLLMENT STRATEGIES
5.7 INTERVIEWS WITH SPECIALIST
5.8 OTHER KOL SNAPSHOTS
6 EPIDEMIOLOGY
6.1 INCIDENCE OF ALL BY GENDER
6.2 TREATMENT RATE
6.3 MORTALITY RATE
6.4 DRUG ADHERENCE AND THERAPY SWITCH MODEL
6.5 PATIENT TREATMENT SUCCESS RATES
7 MERGERS AND ACQUISITION
7.1 LICENSING
7.2 COMMERCIALIZATION AGREEMENTS
8 REGULATORY FRAMEWORK
8.1 REGULATORY APPROVAL PROCESS
8.2 GEOGRAPHIES’ EASE OF REGULATORY APPROVAL
8.3 REGULATORY APPROVAL PATHWAYS
8.4 LICENSING AND REGISTRATION
8.5 POST-MARKETING SURVEILLANCE
8.6 GOOD MANUFACTURING PRACTICES (GMPS) GUIDELINES
9 PIPELINE ANALYSIS
9.1 CLINICAL TRIALS AND PHASE ANALYSIS
9.2 DRUG THERAPY PIPELINE
9.3 PHASE III CANDIDATES
9.4 PHASE II CANDIDATES
9.5 PHASE I CANDIDATES
9.6 OTHERS (PRE-CLINICAL AND RESEARCH)
TABLE 1 GLOBAL CLINICAL TRIAL MARKET FOR PACLITAXEL INJECTION
Company Name Therapeutic Area
XX XX
XX XX
XX XX
XX XX
XX XX
XX XX
Sources: Press Releases, Annual Reports, SEC Filings, Investor Presentations, Other Government Sources, Analysis Based on Inputs from Secondary, Expert Interviews
TABLE 2 DISTRIBUTION OF PRODUCTS AND PROJECTS BY PHASE
Phase Number of Projects
Preclinical/Research Projects XX
Clinical Development XX
Phase I XX
Phase II XX
Phase III XX
U.S. Filed/Approved But Not Yet Marketed XX
Total XX
Sources: Press Releases, Annual Reports, SEC Filings, Investor Presentations, Other Government Sources, Analysis Based on Inputs from Secondary, Expert Interviews
TABLE 3 DISTRIBUTION OF PROJECTS BY THERAPEUTIC AREA AND PHASE
Therapeutic Area Preclinical/ Research Project
XX XX
XX XX
XX XX
XX XX
XX XX
Total Projects XX
Sources: Press Releases, Annual Reports, SEC Filings, Investor Presentations, Other Government Sources, Analysis Based on Inputs from Secondary, Expert Interviews
TABLE 4 DISTRIBUTION OF PROJECTS BY SCIENTIFIC APPROACH AND PHASE
Technology Preclinical/ Research Project
PACLITAXEL INJECTION XX
XX XX
XX XX
XX XX
XX XX
Total Projects XX
Sources: Press Releases, Annual Reports, SEC Filings, Investor Presentations, Other Government Sources, Analysis Based on Inputs from Secondary, Expert Interviews
FIGURE 1 TOP ENTITIES BASED ON R&D GLANCE FOR PACLITAXEL INJECTION
Sources: Press Releases, Annual Reports, SEC Filings, Investor Presentations, Other Government Sources, Analysis Based on Inputs from Secondary, Expert Interviews
10 MARKETED DRUG ANALYSIS
10.1 DRUG
10.1.1 BRAND NAME
10.2 THERAPEUTIC INDIACTION
10.3 PHARACOLOGICAL CLASS OD THE DRUG
10.4 DRUG PRIMARY INDICATION
10.5 MARKET STATUS
10.6 DRUG DOSAGES FORM
10.7 DOSAGES AVAILABILITY
10.8 PACKAGING TYPE
10.9 DRUG ROUTE OF ADMINISTRATION
10.1 DOSING FREQUENCY
10.11 DRUG INSIGHT
10.12 AN OVERVIEW OF THE DRUG DEVELOPMENT ACTIVITIES SUCH AS REGULATORY MILSTONE, SAFETY DATA AND EFFICACY DATA, MARKET EXCLUSIVITY DATA.
10.12.1 FORECAST MARKET OUTLOOK
10.12.2 CROSS COMPETITION
10.12.3 THERAPEUTIC PORTFOLIO
10.12.4 CURRENT DEVELOPMENT SCENARIO
11 MARKET ACCESS
11.1 10-YEAR MARKET FORECAST
11.2 CLINICAL TRIAL RECENT UPDATES
11.3 ANNUAL NEW FDA APPROVED DRUGS
11.4 DRUGS MANUFACTURER AND DEALS
11.5 MAJOR DRUG UPTAKE
11.6 CURRENT TREATMENT PRACTICES
11.7 IMPACT OF UPCOMING THERAPY
12 R & D ANALYSIS
12.1 COMPARATIVE ANALYSIS
12.2 DRUG DEVELOPMENTAL LANDSCAPE
12.3 IN-DEPTH INSIGHTS ON REGULATORY MILESTONES
12.4 THERAPEUTIC ASSESSMENT
12.5 ASSET-BASED COLLABORATIONS AND PARTNERSHIPS
13 MARKET OVERVIEW
13.1 DRIVERS
13.2 RESTRAINTS
13.3 OPPORTUNITIES
13.4 CHALLENGES
14 GLOBAL PACLITAXEL INJECTION MARKET, BY TYPE
14.1 OVERVIEW
14.2 GENERIC PACLITAXEL INJECTION
14.2.1 BY DRUG STRENGTH
14.2.1.1. 10MG/ML
14.2.1.2. 20MG/ML
14.2.1.3. 30MG/ML
14.3 BRANDED PACLITAXEL INJECTION
14.3.1 ABRAXANE
14.3.1.1. BY DRUG STRENGTH
14.3.1.1.1. 10MG/ML
14.3.1.1.2. 20MG/ML
14.3.1.1.3. 30MG/ML
14.3.2 TAXOL
14.3.2.1. BY DRUG STRENGTH
14.3.2.1.1. 10MG/ML
14.3.2.1.2. 20MG/ML
14.3.2.1.3. 30MG/ML
14.3.3 CYTAX
14.3.3.1. BY DRUG STRENGTH
14.3.3.1.1. 10MG/ML
14.3.3.1.2. 20MG/ML
14.3.3.1.3. 30MG/ML
14.3.4 ONXOL
14.3.4.1. BY DRUG STRENGTH
14.3.4.1.1. 10MG/ML
14.3.4.1.2. 20MG/ML
14.3.4.1.3. 30MG/ML
14.3.5 OTHERS
15 GLOBAL PACLITAXEL INJECTION MARKET, BY DRUG STRENGTH
15.1 OVERVIEW
15.2 10MG/ML
15.3 20MG/ML
15.4 30MG/ML
16 GLOBAL PACLITAXEL INJECTION MARKET, BY INDICATION
16.1 OVERVIEW
16.2 BREAST CANCER
16.2.1 BY TYPE
16.2.1.1. GENERIC PACLITAXEL INJECTION
16.2.1.2. BRANDED PACLITAXEL INJECTION
16.2.2 BY DRUG STRENGTH
16.2.2.1. 10MG/ML
16.2.2.2. 20MG/ML
16.2.2.3. 30MG/ML
16.3 CERVICAL CANCER
16.3.1 BY TYPE
16.3.2 GENERIC PACLITAXEL INJECTION
16.3.3 BRANDED PACLITAXEL INJECTION
16.3.4 BY DRUG STRENGTH
16.3.5 10MG/ML
16.3.6 20MG/ML
16.3.7 30MG/ML
16.4 OVARIAN CANCER
16.4.1 BY TYPE
16.4.1.1. GENERIC PACLITAXEL INJECTION
16.4.1.2. BRANDED PACLITAXEL INJECTION
16.4.2 BY DRUG STRENGTH
16.4.2.1. 10MG/ML
16.4.2.2. 20MG/ML
16.4.2.3. 30MG/ML
16.5 STOMACH CANCER
16.5.1 BY TYPE
16.5.1.1. GENERIC PACLITAXEL INJECTION
16.5.1.2. BRANDED PACLITAXEL INJECTION
16.5.2 BY DRUG STRENGTH
16.5.2.1. 10MG/ML
16.5.2.2. 20MG/ML
16.5.2.3. 30MG/ML
16.6 PROSTATE CANCER
16.6.1 BY TYPE
16.6.1.1. GENERIC PACLITAXEL INJECTION
16.6.1.2. BRANDED PACLITAXEL INJECTION
16.6.2 BY DRUG STRENGTH
16.6.2.1. 10MG/ML
16.6.2.2. 20MG/ML
16.6.2.3. 30MG/ML
16.7 LUNGS CANCER
16.7.1 BY TYPE
16.7.1.1. GENERIC PACLITAXEL INJECTION
16.7.1.2. BRANDED PACLITAXEL INJECTION
16.7.2 BY DRUG STRENGTH
16.7.2.1. 10MG/ML
16.7.2.2. 20MG/ML
16.7.2.3. 30MG/ML
16.8 TESTICULAR CANCER
16.8.1 BY TYPE
16.8.1.1. GENERIC PACLITAXEL INJECTION
16.8.1.2. BRANDED PACLITAXEL INJECTION
16.8.2 BY DRUG STRENGTH
16.8.2.1. 10MG/ML
16.8.2.2. 20MG/ML
16.8.2.3. 30MG/ML
16.9 PANCREATIC CANCER
16.9.1 BY TYPE
16.9.1.1. GENERIC PACLITAXEL INJECTION
16.9.1.2. BRANDED PACLITAXEL INJECTION
16.9.2 BY DRUG STRENGTH
16.9.2.1. 10MG/ML
16.9.2.2. 20MG/ML
16.9.2.3. 30MG/ML
16.1 OTHERS
17 GLOBAL PACLITAXEL INJECTION MARKET, BY AGE GROUP
17.1 OVERVIEW
17.2 ADULTS
17.3 PEDIATRICS
18 GLOBAL PACLITAXEL INJECTION MARKET, BY GENDER
18.1 OVERVIEW
18.2 MALE
18.3 FEMALE
19 GLOBAL PACLITAXEL INJECTION MARKET, BY END USER
19.1 OVERVIEW
19.2 HOSPITALS
19.3 SPECIALTY CLINICS
19.4 CANCER RESEARCH INSTITUTE
19.5 OTHERS
20 GLOBAL PACLITAXEL INJECTION MARKET, BY DISTRIBUTION CHANNEL
20.1 OVERVIEW
20.2 DIRECT TENDER
20.3 RETAIL SALES
20.3.1 HOSPITAL PHARMACIES
20.3.2 RETAIL PHARMACIES
20.3.3 ONLINE PHARMACIES
20.4 OTHERS
21 GLOBAL PACLITAXEL INJECTION MARKET, SWOT AND DBMR ANALYSIS
22 GLOBAL PACLITAXEL INJECTION MARKET, COMPANY LANDSCAPE
22.1 COMPANY SHARE ANALYSIS: GLOBAL
22.2 COMPANY SHARE ANALYSIS: NORTH AMERICA
22.3 COMPANY SHARE ANALYSIS: EUROPE
22.4 COMPANY SHARE ANALYSIS: ASIA-PACIFIC
22.5 MERGERS & ACQUISITIONS
22.6 NEW PRODUCT DEVELOPMENT & APPROVALS
22.7 EXPANSIONS
22.8 REGULATORY CHANGES
22.9 PARTNERSHIP AND OTHER STRATEGIC DEVELOPMENTS
23 GLOBAL PACLITAXEL INJECTION MARKET, BY REGION
Global PACLITAXEL INJECTION Market, (ALL SEGMENTATION PROVIDED ABOVE IS REPRESENTED IN THIS CHAPTER BY COUNTRY)
23.1 NORTH AMERICA
23.1.1 U.S.
23.1.2 CANADA
23.1.3 MEXICO
23.2 EUROPE
23.2.1 GERMANY
23.2.2 U.K.
23.2.3 ITALY
23.2.4 FRANCE
23.2.5 SPAIN
23.2.6 RUSSIA
23.2.7 SWITZERLAND
23.2.8 TURKEY
23.2.9 BELGIUM
23.2.10 NETHERLANDS
23.2.11 DENMARK
23.2.12 SWEDEN
23.2.13 POLAND
23.2.14 NORWAY
23.2.15 FINLAND
23.2.16 REST OF EUROPE
23.3 ASIA-PACIFIC
23.3.1 JAPAN
23.3.2 CHINA
23.3.3 SOUTH KOREA
23.3.4 INDIA
23.3.5 SINGAPORE
23.3.6 THAILAND
23.3.7 INDONESIA
23.3.8 MALAYSIA
23.3.9 PHILIPPINES
23.3.10 AUSTRALIA
23.3.11 NEW ZEALAND
23.3.12 VIETNAM
23.3.13 TAIWAN
23.3.14 REST OF ASIA-PACIFIC
23.4 SOUTH AMERICA
23.4.1 BRAZIL
23.4.2 ARGENTINA
23.4.3 REST OF SOUTH AMERICA
23.5 MIDDLE EAST AND AFRICA
23.5.1 SOUTH AFRICA
23.5.2 EGYPT
23.5.3 BAHRAIN
23.5.4 UNITED ARAB EMIRATES
23.5.5 KUWAIT
23.5.6 OMAN
23.5.7 QATAR
23.5.8 SAUDI ARABIA
23.5.9 REST OF MEA
23.6 KEY PRIMARY INSIGHTS: BY MAJOR COUNTRIES
24 GLOBAL PACLITAXEL INJECTION MARKET, COMPANY PROFILE
24.1 ACCORD HEALTHCARE
24.1.1 COMPANY OVERVIEW
24.1.2 REVENUE ANALYSIS
24.1.3 GEOGRAPHIC PRESENCE
24.1.4 PRODUCT PORTFOLIO
24.1.5 RECENT DEVELOPMENTS
24.2 ALEMBIC PHARMACEUTICALS LIMITED.
24.2.1 COMPANY OVERVIEW
24.2.2 REVENUE ANALYSIS
24.2.3 GEOGRAPHIC PRESENCE
24.2.4 PRODUCT PORTFOLIO
24.2.5 RECENT DEVELOPMENTS
24.3 SALVAVIDAS PHARMACEUTICAL PVT. LTD.
24.3.1 COMPANY OVERVIEW
24.3.2 REVENUE ANALYSIS
24.3.3 GEOGRAPHIC PRESENCE
24.3.4 PRODUCT PORTFOLIO
24.3.5 RECENT DEVELOPMENTS
24.4 TAJ PHARMA INDIA
24.4.1 COMPANY OVERVIEW
24.4.2 REVENUE ANALYSIS
24.4.3 GEOGRAPHIC PRESENCE
24.4.4 PRODUCT PORTFOLIO
24.4.5 RECENT DEVELOPMENTS
24.5 PFIZER
24.5.1 COMPANY OVERVIEW
24.5.2 REVENUE ANALYSIS
24.5.3 GEOGRAPHIC PRESENCE
24.5.4 PRODUCT PORTFOLIO
24.5.5 RECENT DEVELOPMENTS
24.6 ZYDUS GROUP
24.6.1 COMPANY OVERVIEW
24.6.2 REVENUE ANALYSIS
24.6.3 GEOGRAPHIC PRESENCE
24.6.4 PRODUCT PORTFOLIO
24.6.5 RECENT DEVELOPMENTS
24.7 FRESENIUS KABI (SINGAPORE) PTE LTD
24.7.1 COMPANY OVERVIEW
24.7.2 REVENUE ANALYSIS
24.7.3 GEOGRAPHIC PRESENCE
24.7.4 PRODUCT PORTFOLIO
24.7.5 RECENT DEVELOPMENTS
24.8 PANACEA BIOTEC
24.8.1 COMPANY OVERVIEW
24.8.2 REVENUE ANALYSIS
24.8.3 GEOGRAPHIC PRESENCE
24.8.4 PRODUCT PORTFOLIO
24.8.5 RECENT DEVELOPMENTS
24.9 APOTEX INC.
24.9.1 COMPANY OVERVIEW
24.9.2 REVENUE ANALYSIS
24.9.3 GEOGRAPHIC PRESENCE
24.9.4 PRODUCT PORTFOLIO
24.9.5 RECENT DEVELOPMENTS
24.1 TEVA UK LIMITED
24.10.1 COMPANY OVERVIEW
24.10.2 REVENUE ANALYSIS
24.10.3 GEOGRAPHIC PRESENCE
24.10.4 PRODUCT PORTFOLIO
24.10.5 RECENT DEVELOPMENTS
24.11 DR. REDDY’S LABORATORIES LTD.
24.11.1 COMPANY OVERVIEW
24.11.2 REVENUE ANALYSIS
24.11.3 GEOGRAPHIC PRESENCE
24.11.4 PRODUCT PORTFOLIO
24.11.5 RECENT DEVELOPMENTS
24.12 GETWELL PHARMACEUTICALS
24.12.1 COMPANY OVERVIEW
24.12.2 REVENUE ANALYSIS
24.12.3 GEOGRAPHIC PRESENCE
24.12.4 PRODUCT PORTFOLIO
24.12.5 RECENT DEVELOPMENTS
24.13 INTELICURE LIFESCIENCES.
24.13.1 COMPANY OVERVIEW
24.13.2 REVENUE ANALYSIS
24.13.3 GEOGRAPHIC PRESENCE
24.13.4 PRODUCT PORTFOLIO
24.13.5 RECENT DEVELOPMENTS
24.14 BRISTOL-MYERS SQUIBB COMPANY.
24.14.1 COMPANY OVERVIEW
24.14.2 REVENUE ANALYSIS
24.14.3 GEOGRAPHIC PRESENCE
24.14.4 PRODUCT PORTFOLIO
24.14.5 RECENT DEVELOPMENTS
24.15 TWI PHARMACEUTICALS USA, INC.
24.15.1 COMPANY OVERVIEW
24.15.2 REVENUE ANALYSIS
24.15.3 GEOGRAPHIC PRESENCE
24.15.4 PRODUCT PORTFOLIO
24.15.5 RECENT DEVELOPMENTS
24.16 HETERO HEALTHCARE LIMITED
24.16.1 COMPANY OVERVIEW
24.16.2 REVENUE ANALYSIS
24.16.3 GEOGRAPHIC PRESENCE
24.16.4 PRODUCT PORTFOLIO
24.16.5 RECENT DEVELOPMENTS
24.17 ADVACARE PHARMA
24.17.1 COMPANY OVERVIEW
24.17.2 REVENUE ANALYSIS
24.17.3 GEOGRAPHIC PRESENCE
24.17.4 PRODUCT PORTFOLIO
24.17.5 RECENT DEVELOPMENTS
24.18 NOVARTIS AG
24.18.1 COMPANY OVERVIEW
24.18.2 REVENUE ANALYSIS
24.18.3 GEOGRAPHIC PRESENCE
24.18.4 PRODUCT PORTFOLIO
24.18.5 RECENT DEVELOPMENTS
24.19 LEXICARE PHARMA PVT. LTD.
24.19.1 COMPANY OVERVIEW
24.19.2 REVENUE ANALYSIS
24.19.3 GEOGRAPHIC PRESENCE
24.19.4 PRODUCT PORTFOLIO
24.19.5 RECENT DEVELOPMENTS
24.2 BIOZENTA LIFESCIENCES PVT. LTD.
24.20.1 COMPANY OVERVIEW
24.20.2 REVENUE ANALYSIS
24.20.3 GEOGRAPHIC PRESENCE
24.20.4 PRODUCT PORTFOLIO
24.20.5 RECENT DEVELOPMENTS
24.21 CIPLA INC
24.21.1 COMPANY OVERVIEW
24.21.2 REVENUE ANALYSIS
24.21.3 GEOGRAPHIC PRESENCE
24.21.4 PRODUCT PORTFOLIO
24.21.5 RECENT DEVELOPMENTS
24.22 VIATRIS INC.
24.22.1 COMPANY OVERVIEW
24.22.2 REVENUE ANALYSIS
24.22.3 GEOGRAPHIC PRESENCE
24.22.4 PRODUCT PORTFOLIO
24.22.5 RECENT DEVELOPMENTS
24.23 OCEAN PHARMACEUTICAL
24.23.1 COMPANY OVERVIEW
24.23.2 REVENUE ANALYSIS
24.23.3 GEOGRAPHIC PRESENCE
24.23.4 PRODUCT PORTFOLIO
24.23.5 RECENT DEVELOPMENTS
24.24 AETOS PHARMA PRIVATE LIMITED.
24.24.1 COMPANY OVERVIEW
24.24.2 REVENUE ANALYSIS
24.24.3 GEOGRAPHIC PRESENCE
24.24.4 PRODUCT PORTFOLIO
24.24.5 RECENT DEVELOPMENTS
24.25 PV PHARMA
24.25.1 COMPANY OVERVIEW
24.25.2 REVENUE ANALYSIS
24.25.3 GEOGRAPHIC PRESENCE
24.25.4 PRODUCT PORTFOLIO
24.25.5 RECENT DEVELOPMENTS
24.26 ACTIZA PHARMACEUTICAL PRIVATE LIMITED
24.26.1 COMPANY OVERVIEW
24.26.2 REVENUE ANALYSIS
24.26.3 GEOGRAPHIC PRESENCE
24.26.4 PRODUCT PORTFOLIO
24.26.5 RECENT DEVELOPMENTS
24.27 SUNDENT PHARM GROUP
24.27.1 COMPANY OVERVIEW
24.27.2 REVENUE ANALYSIS
24.27.3 GEOGRAPHIC PRESENCE
24.27.4 PRODUCT PORTFOLIO
24.27.5 RECENT DEVELOPMENTS
24.28 NANODARU.
24.28.1 COMPANY OVERVIEW
24.28.2 REVENUE ANALYSIS
24.28.3 GEOGRAPHIC PRESENCE
24.28.4 PRODUCT PORTFOLIO
24.28.5 RECENT DEVELOPMENTS
24.29 HAINAN YEW GARDEN PHARMACEUTICAL CO., LTD
24.29.1 COMPANY OVERVIEW
24.29.2 REVENUE ANALYSIS
24.29.3 GEOGRAPHIC PRESENCE
24.29.4 PRODUCT PORTFOLIO
24.29.5 RECENT DEVELOPMENTS
24.3 STERIMAX
24.30.1 COMPANY OVERVIEW
24.30.2 REVENUE ANALYSIS
24.30.3 GEOGRAPHIC PRESENCE
24.30.4 PRODUCT PORTFOLIO
24.30.5 RECENT DEVELOPMENTS
24.30.6
25 RELATED REPORTS
26 CONCLUSION
27 QUESTIONNAIRE
28 ABOUT DATA BRIDGE MARKET RESEARCH
Data collection and base year analysis are done using data collection modules with large sample sizes. The stage includes obtaining market information or related data through various sources and strategies. It includes examining and planning all the data acquired from the past in advance. It likewise envelops the examination of information inconsistencies seen across different information sources. The market data is analysed and estimated using market statistical and coherent models. Also, market share analysis and key trend analysis are the major success factors in the market report. To know more, please request an analyst call or drop down your inquiry.
The key research methodology used by DBMR research team is data triangulation which involves data mining, analysis of the impact of data variables on the market and primary (industry expert) validation. Data models include Vendor Positioning Grid, Market Time Line Analysis, Market Overview and Guide, Company Positioning Grid, Patent Analysis, Pricing Analysis, Company Market Share Analysis, Standards of Measurement, Global versus Regional and Vendor Share Analysis. To know more about the research methodology, drop in an inquiry to speak to our industry experts.
Data Bridge Market Research is a leader in advanced formative research. We take pride in servicing our existing and new customers with data and analysis that match and suits their goal. The report can be customized to include price trend analysis of target brands understanding the market for additional countries (ask for the list of countries), clinical trial results data, literature review, refurbished market and product base analysis. Market analysis of target competitors can be analyzed from technology-based analysis to market portfolio strategies. We can add as many competitors that you require data about in the format and data style you are looking for. Our team of analysts can also provide you data in crude raw excel files pivot tables (Fact book) or can assist you in creating presentations from the data sets available in the report.


