
Global Sports Graphics Market
Market Size in USD Billion
 USD
2.98 Billion
USD
5.00 Billion
2024
2032
USD
2.98 Billion
USD
5.00 Billion
2024
2032
| 2025 - 2032 | |
| USD 2.98 Billion | |
| USD 5.00 Billion | |
| % | |
|
Sports Graphics Market Size
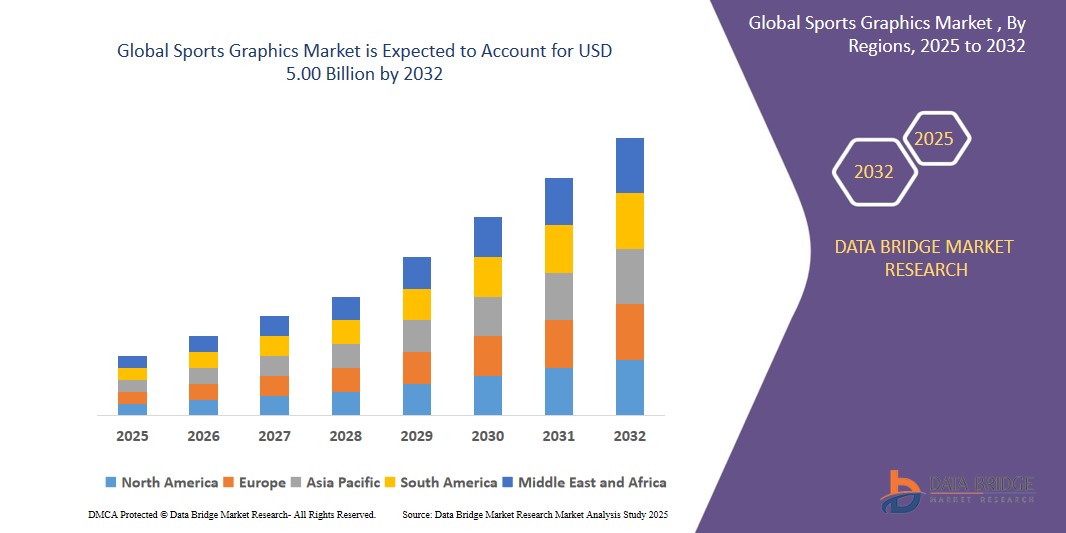
- The Global Sports Graphics Market size was valued at USD 2.98 billion in 2024 and is expected to reach USD 5.00 billion by 2032, at a CAGR of 6.70% during the forecast period
- The growing demand for immersive viewer experiences in sports broadcasts and digital platforms is driving adoption of dynamic graphics, enabling real-time data visualization and enhancing fan engagement across global sporting events.
- Increasing investments in branding and sponsorships are fueling the use of sports graphics for virtual ads, branded replays, and augmented reality, enhancing commercial opportunities and visibility during live sports content.
Sports Graphics Market Analysis
- Sports graphics are essential visual tools used in live sports broadcasting, replays, player statistics, scoreboards, and augmented visuals to enhance viewer engagement and provide real-time insights. These tools play a vital role in both traditional and digital sports media coverage
- The demand for sports graphics is significantly driven by the increasing popularity of global sports tournaments, the rise of digital and OTT streaming platforms, and advancements in real-time data integration and visualization technologies
- North America is expected to dominate the global sports graphics market with largest market share of more than 50.6% in 2024, due to the presence of leading sports leagues, high media consumption, and established broadcasting infrastructure.
- Asia-Pacific is expected to be the fastest growing region in the sports graphics market with a CAGR of 6.1% during the forecast period due to growing investment in sports broadcasting, rising internet penetration, and expanding fan bases in countries like India and China
- Digital printing segment is expected to dominate the market with the largest market share of 40.5% due to its flexibility, cost-effectiveness, and ability to produce high-quality, customized graphics quickly. It is widely used for creating banners, signage, vehicle wraps, and promotional materials for sports events, driving its extensive adoption across teams, venues, and sponsors
Report Scope and Sports Graphics Market Segmentation
|
Attributes |
Sports Graphics Key Market Insights |
|
Segments Covered |
|
|
Countries Covered |
North America
Europe
Asia-Pacific
Middle East and Africa
South America
|
|
Key Market Players |
|
|
Market Opportunities |
|
|
Value Added Data Infosets |
In addition to the insights on market scenarios such as market value, growth rate, segmentation, geographical coverage, and major players, the market reports curated by the Data Bridge Market Research also include in-depth expert analysis, pricing analysis, brand share analysis, consumer survey, demography analysis, supply chain analysis, value chain analysis, raw material/consumables overview, vendor selection criteria, PESTLE Analysis, Porter Analysis, and regulatory framework. |
Sports Graphics Market Trends
“Integration of Real-Time Data & Augmented Reality in Sports Broadcasting”
- One prominent trend in the sports graphics market is the growing integration of real-time data feeds and augmented reality (AR) elements into live broadcasts and digital platforms
- These technologies significantly enhance viewer experience by delivering instant player statistics, game analytics, and interactive visuals overlaid directly onto the screen
For instance,
- AR-powered graphics such as virtual scoreboards, player heat maps, and real-time performance metrics are becoming standard features in major league broadcasts, elevating fan engagement and storytelling
- This trend is transforming how sports content is consumed and produced, pushing demand for advanced graphics solutions and driving innovation across sports tech and media companies
Sports Graphics Market Dynamics
Driver
“Rising Global Sports Viewership and Fan Engagement Demand”
- The surge in global sports viewership—across traditional broadcasts, OTT platforms, and mobile streaming—is a key driver accelerating the demand for advanced sports graphics solutions
- As fans increasingly seek interactive, data-rich, and immersive viewing experiences, broadcasters and event organizers are investing in real-time graphics to differentiate coverage and boost audience engagement
- The rise of fantasy sports, second-screen experiences, and social media integrations further amplifies the need for visually dynamic and responsive graphics content
For instance,
- According to Statista, the global sports media market is projected to grow significantly, with billions of viewers engaging with international events such as the Olympics, FIFA World Cup, and regional leagues, fueling the demand for advanced graphics technology
- As sports consumption becomes more digital and experience-driven, the need for visually compelling, data-integrated graphics is becoming central to broadcast innovation and fan retention strategies
Restraint/Challenge
“High Implementation Costs and Technical Complexity”
- The deployment of advanced sports graphics systems requires substantial investment in hardware, software, skilled personnel, and system integration, posing a significant barrier for small to mid-sized broadcasters and sports organizations
- Cutting-edge graphics technologies—including augmented reality (AR), virtual overlays, and real-time data integrations—often demand high-end processing systems, dedicated teams, and complex setup, making it less accessible to regional sports channels and emerging markets
- The need for continuous updates, maintenance, and technical support further adds to the operational costs, making it challenging for budget-conscious organizations to adopt or scale these solutions
For instance,
- In October 2024, according to a report by Sports Video Group (SVG), many small-scale broadcasters in Latin America and Southeast Asia reported difficulties in implementing real-time sports graphics systems due to high infrastructure costs and lack of technical expertise, limiting their ability to deliver immersive viewing experiences on par with global standards
- This financial and technical burden creates a digital divide in the industry, where only large, well-funded entities can afford next-generation graphics, thereby limiting overall market penetration and innovation
Sports Graphics Market Scope
The market is segmented on the basis of product, and end- users
- By product
On the basis of product, the Sports Graphics Market is segmented into Digital Printing, Screen Printing, Embroidery. In 2024, Digital printing segment is expected to dominate the market with the largest market share of 40.5% due to its flexibility, cost-effectiveness, and ability to produce high-quality, customized graphics quickly. It is widely used for creating banners, signage, vehicle wraps, and promotional materials for sports events, driving its extensive adoption across teams, venues, and sponsors.
Digital Printing is the fastest-growing segment with a CAGR of around 10%, fueled by technological advancements, rising demand for on-demand printing, and eco-friendly, water-based inks in sportswear customization.
- By end- users
On the basis of end- users, the Sports Graphics Market is segmented into Promotional Products, Sports Apparel, Accessories. Sports Apparel dominates the Sports Graphics Market due to high demand for team uniforms, fan merchandise, and brand endorsements, driven by rising sports participation and global athletic apparel trends.
Promotional Products is the fastest-growing segment, driven by increasing use of branded merchandise in sports marketing campaigns and events, with rising investments in fan engagement and brand visibility initiatives.
Sports Graphics Market Regional Analysis
- North America is expected to dominate the global sports graphics market with largest market share of more than 50.6% in 2024, due to the presence of leading sports leagues, high media consumption, and established broadcasting infrastructure.
- North America’s strong fan base and investment in advanced graphic technologies drive demand for immersive viewing experiences. Growing sponsorships and advertising budgets further boost the adoption of innovative sports graphics solutions.
- The region’s well-developed digital platforms and increasing mobile viewership enable real-time interactive graphics. Additionally, collaborations between technology providers and sports organizations accelerate the integration of augmented and virtual reality in sports broadcasting.
U.S. Sports Graphics Market Insight
In 2025, the U.S. holds around 35% of the North American sports graphics market, driven by high investment in professional sports leagues, advanced digital printing, and customization technologies. Demand is further fueled by branding in stadiums, team merchandising, and high-value sponsorship activations. Growth is supported by media partnerships, event-based advertising, and innovations in motion graphics and LED display systems.
Europe Sports Graphics Market Insight
Europe's market is shaped by stringent advertising regulations, green printing practices, and rising popularity of live sports events. Germany, France, and Italy lead in adopting eco-friendly materials, dynamic content delivery, and smart display solutions. Consumer engagement through augmented reality (AR) and digital fan experiences is increasing, alongside a push for sustainability in visual media.
U.K. Sports Graphics Market Insight
The U.K. market is propelled by digital fan engagement strategies, high-profile international events, and demand for visually immersive branding. Innovations in 3D graphics, real-time rendering, and interactive visuals are enhancing viewer experience. Local production capacity is improving with greater reliance on sustainable substrates and alignment with evolving EU and FIFA visual standards.
Germany Sports Graphics Market Insight
Germany remains a leader with its focus on precision graphics, smart LED integration, and sustainable visual merchandising. Strong manufacturing capabilities, green tech subsidies, and a robust sports infrastructure boost adoption of high-performance display graphics, including touch-interactive and motion-based visuals across stadiums, retail, and automotive sports advertising.
Asia-Pacific Sports Graphics Market Insight
Asia-Pacific is expected to be the fastest growing region in the sports graphics market with a CAGR of 6.1% during the forecast period due to growing investment in sports broadcasting, rising internet penetration, and expanding fan bases in countries like India and China.
China Sports Graphics Market Insight
China leads the region with a 38% revenue share in 2025, fueled by massive sporting events, urban digital infrastructure, and large-scale advertising networks. The market benefits from rapid digitalization, high-tech production, and demand for immersive AR/VR graphics, with support from government-backed smart city and green media initiatives.
India Sports Graphics Market Insight
India is expected to record the highest CAGR of 23.1%, driven by a booming sports ecosystem, digital fan base, and expanding e-commerce and OTT platforms. Government-backed sporting events, rising investments in content production, and demand for locally tailored graphics fuel growth. Adoption of 4K/8K broadcasting, multilingual branding, and sustainable print solutions is increasing rapidly.
Sports Graphics Market Share
The Sports Graphics industry is primarily led by well-established companies, including:
- Chyron (U.S.)
- Vizrt (Norway)
- Ross Video (Canada)
- Daktronics (U.S.)
- SMT (SportsMEDIA Technology) (U.S.)
- Sportradar (Switzerland)
- Genius Sports (U.K.)
- Avid Technology (U.S.)
- NewTek (U.S.)
- Broadcast Pix (U.S.)
- RT Software (U.K.)
- Reality Check Systems (RCS) (U.S.)
- Brainstorm Multimedia (Spain)
- Orad Hi-Tec Systems (Israel)
- Disguise (U.K.)
- EVS Broadcast Equipment (Belgium)
- wTVision (Portugal)
- Deltatre (Italy)
- AE Live (U.K.)
- Pixotope (Norway)
Latest Developments in Global Sports Graphics Market
- In April 2025 Cosm, a leader in immersive sports viewing technology, has transformed live sports and entertainment experiences with its cutting-edge technology, offering viewers a realistic, stadium-like atmosphere in urban venues. This innovative approach highlights the growing role of immersive graphics technology in redefining how audiences engage with live sports, making it a key driver in the global sports graphics market. The demand for such immersive experiences is expected to accelerate as sports leagues and broadcasters seek to enhance fan engagement
- In February 2025 saw the introduction of an innovative broadcast model during an NHL game between the Boston Bruins and the Florida Panthers. The "STEMcast" broadcast, aired on New England Sports Network, incorporated a mix of animation and STEM education to attract younger audiences. By using digital tools like interactive broadcast overlays, this initiative demonstrated how leagues and broadcasters are increasingly leveraging advanced sports graphics technologies to personalize and enrich the viewing experience. As digital enhancements continue to shape the sports broadcasting industry, such initiatives are contributing significantly to the expansion of the sports graphics market, with broadcasters investing in immersive technologies to stay competitive and engage more viewers
- In January 2025 Chyron unveiled advanced sports graphics innovations at the IBC 2024, enhancing live sports storytelling. The company showcased updates to its sports portfolio, including the Chyron PRIME platform, PAINT (replay and telestration), VSAR (virtual production), VP (virtual ad placement), and Chyron LIVE (cloud-based live production) solutions. These innovations aim to drive fan engagement for major sporting events by providing powerful tools for graphics design, data integration, and live production
- In May 2024 Ease Live showcased its interactive graphical overlays at IBC 2024, aiming to drive engagement and revenue for sports broadcasters, teams, and leagues. The company demonstrated how its solutions enable sports broadcasters and rights holders to maximize video advertising revenues and enhance audience engagement by integrating real-time stats, polls, and interactivity. The success of these overlays during the UEFA EURO 2024 coverage highlights the potential of interactive graphics in transforming the sports broadcasting landscape
- In May 2024 UEFA incorporated virtual board replacement (VBR) technology in Champions League matches, allowing for the replacement of in-stadium LED board advertisements with regional-specific adverts in the live TV broadcast. This technology ensures compliance with local advertising regulations while maximizing sponsor visibility globally. Implemented by UEFA, VBR is seen on the main broadcast camera during live play but does not alter replays or other camera feeds. The use of VBR technology exemplifies the innovative approaches being adopted to integrate graphics and advertising in sports broadcasting
SKU-

- Interactive Data Analysis Dashboard
- Company Analysis Dashboard for high growth potential opportunities
- Research Analyst Access for customization & queries
- Competitor Analysis with Interactive dashboard
- Latest News, Updates & Trend analysis
- Harness the Power of Benchmark Analysis for Comprehensive Competitor Tracking
Data collection and base year analysis are done using data collection modules with large sample sizes. The stage includes obtaining market information or related data through various sources and strategies. It includes examining and planning all the data acquired from the past in advance. It likewise envelops the examination of information inconsistencies seen across different information sources. The market data is analysed and estimated using market statistical and coherent models. Also, market share analysis and key trend analysis are the major success factors in the market report. To know more, please request an analyst call or drop down your inquiry.
The key research methodology used by DBMR research team is data triangulation which involves data mining, analysis of the impact of data variables on the market and primary (industry expert) validation. Data models include Vendor Positioning Grid, Market Time Line Analysis, Market Overview and Guide, Company Positioning Grid, Patent Analysis, Pricing Analysis, Company Market Share Analysis, Standards of Measurement, Global versus Regional and Vendor Share Analysis. To know more about the research methodology, drop in an inquiry to speak to our industry experts.
Data Bridge Market Research is a leader in advanced formative research. We take pride in servicing our existing and new customers with data and analysis that match and suits their goal. The report can be customized to include price trend analysis of target brands understanding the market for additional countries (ask for the list of countries), clinical trial results data, literature review, refurbished market and product base analysis. Market analysis of target competitors can be analyzed from technology-based analysis to market portfolio strategies. We can add as many competitors that you require data about in the format and data style you are looking for. Our team of analysts can also provide you data in crude raw excel files pivot tables (Fact book) or can assist you in creating presentations from the data sets available in the report.


