
Global Tonic Water Market
Market Size in USD Million
 USD
901.64 Million
USD
1,456.75 Million
2021
2029
USD
901.64 Million
USD
1,456.75 Million
2021
2029
| 2022 - 2029 | |
| USD 901.64 Million | |
| USD 1,456.75 Million | |
| % | |
|
Tonic Water Market Analysis and Size
Customers have established a strong taste for premium spirits and are willing to spend money on creative goods with distinct qualities and a rich history. As a result, premium-priced mixers are becoming increasingly popular due to bartenders are gradually mixing premium tonic water in top-tier spirit brands, the resurgence of the cocktail trend in emerging economies has boosted growth for the super-premium category and resulting in the rise and growth of the global tonic water market.
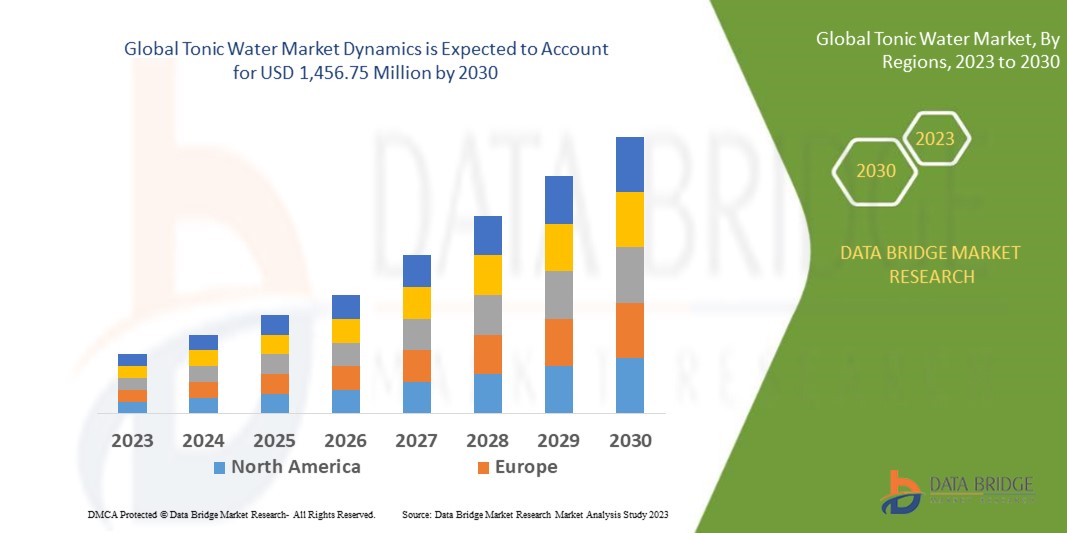
Data Bridge Market Research analyses that the global tonic water market was valued at USD 901.64 million in 2022, and is expected to reach the value of USD 1,456.75 million by 2030, at a CAGR of 7.2% during the forecast period of 2023 to 2030. In addition to the insights on market scenarios such as market value, growth rate, segmentation, geographical coverage, and major players, the market reports curated by the Data Bridge Market Research also include in-depth expert analysis, geographically represented company-wise production and capacity, network layouts of distributors and partners, detailed and updated price trend analysis and deficit analysis of supply chain and demand.
Tonic Water Market Scope and Segmentation
|
Report Metric |
Details |
|
Forecast Period |
2023 to 2030 |
|
Base Year |
2022 |
|
Historic Years |
2021 (Customizable to 2015-2020) |
|
Quantitative Units |
Revenue in USD Million, Volumes in Units, Pricing in USD |
|
Segments Covered |
Product Type (Flavored, Non-Flavored Drinks, Others), Application (Alcoholic Drinks, Direct Consumption), Content (Regular, Diet), Distribution Channel (Supermarket, Retail Stores) |
|
Countries Covered |
U.S., Canada, Mexico, Germany, U.K., Italy, France, Spain, Russia, Turkey, Switzerland, Belgium, Netherlands, Denmark, Sweden, Poland, Turkey, rest of Europe, Japan, China, South Korea, India, Australia, Singapore, Japan, Thailand, Indonesia, New Zealand, Vietnam, Thailand, Indonesia, Malaysia, Philippines, rest of Asia-Pacific, South Africa, Kuwait, Qatar, Oman, Saudi Arabia, U.A.E., and rest of the Middle East and Africa, Brazil, Argentina & rest of South America |
|
Market Players Covered |
PepsiCo (U.S.), Nestlé, A.G. (Switzerland), The Coca-Cola Company (U.S.), CG Roxane, LLC (U.S.), Tempo Beverage Ltd (Israel), Keurig Dr Pepper Inc. (U.S.), Dr Pepper/Seven Up, Inc (U.S.), Ferrarelle (Italy), SANPELLEGRINO (Italy), Reignwood Investments UK Ltd (U.K.), LaCroix Beverages, Inc. (U.S.), GEROLSTEINER BRUNNEN GMBH & CO. KG (Germany), and Mountain Valley Spring Water (U.S.) |
|
Market Opportunities |
|
Market Definition
Tonic water, is a carbonated beverage that was originally consumed as a malaria preventative drink. It is made from the cinchona tree bark and contains a small amount of quinine to make it more appealing and having medicinal property.
Global Tonic Water Market Dynamics
Drivers
- Numerous Benefits of Consuming Tonic Water
Due to the presence of quinine, a medication used to treat malaria and babesiosis, tonic water is also widely consumed as a healthy drink around the world. This tonic water contains 83 milligrams of quinine per litre and has excellent medicinal properties. Market manufacturers are now offering a diverse range of products with added sugars and flavours. These medicinal benefits of tonic water are also propelling the product's demand on a global scale.
- The Growing Consumption of Alcohol and Development of Additional Flavourings
The use of tonic water in margaritas as a drink enhancer and for soothing dehydration due to its strong taste. Furthermore, children, teenagers, and young adults are drawn to the sparkling effect of tonic water under ultraviolet lights. Tonic water appears fluorescent when exposed to direct sunlight because quinine is reactive to UV radiation as a result of its quinine content. Due to its use in cocktail preparations and its medicinal properties, the market is expected to grow steadily over the forecast period of 2023 to 2030.
Opportunity
- Increasing Consumer Interest In Health-Conscious And Low-Calorie Beverages
The rising consumer interest in health-conscious and low-calorie beverages presents a lucrative opportunity for the global tonic water market. As more consumers prioritize healthier lifestyles and seek reduced-calorie options, tonic water can respond by offering low-calorie variants and positioning itself as a refreshing, guilt-free choice. This shift in consumer preferences not only expands the market's reach but also aligns tonic water with the growing trend toward healthier beverage choices. Manufacturers can capitalize on this opportunity by introducing tonic water products that cater to health-conscious consumers, tapping into a market segment with considerable growth potential.
Restraint/Challenge
- Lack of Awareness of Health Benefits of Tonic Water
A significant restraint for the global tonic water market is the lack of awareness among consumers regarding the potential health benefits of tonic water. Despite its natural ingredients and historical use for medicinal purposes, many consumers are unaware of the positive attributes of tonic water. This limited awareness inhibits market growth as consumers may not actively seek out tonic water as a healthy beverage option. To overcome this restraint, industry stakeholders need to invest in educational campaigns and marketing efforts to communicate the health benefits and natural qualities of tonic water effectively. Raising awareness can help broaden the consumer base and drive increased demand for tonic water as a health-conscious choice in the beverage market.
This global tonic water market report provides details of new recent developments, trade regulations, import-export analysis, production analysis, value chain optimization, market share, impact of domestic and localized market players, analyses opportunities in terms of emerging revenue pockets, changes in market regulations, strategic market growth analysis, market size, category market growths, application niches and dominance, product approvals, product launches, geographic expansions, technological innovations in the market. To gain more info on the global tonic water market contact Data Bridge Market Research for an Analyst Brief, our team will help you take an informed market decision to achieve market growth.
Impact and Current Market Scenario of Raw Material Shortage and Shipping Delays
Data Bridge Market Research offers a high-level analysis of the market and delivers information by keeping in account the impact and current market environment of raw material shortage and shipping delays. This translates into assessing strategic possibilities, creating effective action plans, and assisting businesses in making important decisions.
Apart from the standard report, we also offer in-depth analysis of the procurement level from forecasted shipping delays, distributor mapping by region, commodity analysis, production analysis, price mapping trends, sourcing, category performance analysis, supply chain risk management solutions, advanced benchmarking, and other services for procurement and strategic support.
Expected Impact of Economic Slowdown on the Pricing and Availability of Products
When economic activity slows, industries begin to suffer. The forecasted effects of the economic downturn on the pricing and accessibility of the products are taken into account in the market insight reports and intelligence services provided by DBMR. With this, our clients can typically keep one step ahead of their competitors, project their sales and revenue, and estimate their profit and loss expenditures.
Recent Developments
- In May 2021, Fentimans will introduce a new 200ml mixers and tonic range. The new 200ml mixer range, which includes Tonic Water as well as Fentimans' iconic Ginger Beer and Rose Lemonade, will be made using Fentimans' 100-year-old artisanal technique. Fentimans' versatile range of coloured and flavoured tonics, suitable for pairing with a wide range of spirit categories, is also included
- In February 2020, Love Tonic, a new mixer brand in the U.K., launched a quinine-free tonic water suitable for blending with gin, vodka, tequila, whisky, or rum
Global Tonic Water Market Scope
The Tonic Water market is segmented on the basis of product type, origin and distribution channel. The growth amongst these segments will help you analyse meagre growth segments in the industries and provide the users with a valuable market overview and market insights to help them make strategic decisions for identifying core market applications.
Product Type
- Flavoured
- Non-Flavoured Drinks
- Others
Content
- Regular
- Diet
Application
- Alcoholic Drinks
- Direct Consumption
Distribution Channel
- Supermarket
- Retail Stores
Global Tonic Water Market Regional Analysis/Insights
The global tonic water market is analysed and market size insights and trends are provided by country, of product type, application, content and distribution channel as referenced above.
The countries covered in the global tonic water market report are U.S., Canada, Mexico, Germany, U.K., Italy, France, Spain, Russia, Turkey, Switzerland, Belgium, Netherlands, Denmark, Sweden, Poland, Turkey, rest of Europe, Japan, China, South Korea, India, Australia, Singapore, Japan, Thailand, Indonesia, New Zealand, Vietnam, Thailand, Indonesia, Malaysia, Philippines, Rest of Asia-Pacific, South Africa, Kuwait, Qatar, Oman, Saudi Arabia, U.A.E., and rest of the Middle East and Africa, Brazil, Argentina and Rest of South America
North America is the dominating region in the global tonic water market, accounting for a share. The U.S. and Canada are the largest consumers of tonic water, which presents a huge opportunity for the North American market. Furthermore, these two countries consume a lot of gin, which increases the demand for tonic water. The increased consumption of these spirits is fuelling the region's demand for tonic water.
The Asia Pacific region is expected to be the fastest growing region in the global tonic water market due to consumption of spirits such as gin, whiskey, and rum has been steadily increasing in countries such as India, China, and Indonesia. The region's demand for tonic water market is being driven by an increase in the consumption of various types of alcohol.
The country section of the report also provides individual market impacting factors and changes in market regulation that impact the current and future trends of the market. Data points like down-stream and upstream value chain analysis, technical trends and porter's five forces analysis, case studies are some of the pointers used to forecast the market scenario for individual countries. Also, the presence and availability of Global brands and their challenges faced due to large or scarce competition from local and domestic brands, impact of domestic tariffs and trade routes are considered while providing forecast analysis of the country data.
Competitive Landscape and Global Tonic Water Market Share Analysis
The global tonic water market competitive landscape provides details by competitor. Details included are company overview, company financials, revenue generated, market potential, investment in research and development, new market initiatives, Global presence, production sites and facilities, production capacities, company strengths and weaknesses, product launch, product width and breadth, application dominance. The above data points provided are only related to the companies' focus related to global tonic water market.
Some of the major players operating in the global tonic water market are:
- PepsiCo (U.S.)
- Nestlé, A.G. (Switzerland)
- The Coca-Cola Company (U.S.)
- CG Roxane, LLC (U.S.)
- Tempo Beverage Ltd (Israel)
- Keurig Dr Pepper Inc. (U.S.)
- Dr Pepper/Seven Up, Inc (U.S.)
- Ferrarelle (Italy)
- SANPELLEGRINO (Italy)
- Reignwood Investments UK Ltd (U.K.)
- LaCroix Beverages, Inc. (U.S.)
- GEROLSTEINER BRUNNEN GMBH & CO. KG (Germany)
- Mountain Valley Spring Water (U.S.)
SKU-

- Interactive Data Analysis Dashboard
- Company Analysis Dashboard for high growth potential opportunities
- Research Analyst Access for customization & queries
- Competitor Analysis with Interactive dashboard
- Latest News, Updates & Trend analysis
- Harness the Power of Benchmark Analysis for Comprehensive Competitor Tracking
Table of Content
1 INTRODUCTION
1.1 OBJECTIVES OF THE STUDY
1.2 MARKET DEFINITION
1.3 OVERVIEW OF GLOBAL TONIC WATER MARKET
1.4 CURRENCY AND PRICING
1.5 LIMITATION
1.6 MARKETS COVERED
2 MARKET SEGMENTATION
2.1 KEY TAKEAWAYS
2.2 ARRIVING AT THE GLOBAL TONIC WATER MARKETSIZE
2.2.1 VENDOR POSITIONING GRID
2.2.2 TECHNOLOGY LIFE LINE CURVE
2.2.3 MARKET GUIDE
2.2.4 COMPANY POSITIONING GRID
2.2.5 COMAPANY MARKET SHARE ANALYSIS
2.2.6 MULTIVARIATE MODELLING
2.2.7 DEMAND AND SUPPLY-SIDE VARIABLES
2.2.8 TOP TO BOTTOM ANALYSIS
2.2.9 STANDARDS OF MEASUREMENT
2.2.10 VENDOR SHARE ANALYSIS
2.2.11 DATA POINTS FROM KEY PRIMARY INTERVIEWS
2.2.12 DATA POINTS FROM KEY SECONDARY DATABASES
2.3 GLOBAL TONIC WATER MARKET: RESEARCH SNAPSHOT
2.4 ASSUMPTIONS
3 MARKET OVERVIEW
3.1 DRIVERS
3.2 RESTRAINTS
3.3 OPPORTUNITIES
3.4 CHALLENGES
4 EXECUTIVE SUMMARY
5 PREMIUM INSIGHTS
5.1 SUPPLY CHAIN ANALYSIS
5.2 FACTORS INFLUENCING PURCHASING DECISION
5.3 INDUTRY TRENDS AND FUTURE PERSPECTIVES
5.4 SHOPPING BEHAVIOUR AND DYNAMICS
5.4.1 RECOMMENDATION FROM FAMILY & FRIENDS
5.4.2 RESEARCH
5.4.3 IMPULSIVE
5.4.4 ADVERTISEMENT
5.4.4.1. TTELEVISION ADVERTISEMENT
5.4.4.2. OONLINE ADVERTISEMENT
5.4.4.3. IIN-STORE ADVERTISEMENT
5.4.4.4. OOUTDOOR ADVERTISEMENT
5.5 PRIVATE LABEL VS BRAND ANALYSIS
5.6 PROMOTIONAL ACTIVITIES
5.7 CONSUMER DISPOSABLE INCOME DYNAMICS/SPEND DYNAMICS
5.8 GROWTH STRATEGIES ADOPTED BY KEY PLAYERS
5.9 NEW PRODUCT LAUNCH STRATEGY
5.9.1 NUMBER OF NEW PRODUCT LAUNCH
5.9.1.1. LLINE EXTENSTION
5.9.1.2. NNEW PACKAGING
5.9.1.3. RRE-LAUNCHED
5.9.1.4. NNEW FORMULATION
5.1 CONSUMER LEVEL TRENDS
5.11 MEETING CONSUMER REQUIREMENT
5.12 BRAND COMAPARATIVE ANALYSIS
6 IMPACT OF ECONOMIC SLOW DOWN ON MARKET
6.1 IMPACT ON PRICE
6.2 IMPACT ON SUPPLY CHAIN
6.3 IMPACT ON SHIPMENT
6.4 IMPACT ON COMPANY’S STRATEGIC DECISIONS
7 REGULATORY FRAMEWORK AND GUIDELINES
8 PRICING ANALYSIS
9 BRAND OUTLOOK
9.1 COMPARATIVE BRAND ANALYSIS
9.2 PRODUCT VS BRAND OVERVIEW
10 GLOBAL TONIC WATER MARKET, BY TYPE, 2021-2030 (USD MILLION)
10.1 OVERVIEW
10.2 SWEETENED
10.2.1 SWEETENED, BY SWEETENER TYPE
10.2.1.1. NATURAL SWEETENER
10.2.1.2. ARTIFICIAL SWEETENER
10.3 UNSWEETENED
11 GLOBAL TONIC WATER MARKET, BY PRODUCT CATEGORY, 2021-2030 (USD MILLION)
11.1 OVERVIEW
11.2 ORIGINAL
11.2.1 ORIGINAL, BY FLAVOR
11.2.1.1. PLAIN / REGULAR
11.2.1.2. FLAVORED
11.3 LOW CALAORIE / DIET
11.3.1 LOW CALORIE DIET, BY FLAVOR
11.3.1.1. PLAIN / REGULAR
11.3.1.2. FLAVORED
12 GLOBAL TONIC WATER MARKET, BY FLAVOR, 2021-2030 (USD MILLION)
12.1 OVERVIEW
12.2 PLAIN / REGULAR
12.3 FLAVORED
12.3.1 FLAVORED, BY TYPE
12.3.1.1. GRAPE
12.3.1.2. ORANGE
12.3.1.3. LEMON
12.3.1.4. CRANBERRY
12.3.1.5. GRAPEFRUIT
12.3.1.6. PINEAPPLE
12.3.1.7. WATERMELON
12.3.1.8. CHERRY
12.3.1.9. LEMON
12.3.1.10. CUCUMBER
12.3.1.11. TURMERIC
12.3.1.12. GINGER
12.3.1.13. BASIL
12.3.1.14. CINNAMON
12.3.1.15. HIBISUS
12.3.1.16. ELDERFLOWER
12.3.1.17. ROSE
12.3.1.18. VANILLA
12.3.1.19. COLA
12.3.1.20. OTHERS
13 GLOBAL TONIC WATER MARKET, BY NATURE, 2021-2030 (USD MILLION)
13.1 OVERVIEW
13.2 ORGANIC
13.3 CONVENTIONAL
14 GLOBAL TONIC WATER MARKET, BY PRICING CATEGORY, 2021-2030 (USD MILLION)
14.1 OVERVIEW
14.2 REGULAR
14.3 PREMIUM
15 GLOBAL TONIC WATER MARKET, BY PACKAGING TYPE, 2021-2030 (USD MILLION)
15.1 OVERVIEW
15.2 CANS
15.3 BOTTLES
15.3.1 GLASS
15.3.2 PLASTIC
15.4 TETRA PACKS
15.5 OTHERS (IF ANY)
16 GLOBAL TONIC WATER MARKET, BY PACKAGING SIZE, 2021-2030 (USD MILLION)
16.1 OVERVIEW
16.2 LESS THAN 200 ML
16.3 201-400 ML
16.4 401-700 ML
16.5 MORE THAN 700 ML
17 GLOBAL TONIC WATER MARKET, BY DISTRIBUTION CHANNEL, 2021-2030 (USD MILLION)
17.1 OVERVIEW
17.2 STORE-BASED
17.2.1 GROCERY STORES
17.2.2 SPECIALTY STORES
17.2.3 SUPERMARKETS / HYPERMARKETS
17.2.4 CONVENIENCE STORES
17.2.5 OTHERS
17.3 NON-STORE BASED
17.3.1 ONLINE
17.3.1.1. COMPANY OWNED WEBSITES
17.3.1.2. E-COMMERCE WEBSITES
17.3.2 VENDING MACHINE
18 GLOBAL TONIC WATER MARKET, COMPANY LANDSCAPE
18.1 COMPANY SHARE ANALYSIS: GLOBAL
18.2 COMPANY SHARE ANALYSIS: NORTH AMERICA
18.3 COMPANY SHARE ANALYSIS: EUROPE
18.4 COMPANY SHARE ANALYSIS: ASIA-PACIFIC
18.5 MERGERS & ACQUISITIONS
18.6 NEW PRODUCT DEVELOPMENT & APPROVALS
18.7 EXPANSIONS & PARTNERSHIP
18.8 REGULATORY CHANGES
19 GLOBAL TONIC WATER MARKET, BY GEOGRAPHY, 2021-2030 (USD MILLION)
19.1 OVERVIEW (ALL SEGMENTATION PROVIDED ABOVE IS REPRESNTED IN THIS CHAPTER BY COUNTRY)
19.2 NORTH AMERICA
19.2.1 U.S.
19.2.2 CANADA
19.2.3 MEXICO
19.3 EUROPE
19.3.1 GERMANY
19.3.2 U.K.
19.3.3 ITALY
19.3.4 FRANCE
19.3.5 SPAIN
19.3.6 SWITZERLAND
19.3.7 NETHERLANDS
19.3.8 BELGIUM
19.3.9 RUSSIA
19.3.10 DENMARK
19.3.11 SWEDEN
19.3.12 POLAND
19.3.13 TURKEY
19.3.14 REST OF EUROPE
19.4 ASIA-PACIFIC
19.4.1 JAPAN
19.4.2 CHINA
19.4.3 SOUTH KOREA
19.4.4 INDIA
19.4.5 AUSTRALIA
19.4.6 SINGAPORE
19.4.7 THAILAND
19.4.8 INDONESIA
19.4.9 MALAYSIA
19.4.10 PHILIPPINES
19.4.11 NEW ZEALAND
19.4.12 VIETNAM
19.4.13 REST OF ASIA-PACIFIC
19.5 SOUTH AMERICA
19.5.1 BRAZIL
19.5.2 ARGENTINA
19.5.3 REST OF SOUTH AMERICA
19.6 MIDDLE EAST AND AFRICA
19.6.1 SOUTH AFRICA
19.6.2 UAE
19.6.3 SAUDI ARABIA
19.6.4 OMAN
19.6.5 QATAR
19.6.6 KUWAIT
19.6.7 REST OF MIDDLE EAST AND AFRICA
20 GLOBAL TONIC WATER MARKET, SWOT & DBMR ANALYSIS
21 GLOBAL TONIC WATER MARKET, COMPANY PROFILE
21.1 HANSEN BEVERAGES
21.1.1 COMPANY OVERVIEW
21.1.2 REVENUE ANALYSIS
21.1.3 PRODUCT PORTFOLIO
21.1.4 GEOGRAPHICAL PRESENCE
21.1.5 RECENT DEVELOPMENTS
21.2 FENTIMANS
21.2.1 COMPANY OVERVIEW
21.2.2 REVENUE ANALYSIS
21.2.3 PRODUCT PORTFOLIO
21.2.4 GEOGRAPHICAL PRESENCE
21.2.5 RECENT DEVELOPMENTS
21.3 EL GUAPO BITTERS
21.3.1 COMPANY OVERVIEW
21.3.2 REVENUE ANALYSIS
21.3.3 PRODUCT PORTFOLIO
21.3.4 GEOGRAPHICAL PRESENCE
21.3.5 RECENT DEVELOPMENTS
21.4 LAMB & WATT
21.4.1 COMPANY OVERVIEW
21.4.2 REVENUE ANALYSIS
21.4.3 PRODUCT PORTFOLIO
21.4.4 GEOGRAPHICAL PRESENCE
21.4.5 RECENT DEVELOPMENTS
21.5 THE COCO COLA COMPANY
21.5.1 COMPANY OVERVIEW
21.5.2 REVENUE ANALYSIS
21.5.3 PRODUCT PORTFOLIO
21.5.4 GEOGRAPHICAL PRESENCE
21.5.5 RECENT DEVELOPMENTS
21.6 EAST EMPERIAL
21.6.1 COMPANY OVERVIEW
21.6.2 REVENUE ANALYSIS
21.6.3 PRODUCT PORTFOLIO
21.6.4 GEOGRAPHICAL PRESENCE
21.6.5 RECENT DEVELOPMENTS
21.7 BRADLEY’S TONIC CO.
21.7.1 COMPANY OVERVIEW
21.7.2 REVENUE ANALYSIS
21.7.3 PRODUCT PORTFOLIO
21.7.4 GEOGRAPHICAL PRESENCE
21.7.5 RECENT DEVELOPMENTS
21.8 BOYLAN BOTTLING
21.8.1 COMPANY OVERVIEW
21.8.2 REVENUE ANALYSIS
21.8.3 PRODUCT PORTFOLIO
21.8.4 GEOGRAPHICAL PRESENCE
21.8.5 RECENT DEVELOPMENTS
21.9 FEVER-FREE
21.9.1 COMPANY OVERVIEW
21.9.2 REVENUE ANALYSIS
21.9.3 PRODUCT PORTFOLIO
21.9.4 GEOGRAPHICAL PRESENCE
21.9.5 RECENT DEVELOPMENTS
21.1 NESTLE
21.10.1 COMPANY OVERVIEW
21.10.2 REVENUE ANALYSIS
21.10.3 PRODUCT PORTFOLIO
21.10.4 GEOGRAPHICAL PRESENCE
21.10.5 RECENT DEVELOPMENTS
21.11 Q MIXERS
21.11.1 COMPANY OVERVIEW
21.11.2 REVENUE ANALYSIS
21.11.3 PRODUCT PORTFOLIO
21.11.4 GEOGRAPHICAL PRESENCE
21.11.5 RECENT DEVELOPMENTS
21.12 LUSCOMBE
21.12.1 COMPANY OVERVIEW
21.12.2 REVENUE ANALYSIS
21.12.3 PRODUCT PORTFOLIO
21.12.4 GEOGRAPHICAL PRESENCE
21.12.5 RECENT DEVELOPMENTS
21.13 GOLDENBERG & SONS
21.13.1 COMPANY OVERVIEW
21.13.2 REVENUE ANALYSIS
21.13.3 PRODUCT PORTFOLIO
21.13.4 GEOGRAPHICAL PRESENCE
21.13.5 RECENT DEVELOPMENTS
21.14 WEGMANS
21.14.1 COMPANY OVERVIEW
21.14.2 REVENUE ANALYSIS
21.14.3 PRODUCT PORTFOLIO
21.14.4 GEOGRAPHICAL PRESENCE
21.14.5 RECENT DEVELOPMENTS
21.15 TOP NOTE INDIAN TONIC
21.15.1 COMPANY OVERVIEW
21.15.2 REVENUE ANALYSIS
21.15.3 PRODUCT PORTFOLIO
21.15.4 GEOGRAPHICAL PRESENCE
21.15.5 RECENT DEVELOPMENTS
21.16 LONDON ESSENCE CO
21.16.1 COMPANY OVERVIEW
21.16.2 REVENUE ANALYSIS
21.16.3 PRODUCT PORTFOLIO
21.16.4 GEOGRAPHICAL PRESENCE
21.16.5 RECENT DEVELOPMENTS
21.17 PEPSICO. INC
21.17.1 COMPANY OVERVIEW
21.17.2 REVENUE ANALYSIS
21.17.3 PRODUCT PORTFOLIO
21.17.4 GEOGRAPHICAL PRESENCE
21.17.5 RECENT DEVELOPMENTS
21.18 LACROIX BEVERAGES, INC
21.18.1 COMPANY OVERVIEW
21.18.2 REVENUE ANALYSIS
21.18.3 PRODUCT PORTFOLIO
21.18.4 GEOGRAPHICAL PRESENCE
21.18.5 RECENT DEVELOPMENTS
21.19 ASAHI GROUP HOLDINGS, LTD
21.19.1 COMPANY OVERVIEW
21.19.2 REVENUE ANALYSIS
21.19.3 PRODUCT PORTFOLIO
21.19.4 GEOGRAPHICAL PRESENCE
21.19.5 RECENT DEVELOPMENTS
21.2 WHITE ROCK PRODUCTS CORPORATION
21.20.1 COMPANY OVERVIEW
21.20.2 REVENUE ANALYSIS
21.20.3 PRODUCT PORTFOLIO
21.20.4 GEOGRAPHICAL PRESENCE
21.20.5 RECENT DEVELOPMENTS
*NOTE: THE COMPANIES PROFILED IS NOT EXHAUSTIVE LIST AND IS AS PER OUR PREVIOUS CLIENT REQUIREMENT. WE PROFILE MORE THAN 100 COMPANIES IN OUR STUDY AND HENCE THE LIST OF COMPANIES CAN BE MODIFIED OR REPLACED ON REQUEST.
22 RELATED REPORTS
23 CONCLUSION
24 QUESTIONNAIRE
25 ABOUT DATA BRIDGE MARKET RESEARCH
Global Tonic Water Market, Supply Chain Analysis and Ecosystem Framework
To support market growth and help clients navigate the impact of geopolitical shifts, DBMR has integrated in-depth supply chain analysis into its Global Tonic Water Market research reports. This addition empowers clients to respond effectively to global changes affecting their industries. The supply chain analysis section includes detailed insights such as Global Tonic Water Market consumption and production by country, price trend analysis, the impact of tariffs and geopolitical developments, and import and export trends by country and HSN code. It also highlights major suppliers with data on production capacity and company profiles, as well as key importers and exporters. In addition to research, DBMR offers specialized supply chain consulting services backed by over a decade of experience, providing solutions like supplier discovery, supplier risk assessment, price trend analysis, impact evaluation of inflation and trade route changes, and comprehensive market trend analysis.
Data collection and base year analysis are done using data collection modules with large sample sizes. The stage includes obtaining market information or related data through various sources and strategies. It includes examining and planning all the data acquired from the past in advance. It likewise envelops the examination of information inconsistencies seen across different information sources. The market data is analysed and estimated using market statistical and coherent models. Also, market share analysis and key trend analysis are the major success factors in the market report. To know more, please request an analyst call or drop down your inquiry.
The key research methodology used by DBMR research team is data triangulation which involves data mining, analysis of the impact of data variables on the market and primary (industry expert) validation. Data models include Vendor Positioning Grid, Market Time Line Analysis, Market Overview and Guide, Company Positioning Grid, Patent Analysis, Pricing Analysis, Company Market Share Analysis, Standards of Measurement, Global versus Regional and Vendor Share Analysis. To know more about the research methodology, drop in an inquiry to speak to our industry experts.
Data Bridge Market Research is a leader in advanced formative research. We take pride in servicing our existing and new customers with data and analysis that match and suits their goal. The report can be customized to include price trend analysis of target brands understanding the market for additional countries (ask for the list of countries), clinical trial results data, literature review, refurbished market and product base analysis. Market analysis of target competitors can be analyzed from technology-based analysis to market portfolio strategies. We can add as many competitors that you require data about in the format and data style you are looking for. Our team of analysts can also provide you data in crude raw excel files pivot tables (Fact book) or can assist you in creating presentations from the data sets available in the report.


