
Global Volatile Organic Compounds Concentrator Voc Concentrator Market
Market Size in USD Billion
 USD
1.12 Billion
USD
1.43 Billion
2024
2032
USD
1.12 Billion
USD
1.43 Billion
2024
2032
| 2025 - 2032 | |
| USD 1.12 Billion | |
| USD 1.43 Billion | |
| % | |
|
Volatile Organic Compound (VOC) Concentrator Market Analysis
The Global Volatile Organic Compound (VOC) concentrator market is driven by stringent environmental regulations and the growing need for air pollution control across industries such as automotive, electronics, and chemical processing. Advancements in adsorption and desorption technologies enhance efficiency, reducing operating costs and emissions. Market growth is influenced by rising industrial activities, sustainability initiatives, and the shift toward energy-efficient solutions. However, fluctuating raw material prices, high initial investment costs, and supply chain disruptions pose challenges. Emerging markets and technological innovations in VOC capture and recovery systems offer significant growth opportunities, making the sector increasingly competitive and innovation-driven.
Volatile Organic Compound (VOC) Concentrator Market Size
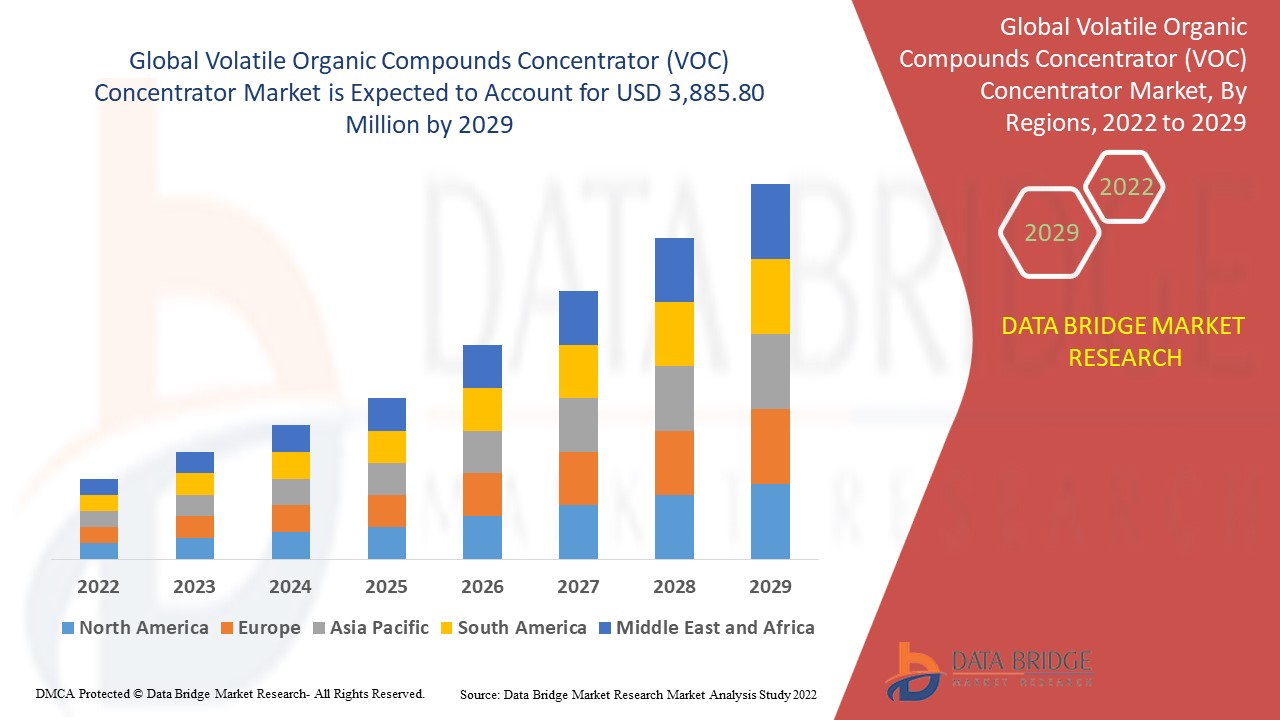
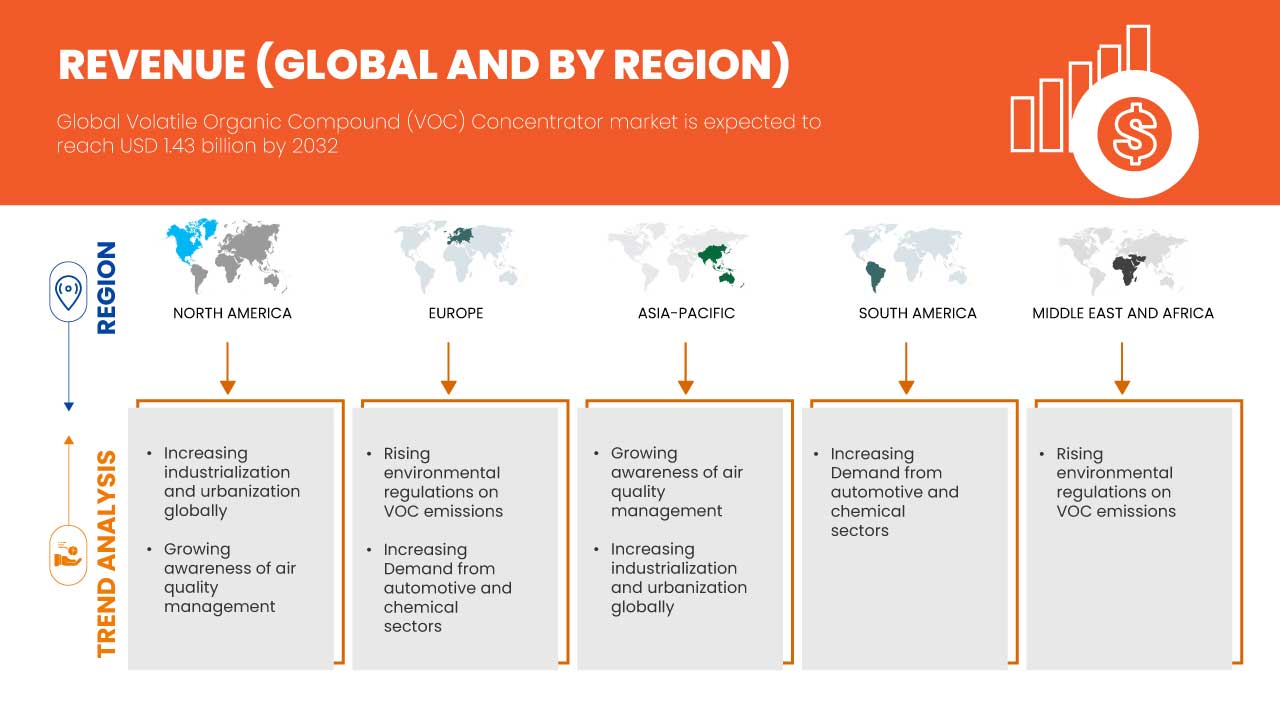
The global Volatile Organic Compound (VOC) concentrator market is expected to reach USD 1.43 billion by 2032 from USD 1.12 billion in 2024, growing with a substantial CAGR of 3.11% in the forecast period of 2025 to 2032.
In addition to the insights on market scenarios such as market value, growth rate, segmentation, geographical coverage, and major players, the market reports curated by the Data Bridge Market Research also include import export analysis, production capacity overview, production consumption analysis, price trend analysis, climate change scenario, supply chain analysis, value chain analysis, raw material/consumables overview, vendor selection criteria, PESTLE Analysis, Porter Analysis, and regulatory framework.
Volatile Organic Compound (VOC) Concentrator Market Trends
“Rising adoption of sustainable air pollution control technologies”
The Volatile Organic Compound (VOC) Concentrator Market is experiencing significant growth due to stricter environmental regulations and the rising adoption of sustainable air pollution control technologies. Industries are shifting toward high-efficiency adsorption systems to reduce emissions and operational costs. Key trends include advancements in zeolite-based concentrators, increased integration with regenerative thermal oxidizers (RTOs), and a focus on energy-efficient solutions. The demand for compact, modular systems is growing, particularly in automotive, chemical, and electronics manufacturing. Additionally, digital monitoring and automation are enhancing system performance. Emerging markets and government incentives for cleaner production further drive market expansion and innovation.
Report Scope and Volatile Organic Compound (VOC) Concentrator Market Segmentation
|
Attributes |
Volatile Organic Compound (VOC) Concentrator Market Insights |
|
Segments Covered |
|
|
Countries Covered |
U.S., Canada, Mexico, Germany, U.K., France, Italy, Russia, Spain, Belgium, Switzerland, Netherlands, Turkey, Luxemburg, Rest of Europe, China, Japan, India, South Korea, Australia & New Zealand, Singapore, Malaysia, Indonesia, Thailand, Philippines, Rest of Asia-Pacific, Brazil, Argentina, Rest of South America, United Arab Emirates, Saudi Arabia, South Africa, Egypt, Israel, and Rest of Middle East and Africa |
|
Key Market Players |
Teledyne Technologies Incorporated (U.S.), NICHIAS CORPORATION (Japan), Munters AB (Sweden), Dürr Aktiengesellschaft (Germany), Seibu Giken Co., Ltd (Japan), airTReco (Italy), Catalytic Products International (U.S.), CECO ENVIRONMENTAL (U.S.), Condorchem Enviro Solutions (Spain), Cycle Therm, LLC (U.S.), SG America Inc. (U.S.), Ship and Shore Environmental, Inc (U.S.), Taikisha USA Inc (U.S.), TANN Corporation (U.S.), Tecam Soluciones Medioambientales S.L (Spain), The CMM Group (U.S.) |
|
Market Opportunities |
|
|
Value Added Data Infosets |
In addition to the insights on market scenarios such as market value, growth rate, segmentation, geographical coverage, and major players, the market reports curated by the Data Bridge Market Research also include import export analysis, production capacity overview, production consumption analysis, price trend analysis, climate change scenario, supply chain analysis, value chain analysis, raw material/consumables overview, vendor selection criteria, PESTLE Analysis, Porter Analysis, and regulatory framework. |
Volatile Organic Compound (VOC) Concentrator Market Definition
A VOC Concentrator is an air pollution control device designed to capture and concentrate Volatile Organic Compounds (VOCs) from industrial exhaust streams. It improves the efficiency of downstream treatment systems like thermal oxidizers or carbon adsorption units by reducing the volume of air requiring treatment while increasing the VOC concentration. The process typically involves adsorption and desorption using materials like activated carbon or zeolite. In the adsorption phase, VOC-laden air passes through the concentrator, where VOCs adhere to the adsorbent. The cleaned air is then released into the atmosphere. During desorption, a smaller stream of heated air removes the concentrated VOCs from the adsorbent, sending them to a destruction or recovery system. VOC concentrators are widely used in industries such as automotive painting, semiconductor manufacturing, printing, and chemical processing, where large volumes of air with low VOC concentrations require treatment. They offer energy efficiency and cost savings by reducing fuel consumption in VOC destruction systems.
Volatile Organic Compound (VOC) Concentrator Market Dynamics
Drivers
- Rising Environmental Regulations on Voc Emissions
The global market for Volatile Organic Compound (VOC) concentrators is experiencing significant growth, largely fueled by the increasing implementation of stringent environmental regulations on VOC emissions. Governments and regulatory bodies worldwide are intensifying their efforts to mitigate the adverse environmental and health impacts associated with VOCs, which are key contributors to air pollution, smog formation, and various respiratory health issues.
Regulatory frameworks such as the U.S. Environmental Protection Agency’s (EPA) National Emission Standards for Hazardous Air Pollutants (NESHAP) and the European Union’s Industrial Emissions Directive (IED) have established rigorous emission limits for industries, particularly those involved in automotive manufacturing, chemical processing, electronics, printing, and coating applications. These regulations mandate businesses to adopt effective air pollution control technologies, thereby driving the demand for VOC concentrators as a critical solution for compliance. VOC concentrators are particularly attractive to industries due to their efficiency in capturing and reducing VOC emissions while maintaining operational cost-effectiveness. By concentrating VOCs into a smaller, high-concentration airflow, these systems enable thermal oxidizers and other destruction technologies to operate with reduced energy consumption. As a result, industries can achieve regulatory compliance while simultaneously optimizing their operational expenditures—a key factor influencing their adoption.
For instance,
- According to an article published on EFCA website The VOC Solvents Emissions Directive (1999/13/EC), part of the EU Industrial Emissions Directive (IED), enforces strict VOC limits across industries like printing, pharmaceuticals, and surface cleaning. It mandates emission reduction via technologies like VOC concentrators or alternative methods, such as solvent-free processes. Since 2007, compliance for existing installations has driven demand for VOC concentrators, helping industries meet regulatory standards, reduce environmental impact, and avoid penalties
(Note-Year and Months are not mentioned in the website)
- India’s Central Pollution Control Board (CPCB) conducted a study in the Lote Parshuram Industrial Area, targeting VOC emissions from pharmaceuticals, dyes, pesticides, and paint industries. With no national standards for VOCs (except benzene), CPCB highlighted the health risks and environmental impacts of VOCs, urging industries to adopt emission control measures. This initiative has driven demand for VOC concentrators as industries prepare for stricter regulations and address public and environmental concerns
- In May 2024 according to an article published on EPA website the EPA's Clean Air Act (CAA) enforces strict VOC emission controls under the National Emissions Standards for Hazardous Air Pollutants (NESHAPs), targeting industrial and mobile sources like vehicles and fuel systems. These regulations require industries to adopt advanced technologies, such as VOC concentrators, to reduce harmful emissions and meet compliance standards. This regulatory framework significantly drives the demand for VOC concentrators in industries aiming to mitigate environmental and health impacts effectively
Increasing Industrialization and Urbanization Globally
The rapid pace of industrialization and urbanization across the globe is a significant driver for the Global Volatile Organic Compound (VOC) Concentrator Market. As industries expand and urban areas grow, the volume of emissions from industrial processes and urban activities has surged, necessitating robust emission control technologies to ensure compliance with stringent environmental regulations and mitigate health risks.
Industries such as automotive, electronics, chemicals, and painting/coating are primary contributors to VOC emissions due to their reliance on solvents and volatile substances in manufacturing and processing. The rise in production activities to meet growing consumer demand has amplified VOC emissions, prompting manufacturers to adopt advanced VOC concentrators as an effective solution for capturing and eliminating harmful emissions. These systems not only reduce the environmental impact but also assist businesses in meeting regulatory standards set by governing bodies, such as the EPA, EU directives, and other national regulations. Urbanization is another key factor fueling the demand for VOC concentrators. As urban centers expand, construction activities, transportation, and the operation of small-scale industries in densely populated areas contribute to higher VOC emissions. Governments and local authorities are increasingly enforcing air quality standards to protect urban populations from the adverse effects of air pollution. This has accelerated the adoption of VOC concentrators in urban areas, particularly in sectors such as commercial facilities, printing, and automotive repair shops. In addition to above, consumer awareness regarding environmental sustainability and clean air has grown significantly, creating additional pressure on industries to implement efficient emission control systems. Companies are increasingly seeking VOC concentrators that offer high efficiency, low energy consumption, and cost-effective operation, driving innovation and competition in the market.
For instance,
- In December 2023 according to an article published by United Nations Industrial Development Organization the International Yearbook of Industrial Statistics 2023 highlights global industrial growth of 2.3%, with manufacturing rising 3.2%, driven by increased activity in middle-income economies, especially in Asia and Oceania. Medium high- and high-technology industries led the recovery, fueled by innovation and rising R&D investments. Middle-income economies now account for 54.3% of global patents. This rapid industrialization underscores expanding production, innovation, and technology adoption across emerging markets worldwide
- In January 2024 according to an article published on The Economist Intelligence Unit Limited Asia-Pacific, particularly China, Japan, and South Korea, are witnessing a surge in automotive production due to rising domestic and export demand. Automotive manufacturing plants generate significant VOC emissions during processes such as painting, coating, and assembly, necessitating the adoption of VOC concentrators to comply with stringent emission standards
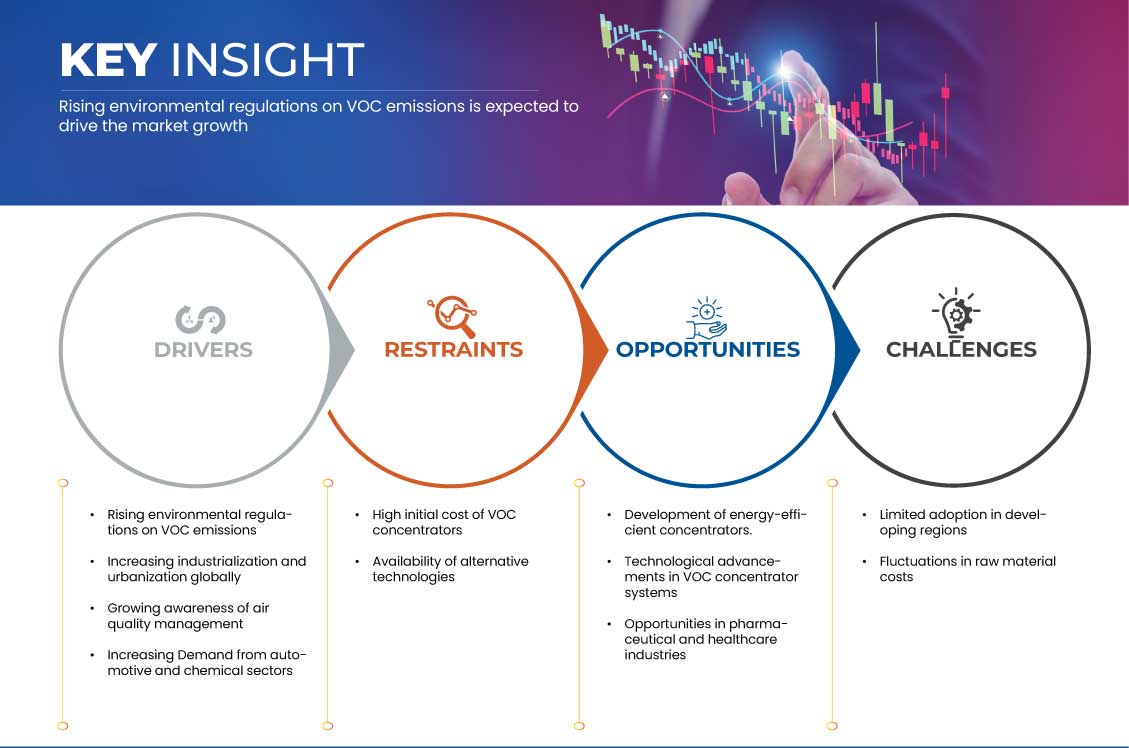
Opportunities
- Development of Energy-Efficient Concentrators
The development of energy-efficient volatile organic compound (VOC) concentrators offers numerous opportunities in the global market, driven by the increasing emphasis on sustainability, stringent environmental regulations, and advancements in industrial processes. VOC concentrators, used to control and reduce emissions of harmful organic compounds, play a critical role in industries such as automotive, chemical manufacturing, electronics, pharmaceuticals, and painting/coating operations.
As global industries such as automotive, electronics, chemicals, and painting/coating face mounting pressure to reduce their carbon footprint, the demand for eco-friendly and energy-efficient technologies is surging. Energy-efficient VOC concentrators, designed to consume less power while maintaining high performance, are attractive to businesses aiming to achieve environmental compliance and cost efficiency. Companies that invest in R&D to create innovative concentrators, such as those incorporating advanced adsorption materials and regenerative heat exchange systems, are well-positioned to tap into this demand.
For instance,
- According to an article by Taikisha USA Inc., Taikisha’s VOC concentrators are designed to reduce volatile organic compounds (VOCs) by efficiently capturing and concentrating them, enabling lower energy consumption and higher operational efficiency. Their advanced technology ensures significant energy savings while maintaining compliance with stringent environmental standards, offering both cost-effectiveness and sustainability in industrial applications
- In May 2024, According to an article by Applied Catalysts, Applied Catalysts utilizes industrial VOC oxidation catalysts to effectively treat air pollutants. These catalysts facilitate the breakdown of volatile organic compounds into less harmful substances, improving air quality. By integrating this technology into VOC concentrators, energy efficiency is optimized, helping industries meet environmental regulations while reducing operational costs
- In November 2024, according to an article by ResearchGate GmbH, the study highlights energy efficiency improvements for the vehicle assembly industry, focusing on reducing energy consumption while enhancing operational performance. By adopting energy-efficient technologies like advanced VOC concentrators, manufacturers can lower emissions, improve environmental compliance, and achieve significant cost savings, all contributing to sustainable production practices
Technological Advancements in Voc Concentrator Systems
The continuous evolution of VOC concentrator technologies presents significant opportunities in the global market. As industries face increasingly stringent environmental regulations and the growing need for sustainability, advancements in VOC concentrators offer efficient solutions to manage volatile organic compound (VOC) emissions. These developments are transforming the industry by improving performance, reducing costs, and enabling compliance with environmental standards.
The most significant technological advancements in VOC concentrators are the development of advanced adsorption materials. These materials, such as activated carbon and zeolites, are capable of efficiently capturing VOCs from industrial exhaust streams. Recent innovations in nanomaterials and composite materials have improved the adsorption capacity, allowing for more effective VOC removal with lower energy consumption. These improvements not only enhance concentrator efficiency but also reduce the operational costs associated with maintenance and material replacement.
For instance,
- According to an article by Tecam Soluciones Medioambientales S.L., Tecam’s Zeolite Rotor Concentrator (ZRC) efficiently captures and concentrates VOCs from industrial exhausts using advanced adsorption materials like zeolites. This technology enhances VOC removal while reducing energy consumption, offering significant cost savings. By integrating with downstream oxidizers, it ensures high performance, making it ideal for environmentally conscious industries
- According to an article by The CMM Group, The CMM Group’s rotary concentrator systems offer a cost-effective solution for VOC abatement by using regenerative heat exchange to recover and reuse energy. These systems concentrate VOCs from large air streams, improving efficiency while minimizing energy consumption. This sustainable approach ensures compliance with environmental standards and reduces operational costs
- In September 2024, according to an article by Elsevier Inc., IoT-enabled VOC concentrators, leverage real-time monitoring and data analysis to optimize VOC emission control. These systems enhance efficiency through predictive maintenance and automated adjustments, reducing energy consumption and operational costs while ensuring compliance with stringent environmental regulations in industrial applications
Restraints/Challenges
- High Initial Cost of Voc Concentrators
The high initial cost associated with VOC concentrators is a significant restraint impacting the growth of the Global Volatile Organic Compound (VOC) Concentrator Market. While VOC concentrators are highly effective in reducing emissions and ensuring compliance with stringent environmental regulations, their upfront cost can be prohibitive for small- and medium-sized enterprises (SMEs), particularly in developing economies.
VOC concentrators, especially advanced systems like regenerative thermal oxidizers (RTOs) integrated with concentrator technology, require substantial capital investment. The costs include not only the equipment itself but also installation, customization, and integration into existing industrial processes. For industries operating on tight budgets, such as small-scale automotive workshops, chemical producers, or printing businesses, these costs can deter adoption. Moreover, the lack of widespread financial incentives or subsidies in certain regions exacerbates the issue. Many businesses in emerging markets face challenges in securing funding or loans to invest in such high-cost equipment, making it difficult for them to comply with strict environmental regulations. Non-compliance risks penalties, but the initial investment remains a barrier to entry.
For instance,
- According to an article published on Kono Kogs, Inc a VOC rotary concentrator system, which requires pairing with a downstream oxidizer such as a regenerative thermal oxidizer (RTO), catalytic oxidizer, or thermal oxidizer, exemplifies the high initial cost of VOC concentrators. While effective in reducing operational costs through 30-60% fuel and 30-45% electricity savings, the upfront capital cost for the system is significantly higher than standalone options
Limited Adoption in Developing Regions
Volatile Organic Compound (VOC) concentrators play a critical role in controlling air pollution by capturing and reducing harmful emissions, particularly in industrial processes. However, the limited adoption of VOC concentrators in developing regions poses significant challenges that hinder the global market's growth.
Lack of stringent environmental regulations in certain developing countries. Governments in these regions may not enforce strict policies for VOC emission control, reducing the incentive for industries to adopt VOC concentrators. In contrast, stricter regulations in developed regions have been a significant driver of market growth.
Technical knowledge gaps also play a role. Limited expertise in operating and maintaining VOC concentrators can discourage industries from adopting the technology. This knowledge gap is further exacerbated by insufficient training programs and a lack of skilled labor to manage the systems effectively.
For instance,
- In September 2023, according to an article by Frontiers Media S.A, the significant initial costs associated with implementing sustainable energy systems, which can deter adoption in developing regions. Additionally, political and societal barriers, such as inadequate policy frameworks and resistance to change, further impede the transition to sustainable energy solutions
- In November 2024, according to an article by ResearchGate GmbH, The study, "Airborne Volatile Organic Compounds in Urban and Industrial Locations in Four Developing Countries," highlights the significant presence of VOCs in developing countries such as Hanoi, Vietnam and Dhaka, Bangladesh,. It reveals that urban and industrial areas in these regions often exceed recommended VOC limits, exacerbating health and environmental risks due to inadequate emission control measures
Impact and Current Market Scenario of Raw Material Shortage and Shipping Delays
Data Bridge Market Research offers a high-level analysis of the market and delivers information by keeping in account the impact and current market environment of raw material shortage and shipping delays. This translates into assessing strategic possibilities, creating effective action plans, and assisting businesses in making important decisions.
Apart from the standard report, we also offer in-depth analysis of the procurement level from forecasted shipping delays, distributor mapping by region, commodity analysis, production analysis, price mapping trends, sourcing, category performance analysis, supply chain risk management solutions, advanced benchmarking, and other services for procurement and strategic support.
Expected Impact of Economic Slowdown on the Pricing and Availability of Products
When economic activity slows, industries begin to suffer. The forecasted effects of the economic downturn on the pricing and accessibility of the products are taken into account in the market insight reports and intelligence services provided by DBMR. With this, our clients can typically keep one step ahead of their competitors, project their sales and revenue, and estimate their profit and loss expenditures.
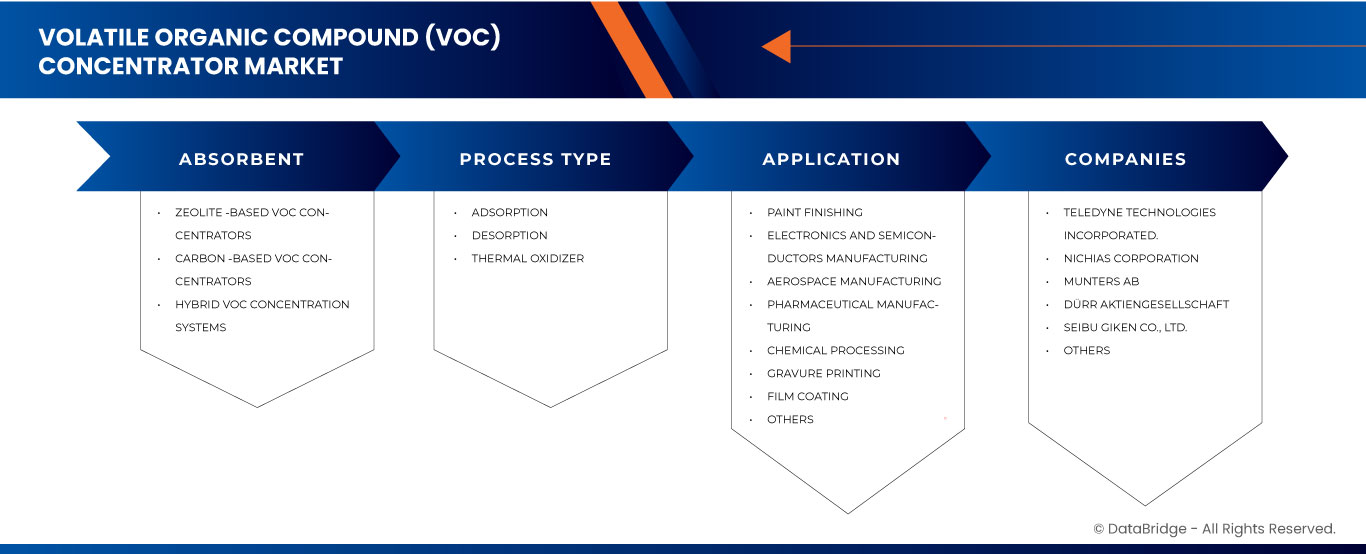
Volatile Organic Compound (VOC) Concentrator Market Scope
The market is segmented on the basis of absorbent, process type, and application. The growth amongst these segments will help you analyze meagre growth segments in the industries and provide the users with a valuable market overview and market insights to help them make strategic decisions for identifying core market applications.
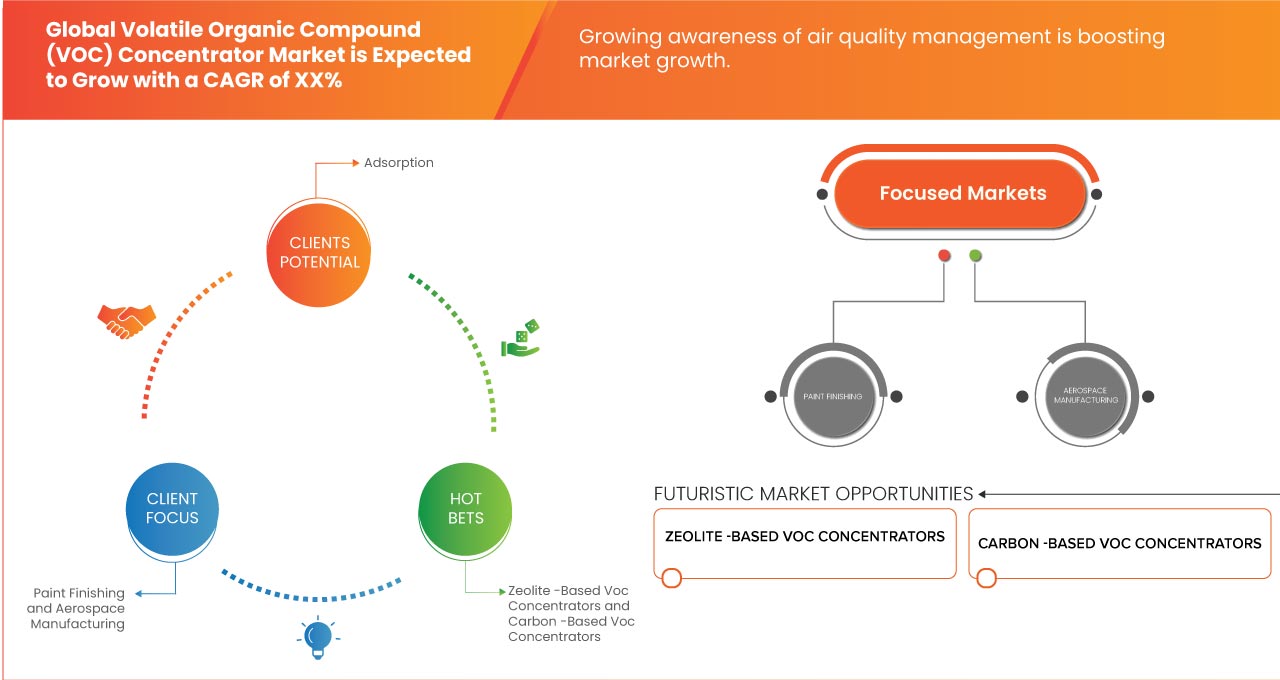
By Absorbent
- Zeolite -Based VOC Concentrators
- Carbon -Based VOC Concentrators
- Hybrid VOC Concentration Systems
By Process Type
- Adsorption
- Desorption
- Thermal Oxidizer
By Application
- Paint Finishing
- Low-Inlet VOC Emissions
- Decorative Painting
- Automotive
- Industrial
- Electronics And Semiconductors Manufacturing
- Aerospace Manufacturing
- Spray Painting for Aircraft
- Composite Material Production
- Surface Treatments
- Others
- Pharmaceutical Manufacturing
- Drug Formulation
- Solvent-Based Packaging
- Coating Of Pharmaceutical Tablets
- Chemical Processing
- Industrial Chemical Synthesis
- Petrochemical And Chemical Processing Plants
- Gravure Printing
- Film Coating
- Others
Volatile Organic Compound (VOC) Concentrator Market Regional Analysis
The market is segmented on the basis of absorbent, process type, and application.
The countries covered in the market are U.S., Canada, Mexico, Germany, U.K., France, Italy, Russia, Spain, Belgium, Switzerland, Netherlands, Turkey, Luxemburg, rest of Europe, China, Japan, India, South Korea, Australia & New Zealand, Singapore, Malaysia, Indonesia, Thailand, Philippines, rest of Asia-Pacific, Brazil, Argentina, rest of South America, United Arab Emirates, Saudi Arabia, South Africa, Egypt, Israel, and rest of Middle East and Africa.
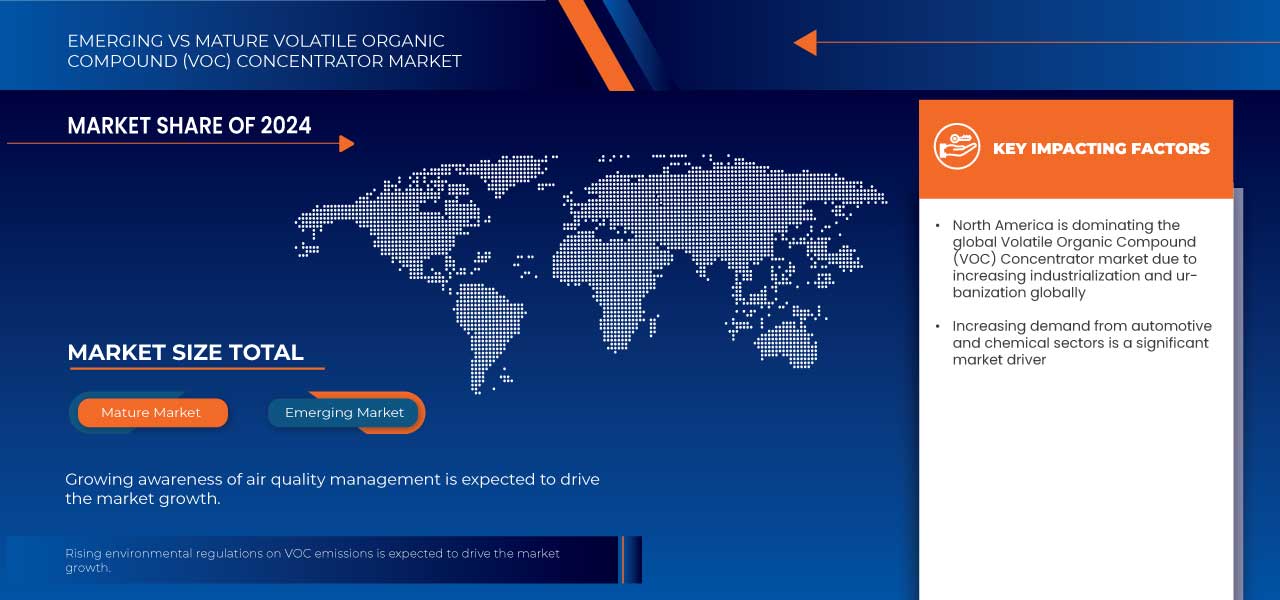
North America is expected to dominate the market due to strict environmental regulations, increasing industrial emissions, and the presence of key market players.
The Asia-Pacific region is the fastest-growing VOC concentrator market, driven by rapid industrialization, stringent environmental regulations, and rising investments in pollution control technologies. Expanding manufacturing sectors, increasing awareness of air quality, and government incentives further accelerate market growth across industries like automotive, electronics, and chemicals.
The country section of the report also provides individual market impacting factors and changes in regulation in the market domestically that impacts the current and future trends of the market. Data points like down-stream and upstream value chain analysis, technical trends and porter's five forces analysis, case studies are some of the pointers used to forecast the market scenario for individual countries. Also, the presence and availability of global brands and their challenges faced due to large or scarce competition from local and domestic brands, impact of domestic tariffs and trade routes are considered while providing forecast analysis of the country data.
Volatile Organic Compound (VOC) Concentrator Market Share
The market competitive landscape provides details by competitors. Details included are company overview, company financials, revenue generated, market potential, investment in research and development, new market initiatives, global presence, production sites and facilities, production capacities, company strengths and weaknesses, product launch, product width and breadth, application dominance. The above data points provided are only related to the companies' focus related to market.
Volatile Organic Compound (VOC) Concentrator Market Leaders Operating in the Market Are:
- Teledyne Technologies Incorporated (U.S.)
- NICHIAS CORPORATION (Japan)
- Munters AB (Sweden)
- Dürr Aktiengesellschaft (Germany)
- Seibu Giken Co., Ltd (Japan)
Latest Developments in Volatile Organic Compound (VOC) Concentrator Market
- In October 2024, Munters has acquired Hotraco, a leading developer of control systems and sensors for the agricultural sector, to enhance its FoodTech offerings. The acquisition aligns with Munters' digital strategy to create a data-driven ecosystem for efficient and sustainable food production. Hotraco’s premium automation solutions for poultry, layers, greenhouses, and crop storage expand Munters' reach in the food supply chain, especially in Europe. With an installed base of 45,000 controllers in 50 countries, this acquisition strengthens Munters’ European presence and integrates more data into its ecosystem. The deal is expected to close in Q4 2024
- In November 2022, Dürr received the BMW Group Supplier Innovation Award in the “Sustainability” category for its EcoPaintJet Pro painting process. This innovative, overspray-free technology enables precise, fully automated two-tone car painting while significantly reducing material waste. The BMW Group became the first automaker to implement EcoPaintJet Pro in series production at its Leipzig plant, enhancing efficiency and sustainability. Dürr CEO Dr. Jochen Weyrauch highlighted the collaboration with BMW as a key factor in revolutionizing automotive painting. This marks Dürr’s second BMW Group Supplier Innovation Award, following its 2011 recognition for the EcoDryScrubber technology
- In January 2025, CECO Environmental announced the successful acquisition of Profire Energy, a leading provider of intelligent control solutions for industrial combustion appliances. The USD 122.7 million transaction, finalized on January 3, enhances CECO’s position as a top environmental solutions provider in industrial markets. CECO’s CEO, Todd Gleason, highlighted the acquisition’s role in accelerating Profire’s growth across new energy, industrial, and international markets. This strategic move aligns with CECO’s mission to deliver innovative and efficient solutions that protect people, the environment, and industrial equipment
- In January 2022, CECO Environmental announced the successful acquisition of Profire Energy, a leading provider of intelligent control solutions for industrial combustion appliances. The USD 122.7 million transaction, finalized on January 3, enhances CECO’s position as a top environmental solutions provider in industrial markets. CECO’s CEO, Todd Gleason, highlighted the acquisition’s role in accelerating Profire’s growth across new energy, industrial, and international markets. This strategic move aligns with CECO’s mission to deliver innovative and efficient solutions that protect people, the environment, and industrial equipment
- In July 2022, TKS Industrial has been honored with the 2022 Excellent Performance Award from Toyota Motor North America. Toyota recognized the company for exceeding expectations on numerous projects, despite facing challenging conditions. This award highlights the dedication of the TKS team, from back-office staff to job site personnel. TKS remains committed to delivering high-quality products and services, ensuring the continued satisfaction of both new and returning customers
SKU-

- Interactive Data Analysis Dashboard
- Company Analysis Dashboard for high growth potential opportunities
- Research Analyst Access for customization & queries
- Competitor Analysis with Interactive dashboard
- Latest News, Updates & Trend analysis
- Harness the Power of Benchmark Analysis for Comprehensive Competitor Tracking
Table of Content
1 INTRODUCTION
1.1 OBJECTIVES OF THE STUDY
1.2 MARKET DEFINITION
1.3 OVERVIEW
1.4 LIMITATIONS
1.5 MARKETS COVERED
2 MARKET SEGMENTATION
2.1 MARKETS COVERED
2.2 GEOGRAPHICAL SCOPE
2.3 YEARS CONSIDERED FOR THE STUDY
2.4 CURRENCY AND PRICING
2.5 DBMR TRIPOD DATA VALIDATION MODEL
2.6 MULTIVARIATE MODELING
2.7 PRIMARY INTERVIEWS WITH KEY OPINION LEADERS
2.8 DBMR MARKET POSITION GRID
2.9 DBMR VENDOR SHARE ANALYSIS
2.1 MARKET APPLICATION COVERAGE GRID
2.11 SECONDARY SOURCES
2.12 ASSUMPTIONS
3 EXECUTIVE SUMMARY
4 PREMIUM INSIGHTS
4.1 PESTEL ANALYSIS
4.1.1 POLITICAL FACTORS
4.1.2 ECONOMIC FACTORS
4.1.3 SOCIAL FACTORS
4.1.4 TECHNOLOGICAL FACTORS
4.1.5 ENVIRONMENTAL FACTORS
4.1.6 LEGAL FACTORS
4.2 PORTER’S FIVE FORCES ANALYSIS
4.2.1 THREAT OF NEW ENTRANTS
4.2.2 BARGAINING POWER OF SUPPLIERS
4.2.3 BARGAINING POWER OF BUYERS
4.2.4 THREAT OF SUBSTITUTES
4.2.5 INTERNAL COMPETITION
4.3 IMPORT EXPORT SCENARIO
4.4 VENDOR SELECTION CRITERIA
4.4.1 QUALITY AND CONSISTENCY
4.4.2 TECHNICAL EXPERTISE
4.4.3 SUPPLY CHAIN RELIABILITY
4.4.4 COMPLIANCE AND SUSTAINABILITY
4.4.5 COST AND PRICING STRUCTURE
4.4.6 FINANCIAL STABILITY
4.4.7 FLEXIBILITY AND CUSTOMIZATION
4.4.8 RISK MANAGEMENT AND CONTINGENCY PLANS
4.5 PRICE INDEX
4.6 PRODUCTION CONSUMPTION ANALYSIS
4.7 CLIMATE CHANGE SCENARIO
4.7.1 ENVIRONMENTAL CONCERNS
4.7.2 INDUSTRY RESPONSE
4.7.3 GOVERNMENT'S ROLE
4.7.4 ANALYST RECOMMENDATION
4.8 PRODUCTION CAPACITY OVERVIEW
4.8.1 CURRENT PRODUCTION CAPACITY
4.8.2 REGIONAL DYNAMICS IN PRODUCTION CAPACITY
4.8.3 KEY FACTORS DRIVING CAPACITY EXPANSION
4.8.4 CHALLENGES IN SCALING PRODUCTION
4.9 RAW MATERIAL PRODUCTION COVERAGE
4.1 SUPPLY CHAIN ANALYSIS FOR GLOBAL VOLATILE ORGANIC COMPOUND CONCENTRATOR (VOC) CONCENTRATOR MARKET
4.10.1 OVERVIEW
4.10.2 LOGISTIC COST SCENARIO
4.10.3 IMPORTANCE OF LOGISTICS SERVICE PROVIDERS
4.11 TECHNOLOGY ADVANCEMENTS BY MANUFACTURERS
5 REGULATORY COVERAGE
6 MARKET OVERVIEW
6.1 DRIVERS
6.1.1 RISING ENVIRONMENTAL REGULATIONS ON VOC EMISSIONS
6.1.2 INCREASING INDUSTRIALIZATION AND URBANIZATION GLOBALLY
6.1.3 GROWING AWARENESS OF AIR QUALITY MANAGEMENT
6.1.4 INCREASING DEMAND FROM AUTOMOTIVE AND CHEMICAL SECTORS
6.2 RESTRAINTS
6.2.1 HIGH INITIAL COST OF VOC CONCENTRATORS
6.2.2 AVAILABILITY OF ALTERNATIVE TECHNOLOGIES
6.3 OPPORTUNITIES
6.3.1 DEVELOPMENT OF ENERGY-EFFICIENT CONCENTRATORS
6.3.2 TECHNOLOGICAL ADVANCEMENTS IN VOC CONCENTRATOR SYSTEMS
6.3.3 OPPORTUNITIES IN PHARMACEUTICAL AND HEALTHCARE INDUSTRIES
6.4 CHALLENGES
6.4.1 LIMITED ADOPTION IN DEVELOPING REGIONS
6.4.2 FLUCTUATIONS IN RAW MATERIAL COSTS
7 GLOBAL VOLATILE ORGANIC COMPOUND (VOC) CONCENTRATOR MARKET, BY ABSORBENT
7.1 OVERVIEW
7.2 ZEOLITE -BASED VOC CONCENTRATORS
7.3 CARBON -BASED VOC CONCENTRATORS
7.4 HYBRID VOC CONCENTRATION SYSTEMS
8 GLOBAL VOLATILE ORGANIC COMPOUND (VOC) CONCENTRATOR MARKET, BY PROCESS TYPE
8.1 OVERVIEW
8.2 ADSORPTION
8.3 DESORPTION
8.4 THERMAL OXIDIZER
9 GLOBAL VOLATILE ORGANIC COMPOUND (VOC) CONCENTRATOR MARKET, BY APPLICATION
9.1 OVERVIEW
9.2 PAINT FINISHING
9.3 ELECTRONICS AND SEMICONDUCTORS MANUFACTURING
9.4 AEROSPACE MANUFACTURING
9.5 PHARMACEUTICAL MANUFACTURING
9.6 CHEMICAL PROCESSING
9.7 PETROCHEMICAL AND CHEMICAL PROCESSING PLANTS.
9.8 GRAVURE PRINTING
9.9 FILM COATING
9.1 OTHERS
10 GLOBAL VOLATILE ORGANIC COMPOUND (VOC) CONCENTRATOR MARKET, BY REGION
10.1 OVERVIEW
10.2 NORTH AMERICA
10.2.1 U.S.
10.2.2 CANADA
10.2.3 MEXICO
10.3 ASIA-PACIFIC
10.3.1 CHINA
10.3.2 JAPAN
10.3.3 SOUTH KOREA
10.3.4 INDIA
10.3.5 SINGAPORE
10.3.6 THAILAND
10.3.7 AUSTRALIA AND NEW ZEALAND
10.3.8 INDONESIA
10.3.9 MALAYSIA
10.3.10 PHILIPPINES
10.3.11 REST OF ASIA-PACIFIC
10.4 EUROPE
10.4.1 GERMANY
10.4.2 U.K.
10.4.3 ITALY
10.4.4 FRANCE
10.4.5 SPAIN
10.4.6 RUSSIA
10.4.7 SWITZERLAND
10.4.8 TURKEY
10.4.9 BELGIUM
10.4.10 NETHERLANDS
10.4.11 LUXEMBURG
10.4.12 REST OF EUROPE
10.5 MIDDLE EAST AND AFRICA
10.5.1 SAUDI ARABIA
10.5.2 UNITED ARAB EMIRATES
10.5.3 SOUTH AFRICA
10.5.4 EGYPT
10.5.5 ISRAEL
10.5.6 REST OF MIDDLE EAST AND AFRICA
10.6 SOUTH AMERICA
10.6.1 BRAZIL
10.6.2 ARGENTINA
10.6.3 REST OF SOUTH AMERICA
11 GLOBAL VOLATILE ORGANIC COMPOUND (VOC) CONCENTRATOR MARKET: COMPANY LANDSCAPE
11.1 COMPANY SHARE ANALYSIS: GLOBAL
11.2 COMPANY SHARE ANALYSIS: ASIA-PACIFIC
11.3 COMPANY SHARE ANALYSIS: EUROPE
11.4 COMPANY SHARE ANALYSIS: NORTH AMERICA
12 SWOT ANALYSIS
13 COMPANY PROFILES
13.1 TELEDYNE TECHNOLOGIES INCORPORATED.
13.1.1 COMPANY SNAPSHOT
13.1.2 REVENUE ANALYSIS
13.1.3 COMPANY SHARE ANALYSIS
13.1.4 PRODUCT PORTFOLIO
13.1.5 RECENT DEVELOPMENTS
13.2 NICHIAS CORPORATION
13.2.1 COMPANY SNAPSHOT
13.2.2 REVENUE ANALYSIS
13.2.3 COMPANY SHARE ANALYSIS
13.2.4 PRODUCT PORTFOLIO
13.2.5 RECENT DEVELOPMENTS
13.3 MUNTERS AB
13.3.1 COMPANY SNAPSHOT
13.3.2 REVENUE ANALYSIS
13.3.3 COMPANY SHARE ANALYSIS
13.3.4 PRODUCT PORTFOLIO
13.3.5 RECENT DEVELOPMENTS
13.4 DÜRR AKTIENGESELLSCHAFT
13.4.1 COMPANY SNAPSHOT
13.4.2 REVENUE ANALYSIS
13.4.3 COMPANY SHARE ANALYSIS
13.4.4 PRODUCT PORTFOLIO
13.4.5 RECENT DEVELOPMENTS
13.5 SEIBU GIKEN CO., LTD.
13.5.1 COMPANY SNAPSHOT
13.5.2 REVENUE ANALYSIS
13.5.3 COMPANY SHARE ANALYSIS
13.5.4 PRODUCT PORTFOLIO
13.5.5 RECENT DEVELOPMENTS
13.6 AIRTRECO
13.6.1 COMPANY SNAPSHOT
13.6.2 PRODUCT PORTFOLIO
13.6.3 RECENT DEVELOPMENT
13.7 CATALYTIC PRODUCTS INTERNATIONAL
13.7.1 COMPANY SNAPSHOT
13.7.2 PRODUCT PORTFOLIO
13.7.3 RECENT DEVELOPMENT
13.8 CECO ENVIRONMENTAL
13.8.1 COMPANY SNAPSHOT
13.8.2 REVENUE ANALYSIS
13.8.3 PRODUCT PORTFOLIO
13.8.4 RECENT DEVELOPMENTS
13.9 CONDORCHEM ENVIRO SOLUTIONS
13.9.1 COMPANY SNAPSHOT
13.9.2 PRODUCT PORTFOLIO
13.9.3 RECENT DEVELOPMENTS
13.1 CYCLE THERM, LLC
13.10.1 COMPANY SNAPSHOT
13.10.2 PRODUCT/BRAND PORTFOLIO
13.10.3 RECENT DEVELOPMENTS
13.11 SG AMERICA INC.
13.11.1 COMPANY SNAPSHOT
13.11.2 PRODUCT PORTFOLIO
13.11.3 RECENT DEVELOPMENT
13.12 SHIP AND SHORE ENVIRONMENTAL, INC.
13.12.1 COMPANY SNAPSHOT
13.12.2 PRODUCT PORTFOLIO
13.12.3 RECENT DEVELOPMENT
13.13 TAIKISHA USA INC.
13.13.1 COMPANY SNAPSHOT
13.13.2 PRODUCT PORTFOLIO
13.13.3 RECENT DEVELOPMENTS
13.14 TANN CORPORATION
13.14.1 COMPANY SNAPSHOT
13.14.2 PRODUCT PORTFOLIO
13.14.3 RECENT DEVELOPMENT
13.15 TECAM SOLUCIONES MEDIOAMBIENTALES S.L.
13.15.1 COMPANY SNAPSHOT
13.15.2 PRODUCT PORTFOLIO
13.15.3 RECENT DEVELOPMENT
13.16 THE CMM GROUP
13.16.1 COMPANY SNAPSHOT
13.16.2 PRODUCT PORTFOLIO
13.16.3 RECENT DEVELOPMENTS
14 QUESTIONNAIRE
15 RELATED REPORTS
List of Table
TABLE 1 GLOBAL VOLATILE ORGANIC COMPOUND (VOC) CONCENTRATOR MARKET, 2025-2032, AVERAGE SELLING PRICE (USD/UNIT)
TABLE 2 REGULATORY COVERAGE
TABLE 3 GLOBAL VOLATILE ORGANIC COMPOUND (VOC) CONCENTRATOR MARKET, BY ABSORBENT, 2018-2032 (USD THOUSAND)
TABLE 4 GLOBAL VOLATILE ORGANIC COMPOUND (VOC) CONCENTRATOR MARKET, BY ABSORBENT, 2018-2032 (THOUSAND UNITS)
TABLE 5 GLOBAL ZEOLITE -BASED VOC CONCENTRATORS VOLATILE ORGANIC COMPOUND (VOC) CONCENTRATOR MARKET, BY REGION, 2018-2032 (USD THOUSAND)
TABLE 6 GLOBAL ZEOLITE -BASED VOC CONCENTRATORS VOLATILE ORGANIC COMPOUND (VOC) CONCENTRATOR MARKET , BY REGION, 2018-2032, (THOUSAND UNITS)
TABLE 7 GLOBAL CARBON -BASED VOC CONCENTRATORS VOLATILE ORGANIC COMPOUND (VOC) CONCENTRATOR MARKET, BY REGION, 2018-2032 (USD THOUSAND)
TABLE 8 GLOBAL CARBON -BASED VOC CONCENTRATORS VOLATILE ORGANIC COMPOUND (VOC) CONCENTRATOR MARKET, BY REGION, 2018-2032, (THOUSAND UNITS)
TABLE 9 GLOBAL HYBRID VOC CONCENTRATION SYSTEMS VOLATILE ORGANIC COMPOUND (VOC) CONCENTRATOR MARKET, BY REGION, 2018-2032 (USD THOUSAND)
TABLE 10 GLOBAL HYBRID VOC CONCENTRATION SYSTEMS VOLATILE ORGANIC COMPOUND (VOC) CONCENTRATOR MARKET , BY REGION, 2018-2032, (THOUSAND UNITS)
TABLE 11 GLOBAL VOLATILE ORGANIC COMPOUND (VOC) CONCENTRATOR MARKET, BY PROCESS TYPE, 2018-2032 (USD THOUSAND)
TABLE 12 GLOBAL ADSORPTION IN VOLATILE ORGANIC COMPOUND (VOC) CONCENTRATOR MARKET, BY REGION, 2018-2032 (USD THOUSAND)
TABLE 13 GLOBAL DESORPTION IN VOLATILE ORGANIC COMPOUND (VOC) CONCENTRATOR MARKET, BY REGION, 2018-2032 (USD THOUSAND)
TABLE 14 GLOBAL THERMAL OXIDIZER IN SYSTEMS VOLATILE ORGANIC COMPOUND (VOC) CONCENTRATOR MARKET, BY REGION, 2018-2032 (USD THOUSAND)
TABLE 15 GLOBAL VOLATILE ORGANIC COMPOUND (VOC) CONCENTRATOR MARKET, BY APPLICATION, 2018-2032 (USD THOUSAND)
TABLE 16 FIGURE 6 GLOBAL VOLATILE ORGANIC COMPOUND (VOC) CONCENTRATOR MARKET , BY REGION, 2018-2032, (USD THOUSAND)
TABLE 17 FIGURE 6 GLOBAL PAINT FURNISHING IN VOLATILE ORGANIC COMPOUND (VOC) CONCENTRATOR MARKET, BY APPLICATION, 2018-2032 (USD THOUSAND)
TABLE 18 GLOBAL ELECTRONICS AND SEMICONDUCTORS MANUFACTURING IN GLOBAL VOLATILE ORGANIC COMPOUND (VOC) CONCENTRATOR MARKET, BY REGION, 2018-2032, (USD THOUSAND)
TABLE 19 GLOBAL AEROSPACE MANUFACTURING IN GLOBAL VOLATILE ORGANIC COMPOUND (VOC) CONCENTRATOR MARKET, BY REGION, 2018-2032, (USD THOUSAND)
TABLE 20 GLOBAL AEROSPACE MANUFACTURING IN GLOBAL VOLATILE ORGANIC COMPOUND (VOC) CONCENTRATOR MARKET, BY APPLICATION , 2018-2032 (USD THOUSAND)
TABLE 21 GLOBAL PHARMACEUTICAL MANUFACTURING IN GLOBAL VOLATILE ORGANIC COMPOUND (VOC) CONCENTRATOR MARKET, BY REGION, 2018-2032, (USD THOUSAND)
TABLE 22 GLOBAL PHARMACEUTICAL MANUFACTURING IN GLOBAL VOLATILE ORGANIC COMPOUND (VOC) CONCENTRATOR MARKET, BY APPLICATION , 2018-2032 (USD THOUSAND)
TABLE 23 GLOBAL CHEMICAL PROCESSING IN GLOBAL VOLATILE ORGANIC COMPOUND (VOC) CONCENTRATOR MARKET, BY REGION, 2018-2032, (USD THOUSAND)
TABLE 24 GLOBAL CHEMICAL PROCESSING IN GLOBAL VOLATILE ORGANIC COMPOUND (VOC) CONCENTRATOR MARKET , BY APPLICATION , 2018-2032 (USD THOUSAND)
TABLE 25 GLOBAL GRAVURE PRINTINGIN GLOBAL VOLATILE ORGANIC COMPOUND (VOC) CONCENTRATOR MARKET, BY REGION, 2018-2032, (USD THOUSAND)
TABLE 26 GLOBAL FILM COATING IN GLOBAL VOLATILE ORGANIC COMPOUND (VOC) CONCENTRATOR MARKET, BY REGION, 2018-2032, (USD THOUSAND)
TABLE 27 GLOBAL OTHERS IN GLOBAL VOLATILE ORGANIC COMPOUND (VOC) CONCENTRATOR MARKET, BY REGION, 2018-2032, (USD THOUSAND)
TABLE 28 GLOBAL VOLATILE ORGANIC COMPOUND (VOC) CONCENTRATOR MARKET, BY COUNTRY, 2018-2032 (USD THOUSAND)
TABLE 29 GLOBAL VOLATILE ORGANIC COMPOUND (VOC) CONCENTRATOR MARKET, BY COUNTRY, 2018-2032 (THOUSAND UNITS)
TABLE 30 NORTH AMERICA VOLATILE ORGANIC COMPOUND (VOC) CONCENTRATOR MARKET, BY COUNTRY, 2018-2032 (USD THOUSAND)
TABLE 31 NORTH AMERICA VOLATILE ORGANIC COMPOUND (VOC) CONCENTRATOR MARKET, BY COUNTRY, 2018-2032 (THOUSAND UNITS)
TABLE 32 NORTH AMERICA VOLATILE ORGANIC COMPOUND (VOC) CONCENTRATOR MARKET, BY ABSORBENT, 2018-2032 (USD THOUSAND)
TABLE 33 NORTH AMERICA VOLATILE ORGANIC COMPOUND (VOC) CONCENTRATOR MARKET, BY ABSORBENT, 2018-2032 (THOUSAND UNITS)
TABLE 34 NORTH AMERICA VOLATILE ORGANIC COMPOUND (VOC) CONCENTRATOR MARKET, BY PROCESS TYPE, 2018-2032 (USD THOUSAND)
TABLE 35 NORTH AMERICA VOLATILE ORGANIC COMPOUND (VOC) CONCENTRATOR MARKET, BY APPLICATION, 2018-2032 (USD THOUSAND)
TABLE 36 NORTH AMERICA PAINT FURNISHING IN VOLATILE ORGANIC COMPOUND (VOC) CONCENTRATOR MARKET, BY APPLICATION, 2018-2032 (USD THOUSAND)
TABLE 37 NORTH AMERICA AEROSPACE MANUFACTURING IN VOLATILE ORGANIC COMPOUND (VOC) CONCENTRATOR MARKET, BY APPLICATION, 2018-2032 (USD THOUSAND)
TABLE 38 NORTH AMERICA PHARMACEUTICAL MANUFACTURING IN VOLATILE ORGANIC COMPOUND (VOC) CONCENTRATOR MARKET, BY APPLICATION, 2018-2032 (USD THOUSAND)
TABLE 39 NORTH AMERICA CHEMICAL PROCESSING IN VOLATILE ORGANIC COMPOUND (VOC) CONCENTRATOR MARKET, BY APPLICATION, 2018-2032 (USD THOUSAND)
TABLE 40 U.S. VOLATILE ORGANIC COMPOUND (VOC) CONCENTRATOR MARKET, BY ABSORBENT, 2018-2032 (USD THOUSAND)
TABLE 41 U.S. VOLATILE ORGANIC COMPOUND (VOC) CONCENTRATOR MARKET, BY ABSORBENT, 2018-2032 (THOUSAND UNITS)
TABLE 42 U.S. VOLATILE ORGANIC COMPOUND (VOC) CONCENTRATOR MARKET, BY PROCESS TYPE, 2018-2032 (USD THOUSAND)
TABLE 43 U.S. VOLATILE ORGANIC COMPOUND (VOC) CONCENTRATOR MARKET, BY APPLICATION, 2018-2032 (USD THOUSAND)
TABLE 44 U.S. PAINT FURNISHING IN VOLATILE ORGANIC COMPOUND (VOC) CONCENTRATOR MARKET, BY APPLICATION, 2018-2032 (USD THOUSAND)
TABLE 45 U.S. AEROSPACE MANUFACTURING IN VOLATILE ORGANIC COMPOUND (VOC) CONCENTRATOR MARKET, BY APPLICATION, 2018-2032 (USD THOUSAND)
TABLE 46 U.S. PHARMACEUTICAL MANUFACTURING IN VOLATILE ORGANIC COMPOUND (VOC) CONCENTRATOR MARKET, BY APPLICATION, 2018-2032 (USD THOUSAND)
TABLE 47 U.S. CHEMICAL PROCESSING IN VOLATILE ORGANIC COMPOUND (VOC) CONCENTRATOR MARKET, BY APPLICATION, 2018-2032 (USD THOUSAND)
TABLE 48 CANADA VOLATILE ORGANIC COMPOUND (VOC) CONCENTRATOR MARKET, BY ABSORBENT, 2018-2032 (USD THOUSAND)
TABLE 49 CANADA VOLATILE ORGANIC COMPOUND (VOC) CONCENTRATOR MARKET, BY ABSORBENT, 2018-2032 (THOUSAND UNITS)
TABLE 50 CANADA VOLATILE ORGANIC COMPOUND (VOC) CONCENTRATOR MARKET, BY PROCESS TYPE, 2018-2032 (USD THOUSAND)
TABLE 51 CANADA VOLATILE ORGANIC COMPOUND (VOC) CONCENTRATOR MARKET, BY APPLICATION, 2018-2032 (USD THOUSAND)
TABLE 52 CANADA PAINT FURNISHING IN VOLATILE ORGANIC COMPOUND (VOC) CONCENTRATOR MARKET, BY APPLICATION, 2018-2032 (USD THOUSAND)
TABLE 53 CANADA AEROSPACE MANUFACTURING IN VOLATILE ORGANIC COMPOUND (VOC) CONCENTRATOR MARKET, BY APPLICATION, 2018-2032 (USD THOUSAND)
TABLE 54 CANADA PHARMACEUTICAL MANUFACTURING IN VOLATILE ORGANIC COMPOUND (VOC) CONCENTRATOR MARKET, BY APPLICATION, 2018-2032 (USD THOUSAND)
TABLE 55 CANADA CHEMICAL PROCESSING IN VOLATILE ORGANIC COMPOUND (VOC) CONCENTRATOR MARKET, BY APPLICATION, 2018-2032 (USD THOUSAND)
TABLE 56 MEXICO VOLATILE ORGANIC COMPOUND (VOC) CONCENTRATOR MARKET, BY ABSORBENT, 2018-2032 (USD THOUSAND)
TABLE 57 MEXICO VOLATILE ORGANIC COMPOUND (VOC) CONCENTRATOR MARKET, BY ABSORBENT, 2018-2032 (THOUSAND UNITS)
TABLE 58 MEXICO VOLATILE ORGANIC COMPOUND (VOC) CONCENTRATOR MARKET, BY PROCESS TYPE, 2018-2032 (USD THOUSAND)
TABLE 59 MEXICO VOLATILE ORGANIC COMPOUND (VOC) CONCENTRATOR MARKET, BY APPLICATION, 2018-2032 (USD THOUSAND)
TABLE 60 MEXICO PAINT FURNISHING IN VOLATILE ORGANIC COMPOUND (VOC) CONCENTRATOR MARKET, BY APPLICATION, 2018-2032 (USD THOUSAND)
TABLE 61 MEXICO AEROSPACE MANUFACTURING IN VOLATILE ORGANIC COMPOUND (VOC) CONCENTRATOR MARKET, BY APPLICATION, 2018-2032 (USD THOUSAND)
TABLE 62 MEXICO PHARMACEUTICAL MANUFACTURING IN VOLATILE ORGANIC COMPOUND (VOC) CONCENTRATOR MARKET, BY APPLICATION, 2018-2032 (USD THOUSAND)
TABLE 63 MEXICO CHEMICAL PROCESSING IN VOLATILE ORGANIC COMPOUND (VOC) CONCENTRATOR MARKET, BY APPLICATION, 2018-2032 (USD THOUSAND)
TABLE 64 ASIA-PACIFIC VOLATILE ORGANIC COMPOUND (VOC) CONCENTRATOR MARKET, BY COUNTRY, 2018-2032 (USD THOUSAND)
TABLE 65 ASIA-PACIFIC VOLATILE ORGANIC COMPOUND (VOC) CONCENTRATOR MARKET, BY COUNTRY, 2018-2032 (THOUSAND UNITS)
TABLE 66 ASIA-PACIFIC VOLATILE ORGANIC COMPOUND (VOC) CONCENTRATOR MARKET, BY ABSORBENT, 2018-2032 (USD THOUSAND)
TABLE 67 ASIA-PACIFIC VOLATILE ORGANIC COMPOUND (VOC) CONCENTRATOR MARKET, BY ABSORBENT, 2018-2032 (THOUSAND UNITS)
TABLE 68 ASIA-PACIFIC VOLATILE ORGANIC COMPOUND (VOC) CONCENTRATOR MARKET, BY PROCESS TYPE, 2018-2032 (USD THOUSAND)
TABLE 69 ASIA-PACIFIC VOLATILE ORGANIC COMPOUND (VOC) CONCENTRATOR MARKET, BY APPLICATION, 2018-2032 (USD THOUSAND)
TABLE 70 ASIA-PACIFIC PAINT FURNISHING IN VOLATILE ORGANIC COMPOUND (VOC) CONCENTRATOR MARKET, BY APPLICATION, 2018-2032 (USD THOUSAND)
TABLE 71 ASIA-PACIFIC AEROSPACE MANUFACTURING IN VOLATILE ORGANIC COMPOUND (VOC) CONCENTRATOR MARKET, BY APPLICATION, 2018-2032 (USD THOUSAND)
TABLE 72 ASIA-PACIFIC PHARMACEUTICAL MANUFACTURING IN VOLATILE ORGANIC COMPOUND (VOC) CONCENTRATOR MARKET, BY APPLICATION, 2018-2032 (USD THOUSAND)
TABLE 73 ASIA-PACIFIC CHEMICAL PROCESSING IN VOLATILE ORGANIC COMPOUND (VOC) CONCENTRATOR MARKET, BY APPLICATION, 2018-2032 (USD THOUSAND)
TABLE 74 CHINA VOLATILE ORGANIC COMPOUND (VOC) CONCENTRATOR MARKET, BY ABSORBENT, 2018-2032 (USD THOUSAND)
TABLE 75 CHINA VOLATILE ORGANIC COMPOUND (VOC) CONCENTRATOR MARKET, BY ABSORBENT, 2018-2032 (THOUSAND UNITS)
TABLE 76 CHINA VOLATILE ORGANIC COMPOUND (VOC) CONCENTRATOR MARKET, BY PROCESS TYPE, 2018-2032 (USD THOUSAND)
TABLE 77 CHINA VOLATILE ORGANIC COMPOUND (VOC) CONCENTRATOR MARKET, BY APPLICATION, 2018-2032 (USD THOUSAND)
TABLE 78 CHINA PAINT FURNISHING IN VOLATILE ORGANIC COMPOUND (VOC) CONCENTRATOR MARKET, BY APPLICATION, 2018-2032 (USD THOUSAND)
TABLE 79 CHINA AEROSPACE MANUFACTURING IN VOLATILE ORGANIC COMPOUND (VOC) CONCENTRATOR MARKET, BY APPLICATION, 2018-2032 (USD THOUSAND)
TABLE 80 CHINA PHARMACEUTICAL MANUFACTURING IN VOLATILE ORGANIC COMPOUND (VOC) CONCENTRATOR MARKET, BY APPLICATION, 2018-2032 (USD THOUSAND)
TABLE 81 CHINA CHEMICAL PROCESSING IN VOLATILE ORGANIC COMPOUND (VOC) CONCENTRATOR MARKET, BY APPLICATION, 2018-2032 (USD THOUSAND)
TABLE 82 JAPAN VOLATILE ORGANIC COMPOUND (VOC) CONCENTRATOR MARKET, BY ABSORBENT, 2018-2032 (USD THOUSAND)
TABLE 83 JAPAN VOLATILE ORGANIC COMPOUND (VOC) CONCENTRATOR MARKET, BY ABSORBENT, 2018-2032 (THOUSAND UNITS)
TABLE 84 JAPAN VOLATILE ORGANIC COMPOUND (VOC) CONCENTRATOR MARKET, BY PROCESS TYPE, 2018-2032 (USD THOUSAND)
TABLE 85 JAPAN VOLATILE ORGANIC COMPOUND (VOC) CONCENTRATOR MARKET, BY APPLICATION, 2018-2032 (USD THOUSAND)
TABLE 86 JAPAN PAINT FURNISHING IN VOLATILE ORGANIC COMPOUND (VOC) CONCENTRATOR MARKET, BY APPLICATION, 2018-2032 (USD THOUSAND)
TABLE 87 JAPAN AEROSPACE MANUFACTURING IN VOLATILE ORGANIC COMPOUND (VOC) CONCENTRATOR MARKET, BY APPLICATION, 2018-2032 (USD THOUSAND)
TABLE 88 JAPAN PHARMACEUTICAL MANUFACTURING IN VOLATILE ORGANIC COMPOUND (VOC) CONCENTRATOR MARKET, BY APPLICATION, 2018-2032 (USD THOUSAND)
TABLE 89 JAPAN CHEMICAL PROCESSING IN VOLATILE ORGANIC COMPOUND (VOC) CONCENTRATOR MARKET, BY APPLICATION, 2018-2032 (USD THOUSAND)
TABLE 90 SOUTH KOREA VOLATILE ORGANIC COMPOUND (VOC) CONCENTRATOR MARKET, BY ABSORBENT, 2018-2032 (USD THOUSAND)
TABLE 91 SOUTH KOREA VOLATILE ORGANIC COMPOUND (VOC) CONCENTRATOR MARKET, BY ABSORBENT, 2018-2032 (THOUSAND UNITS)
TABLE 92 SOUTH KOREA VOLATILE ORGANIC COMPOUND (VOC) CONCENTRATOR MARKET, BY PROCESS TYPE, 2018-2032 (USD THOUSAND)
TABLE 93 SOUTH KOREA VOLATILE ORGANIC COMPOUND (VOC) CONCENTRATOR MARKET, BY APPLICATION, 2018-2032 (USD THOUSAND)
TABLE 94 SOUTH KOREA PAINT FURNISHING IN VOLATILE ORGANIC COMPOUND (VOC) CONCENTRATOR MARKET, BY APPLICATION, 2018-2032 (USD THOUSAND)
TABLE 95 SOUTH KOREA AEROSPACE MANUFACTURING IN VOLATILE ORGANIC COMPOUND (VOC) CONCENTRATOR MARKET, BY APPLICATION, 2018-2032 (USD THOUSAND)
TABLE 96 SOUTH KOREA PHARMACEUTICAL MANUFACTURING IN VOLATILE ORGANIC COMPOUND (VOC) CONCENTRATOR MARKET, BY APPLICATION, 2018-2032 (USD THOUSAND)
TABLE 97 SOUTH KOREA CHEMICAL PROCESSING IN VOLATILE ORGANIC COMPOUND (VOC) CONCENTRATOR MARKET, BY APPLICATION, 2018-2032 (USD THOUSAND)
TABLE 98 INDIA VOLATILE ORGANIC COMPOUND (VOC) CONCENTRATOR MARKET, BY ABSORBENT, 2018-2032 (USD THOUSAND)
TABLE 99 INDIA VOLATILE ORGANIC COMPOUND (VOC) CONCENTRATOR MARKET, BY ABSORBENT, 2018-2032 (THOUSAND UNITS)
TABLE 100 INDIA VOLATILE ORGANIC COMPOUND (VOC) CONCENTRATOR MARKET, BY PROCESS TYPE, 2018-2032 (USD THOUSAND)
TABLE 101 INDIA VOLATILE ORGANIC COMPOUND (VOC) CONCENTRATOR MARKET, BY APPLICATION, 2018-2032 (USD THOUSAND)
TABLE 102 INDIA PAINT FURNISHING IN VOLATILE ORGANIC COMPOUND (VOC) CONCENTRATOR MARKET, BY APPLICATION, 2018-2032 (USD THOUSAND)
TABLE 103 INDIA AEROSPACE MANUFACTURING IN VOLATILE ORGANIC COMPOUND (VOC) CONCENTRATOR MARKET, BY APPLICATION, 2018-2032 (USD THOUSAND)
TABLE 104 INDIA PHARMACEUTICAL MANUFACTURING IN VOLATILE ORGANIC COMPOUND (VOC) CONCENTRATOR MARKET, BY APPLICATION, 2018-2032 (USD THOUSAND)
TABLE 105 INDIA CHEMICAL PROCESSING IN VOLATILE ORGANIC COMPOUND (VOC) CONCENTRATOR MARKET, BY APPLICATION, 2018-2032 (USD THOUSAND)
TABLE 106 SINGAPORE VOLATILE ORGANIC COMPOUND (VOC) CONCENTRATOR MARKET, BY ABSORBENT, 2018-2032 (USD THOUSAND)
TABLE 107 SINGAPORE VOLATILE ORGANIC COMPOUND (VOC) CONCENTRATOR MARKET, BY ABSORBENT, 2018-2032 (THOUSAND UNITS)
TABLE 108 SINGAPORE VOLATILE ORGANIC COMPOUND (VOC) CONCENTRATOR MARKET, BY PROCESS TYPE, 2018-2032 (USD THOUSAND)
TABLE 109 SINGAPORE VOLATILE ORGANIC COMPOUND (VOC) CONCENTRATOR MARKET, BY APPLICATION, 2018-2032 (USD THOUSAND)
TABLE 110 SINGAPORE PAINT FURNISHING IN VOLATILE ORGANIC COMPOUND (VOC) CONCENTRATOR MARKET, BY APPLICATION, 2018-2032 (USD THOUSAND)
TABLE 111 SINGAPORE AEROSPACE MANUFACTURING IN VOLATILE ORGANIC COMPOUND (VOC) CONCENTRATOR MARKET, BY APPLICATION, 2018-2032 (USD THOUSAND)
TABLE 112 SINGAPORE PHARMACEUTICAL MANUFACTURING IN VOLATILE ORGANIC COMPOUND (VOC) CONCENTRATOR MARKET, BY APPLICATION, 2018-2032 (USD THOUSAND)
TABLE 113 SINGAPORE CHEMICAL PROCESSING IN VOLATILE ORGANIC COMPOUND (VOC) CONCENTRATOR MARKET, BY APPLICATION, 2018-2032 (USD THOUSAND)
TABLE 114 THAILAND VOLATILE ORGANIC COMPOUND (VOC) CONCENTRATOR MARKET, BY ABSORBENT, 2018-2032 (USD THOUSAND)
TABLE 115 THAILAND VOLATILE ORGANIC COMPOUND (VOC) CONCENTRATOR MARKET, BY ABSORBENT, 2018-2032 (THOUSAND UNITS)
TABLE 116 THAILAND VOLATILE ORGANIC COMPOUND (VOC) CONCENTRATOR MARKET, BY PROCESS TYPE, 2018-2032 (USD THOUSAND)
TABLE 117 THAILAND VOLATILE ORGANIC COMPOUND (VOC) CONCENTRATOR MARKET, BY APPLICATION, 2018-2032 (USD THOUSAND)
TABLE 118 THAILAND PAINT FURNISHING IN VOLATILE ORGANIC COMPOUND (VOC) CONCENTRATOR MARKET, BY APPLICATION, 2018-2032 (USD THOUSAND)
TABLE 119 THAILAND AEROSPACE MANUFACTURING IN VOLATILE ORGANIC COMPOUND (VOC) CONCENTRATOR MARKET, BY APPLICATION, 2018-2032 (USD THOUSAND)
TABLE 120 THAILAND PHARMACEUTICAL MANUFACTURING IN VOLATILE ORGANIC COMPOUND (VOC) CONCENTRATOR MARKET, BY APPLICATION, 2018-2032 (USD THOUSAND)
TABLE 121 THAILAND CHEMICAL PROCESSING IN VOLATILE ORGANIC COMPOUND (VOC) CONCENTRATOR MARKET, BY APPLICATION, 2018-2032 (USD THOUSAND)
TABLE 122 AUSTRALIA & NEW ZEALAND VOLATILE ORGANIC COMPOUND (VOC) CONCENTRATOR MARKET, BY ABSORBENT, 2018-2032 (USD THOUSAND)
TABLE 123 AUSTRALIA & NEW ZEALAND VOLATILE ORGANIC COMPOUND (VOC) CONCENTRATOR MARKET, BY ABSORBENT, 2018-2032 (THOUSAND UNITS)
TABLE 124 AUSTRALIA & NEW ZEALAND VOLATILE ORGANIC COMPOUND (VOC) CONCENTRATOR MARKET, BY PROCESS TYPE, 2018-2032 (USD THOUSAND)
TABLE 125 AUSTRALIA & NEW ZEALAND VOLATILE ORGANIC COMPOUND (VOC) CONCENTRATOR MARKET, BY APPLICATION, 2018-2032 (USD THOUSAND)
TABLE 126 AUSTRALIA & NEW ZEALAND PAINT FURNISHING IN VOLATILE ORGANIC COMPOUND (VOC) CONCENTRATOR MARKET, BY APPLICATION, 2018-2032 (USD THOUSAND)
TABLE 127 AUSTRALIA & NEW ZEALAND AEROSPACE MANUFACTURING IN VOLATILE ORGANIC COMPOUND (VOC) CONCENTRATOR MARKET, BY APPLICATION, 2018-2032 (USD THOUSAND)
TABLE 128 AUSTRALIA & NEW ZEALAND PHARMACEUTICAL MANUFACTURING IN VOLATILE ORGANIC COMPOUND (VOC) CONCENTRATOR MARKET, BY APPLICATION, 2018-2032 (USD THOUSAND)
TABLE 129 AUSTRALIA & NEW ZEALAND CHEMICAL PROCESSING IN VOLATILE ORGANIC COMPOUND (VOC) CONCENTRATOR MARKET, BY APPLICATION, 2018-2032 (USD THOUSAND)
TABLE 130 INDONESIA VOLATILE ORGANIC COMPOUND (VOC) CONCENTRATOR MARKET, BY ABSORBENT, 2018-2032 (USD THOUSAND)
TABLE 131 INDONESIA VOLATILE ORGANIC COMPOUND (VOC) CONCENTRATOR MARKET, BY ABSORBENT, 2018-2032 (THOUSAND UNITS)
TABLE 132 INDONESIA VOLATILE ORGANIC COMPOUND (VOC) CONCENTRATOR MARKET, BY PROCESS TYPE, 2018-2032 (USD THOUSAND)
TABLE 133 INDONESIA VOLATILE ORGANIC COMPOUND (VOC) CONCENTRATOR MARKET, BY APPLICATION, 2018-2032 (USD THOUSAND)
TABLE 134 INDONESIA PAINT FURNISHING IN VOLATILE ORGANIC COMPOUND (VOC) CONCENTRATOR MARKET, BY APPLICATION, 2018-2032 (USD THOUSAND)
TABLE 135 INDONESIA AEROSPACE MANUFACTURING IN VOLATILE ORGANIC COMPOUND (VOC) CONCENTRATOR MARKET, BY APPLICATION, 2018-2032 (USD THOUSAND)
TABLE 136 INDONESIA PHARMACEUTICAL MANUFACTURING IN VOLATILE ORGANIC COMPOUND (VOC) CONCENTRATOR MARKET, BY APPLICATION, 2018-2032 (USD THOUSAND)
TABLE 137 INDONESIA CHEMICAL PROCESSING IN VOLATILE ORGANIC COMPOUND (VOC) CONCENTRATOR MARKET, BY APPLICATION, 2018-2032 (USD THOUSAND)
TABLE 138 MALAYSIA VOLATILE ORGANIC COMPOUND (VOC) CONCENTRATOR MARKET, BY ABSORBENT, 2018-2032 (USD THOUSAND)
TABLE 139 MALAYSIA VOLATILE ORGANIC COMPOUND (VOC) CONCENTRATOR MARKET, BY ABSORBENT, 2018-2032 (THOUSAND UNITS)
TABLE 140 MALAYSIA VOLATILE ORGANIC COMPOUND (VOC) CONCENTRATOR MARKET, BY PROCESS TYPE, 2018-2032 (USD THOUSAND)
TABLE 141 MALAYSIA VOLATILE ORGANIC COMPOUND (VOC) CONCENTRATOR MARKET, BY APPLICATION, 2018-2032 (USD THOUSAND)
TABLE 142 MALAYSIA PAINT FURNISHING IN VOLATILE ORGANIC COMPOUND (VOC) CONCENTRATOR MARKET, BY APPLICATION, 2018-2032 (USD THOUSAND)
TABLE 143 MALAYSIA AEROSPACE MANUFACTURING IN VOLATILE ORGANIC COMPOUND (VOC) CONCENTRATOR MARKET, BY APPLICATION, 2018-2032 (USD THOUSAND)
TABLE 144 MALAYSIA PHARMACEUTICAL MANUFACTURING IN VOLATILE ORGANIC COMPOUND (VOC) CONCENTRATOR MARKET, BY APPLICATION, 2018-2032 (USD THOUSAND)
TABLE 145 MALAYSIA CHEMICAL PROCESSING IN VOLATILE ORGANIC COMPOUND (VOC) CONCENTRATOR MARKET, BY APPLICATION, 2018-2032 (USD THOUSAND)
TABLE 146 PHILIPPINES VOLATILE ORGANIC COMPOUND (VOC) CONCENTRATOR MARKET, BY ABSORBENT, 2018-2032 (USD THOUSAND)
TABLE 147 PHILIPPINES VOLATILE ORGANIC COMPOUND (VOC) CONCENTRATOR MARKET, BY ABSORBENT, 2018-2032 (THOUSAND UNITS)
TABLE 148 PHILIPPINES VOLATILE ORGANIC COMPOUND (VOC) CONCENTRATOR MARKET, BY PROCESS TYPE, 2018-2032 (USD THOUSAND)
TABLE 149 PHILIPPINES VOLATILE ORGANIC COMPOUND (VOC) CONCENTRATOR MARKET, BY APPLICATION, 2018-2032 (USD THOUSAND)
TABLE 150 PHILIPPINES PAINT FURNISHING IN VOLATILE ORGANIC COMPOUND (VOC) CONCENTRATOR MARKET, BY APPLICATION, 2018-2032 (USD THOUSAND)
TABLE 151 PHILIPPINES AEROSPACE MANUFACTURING IN VOLATILE ORGANIC COMPOUND (VOC) CONCENTRATOR MARKET, BY APPLICATION, 2018-2032 (USD THOUSAND)
TABLE 152 PHILIPPINES PHARMACEUTICAL MANUFACTURING IN VOLATILE ORGANIC COMPOUND (VOC) CONCENTRATOR MARKET, BY APPLICATION, 2018-2032 (USD THOUSAND)
TABLE 153 PHILIPPINES CHEMICAL PROCESSING IN VOLATILE ORGANIC COMPOUND (VOC) CONCENTRATOR MARKET, BY APPLICATION, 2018-2032 (USD THOUSAND)
TABLE 154 REST OF ASIA-PACIFIC VOLATILE ORGANIC COMPOUND (VOC) CONCENTRATOR MARKET, BY ABSORBENT, 2018-2032 (USD THOUSAND)
TABLE 155 REST OF ASIA-PACIFIC VOLATILE ORGANIC COMPOUND (VOC) CONCENTRATOR MARKET, BY ABSORBENT, 2018-2032 (THOUSAND UNITS)
TABLE 156 EUROPE VOLATILE ORGANIC COMPOUND (VOC) CONCENTRATOR MARKET, BY COUNTRY, 2018-2032 (USD THOUSAND)
TABLE 157 EUROPE VOLATILE ORGANIC COMPOUND (VOC) CONCENTRATOR MARKET, BY COUNTRY, 2018-2032 (THOUSAND UNITS)
TABLE 158 EUROPE VOLATILE ORGANIC COMPOUND (VOC) CONCENTRATOR MARKET, BY ABSORBENT, 2018-2032 (USD THOUSAND)
TABLE 159 EUROPE VOLATILE ORGANIC COMPOUND (VOC) CONCENTRATOR MARKET, BY ABSORBENT, 2018-2032 (THOUSAND UNITS)
TABLE 160 EUROPE VOLATILE ORGANIC COMPOUND (VOC) CONCENTRATOR MARKET, BY PROCESS TYPE, 2018-2032 (USD THOUSAND)
TABLE 161 EUROPE VOLATILE ORGANIC COMPOUND (VOC) CONCENTRATOR MARKET, BY APPLICATION, 2018-2032 (USD THOUSAND)
TABLE 162 EUROPE PAINT FURNISHING IN VOLATILE ORGANIC COMPOUND (VOC) CONCENTRATOR MARKET, BY APPLICATION, 2018-2032 (USD THOUSAND)
TABLE 163 EUROPE AEROSPACE MANUFACTURING IN VOLATILE ORGANIC COMPOUND (VOC) CONCENTRATOR MARKET, BY APPLICATION, 2018-2032 (USD THOUSAND)
TABLE 164 EUROPE PHARMACEUTICAL MANUFACTURING IN VOLATILE ORGANIC COMPOUND (VOC) CONCENTRATOR MARKET, BY APPLICATION, 2018-2032 (USD THOUSAND)
TABLE 165 EUROPE CHEMICAL PROCESSING IN VOLATILE ORGANIC COMPOUND (VOC) CONCENTRATOR MARKET, BY APPLICATION, 2018-2032 (USD THOUSAND)
TABLE 166 GERMANY VOLATILE ORGANIC COMPOUND (VOC) CONCENTRATOR MARKET, BY ABSORBENT, 2018-2032 (USD THOUSAND)
TABLE 167 GERMANY VOLATILE ORGANIC COMPOUND (VOC) CONCENTRATOR MARKET, BY ABSORBENT, 2018-2032 (THOUSAND UNITS)
TABLE 168 GERMANY VOLATILE ORGANIC COMPOUND (VOC) CONCENTRATOR MARKET, BY PROCESS TYPE, 2018-2032 (USD THOUSAND)
TABLE 169 GERMANY VOLATILE ORGANIC COMPOUND (VOC) CONCENTRATOR MARKET, BY APPLICATION, 2018-2032 (USD THOUSAND)
TABLE 170 GERMANY PAINT FURNISHING IN VOLATILE ORGANIC COMPOUND (VOC) CONCENTRATOR MARKET, BY APPLICATION, 2018-2032 (USD THOUSAND)
TABLE 171 GERMANY AEROSPACE MANUFACTURING IN VOLATILE ORGANIC COMPOUND (VOC) CONCENTRATOR MARKET, BY APPLICATION, 2018-2032 (USD THOUSAND)
TABLE 172 GERMANY PHARMACEUTICAL MANUFACTURING IN VOLATILE ORGANIC COMPOUND (VOC) CONCENTRATOR MARKET, BY APPLICATION, 2018-2032 (USD THOUSAND)
TABLE 173 GERMANY CHEMICAL PROCESSING IN VOLATILE ORGANIC COMPOUND (VOC) CONCENTRATOR MARKET, BY APPLICATION, 2018-2032 (USD THOUSAND)
TABLE 174 U.K. VOLATILE ORGANIC COMPOUND (VOC) CONCENTRATOR MARKET, BY ABSORBENT, 2018-2032 (USD THOUSAND)
TABLE 175 U.K. VOLATILE ORGANIC COMPOUND (VOC) CONCENTRATOR MARKET, BY ABSORBENT, 2018-2032 (THOUSAND UNITS)
TABLE 176 U.K. VOLATILE ORGANIC COMPOUND (VOC) CONCENTRATOR MARKET, BY PROCESS TYPE, 2018-2032 (USD THOUSAND)
TABLE 177 U.K. VOLATILE ORGANIC COMPOUND (VOC) CONCENTRATOR MARKET, BY APPLICATION, 2018-2032 (USD THOUSAND)
TABLE 178 U.K. PAINT FURNISHING IN VOLATILE ORGANIC COMPOUND (VOC) CONCENTRATOR MARKET, BY APPLICATION, 2018-2032 (USD THOUSAND)
TABLE 179 U.K. AEROSPACE MANUFACTURING IN VOLATILE ORGANIC COMPOUND (VOC) CONCENTRATOR MARKET, BY APPLICATION, 2018-2032 (USD THOUSAND)
TABLE 180 U.K. PHARMACEUTICAL MANUFACTURING IN VOLATILE ORGANIC COMPOUND (VOC) CONCENTRATOR MARKET, BY APPLICATION, 2018-2032 (USD THOUSAND)
TABLE 181 U.K. CHEMICAL PROCESSING IN VOLATILE ORGANIC COMPOUND (VOC) CONCENTRATOR MARKET, BY APPLICATION, 2018-2032 (USD THOUSAND)
TABLE 182 ITALY VOLATILE ORGANIC COMPOUND (VOC) CONCENTRATOR MARKET, BY ABSORBENT, 2018-2032 (USD THOUSAND)
TABLE 183 ITALY VOLATILE ORGANIC COMPOUND (VOC) CONCENTRATOR MARKET, BY ABSORBENT, 2018-2032 (THOUSAND UNITS)
TABLE 184 ITALY VOLATILE ORGANIC COMPOUND (VOC) CONCENTRATOR MARKET, BY PROCESS TYPE, 2018-2032 (USD THOUSAND)
TABLE 185 ITALY VOLATILE ORGANIC COMPOUND (VOC) CONCENTRATOR MARKET, BY APPLICATION, 2018-2032 (USD THOUSAND)
TABLE 186 ITALY PAINT FURNISHING IN VOLATILE ORGANIC COMPOUND (VOC) CONCENTRATOR MARKET, BY APPLICATION, 2018-2032 (USD THOUSAND)
TABLE 187 ITALY AEROSPACE MANUFACTURING IN VOLATILE ORGANIC COMPOUND (VOC) CONCENTRATOR MARKET, BY APPLICATION, 2018-2032 (USD THOUSAND)
TABLE 188 ITALY PHARMACEUTICAL MANUFACTURING IN VOLATILE ORGANIC COMPOUND (VOC) CONCENTRATOR MARKET, BY APPLICATION, 2018-2032 (USD THOUSAND)
TABLE 189 ITALY CHEMICAL PROCESSING IN VOLATILE ORGANIC COMPOUND (VOC) CONCENTRATOR MARKET, BY APPLICATION, 2018-2032 (USD THOUSAND)
TABLE 190 FRANCE VOLATILE ORGANIC COMPOUND (VOC) CONCENTRATOR MARKET, BY ABSORBENT, 2018-2032 (USD THOUSAND)
TABLE 191 FRANCE VOLATILE ORGANIC COMPOUND (VOC) CONCENTRATOR MARKET, BY ABSORBENT, 2018-2032 (THOUSAND UNITS)
TABLE 192 FRANCE VOLATILE ORGANIC COMPOUND (VOC) CONCENTRATOR MARKET, BY PROCESS TYPE, 2018-2032 (USD THOUSAND)
TABLE 193 FRANCE VOLATILE ORGANIC COMPOUND (VOC) CONCENTRATOR MARKET, BY APPLICATION, 2018-2032 (USD THOUSAND)
TABLE 194 FRANCE PAINT FURNISHING IN VOLATILE ORGANIC COMPOUND (VOC) CONCENTRATOR MARKET, BY APPLICATION, 2018-2032 (USD THOUSAND)
TABLE 195 FRANCE AEROSPACE MANUFACTURING IN VOLATILE ORGANIC COMPOUND (VOC) CONCENTRATOR MARKET, BY APPLICATION, 2018-2032 (USD THOUSAND)
TABLE 196 FRANCE PHARMACEUTICAL MANUFACTURING IN VOLATILE ORGANIC COMPOUND (VOC) CONCENTRATOR MARKET, BY APPLICATION, 2018-2032 (USD THOUSAND)
TABLE 197 FRANCE CHEMICAL PROCESSING IN VOLATILE ORGANIC COMPOUND (VOC) CONCENTRATOR MARKET, BY APPLICATION, 2018-2032 (USD THOUSAND)
TABLE 198 SPAIN VOLATILE ORGANIC COMPOUND (VOC) CONCENTRATOR MARKET, BY ABSORBENT, 2018-2032 (USD THOUSAND)
TABLE 199 SPAIN VOLATILE ORGANIC COMPOUND (VOC) CONCENTRATOR MARKET, BY ABSORBENT, 2018-2032 (THOUSAND UNITS)
TABLE 200 SPAIN VOLATILE ORGANIC COMPOUND (VOC) CONCENTRATOR MARKET, BY PROCESS TYPE, 2018-2032 (USD THOUSAND)
TABLE 201 SPAIN VOLATILE ORGANIC COMPOUND (VOC) CONCENTRATOR MARKET, BY APPLICATION, 2018-2032 (USD THOUSAND)
TABLE 202 SPAIN PAINT FURNISHING IN VOLATILE ORGANIC COMPOUND (VOC) CONCENTRATOR MARKET, BY APPLICATION, 2018-2032 (USD THOUSAND)
TABLE 203 SPAIN AEROSPACE MANUFACTURING IN VOLATILE ORGANIC COMPOUND (VOC) CONCENTRATOR MARKET, BY APPLICATION, 2018-2032 (USD THOUSAND)
TABLE 204 SPAIN PHARMACEUTICAL MANUFACTURING IN VOLATILE ORGANIC COMPOUND (VOC) CONCENTRATOR MARKET, BY APPLICATION, 2018-2032 (USD THOUSAND)
TABLE 205 SPAIN CHEMICAL PROCESSING IN VOLATILE ORGANIC COMPOUND (VOC) CONCENTRATOR MARKET, BY APPLICATION, 2018-2032 (USD THOUSAND)
TABLE 206 RUSSIA VOLATILE ORGANIC COMPOUND (VOC) CONCENTRATOR MARKET, BY ABSORBENT, 2018-2032 (USD THOUSAND)
TABLE 207 RUSSIA VOLATILE ORGANIC COMPOUND (VOC) CONCENTRATOR MARKET, BY ABSORBENT, 2018-2032 (THOUSAND UNITS)
TABLE 208 RUSSIA VOLATILE ORGANIC COMPOUND (VOC) CONCENTRATOR MARKET, BY PROCESS TYPE, 2018-2032 (USD THOUSAND)
TABLE 209 RUSSIA VOLATILE ORGANIC COMPOUND (VOC) CONCENTRATOR MARKET, BY APPLICATION, 2018-2032 (USD THOUSAND)
TABLE 210 RUSSIA PAINT FURNISHING IN VOLATILE ORGANIC COMPOUND (VOC) CONCENTRATOR MARKET, BY APPLICATION, 2018-2032 (USD THOUSAND)
TABLE 211 RUSSIA AEROSPACE MANUFACTURING IN VOLATILE ORGANIC COMPOUND (VOC) CONCENTRATOR MARKET, BY APPLICATION, 2018-2032 (USD THOUSAND)
TABLE 212 RUSSIA PHARMACEUTICAL MANUFACTURING IN VOLATILE ORGANIC COMPOUND (VOC) CONCENTRATOR MARKET, BY APPLICATION, 2018-2032 (USD THOUSAND)
TABLE 213 RUSSIA CHEMICAL PROCESSING IN VOLATILE ORGANIC COMPOUND (VOC) CONCENTRATOR MARKET, BY APPLICATION, 2018-2032 (USD THOUSAND)
TABLE 214 SWITZERLAND VOLATILE ORGANIC COMPOUND (VOC) CONCENTRATOR MARKET, BY ABSORBENT, 2018-2032 (USD THOUSAND)
TABLE 215 SWITZERLAND VOLATILE ORGANIC COMPOUND (VOC) CONCENTRATOR MARKET, BY ABSORBENT, 2018-2032 (THOUSAND UNITS)
TABLE 216 SWITZERLAND VOLATILE ORGANIC COMPOUND (VOC) CONCENTRATOR MARKET, BY PROCESS TYPE, 2018-2032 (USD THOUSAND)
TABLE 217 SWITZERLAND VOLATILE ORGANIC COMPOUND (VOC) CONCENTRATOR MARKET, BY APPLICATION, 2018-2032 (USD THOUSAND)
TABLE 218 SWITZERLAND PAINT FURNISHING IN VOLATILE ORGANIC COMPOUND (VOC) CONCENTRATOR MARKET, BY APPLICATION, 2018-2032 (USD THOUSAND)
TABLE 219 SWITZERLAND AEROSPACE MANUFACTURING IN VOLATILE ORGANIC COMPOUND (VOC) CONCENTRATOR MARKET, BY APPLICATION, 2018-2032 (USD THOUSAND)
TABLE 220 SWITZERLAND PHARMACEUTICAL MANUFACTURING IN VOLATILE ORGANIC COMPOUND (VOC) CONCENTRATOR MARKET, BY APPLICATION, 2018-2032 (USD THOUSAND)
TABLE 221 SWITZERLAND CHEMICAL PROCESSING IN VOLATILE ORGANIC COMPOUND (VOC) CONCENTRATOR MARKET, BY APPLICATION, 2018-2032 (USD THOUSAND)
TABLE 222 TURKEY VOLATILE ORGANIC COMPOUND (VOC) CONCENTRATOR MARKET, BY ABSORBENT, 2018-2032 (USD THOUSAND)
TABLE 223 TURKEY VOLATILE ORGANIC COMPOUND (VOC) CONCENTRATOR MARKET, BY ABSORBENT, 2018-2032 (THOUSAND UNITS)
TABLE 224 TURKEY VOLATILE ORGANIC COMPOUND (VOC) CONCENTRATOR MARKET, BY PROCESS TYPE, 2018-2032 (USD THOUSAND)
TABLE 225 TURKEY VOLATILE ORGANIC COMPOUND (VOC) CONCENTRATOR MARKET, BY APPLICATION, 2018-2032 (USD THOUSAND)
TABLE 226 TURKEY PAINT FURNISHING IN VOLATILE ORGANIC COMPOUND (VOC) CONCENTRATOR MARKET, BY APPLICATION, 2018-2032 (USD THOUSAND)
TABLE 227 TURKEY AEROSPACE MANUFACTURING IN VOLATILE ORGANIC COMPOUND (VOC) CONCENTRATOR MARKET, BY APPLICATION, 2018-2032 (USD THOUSAND)
TABLE 228 URKEY PHARMACEUTICAL MANUFACTURING IN VOLATILE ORGANIC COMPOUND (VOC) CONCENTRATOR MARKET, BY APPLICATION, 2018-2032 (USD THOUSAND)
TABLE 229 TURKEY CHEMICAL PROCESSING IN VOLATILE ORGANIC COMPOUND (VOC) CONCENTRATOR MARKET, BY APPLICATION, 2018-2032 (USD THOUSAND)
TABLE 230 BELGIUM VOLATILE ORGANIC COMPOUND (VOC) CONCENTRATOR MARKET, BY ABSORBENT, 2018-2032 (USD THOUSAND)
TABLE 231 BELGIUM VOLATILE ORGANIC COMPOUND (VOC) CONCENTRATOR MARKET, BY ABSORBENT, 2018-2032 (THOUSAND UNITS)
TABLE 232 BELGIUM VOLATILE ORGANIC COMPOUND (VOC) CONCENTRATOR MARKET, BY PROCESS TYPE, 2018-2032 (USD THOUSAND)
TABLE 233 BELGIUM VOLATILE ORGANIC COMPOUND (VOC) CONCENTRATOR MARKET, BY APPLICATION, 2018-2032 (USD THOUSAND)
TABLE 234 BELGIUM PAINT FURNISHING IN VOLATILE ORGANIC COMPOUND (VOC) CONCENTRATOR MARKET, BY APPLICATION, 2018-2032 (USD THOUSAND)
TABLE 235 BELGIUM AEROSPACE MANUFACTURING IN VOLATILE ORGANIC COMPOUND (VOC) CONCENTRATOR MARKET, BY APPLICATION, 2018-2032 (USD THOUSAND)
TABLE 236 BELGIUM PHARMACEUTICAL MANUFACTURING IN VOLATILE ORGANIC COMPOUND (VOC) CONCENTRATOR MARKET, BY APPLICATION, 2018-2032 (USD THOUSAND)
TABLE 237 BELGIUM CHEMICAL PROCESSING IN VOLATILE ORGANIC COMPOUND (VOC) CONCENTRATOR MARKET, BY APPLICATION, 2018-2032 (USD THOUSAND)
TABLE 238 NETHERLANDS VOLATILE ORGANIC COMPOUND (VOC) CONCENTRATOR MARKET, BY ABSORBENT, 2018-2032 (USD THOUSAND)
TABLE 239 NETHERLANDS VOLATILE ORGANIC COMPOUND (VOC) CONCENTRATOR MARKET, BY ABSORBENT, 2018-2032 (THOUSAND UNITS)
TABLE 240 NETHERLANDS VOLATILE ORGANIC COMPOUND (VOC) CONCENTRATOR MARKET, BY PROCESS TYPE, 2018-2032 (USD THOUSAND)
TABLE 241 NETHERLANDS VOLATILE ORGANIC COMPOUND (VOC) CONCENTRATOR MARKET, BY APPLICATION, 2018-2032 (USD THOUSAND)
TABLE 242 NETHERLANDS PAINT FURNISHING IN VOLATILE ORGANIC COMPOUND (VOC) CONCENTRATOR MARKET, BY APPLICATION, 2018-2032 (USD THOUSAND)
TABLE 243 NETHERLANDS AEROSPACE MANUFACTURING IN VOLATILE ORGANIC COMPOUND (VOC) CONCENTRATOR MARKET, BY APPLICATION, 2018-2032 (USD THOUSAND)
TABLE 244 NETHERLANDS PHARMACEUTICAL MANUFACTURING IN VOLATILE ORGANIC COMPOUND (VOC) CONCENTRATOR MARKET, BY APPLICATION, 2018-2032 (USD THOUSAND)
TABLE 245 NETHERLANDS CHEMICAL PROCESSING IN VOLATILE ORGANIC COMPOUND (VOC) CONCENTRATOR MARKET, BY APPLICATION, 2018-2032 (USD THOUSAND)
TABLE 246 LUXEMBURG VOLATILE ORGANIC COMPOUND (VOC) CONCENTRATOR MARKET, BY ABSORBENT, 2018-2032 (USD THOUSAND)
TABLE 247 LUXEMBURG VOLATILE ORGANIC COMPOUND (VOC) CONCENTRATOR MARKET, BY ABSORBENT, 2018-2032 (THOUSAND UNITS)
TABLE 248 LUXEMBURG VOLATILE ORGANIC COMPOUND (VOC) CONCENTRATOR MARKET, BY PROCESS TYPE, 2018-2032 (USD THOUSAND)
TABLE 249 LUXEMBURG VOLATILE ORGANIC COMPOUND (VOC) CONCENTRATOR MARKET, BY APPLICATION, 2018-2032 (USD THOUSAND)
TABLE 250 LUXEMBURG PAINT FURNISHING IN VOLATILE ORGANIC COMPOUND (VOC) CONCENTRATOR MARKET, BY APPLICATION, 2018-2032 (USD THOUSAND)
TABLE 251 LUXEMBURG AEROSPACE MANUFACTURING IN VOLATILE ORGANIC COMPOUND (VOC) CONCENTRATOR MARKET, BY APPLICATION, 2018-2032 (USD THOUSAND)
TABLE 252 LUXEMBURG PHARMACEUTICAL MANUFACTURING IN VOLATILE ORGANIC COMPOUND (VOC) CONCENTRATOR MARKET, BY APPLICATION, 2018-2032 (USD THOUSAND)
TABLE 253 LUXEMBURG CHEMICAL PROCESSING IN VOLATILE ORGANIC COMPOUND (VOC) CONCENTRATOR MARKET, BY APPLICATION, 2018-2032 (USD THOUSAND)
TABLE 254 REST OF EUROPE VOLATILE ORGANIC COMPOUND (VOC) CONCENTRATOR MARKET, BY ABSORBENT, 2018-2032 (USD THOUSAND)
TABLE 255 REST OF EUROPE VOLATILE ORGANIC COMPOUND (VOC) CONCENTRATOR MARKET, BY ABSORBENT, 2018-2032 (THOUSAND UNITS)
TABLE 256 MIDDLE EAST AND AFRICA VOLATILE ORGANIC COMPOUND (VOC) CONCENTRATOR MARKET, BY COUNTRY, 2018-2032 (USD THOUSAND)
TABLE 257 MIDDLE EAST AND AFRICA VOLATILE ORGANIC COMPOUND (VOC) CONCENTRATOR MARKET, BY COUNTRY, 2018-2032 (THOUSAND UNITS)
TABLE 258 MIDDLE EAST AND AFRICA VOLATILE ORGANIC COMPOUND (VOC) CONCENTRATOR MARKET, BY ABSORBENT, 2018-2032 (USD THOUSAND)
TABLE 259 MIDDLE EAST AND AFRICA VOLATILE ORGANIC COMPOUND (VOC) CONCENTRATOR MARKET, BY ABSORBENT, 2018-2032 (THOUSAND UNITS)
TABLE 260 MIDDLE EAST AND AFRICA VOLATILE ORGANIC COMPOUND (VOC) CONCENTRATOR MARKET, BY PROCESS TYPE, 2018-2032 (USD THOUSAND)
TABLE 261 MIDDLE EAST AND AFRICA VOLATILE ORGANIC COMPOUND (VOC) CONCENTRATOR MARKET, BY APPLICATION, 2018-2032 (USD THOUSAND)
TABLE 262 MIDDLE EAST AND AFRICA PAINT FURNISHING IN VOLATILE ORGANIC COMPOUND (VOC) CONCENTRATOR MARKET, BY APPLICATION, 2018-2032 (USD THOUSAND)
TABLE 263 MIDDLE EAST AND AFRICA AEROSPACE MANUFACTURING IN VOLATILE ORGANIC COMPOUND (VOC) CONCENTRATOR MARKET, BY APPLICATION, 2018-2032 (USD THOUSAND)
TABLE 264 MIDDLE EAST AND AFRICA PHARMACEUTICAL MANUFACTURING IN VOLATILE ORGANIC COMPOUND (VOC) CONCENTRATOR MARKET, BY APPLICATION, 2018-2032 (USD THOUSAND)
TABLE 265 MIDDLE EAST AND AFRICA CHEMICAL PROCESSING IN VOLATILE ORGANIC COMPOUND (VOC) CONCENTRATOR MARKET, BY APPLICATION, 2018-2032 (USD THOUSAND)
TABLE 266 SAUDI ARABIA VOLATILE ORGANIC COMPOUND (VOC) CONCENTRATOR MARKET, BY ABSORBENT, 2018-2032 (USD THOUSAND)
TABLE 267 SAUDI ARABIA VOLATILE ORGANIC COMPOUND (VOC) CONCENTRATOR MARKET, BY ABSORBENT, 2018-2032 (THOUSAND UNITS)
TABLE 268 SAUDI ARABIA VOLATILE ORGANIC COMPOUND (VOC) CONCENTRATOR MARKET, BY PROCESS TYPE, 2018-2032 (USD THOUSAND)
TABLE 269 SAUDI ARABIA VOLATILE ORGANIC COMPOUND (VOC) CONCENTRATOR MARKET, BY APPLICATION, 2018-2032 (USD THOUSAND)
TABLE 270 SAUDI ARABIA PAINT FURNISHING IN VOLATILE ORGANIC COMPOUND (VOC) CONCENTRATOR MARKET, BY APPLICATION, 2018-2032 (USD THOUSAND)
TABLE 271 SAUDI ARABIA AEROSPACE MANUFACTURING IN VOLATILE ORGANIC COMPOUND (VOC) CONCENTRATOR MARKET, BY APPLICATION, 2018-2032 (USD THOUSAND)
TABLE 272 SAUDI ARABIA PHARMACEUTICAL MANUFACTURING IN VOLATILE ORGANIC COMPOUND (VOC) CONCENTRATOR MARKET, BY APPLICATION, 2018-2032 (USD THOUSAND)
TABLE 273 SAUDI ARABIA CHEMICAL PROCESSING IN VOLATILE ORGANIC COMPOUND (VOC) CONCENTRATOR MARKET, BY APPLICATION, 2018-2032 (USD THOUSAND)
TABLE 274 UNITED ARAB EMIRATES VOLATILE ORGANIC COMPOUND (VOC) CONCENTRATOR MARKET, BY ABSORBENT, 2018-2032 (USD THOUSAND)
TABLE 275 UNITED ARAB EMIRATES VOLATILE ORGANIC COMPOUND (VOC) CONCENTRATOR MARKET, BY ABSORBENT, 2018-2032 (THOUSAND UNITS)
TABLE 276 UNITED ARAB EMIRATES VOLATILE ORGANIC COMPOUND (VOC) CONCENTRATOR MARKET, BY PROCESS TYPE, 2018-2032 (USD THOUSAND)
TABLE 277 UNITED ARAB EMIRATES VOLATILE ORGANIC COMPOUND (VOC) CONCENTRATOR MARKET, BY APPLICATION, 2018-2032 (USD THOUSAND)
TABLE 278 UNITED ARAB EMIRATES PAINT FURNISHING IN VOLATILE ORGANIC COMPOUND (VOC) CONCENTRATOR MARKET, BY APPLICATION, 2018-2032 (USD THOUSAND)
TABLE 279 UNITED ARAB EMIRATES AEROSPACE MANUFACTURING IN VOLATILE ORGANIC COMPOUND (VOC) CONCENTRATOR MARKET, BY APPLICATION, 2018-2032 (USD THOUSAND)
TABLE 280 UNITED ARAB EMIRATES PHARMACEUTICAL MANUFACTURING IN VOLATILE ORGANIC COMPOUND (VOC) CONCENTRATOR MARKET, BY APPLICATION, 2018-2032 (USD THOUSAND)
TABLE 281 UNITED ARAB EMIRATES CHEMICAL PROCESSING IN VOLATILE ORGANIC COMPOUND (VOC) CONCENTRATOR MARKET, BY APPLICATION, 2018-2032 (USD THOUSAND)
TABLE 282 SOUTH AFRICA VOLATILE ORGANIC COMPOUND (VOC) CONCENTRATOR MARKET, BY ABSORBENT, 2018-2032 (USD THOUSAND)
TABLE 283 SOUTH AFRICA VOLATILE ORGANIC COMPOUND (VOC) CONCENTRATOR MARKET, BY ABSORBENT, 2018-2032 (THOUSAND UNITS)
TABLE 284 SOUTH AFRICA VOLATILE ORGANIC COMPOUND (VOC) CONCENTRATOR MARKET, BY PROCESS TYPE, 2018-2032 (USD THOUSAND)
TABLE 285 SOUTH AFRICA VOLATILE ORGANIC COMPOUND (VOC) CONCENTRATOR MARKET, BY APPLICATION, 2018-2032 (USD THOUSAND)
TABLE 286 SOUTH AFRICA PAINT FURNISHING IN VOLATILE ORGANIC COMPOUND (VOC) CONCENTRATOR MARKET, BY APPLICATION, 2018-2032 (USD THOUSAND)
TABLE 287 SOUTH AFRICA AEROSPACE MANUFACTURING IN VOLATILE ORGANIC COMPOUND (VOC) CONCENTRATOR MARKET, BY APPLICATION, 2018-2032 (USD THOUSAND)
TABLE 288 SOUTH AFRICA PHARMACEUTICAL MANUFACTURING IN VOLATILE ORGANIC COMPOUND (VOC) CONCENTRATOR MARKET, BY APPLICATION, 2018-2032 (USD THOUSAND)
TABLE 289 SOUTH AFRICA CHEMICAL PROCESSING IN VOLATILE ORGANIC COMPOUND (VOC) CONCENTRATOR MARKET, BY APPLICATION, 2018-2032 (USD THOUSAND)
TABLE 290 EGYPT VOLATILE ORGANIC COMPOUND (VOC) CONCENTRATOR MARKET, BY ABSORBENT, 2018-2032 (USD THOUSAND)
TABLE 291 EGYPT VOLATILE ORGANIC COMPOUND (VOC) CONCENTRATOR MARKET, BY ABSORBENT, 2018-2032 (THOUSAND UNITS)
TABLE 292 EGYPT VOLATILE ORGANIC COMPOUND (VOC) CONCENTRATOR MARKET, BY PROCESS TYPE, 2018-2032 (USD THOUSAND)
TABLE 293 EGYPT VOLATILE ORGANIC COMPOUND (VOC) CONCENTRATOR MARKET, BY APPLICATION, 2018-2032 (USD THOUSAND)
TABLE 294 EGYPT PAINT FURNISHING IN VOLATILE ORGANIC COMPOUND (VOC) CONCENTRATOR MARKET, BY APPLICATION, 2018-2032 (USD THOUSAND)
TABLE 295 EGYPT AEROSPACE MANUFACTURING IN VOLATILE ORGANIC COMPOUND (VOC) CONCENTRATOR MARKET, BY APPLICATION, 2018-2032 (USD THOUSAND)
TABLE 296 EGYPT PHARMACEUTICAL MANUFACTURING IN VOLATILE ORGANIC COMPOUND (VOC) CONCENTRATOR MARKET, BY APPLICATION, 2018-2032 (USD THOUSAND)
TABLE 297 EGYPT CHEMICAL PROCESSING IN VOLATILE ORGANIC COMPOUND (VOC) CONCENTRATOR MARKET, BY APPLICATION, 2018-2032 (USD THOUSAND)
TABLE 298 ISRAEL VOLATILE ORGANIC COMPOUND (VOC) CONCENTRATOR MARKET, BY ABSORBENT, 2018-2032 (USD THOUSAND)
TABLE 299 ISRAEL VOLATILE ORGANIC COMPOUND (VOC) CONCENTRATOR MARKET, BY ABSORBENT, 2018-2032 (THOUSAND UNITS)
TABLE 300 ISRAEL VOLATILE ORGANIC COMPOUND (VOC) CONCENTRATOR MARKET, BY PROCESS TYPE, 2018-2032 (USD THOUSAND)
TABLE 301 ISRAEL VOLATILE ORGANIC COMPOUND (VOC) CONCENTRATOR MARKET, BY APPLICATION, 2018-2032 (USD THOUSAND)
TABLE 302 ISRAEL PAINT FURNISHING IN VOLATILE ORGANIC COMPOUND (VOC) CONCENTRATOR MARKET, BY APPLICATION, 2018-2032 (USD THOUSAND)
TABLE 303 ISRAEL AEROSPACE MANUFACTURING IN VOLATILE ORGANIC COMPOUND (VOC) CONCENTRATOR MARKET, BY APPLICATION, 2018-2032 (USD THOUSAND)
TABLE 304 ISRAEL PHARMACEUTICAL MANUFACTURING IN VOLATILE ORGANIC COMPOUND (VOC) CONCENTRATOR MARKET, BY APPLICATION, 2018-2032 (USD THOUSAND)
TABLE 305 ISRAEL CHEMICAL PROCESSING IN VOLATILE ORGANIC COMPOUND (VOC) CONCENTRATOR MARKET, BY APPLICATION, 2018-2032 (USD THOUSAND)
TABLE 306 REST OF MIDDLE EAST AND AFRICA VOLATILE ORGANIC COMPOUND (VOC) CONCENTRATOR MARKET, BY ABSORBENT, 2018-2032 (USD THOUSAND)
TABLE 307 REST OF MIDDLE EAST AND AFRICA VOLATILE ORGANIC COMPOUND (VOC) CONCENTRATOR MARKET, BY ABSORBENT, 2018-2032 (THOUSAND UNITS)
TABLE 308 SOUTH AMERICA VOLATILE ORGANIC COMPOUND (VOC) CONCENTRATOR MARKET, BY COUNTRY, 2018-2032 (USD THOUSAND)
TABLE 309 SOUTH AMERICA VOLATILE ORGANIC COMPOUND (VOC) CONCENTRATOR MARKET, BY COUNTRY, 2018-2032 (THOUSAND UNITS)
TABLE 310 SOUTH AMERICA VOLATILE ORGANIC COMPOUND (VOC) CONCENTRATOR MARKET, BY ABSORBENT, 2018-2032 (USD THOUSAND)
TABLE 311 SOUTH AMERICA VOLATILE ORGANIC COMPOUND (VOC) CONCENTRATOR MARKET, BY ABSORBENT, 2018-2032 (THOUSAND UNITS)
TABLE 312 SOUTH AMERICA VOLATILE ORGANIC COMPOUND (VOC) CONCENTRATOR MARKET, BY PROCESS TYPE, 2018-2032 (USD THOUSAND)
TABLE 313 SOUTH AMERICA VOLATILE ORGANIC COMPOUND (VOC) CONCENTRATOR MARKET, BY APPLICATION, 2018-2032 (USD THOUSAND)
TABLE 314 SOUTH AMERICA PAINT FURNISHING IN VOLATILE ORGANIC COMPOUND (VOC) CONCENTRATOR MARKET, BY APPLICATION, 2018-2032 (USD THOUSAND)
TABLE 315 SOUTH AMERICA AEROSPACE MANUFACTURING IN VOLATILE ORGANIC COMPOUND (VOC) CONCENTRATOR MARKET, BY APPLICATION, 2018-2032 (USD THOUSAND)
TABLE 316 SOUTH AMERICA PHARMACEUTICAL MANUFACTURING IN VOLATILE ORGANIC COMPOUND (VOC) CONCENTRATOR MARKET, BY APPLICATION, 2018-2032 (USD THOUSAND)
TABLE 317 SOUTH AMERICA CHEMICAL PROCESSING IN VOLATILE ORGANIC COMPOUND (VOC) CONCENTRATOR MARKET, BY APPLICATION, 2018-2032 (USD THOUSAND)
TABLE 318 BRAZIL VOLATILE ORGANIC COMPOUND (VOC) CONCENTRATOR MARKET, BY ABSORBENT, 2018-2032 (USD THOUSAND)
TABLE 319 BRAZIL VOLATILE ORGANIC COMPOUND (VOC) CONCENTRATOR MARKET, BY ABSORBENT, 2018-2032 (THOUSAND UNITS)
TABLE 320 BRAZIL VOLATILE ORGANIC COMPOUND (VOC) CONCENTRATOR MARKET, BY PROCESS TYPE, 2018-2032 (USD THOUSAND)
TABLE 321 BRAZIL VOLATILE ORGANIC COMPOUND (VOC) CONCENTRATOR MARKET, BY APPLICATION, 2018-2032 (USD THOUSAND)
TABLE 322 BRAZIL PAINT FURNISHING IN VOLATILE ORGANIC COMPOUND (VOC) CONCENTRATOR MARKET, BY APPLICATION, 2018-2032 (USD THOUSAND)
TABLE 323 BRAZIL AEROSPACE MANUFACTURING IN VOLATILE ORGANIC COMPOUND (VOC) CONCENTRATOR MARKET, BY APPLICATION, 2018-2032 (USD THOUSAND)
TABLE 324 BRAZIL PHARMACEUTICAL MANUFACTURING IN VOLATILE ORGANIC COMPOUND (VOC) CONCENTRATOR MARKET, BY APPLICATION, 2018-2032 (USD THOUSAND)
TABLE 325 BRAZIL CHEMICAL PROCESSING IN VOLATILE ORGANIC COMPOUND (VOC) CONCENTRATOR MARKET, BY APPLICATION, 2018-2032 (USD THOUSAND)
TABLE 326 ARGENTINA VOLATILE ORGANIC COMPOUND (VOC) CONCENTRATOR MARKET, BY ABSORBENT, 2018-2032 (USD THOUSAND)
TABLE 327 ARGENTINA VOLATILE ORGANIC COMPOUND (VOC) CONCENTRATOR MARKET, BY ABSORBENT, 2018-2032 (THOUSAND UNITS)
TABLE 328 ARGENTINA VOLATILE ORGANIC COMPOUND (VOC) CONCENTRATOR MARKET, BY PROCESS TYPE, 2018-2032 (USD THOUSAND)
TABLE 329 ARGENTINA VOLATILE ORGANIC COMPOUND (VOC) CONCENTRATOR MARKET, BY APPLICATION, 2018-2032 (USD THOUSAND)
TABLE 330 ARGENTINA PAINT FURNISHING IN VOLATILE ORGANIC COMPOUND (VOC) CONCENTRATOR MARKET, BY APPLICATION, 2018-2032 (USD THOUSAND)
TABLE 331 ARGENTINA AEROSPACE MANUFACTURING IN VOLATILE ORGANIC COMPOUND (VOC) CONCENTRATOR MARKET, BY APPLICATION, 2018-2032 (USD THOUSAND)
TABLE 332 ARGENTINA PHARMACEUTICAL MANUFACTURING IN VOLATILE ORGANIC COMPOUND (VOC) CONCENTRATOR MARKET, BY APPLICATION, 2018-2032 (USD THOUSAND)
TABLE 333 ARGENTINA CHEMICAL PROCESSING IN VOLATILE ORGANIC COMPOUND (VOC) CONCENTRATOR MARKET, BY APPLICATION, 2018-2032 (USD THOUSAND)
TABLE 334 REST OF SOUTH AMERICA VOLATILE ORGANIC COMPOUND (VOC) CONCENTRATOR MARKET, BY ABSORBENT, 2018-2032 (USD THOUSAND)
TABLE 335 REST OF SOUTH AMERICA VOLATILE ORGANIC COMPOUND (VOC) CONCENTRATOR MARKET, BY ABSORBENT, 2018-2032 (THOUSAND UNITS)
List of Figure
FIGURE 1 GLOBAL VOLATILE ORGANIC COMPOUND (VOC) CONCENTRATOR MARKET
FIGURE 2 GLOBAL VOLATILE ORGANIC COMPOUND (VOC) CONCENTRATOR MARKET: DATA TRIANGULATION
FIGURE 3 GLOBAL VOLATILE ORGANIC COMPOUND (VOC) CONCENTRATOR: DROC ANALYSIS
FIGURE 4 GLOBAL VOLATILE ORGANIC COMPOUND (VOC) CONCENTRATOR: REGIONAL MARKET ANALYSIS
FIGURE 5 GLOBAL VOLATILE ORGANIC COMPOUND (VOC) CONCENTRATOR: COMPANY RESEARCH ANALYSIS
FIGURE 6 GLOBAL VOLATILE ORGANIC COMPOUND (VOC) CONCENTRATOR: MULTIVARIATE MODELLING
FIGURE 7 GLOBAL VOLATILE ORGANIC COMPOUND (VOC) CONCENTRATOR: INTERVIEW DEMOGRAPHICS
FIGURE 8 GLOBAL VOLATILE ORGANIC COMPOUND (VOC) CONCENTRATOR MARKET: DBMR MARKET POSITION GRID
FIGURE 9 GLOBAL VOLATILE ORGANIC COMPOUND (VOC) CONCENTRATOR MARKET: VENDOR SHARE ANALYSIS
FIGURE 10 GLOBAL VOLATILE ORGANIC COMPOUND (VOC) CONCENTRATOR MARKET: SEGMENTATION
FIGURE 11 THREE SEGMENTS COMPRISE THE GLOBAL VOLATILE ORGANIC COMPOUND (VOC) CONCENTRATOR MARKET, BY ABSORBENT
FIGURE 12 EXECUTIVE SUMMARY
FIGURE 13 STRATEGIC DECISIONS
FIGURE 14 RISING ENVIRONMENTAL REGULATIONS ON VOC EMISSIONS IS EXPECTED TO DRIVE THE GLOBAL VOLATILE ORGANIC COMPOUND (VOC) CONCENTRATOR MARKET IN THE FORECAST PERIOD (2025-2032)
FIGURE 15 THE ZEOLITE -BASED VOC CONCENTRATORS SEGMENT IS EXPECTED TO ACCOUNT FOR THE LARGEST SHARE OF THE GLOBAL VOLATILE ORGANIC COMPOUND (VOC) CONCENTRATOR MARKET IN 2025 AND 2032
FIGURE 16 NORTH AMERICA IS EXPECTED TO DOMINATE THE GLOBAL VOLATILE ORGANIC COMPOUND (VOC) CONCENTRATOR MARKET, AND GROW WITH THE HIGHEST CAGR IN THE FORECAST PERIOD
FIGURE 17 ASIA-PACIFIC IS THE FASTEST-GROWING MARKET FOR VOLATILE ORGANIC COMPOUND (VOC) CONCENTRATOR MARKET IN THE FORECAST PERIOD
FIGURE 18 PESTEL ANALYSIS
FIGURE 19 PORTER’S FIVE FORCES ANALYSIS
FIGURE 20 IMPORT EXPORT SCENARIO (USD THOUSAND)
FIGURE 21 VENDOR SELECTION CRITERIA
FIGURE 22 PRODUCTION CONSUMPTION ANALYSIS: U.S. & MEXICO STAINLESS STEEL PROTECTION FILM MARKET
FIGURE 23 DRIVERS, RESTRAINTS, OPPORTUNITIES AND CHALLENGES OF GLOBAL CODING AND MARKING SYSTEMS MARKET
FIGURE 24 GLOBAL VOLATILE ORGANIC COMPOUND (VOC) CONCENTRATOR MARKET : BY ABSORBENT , 2024
FIGURE 25 GLOBAL VOLATILE ORGANIC COMPOUND (VOC) CONCENTRATOR MARKET : BY PROCESS TYPE, 2024
FIGURE 26 GLOBAL VOLATILE ORGANIC COMPOUND (VOC) CONCENTRATOR MARKET : BY APPLICATION, 2024
FIGURE 27 GLOBAL VOLATILE ORGANIC COMPOUND (VOC) CONCENTRATOR MARKET: SNAPSHOT (2024)
FIGURE 28 NORTH AMERICA VOLATILE ORGANIC COMPOUND (VOC) CONCENTRATOR MARKET: SNAPSHOT (2024)
FIGURE 29 ASIA-PACIFIC VOLATILE ORGANIC COMPOUND (VOC) CONCENTRATOR MARKET: SNAPSHOT (2024)
FIGURE 30 EUROPE VOLATILE ORGANIC COMPOUND (VOC) CONCENTRATOR MARKET: SNAPSHOT (2024)
FIGURE 31 MIDDLE EAST AND AFRICA VOLATILE ORGANIC COMPOUND (VOC) CONCENTRATOR MARKET: SNAPSHOT (2024)
FIGURE 32 SOUTH AMERICA VOLATILE ORGANIC COMPOUND (VOC) CONCENTRATOR MARKET: SNAPSHOT (2024)
FIGURE 33 GLOBAL VOLATILE ORGANIC COMPOUND (VOC) CONCENTRATOR MARKET: COMPANY SHARE 2024 (%)
FIGURE 34 ASIA-PACIFC VOLATILE ORGANIC COMPOUND (VOC) CONCENTRATOR MARKET: COMPANY SHARE 2024 (%)
FIGURE 35 EUROPE VOLATILE ORGANIC COMPOUND (VOC) CONCENTRATOR MARKET: COMPANY SHARE 2024 (%)
FIGURE 36 NORTH AMERICA VOLATILE ORGANIC COMPOUND (VOC) CONCENTRATOR MARKET: COMPANY SHARE 2024 (%)
Global Volatile Organic Compounds Concentrator Voc Concentrator Market, Supply Chain Analysis and Ecosystem Framework
To support market growth and help clients navigate the impact of geopolitical shifts, DBMR has integrated in-depth supply chain analysis into its Global Volatile Organic Compounds Concentrator Voc Concentrator Market research reports. This addition empowers clients to respond effectively to global changes affecting their industries. The supply chain analysis section includes detailed insights such as Global Volatile Organic Compounds Concentrator Voc Concentrator Market consumption and production by country, price trend analysis, the impact of tariffs and geopolitical developments, and import and export trends by country and HSN code. It also highlights major suppliers with data on production capacity and company profiles, as well as key importers and exporters. In addition to research, DBMR offers specialized supply chain consulting services backed by over a decade of experience, providing solutions like supplier discovery, supplier risk assessment, price trend analysis, impact evaluation of inflation and trade route changes, and comprehensive market trend analysis.
Data collection and base year analysis are done using data collection modules with large sample sizes. The stage includes obtaining market information or related data through various sources and strategies. It includes examining and planning all the data acquired from the past in advance. It likewise envelops the examination of information inconsistencies seen across different information sources. The market data is analysed and estimated using market statistical and coherent models. Also, market share analysis and key trend analysis are the major success factors in the market report. To know more, please request an analyst call or drop down your inquiry.
The key research methodology used by DBMR research team is data triangulation which involves data mining, analysis of the impact of data variables on the market and primary (industry expert) validation. Data models include Vendor Positioning Grid, Market Time Line Analysis, Market Overview and Guide, Company Positioning Grid, Patent Analysis, Pricing Analysis, Company Market Share Analysis, Standards of Measurement, Global versus Regional and Vendor Share Analysis. To know more about the research methodology, drop in an inquiry to speak to our industry experts.
Data Bridge Market Research is a leader in advanced formative research. We take pride in servicing our existing and new customers with data and analysis that match and suits their goal. The report can be customized to include price trend analysis of target brands understanding the market for additional countries (ask for the list of countries), clinical trial results data, literature review, refurbished market and product base analysis. Market analysis of target competitors can be analyzed from technology-based analysis to market portfolio strategies. We can add as many competitors that you require data about in the format and data style you are looking for. Our team of analysts can also provide you data in crude raw excel files pivot tables (Fact book) or can assist you in creating presentations from the data sets available in the report.


